 Cheng Yang
 Lanxiang Zheng2
- 1College of Civil Engineering, North Minzu University, Yinchuan, Ningxia, China
- 2School of Ecology and Environment, Ningxia University, Yinchuan, Ningxia, China
- 3State Key Laboratory of Eco-hydraulic in Northwest Arid Region of China, Xi’an University of Technology, Xi’an, Shanxi, China
The Helan section of the third drainage ditch in Ningxia is selected as the research object, and its water environmental capacity is analyzed; The Daily discharge and water level are calculated according to the measured data; Then the daily concentration values of the main water quality indexes are simulated by one-dimensional hydrodynamic water quality mathematical model; Finally, the dynamic water environment capacity is calculated. The results show that from May to October 2020, the main water quality indicators exceeding the standard in Helan section of the third drainage ditch were total nitrogen and five-day biochemical oxygen demand. Their water environmental capacity was −11.8744 t and −67.1173 t, respectively. Chemical oxygen demand and total phosphorus exceeded the standard severely in some months. There are problems of eutrophication and high organic content in drainage ditches. The primary pollution sources are aquaculture wastewater form fishery, farmland drainage, seasonal flood, and domestic sewage. It is suggested to take preventive measures such as source control, process blocking, and end treatment.
Introduction
The rapid development of the economy and society has led to the aggravation of water pollution in many countries (Jiang, 2015; Haque, 2017; Noorhosseini et al., 2017). Water environmental capacity (WEC) is an essential index for the effective water quality management (Wang et al., 2021). The concept of WEC first appeared in the total maximum daily load management plan proposed by the United States in 1972 (Wu et al., 2021). It refers to the full amount of pollutants that can be accommodated in a particular water area under the limitation of target water quality (Sun et al., 2019; Wei et al., 2019). The estimation of WEC can quantify the total maximum allowable load and reasonably distribute it among different regions. It can coordinate social and economic development and marine environment protection (Jin et al., 2022). The research on water environmental capacity and total pollutant discharge control has become a hot topic (Huang et al., 2019). Scholars have done a lot of research on the calculation of WEC and established various calculation and evaluation methods. Such as the unascertained mathematical method (Chinh et al., 2017), multi-objective model (Li et al., 2016), geographic information system technology and water quality model (Li and Zou, 2015; Zhang et al., 2019; Dong et al., 2020). Among them, the water quality model has been widely used in WEC estimation, water pollution control, and management because it considers the hydrological and physical processes of pollutants (Yan et al., 2019; Feng et al., 2021). However, most existing studies only consider the water quality model and ignore the hydrological cycle (Ma et al., 2020). WEC is very sensitive to the change in hydrological elements and has prominent dynamic characteristics (Xie et al., 2014). Therefore, for the time scale of hydrological conditions, the smaller the time scale, the closer the calculated value of WEC is to the actual value. The runoff volume of small rivers in northern China is small and significantly affected by seasons. If a large time scale is adopted, the calculation results of WEC will be very conservative. Therefore, using dynamic hydrological conditions to study WEC is more in line with the actual situation.
After the ecological protection of the Yellow River Basin was proposed as a significant national strategy in 2019, ecological governance and high-quality development have become the main direction of the development of the Yellow River basin (Ma et al., 2022). As a typical region in the upper reaches of the Yellow River, the water quality of Ningxia is excellent significance to Ningxia and its lower reaches. In recent decades, due to the economic development, the increase in pollutant emissions, and the lack of governance capacity, the water environment pollution in Ningxia has been aggravated, and the high-quality development of the region has also been affected (Chen et al., 2020; Zhu et al., 2020; Zhang et al., 2021). There are 16 main drainage ditches into the Yellow River in Ningxia. They collect industrial, agricultural, and domestic sewage along the way and discharge it directly into the Yellow River. It has a significant impact on the water quality of the Ningxia section of the Yellow River. Among them, the third drainage ditch in Ningxia is located in the Yinbei irrigation district, which has the longest ditch line and the largest drainage area. According to the monthly report of surface Water Environmental Quality in Ningxia in 2021, the water quality of the third drainage ditch is Class IV, Class V, or even worse than Class V. This shows that the water in the third drainage ditch does not meet the standard requirements of the water discharged into the Yellow River. Therefore, it is necessary to analyze the water quality of the third drainage ditch and calculate its WEC, which can effectively guide the pollution control of the drainage ditch. In recent years, some scholars have researched on the WEC of rivers and lakes in Ningxia (Qiu et al., 2015; Kai et al., 2020; Ma et al., 2022). However, there is no study on dynamic water environmental capacity.
This paper takes the third drainage ditch in Helan County as the research area. Based on the measured data, the daily hydrological conditions are calculated by interpolation. Then, the one-dimensional hydrodynamic water quality mathematical model is used to predict the concentration of each water quality index. Finally, the formula method is used to calculate the dynamic WEC of the study area, which provides essential technical support for the water pollution control of the third drainage ditch. The research process is shown in Figure 1.
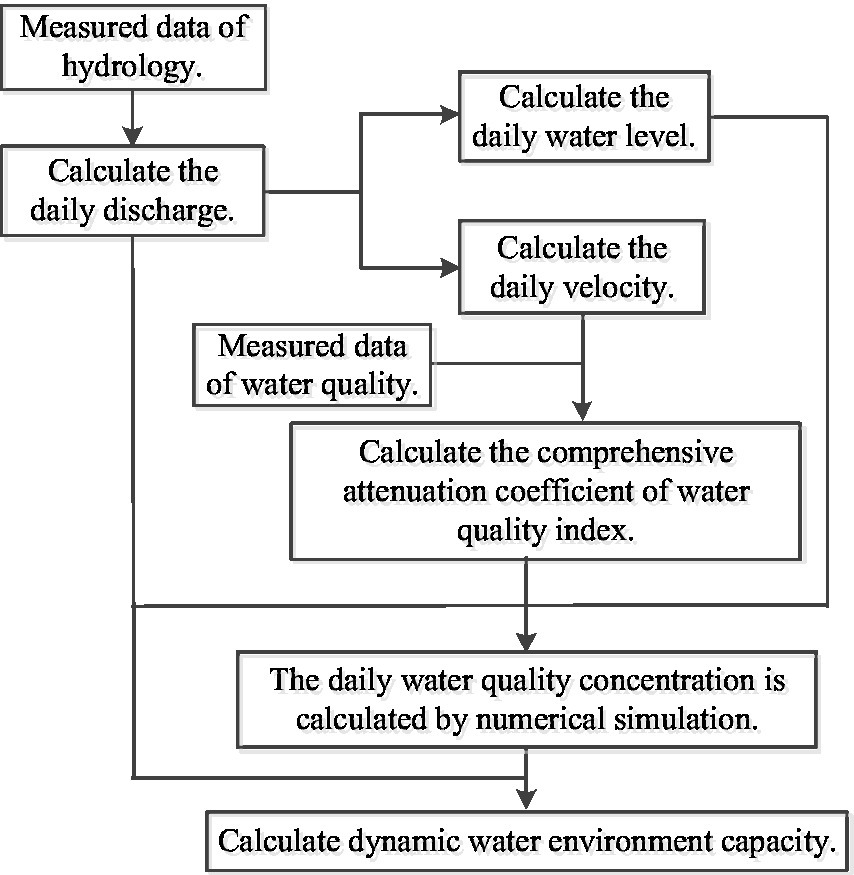
Figure 1. Flow chart of dynamic WEC calculation.
Overview of the study area
The third drainage ditch in Ningxia starts from Tuanjie Ditch in Helan County, flows through Changxin Township in Helan County and Xidatan in Pingluo County, and joins the fifth drainage ditch in Shizuishan City before entering the Yellow River. According to the administrative region, the third drainage ditch is divided into the Helan County section, the Pingluo county section, and the Huinong district section. The Helan section of the third drainage ditch starts from Wuqu village to Gaorong village, with a total length of 14.75 km and a drainage area of 106,900 mu. Its geographical location is shown in Figure 2.
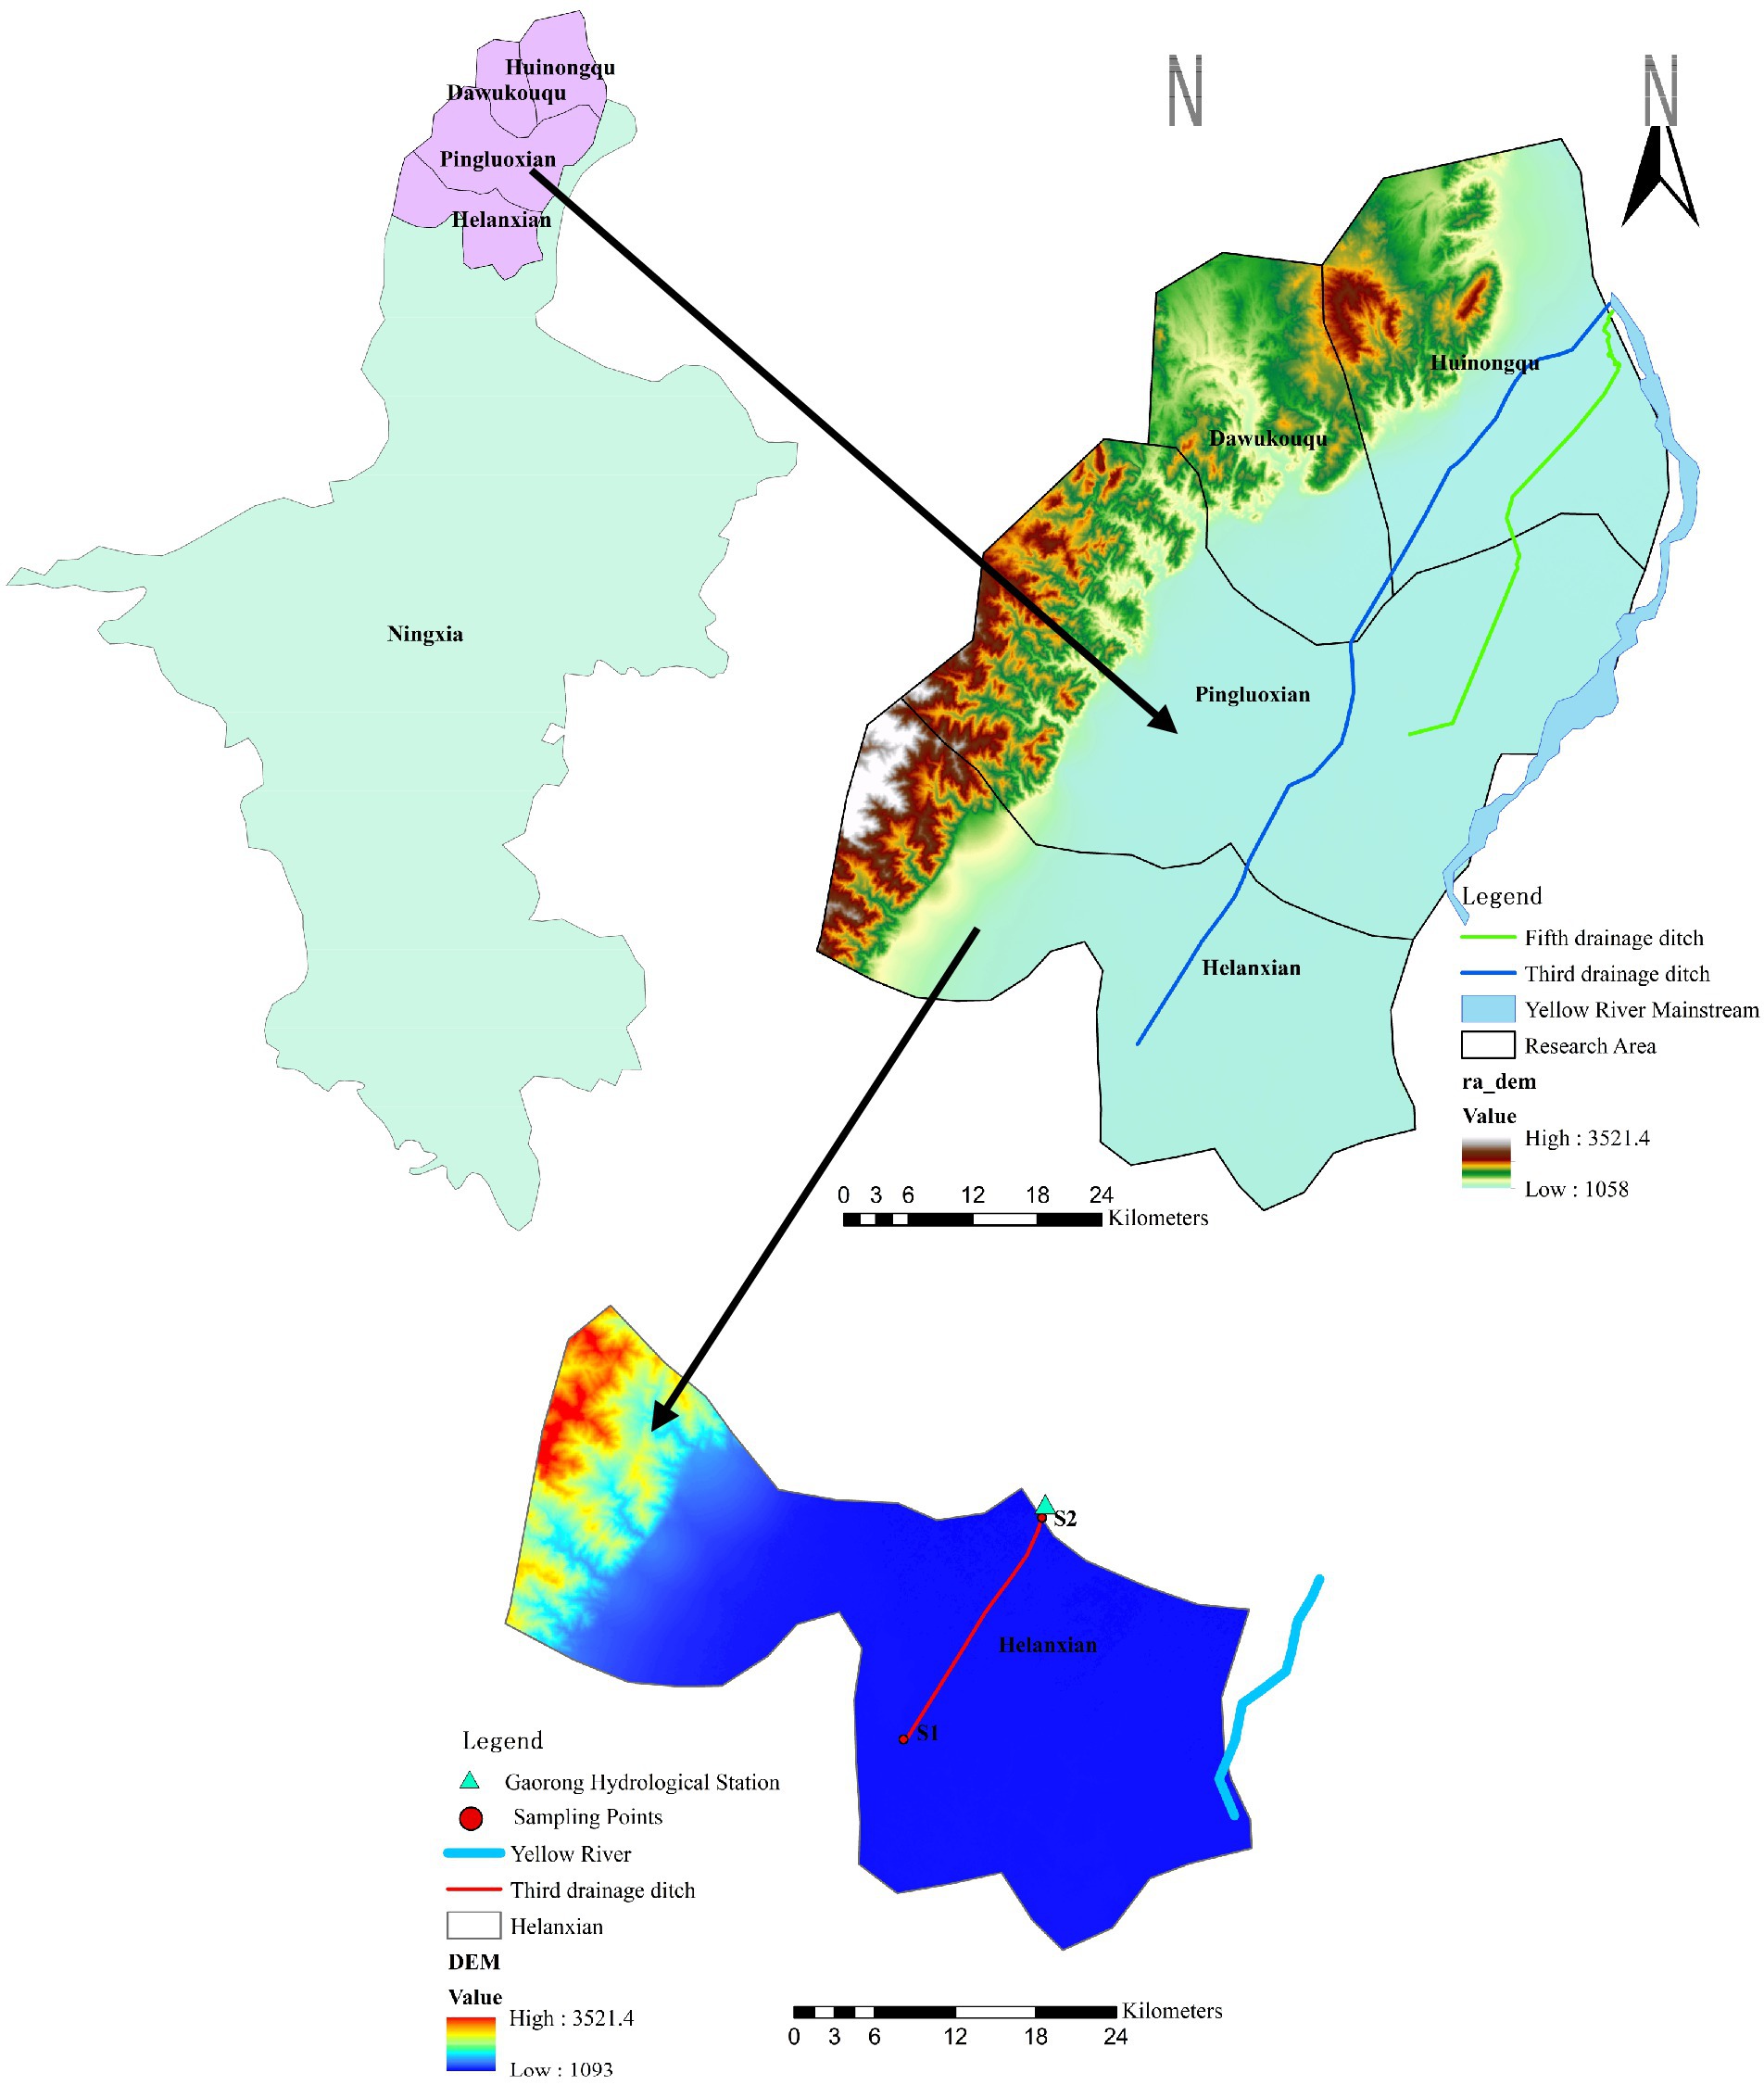
Figure 2. Study area diagram.
The water quality in the Helan County section of the third drainage ditch is poor, with prominent siltation and eutrophication (Table 1). Mountain torrents in summer, fisheries and aquaculture wastewater in spring and autumn, farmland drainage, and a small amount of rural sewage along the line into the drainage ditch. Sewage discharge is concentrated from May to October, and the icing period is from November to March following year.
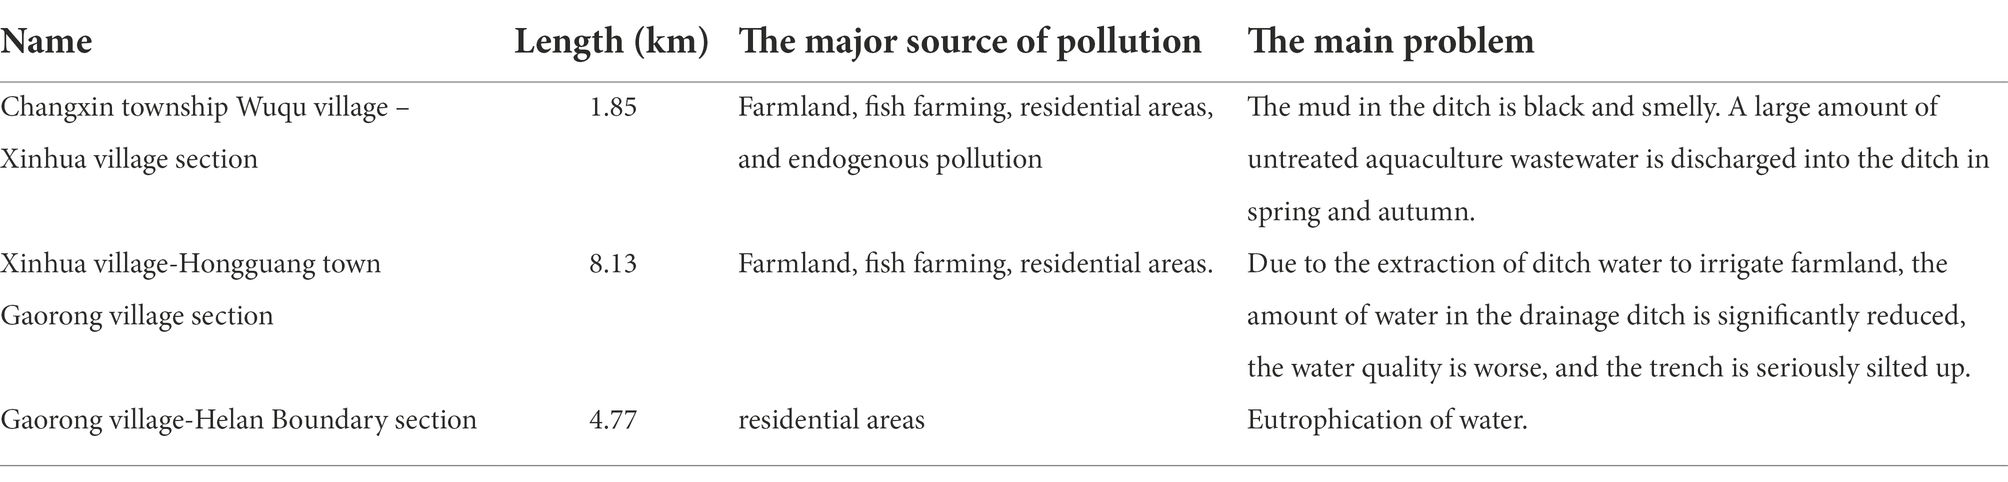
Table 1. Basic situation of the Helan County section of the third drainage ditch.
Research methods
One-dimensional hydrodynamic water quality mathematical model
The one-dimensional hydrodynamic and water quality coupled mathematical model includes a continuity equation, momentum equation, and pollutant diffusion equation, and the equations are as follows (Sun et al., 2018):
is discharge, is the distance from the inlet section, is the area of wetted cross-section, is time, is lateral incoming (outgoing) flow (positive values are inflows), is momentum correction factor, is the acceleration due to gravity, is water level, is Chezy coefficient, is the hydraulic radius, is the concentration of the simulated substance, is average flow velocity of river section, is the longitudinal diffusion coefficient, is the attenuation coefficient of the simulated substance, is the concentration of pollutant sources.
The comprehensive attenuation coefficient of simulated substances is calculated according to Equation 4, where is the initial sectional simulated substance concentration (Wu et al., 2021).
Boundary conditions
Inlet boundary: set flow and the concentration of water quality indicators. The Daily discharge calculated from the measured data is used as the inlet flow. The measured data is used as the concentration of the inlet section.
Outlet boundary: the daily water level calculated from the measured data is used as the outlet water level.
Both sides of the channel are fixed, and have no slip.
Dynamic water environmental capacity model
Rivers and lakes in the north of China have extremely uneven annual water distribution and different hydrological conditions each month. Most of them have 3–5 months of icebound period, the water temperature drops, and the self-purification ability of the water body is weakened. As a result, the WEC of most northern waters is not a stable value in each period but constantly changes with the change in hydrological conditions (Ma et al., 2019). Therefore, using the dynamic WEC formula to calculate WEC is more in line with the actual situation. The calculation formulas of dynamic WEC based on the hydrodynamic water quality model are as follows (Sun et al., 2019):
is the WEC of control unit on day i, is the target water quality concentration of the control section on the control unit, and are the daily average concentration and a daily average discharge of pollutants at the control section on the day, respectively, is the total WEC, is the number of days.
Hydrology and water quality data
Hydrological data
There is a hydrographic station (namely Gaorong station) near the exit section of the study area (the junction of Helan County and Pingluo County), and the location is shown in Figure 2. Data were collected from Gaorong Station once or twice a month in 2020, including parameters such as discharge, water level, section area, water surface width, and average section velocity.
Water quality data
The project team collects water samples according to the Technical Guidance on Water Quality Sampling (HJ494-2009). The experimenter analyzes the water quality according to the relevant requirements of “Technical Specifications for Surface Water and Sewage Monitoring (HJ/T 91–2002)” and “Monitoring and Analysis Methods for Water and Wastewater (Fourth Edition Supplement).” The sampling sites are shown in Figure 2.
The sampling time is from May to October 2020, and the frequency is once a month. The water quality of the water sample is Class V, and inferior to Class V. Principal component analysis is used to analyze the primary water quality indexes. The main indexes are ammonia nitrogen, total nitrogen, total phosphorus, permanganate index, chemical oxygen demand, and five-day biochemical oxygen demand.
Results and analysis
Calculate daily hydrological data
Interpolation method was used to calculate daily hydrological data. The commonly used interpolation methods are linear interpolation and nonlinear interpolation. The linear interpolation method is simple, easy to operate, and will not appear “out of bounds” phenomenon, but the obtained curve is not smooth, and the accuracy is low. However, the curve obtained by the nonlinear interpolation method is smooth, but it will appear “out of bounds” phenomenon. The piecewise cubic Hermite interpolation is a simple and efficient interpolation method, which can effectively solve this problem. At present, it has been widely used in many fields, such as scientific data modeling and river bed reconstruction.
Calculate the daily traffic
It can be seen from Figure 3 that the curve obtained by linear interpolation is not smooth. The curve obtained by cubic spline interpolation has the phenomenon of “out of bounds,” and the discharge has some negative values. And the maximum discharge calculated in December exceeds two m3/s, which is obviously inconsistent with the reality. However, the curve obtained by piecewise cubic Hermite interpolation is not out of bounds, which has good smoothness and high accuracy. Therefore, the piecewise cubic Hermite interpolation method is selected to calculate the daily discharge.
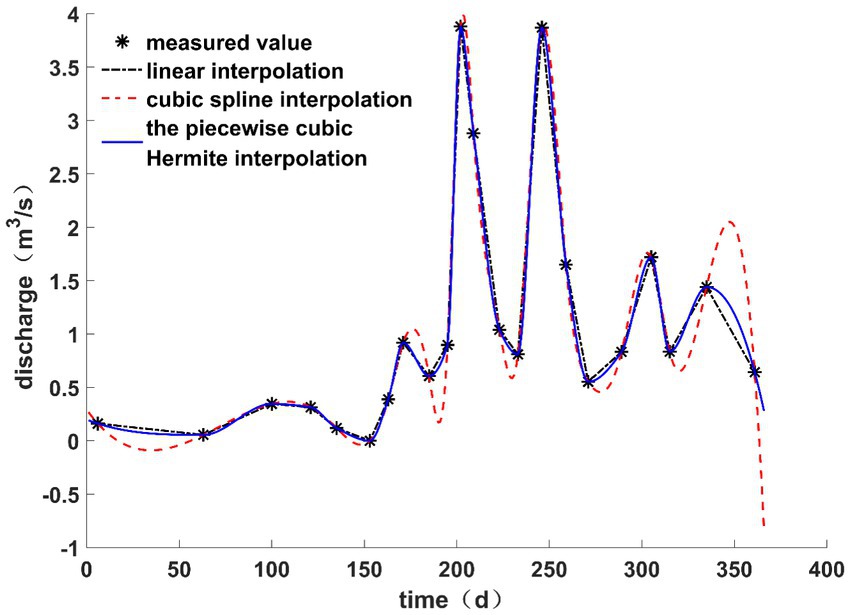
Figure 3. Comparison of three interpolation methods.
Calculate the daily water level
The relationship between water level and discharge is a typical nonlinear relationship. The relationship between water level and discharge of open channel is usually calculated as shown in empirical Equation 7 (Liu et al., 2020):
is water level, is discharge, are undetermined coefficients.
The relationship between water level and discharge calculated from measured data is: .
Calculate the comprehensive attenuation coefficient of simulated substances
Equation 4 was used to calculate the comprehensive attenuation coefficient of simulated substances from May to October, as shown in Table 2. The average velocity of the cross-section and the concentration of the water quality index are used in the calculation. Among them, the concentration of water quality index adopts the measured value. The daily average sectional velocity was calculated from the measured hydrological data and daily discharge.
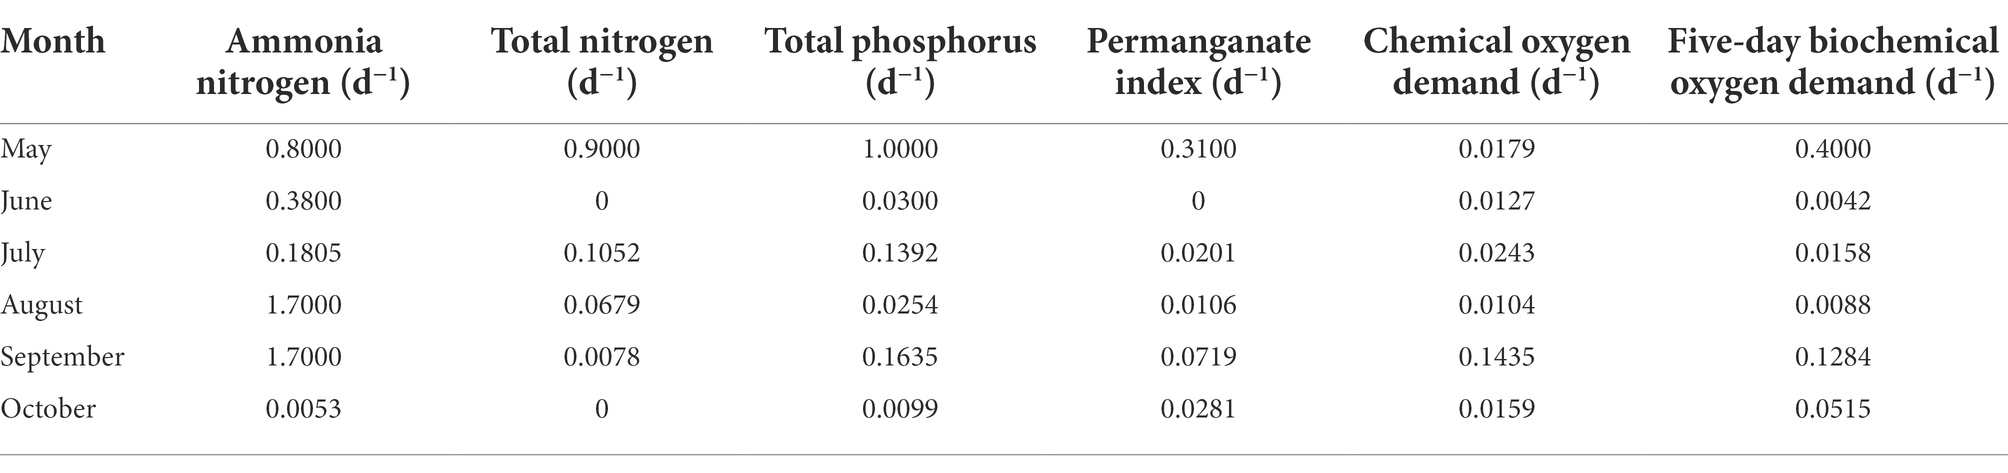
Table 2. Comprehensive attenuation coefficient values of simulated substances in the Helan section of the third drainage ditch in Ningxia.
Take the comprehensive attenuation coefficient of ammonia nitrogen in May in Table 2 as an example. Water samples were collected at the inlet and outlet on May 21. By substituting the measured concentration value and the velocity of the same day into Equation 4, the comprehensive attenuation coefficient of ammonia nitrogen can be calculated as 0.8. Therefore, the combined attenuation coefficient of ammonia nitrogen in May is 0.8.
Water quality simulation results and analysis
The time of water quality numerical simulation is from May 1 to October 31, 2020. Figure 4 shows the comparison between simulated and measured concentration values of water quality indicators at the outlet section. It can be seen from Figure 4 that the simulated values are relatively consistent with the measured values, indicating that the one-dimensional water quality mathematical model established is reliable.
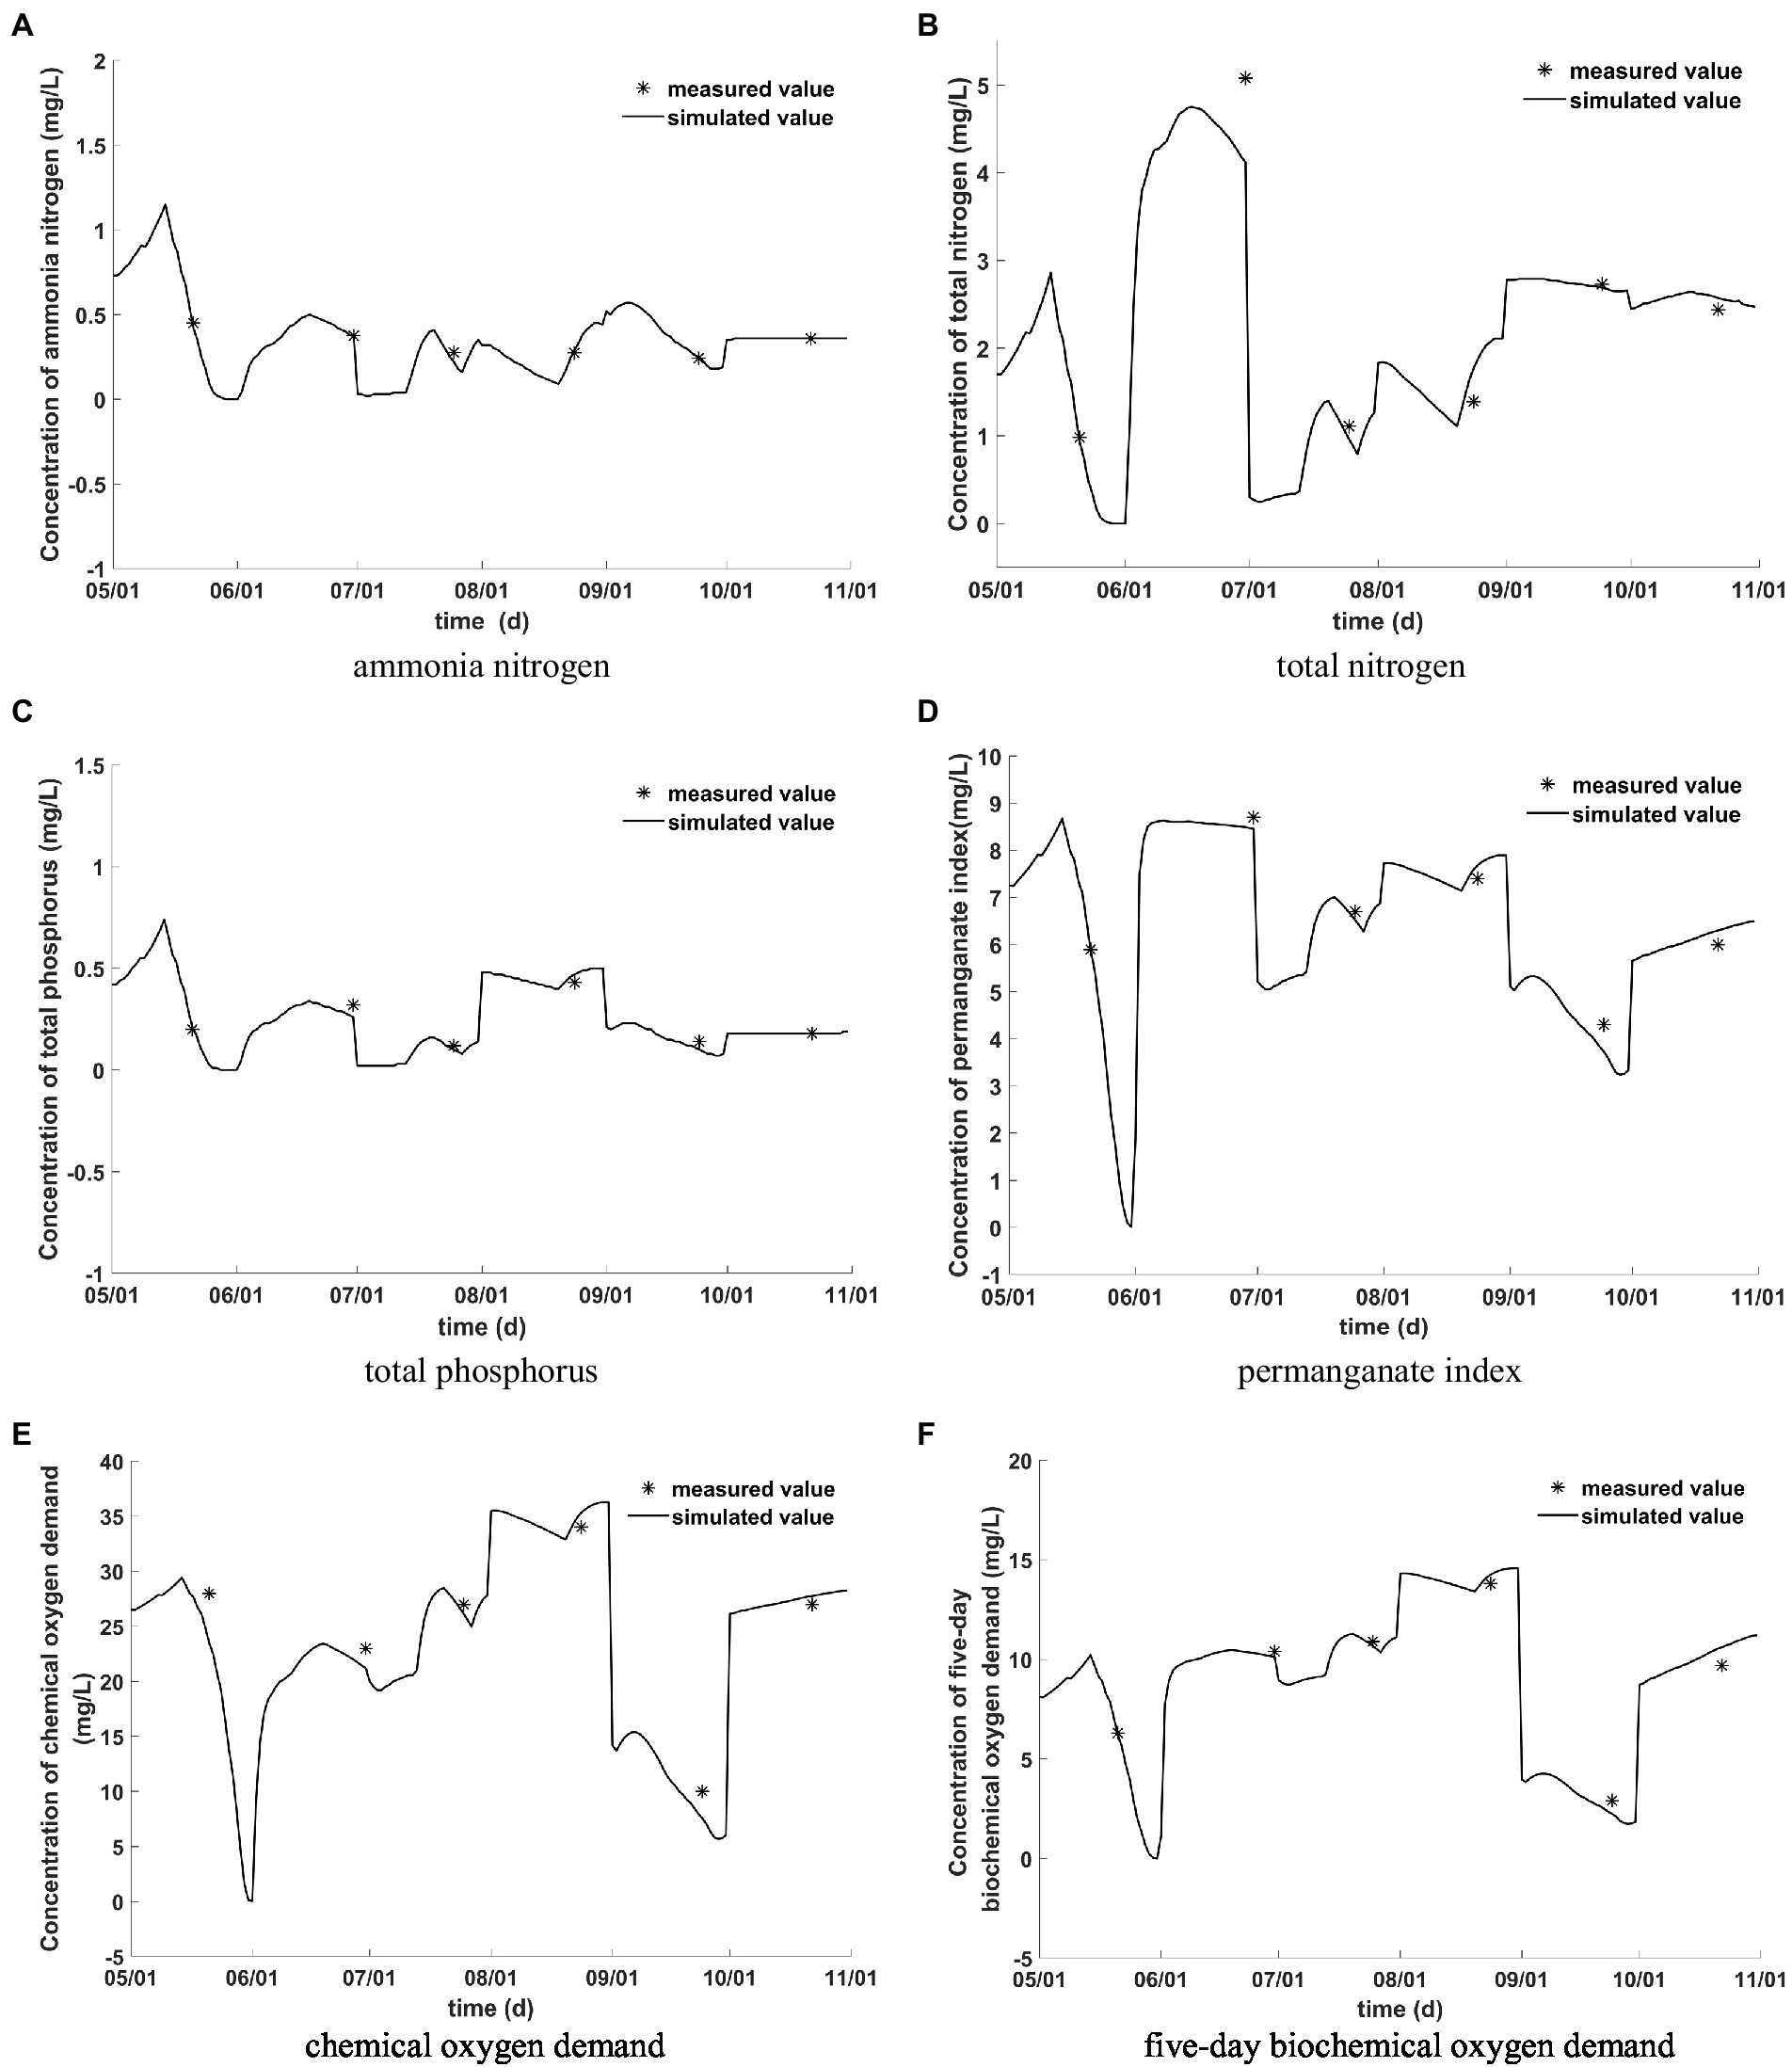
Figure 4. Comparison between simulated and measured values of water quality indicators. (A) Ammonia nitrogen. (B) Total nitrogen. (C) Total phosphorus. (D) Permanganate index. (E) Chemical oxygen demand. (F) five-day biochemical oxygen demand.
The Nash-Sutcliffe efficiency coefficient (NSE) is a normalized statistic that indicates the closeness of measured data and simulated data. NSE is calculated as shown in Equation 8 (Moriasi et al., 2007):
is the measured value of a substance at time i, is the simulation value of a substance at time i, is the mean of measured data of a substance.
The value of NSE ranges from to 1, including 1. NSE close to 1 indicates good quality and high reliability of the model. NSE close to 0 means that the simulation results are close to the average of the measured values, but the process simulation error is large. NSE is far less than 0, indicating that the simulation results are not credible.
The NSE of ammonia nitrogen, total nitrogen, total phosphorus, permanganate index, chemical oxygen demand, and five-day biochemical oxygen demand are 0.8544, 0.9069, 0.8982, 0.9476, 0.8998, and 0.9786, respectively. It shows that the one-dimensional hydrodynamic and water quality mathematical model established in this paper has good quality and high reliability.
Calculation results and analysis of water environmental capacity
As there are many sewage outlets and a large amount of sewage in the Pingluo section the downstream of Helan section, the water quality target of Shizuishan City’s drainage ditches into the Yellow River is required to be Class IV. Therefore, the water quality target of the exit section of the Helan Section is set as class IV, and the water quality index requirements are shown in Table 3.
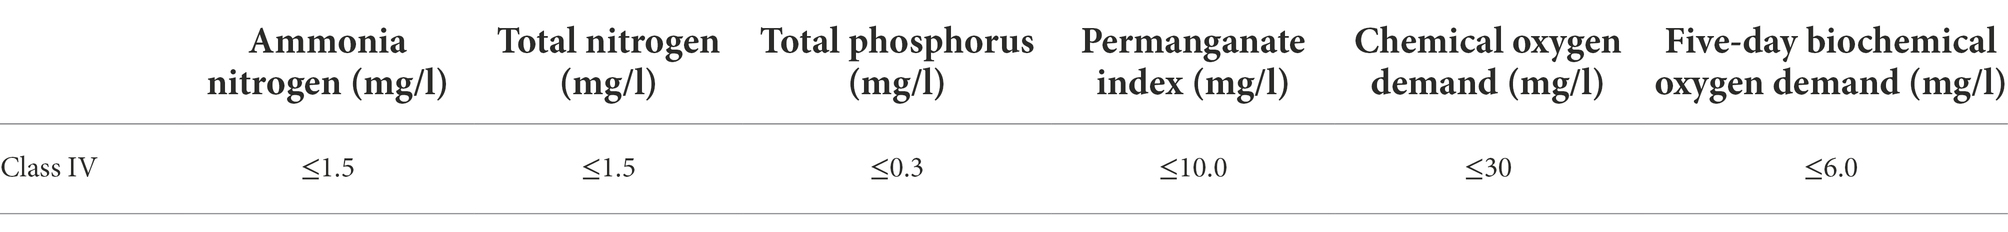
Table 3. Environmental quality standard for Surface water (GB3838-2002).
The daily WEC is calculated by Equations 5, 6, so the WEC for each month from May to October 2020 is obtained, as shown in Table 4. A negative value indicates no WEC margin for this water quality indicator.
1. The WEC surplus of ammonia nitrogen in July, August and September are large, followed by October and June, and the minimum is in May. Because in May, the local spring ploughing period produces a large amount of irrigation recession, which contains a large amount of ammonia nitrogen.
2. The maximum WEC margin of total nitrogen appeared in July, but it was seriously insufficient in June and September. Because these 2 months are the fastest growing seasons for local fish, the aquaculture wastewater of fishery discharge along the line is large. Besides July, the water environment capacity of total nitrogen in each month has no margin, which indicates that there is water eutrophication in the drainage ditch. This can also be confirmed by the variety of aquatic plants growing in the ditch.
3. The WEC of total phosphorus is negative only in May and August. Because there is a large amount of total phosphorus in the drainage water of farmland in May. August is the local rainy season, and the non-point sources of pollution brought by rainfall and the increase of domestic sewage along the route are the leading causes.
4. The WEC of chemical oxygen demand and biochemical oxygen demand for five-day appeared at the maximum margin in September. Combining Figures 4E,F, it can be seen that the concentration values of these two indicators are basically in a low period in September compared with other months.
5. In August, except for the WEC of ammonia nitrogen and permanganate index, there is no margin for other indicators, indicating that the water quality in this month is the worst. In particular, the chemical oxygen demand and five-day biochemical oxygen demand exceeded the standard seriously, indicating that the organic content in the drainage ditch was the highest in August.
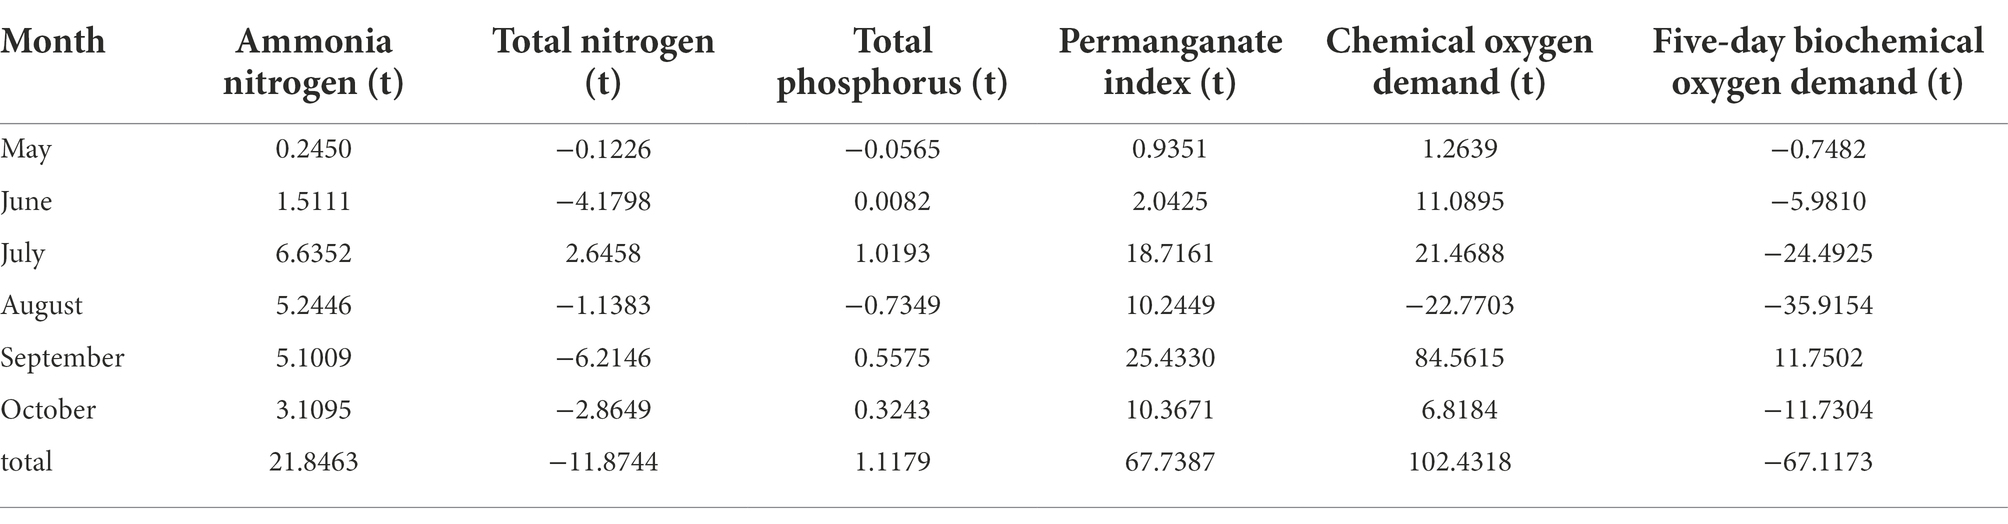
Table 4. Monthly water environment capacity of the study area.
Conclusion
This paper takes the Helan section of the third drainage ditch in Ningxia as the research object, and calculates the dynamic WEC from May to October 2020. The research shows that:
1. During the period from May to October 2020, the WEC of total nitrogen and five-day biochemical oxygen demand are both negative, which are −11.8744 t and −67.1173 t, respectively. Therefore, total nitrogen and five-day biochemical oxygen demand should be the leading pollution control indicators of Helan section of the third drainage ditch. The cause of this problem is the discharge of aquaculture wastewater of fishery and domestic sewage. Prevention and control measures should be taken to control the source, block the process and treat the end.
2. The WEC of chemical oxygen demand and total phosphorus are negative in some months, mainly due to farmland recession, non-point source pollution, and domestic sewage. It is suggested to explore from the watershed perspective and implement the best management measures for non-point source pollution. Pay attention to the development of green agriculture, establish an ecological agricultural system, and reduce chemical fertilizers and pesticides as much as possible.
3. Ammonia nitrogen and permanganate index have the allowance of WEC in each month, and the total allowance is 21.8463 and 67.7387, respectively. This indicates that these two indicators meet the requirements of environmental quality and do not require pollution control.
Data availability statement
The original contributions presented in the study are included in the article/supplementary material, further inquiries can be directed to the corresponding author.
Author contributions
CY contributed to all aspects of this work, wrote the manuscript text, and revised and finalized it. LZ conducted the experiment and analyzed the data. MF reviewed the manuscript, and revised and finalized it. ZZ participated in the data analysis section. All authors contributed to the article and approved the submitted version.
Funding
This work was supported by the National Natural Science Foundation of China (Grants No. 51679191 and 42267011), the Key research and development projects in Ningxia, China (Grant No. 2019BFG02032 and 2021BEG02012), the Key project of Natural Science Basic Research Plan of Shaanxi, China (Grant No. 2019JZ-42), and the General Research projects of North Minzu University (2021XYZTM04).
Acknowledgments
The authors thank the reviewers and editors for their careful reading and valuable suggestions and opinions, which helped to improve the manuscript.
Conflict of interest
The authors declare that the research was conducted in the absence of any commercial or financial relationships that could be construed as a potential conflict of interest.
Publisher’s note
All claims expressed in this article are solely those of the authors and do not necessarily represent those of their affiliated organizations, or those of the publisher, the editors and the reviewers. Any product that may be evaluated in this article, or claim that may be made by its manufacturer, is not guaranteed or endorsed by the publisher.
References
Chen, J., Qian, H., Gao, Y., Wang, H., and Zhang, M. (2020). Insights into hydrological and hydrochemical processes in response to water replenishment for lakes in arid regions. J. Hydrol. 581:124386. doi: 10.1016/j.jhydrol.2019.124386
Chinh, L. V., Hiramatsu, K., Harada, M., Cuu, N. T., and Lan, T. T. (2017). Estimation of water environment capacity in the Cau river basin, Vietnam using the Streeter-Phelps model. J. Fac. Agric. Kyushu Univ. 62, 163–169. doi: 10.5109/1801777
Dong, H., Chong, L., and Guo, C. (2020). Estimation and analysis of water environment capacity: a case study of huaxi watershed in Guizhou province. IOP Conf. Ser. Earth Environ. Sci. 525:012013. doi: 10.1088/1755-1315/525/1/012013
Feng, L., Li, Q., Zhang, L., Wang, H., Wang, W., Han, J., et al. (2021). Exploring the effect of floodgates operation systems on water environmental capacity in a regulated river network of Wuxi China. J. Clean. Prod. 299:126743. doi: 10.1016/j.jclepro.2021.126743
Haque, N. (2017). Exploratory analysis of fines for water pollution in Bangladesh. Water Resour. Ind. 18, 1–8. doi: 10.1016/j.wri.2017.05.001
Huang, J., Pang, Y., Zhang, X., and Tong, Y. (2019). Water environmental capacity calculation and allocation of the Taihu Lake Basin in Jiangsu Province based on control unit. Int. J. Environ. Res. Public Health 16:3774. doi: 10.3390/ijerph16193774
Jiang, Y. (2015). China’s water security: current status, emerging challenges and future prospects. Environ. Sci. Pol. 54, 106–125. doi: 10.1016/j.envsci.2015.06.006
Jin, H., Chen, W., Zhao, Z., Wang, J., and Ma, W. (2022). New framework for dynamic water environmental capacity estimation integrating the hydro-environmental model and load–duration curve method—a case study in data-scarce Luanhe river basin. Int. J. Environ. Res. Public Health 19:8389. doi: 10.3390/ijerph19148389
Kai, X., Qiu, X., Wang, Y., Zhang, W., and Yin, J. (2020). The water environment carrying capacity of the Aiyi river based on artificial neural networks. Pol. J. Environ. Stud. 29, 131–139. doi: 10.15244/pjoes/100669
Li, N., Yang, H., Wang, L., Huang, X., Zeng, C., Wu, H., et al. (2016). Optimization of industry structure based on water environmental carrying capacity under uncertainty of the Huai River basin within Shandong Province, China. J. Clean. Prod. 112, 4594–4604. doi: 10.1016/j.jclepro.2015.08.074
Li, R., and Zou, Z. (2015). Water environmental capacity analysis of Taihu Lake and parameter estimation based on the integration of the inverse method and Bayesian modeling. Int. J. Environ. Res. Publ. Health 12, 12212–12224. doi: 10.3390/ijerph121012212
Liu, D. L., Wu, W. Y., Xiao, J., and Niu, X. Y. (2020). Calibration and application of the relation curve between water level and discharge in channel. Yellow River 42(S1), 157–158. doi: 10.103969/j.issn.1000-1379.2020.S1.062
Ma, B., Dong, F., Peng, W. Q., Liu, X. B., Ding, Y., Huang, A. P., et al. (2020). Simulating the water environmental capacity of a seasonal river using a combined watershed-water quality model. Earth Space Sci. 7, 1–28. doi: 10.1029/2019ea001008
Ma, X. X., Li, C. Y., Shi, X. H., Zhao, S. N., Sun, B., Zhu, Y. H., et al. (2019). Environment capacity of the Wuliangsuhai lake. J. Irrig. Drain. 38, 105–112. doi: 10.13522/j.cnki.ggps.20180651
Ma, Y., Zhu, X., Peng, F., Pang, Q., Ni, L., Du, P., et al. (2022). Water pollution characteristics and control strategies in arid areas of Northwest China: a case study of Qingshui River basin in Ningxia. J. Environ. Eng. Technol. 12, 1369–1377. doi: 10.12153/j.issn.1674-991X.20210323
Moriasi, D. N., Arnold, J. G., Van Liew, M. W., Bingner, R. L., Harmel, R. D., Veith, T. L., et al. (2007). Model evaluation guidelines for systematic quantification of accuracy in watershed simulations. Transact. ASABE 50, 885–900. doi: 10.13031/2013.23153
Noorhosseini, S. A., Allahyari, M. S., Damalas, C. A., and Moghaddam, S. S. (2017). Public environmental awareness of water pollution from urban growth: the case of Zarjub and Goharrud rivers in Rasht. Iran. Sci. Total Environ. 599-600, 2019–2025. doi: 10.1016/j.scitotenv.2017.05.128
Qiu, X., Zhao, H., Yin, J., and Zhang, W. (2015). Study on the water environmental capacity and the water self-purification ability of Aiyi river. Yellow River 37, 87–90. doi: 10.3969/j.issn.1000-1379.2015.01.022
Sun, D., Cheng, Y., and Feng, P. (2019). Study on dynamic water environmental capacity of mainstream of Haihe River in flood season. J. Hydraul. Eng. 50, 1454–1466. doi: 10.13243/j.cnki.slxb.20190354
Sun, D., Xu, S., Jin, X., Feng, P., and Chang, C. (2018). Water flow regulation and scheme optimization in the Haihe River. Environ. Eng. Sci. 35, 627–644. doi: 10.1089/ees.2017.0130
Wang, X., Li, R., Tian, T., and Liu, C. (2021). Watershed-scale water environmental capacity estimation assisted by machine learning. J. Hydro. 597:126310. doi: 10.1016/j.jhydrol.2021.126310
Wei, X., Wang, J., Wu, S., Xin, X., Wang, Z., and Liu, W. (2019). Comprehensive evaluation model for water environment carrying capacity based on VPOSRM framework: a case study in Wuhan, China. Sustain. Cities Soc. 50:101640. doi: 10.1016/j.scs.2019.101640
Wu, L., Chen, Z., Ding, X., Liu, H. Y., and Wang, D. Q. (2021). Research on water environmental capacity accounting of the Yongzhou section of Xiangjiang River basin based on the SWAT-EFDC coupling model. J. Water Clim. Change 13, 1106–1122. doi: 10.2166/wcc.2021.319
Xie, R., Pang, Y., and Bao, K. (2014). Spatiotemporal distribution of water environmental capacity—a case study on the western areas of Taihu Lake in Jiangsu Province, China. Environ. Sci. Pollut. Res. Int. 21, 5465–5473. doi: 10.1007/s11356-013-2088-9
Yan, R., Gao, Y., Li, L., and Gao, J. (2019). Estimation of water environmental capacity and pollution load reduction for urban lakeside of Lake Taihu, eastern China. Ecol. Eng. 139:105587. doi: 10.1016/j.ecoleng.2019.105587
Zhang, W., Lei, K., Yang, L., and Lv, X. (2019). Impact of riverine pollutants on the water quality of Lake Chaohu, China. IOP Conf. Series Mater Ence. Eng. 484, 1–9. doi: 10.1088/1757-899X/484/1/012049
Zhang, Y., Liu, W., Cai, Y., Khan, S. U., and Zhao, M. (2021). Decoupling analysis of water use and economic development in arid region of China: based on quantity and quality of water use. Sci. Total Environ. 761:143275. doi: 10.1016/j.scitotenv.2020.143275
Keywords: water environmental capacity, dynamic water environmental capacity model, hydrodynamic water quality model, the third drainage ditch of Ningxia, water quality
Citation: Yang C, Zheng L, Zhang Z and Feng M (2022) Study on water quality simulation and dynamic water environment capacity of Helan County section of the third drainage ditch in Ningxia. Front. Ecol. Evol. 10:1068876. doi: 10.3389/fevo.2022.1068876
Edited by:
Chengcheng Xia, Sichuan University, ChinaCopyright © 2022 Yang, Zheng, Zhang and Feng. This is an open-access article distributed under the terms of the Creative Commons Attribution License (CC BY). The use, distribution or reproduction in other forums is permitted, provided the original author(s) and the copyright owner(s) are credited and that the original publication in this journal is cited, in accordance with accepted academic practice. No use, distribution or reproduction is permitted which does not comply with these terms.
*Correspondence: Minquan Feng, bXFmZW5nQHhhdXQuZWR1LmNu