 Zanyar Abdi
 Hooshmand Alizadeh
 Saleh Mohammadi
 Saber Sabouri1
- 1Department of Urban Design, Faculty of Civil Engineering, University of Tabriz, Tabriz, Iran
- 2Department of Urban Planning and Design, Faculty of Art and Architecture, University of Kurdistan, Sanandaj, Iran
- 3Institute for Urban and Regional Research of the Austrian Academy of Sciences, Vienna, Austria
- 4Chair of Sustainable Building Technology, School of Business Building and Technology, Saxion University of Applied Sciences, Enschede, Netherlands
Urbanization, with the acceleration of construction operations in cities, is the main reason for in-creasing the absorption of thermal energy in urban areas, which leads to climate change, especially urban form has responded differently depending on environmental dimension of urban context concerning the urban heat island intensity. In the last Studies, Researchers have not Codified the effect of urban form on heat islands in the form of a comprehensive model. It is necessary to examine each urban context according to its own conditions. Accordingly, this study aims to identify the effect of building form variability on reducing the intensity of heat islands in Ferdous context of Tabriz in the form of comprehensive modelling as a new task. The research gap is the effect of the form of buildings on the intensity of UHI, and the question will be asked whether it is possible to control the intensity of UHI by changing the form by influencing the climatic indicators. Our conceptual framework was based on urban form typologies in microscale affect the amount of energy intake and consumption, especially the intensity of heat islands, and whether the use of desirable types can be responsive to reducing the intensity of these islands? In this regard, using a quantitative analysis method in Rhinoceros software, especially using Grasshopper plugins, urban form is investigated. This analysis includes both the coldest and hottest days of the year. The results show that the optimal model is the cross typology.
Introduction
Urban structures, by making changes to spaces and surfaces, as well as using materials that are different from existing natural materials in terms of thermodynamics and natural cycles of energy flow, have caused the formation of special microclimates called urban microclimates. These microclimates can have positive as well as negative effects (Shoshtari et al., 2018). The increase in temperature within cities is a problem that affects every aspect of urban life. Ignoring it can lead to irreparable consequences. The increase in temperature has various causes. Urban design, as one of the responsive disciplines, can provide a vantage point for the study of the impact of urban development and its thermal reflection, considering different variables such as urban materials (Ahmadi Vanhari et al., 2016). Due to the difference between the type of energy exchange in the city and in the natural environment, the urban climate has a considerable difference in terms of climatic variables such as air temperature, surface temperature, humidity, wind speed, and wind orientation, compared to its surrounding areas and the margins of cities and the countryside. These differences have caused the average temperature in cities to be a few degrees more than their suburbs and this phenomenon is known as the heat island of the city (Pourdeihimi et al., 2019).
Urban heat islands are one of the most common phenomena in the city, in which some urban areas, especially the center of cities, are a few degrees warmer than the surrounding areas (Zandi et al., 2020). Due to their climatic characteristics, urban heat islands have a high impact on climate change; they can reinforce fractal disturbances and increase the height of boundary layers and cause the release of particulate matter into the air to high levels of the atmosphere, and it was found that increasing urbanization can lead to increased UHI intensity and decreased concentration of surface aerosol materials (Tao et al., 2015). The undesirable effects of this heating include environmental deterioration, increasing the amount of ozone on the Earth’s surface and even increasing the mortality rate (Torkashvand, 2016), increasing the population, increasing pollution caused by industries and increasing the traffic of cars, increasing the temperature of some urban areas compared to other areas (Matkan et al., 2014), increasing energy consumption (Ahmadi Vanhari et al., 2016), increasing water consumption during the hottest times of the year as well as thermal discomfort (Hashemi Darebadami et al., 2019) and the presence of impermeable levels in the city (Alijani et al., 2017). Heat and pollution are caused by large vehicles, industries and factories, air conditioning devices (Karimi Firozjaei et al., 2017), and have adverse effects on surrounding lands, microclimates (rainfall, temperature and wind flow) and changing the pattern of local winds, strengthening the growth of clouds and fog, increasing the number of thunderstorms and affecting the amount of rainfall (Halabian and Soltani, 2020). In order to reduce these adverse effects, several strategies have been proposed which are collectively called urban heat island reduction strategies. There are currently dozens of strategies (Qi et al., 2020), including the use of green spaces (Chow et al., 2010; He and Zhu, 2018), green roofs (Peng and Jim, 2013), vertical green systems (Alexandri and Jones, 2008) and green parking lots (Park et al., 2016). Urban Heat Island (UHI) has a significant impact on the health of urban residents and energy consumption, as well as air quality. UHI research has shown that the combination of morphology and urban form such as increasing impermeable land cover, the geometry of street canyons, reduced sky visibility (wall to street width ratio) has an impact on energy balance, wind speed, and long-wave radiation, and results in the elevation of temperature in cities. Studies are trying to achieve a healthier urban environment and buildings with higher energy efficiency in cities (Equere et al., 2020).
With regard to urban planning and morphology, classical theories, such as the concentric zone theory (Burgess, 2008), which mainly focused on the city structure and the functional area of the city can be noted (Lei et al., 2020). In general, urban forms can be described as spatial patterns of urban landscapes composed of different fundamental elements (Abrantes et al., 2017). Urban form usually refers to spatial structure and built environment patterns (Lowry and Lowry, 2014), and changes in the spatial characteristics of urban areas over time are generally known as urban growth patterns (Dahal et al., 2017). A number of designers have investigated the relationship between the city form and its four factors at the macro level: density, mix land-uses, centrality and accessibility of the streets (Changyeon, 2020), the transformation of the form and degeneration of old neighborhoods and the formation of modern neighborhoods, with the rule of automobiles, gentrifications, context rupture, passing from collectivism to individualism and, naturally, increasing energy consumption and fossil fuels (Lotfi et al., 2016). The effectiveness of using urban form to promote sustainable patterns and, consequently, the optimization of energy consumption, is considerable (Boarnet and Crane, 2001; Stevens, 2017). Urban forms (Kaza, 2020) with factors such as compactness, continuity (Brownstone and Golob, 2009), walking and travel speed (Liu and Shen, 2011), carbon footprint (Jones and Kammen, 2014) and demographic variables (Lopez, 2014) can affect energy consumption. Many studies have shown that urban form indicators have the most important impact on the heat islands of the city (Ward et al., 2016). However, the city form can be improved by building performance, thermal environments and urban form optimization strategies are a function for optimizing thermal environments (Yang et al., 2020). According to These Studies (21 to 34), the relationship between and effectiveness of form and UHI, in the form of a comprehensive and executive conceptual model based on the orientation and typification of the urban form, has not yet been investigated. In this research, the direct effect of UHI and its forms, types and the calculation of UHI intensity in different urban forms has been investigated and the aim is to reach a new result from previous research about to what extent the variability of parcels and their directions, and urban blocks affect the amount of UHI and climate changes? In this study, the Ferdous neighborhood of Tabriz (adjacent to Tabriz Grand Park (El GOLI) has been investigated in order to measure this relationship. In order to investigate these effects, three types of status quo form typologies (L-Type, Rec-Type, Cross-Type) with heat islands intensity indices (Dry bulb Temperature (Tdb), Dew point Temperature (DP), Relative Humidity (RH), Wind Speed (WS)) were measured and analyzed on the coldest and warmest days of the year, and the most optimal of these three types were presented for the cold and hot seasons in the form of two formic matrices.
Theoretical background
The urban heat island was first observed by Oak Howard in London in 1820, which was 1.2 degrees Celsius warmer at night and cooler than the countryside by 0.19 degrees Celsius in the day. Thermal energy injected into the urban environment in different ways must be balanced between two tangible and intangible thermal energies and these energies should be returned to the atmosphere or stored in the inner system of the city structure (Ahmadi Vanhari et al., 2016). The phenomenon of the urban heat island refers to the temperature difference between the city and the surrounding rural areas, with urban areas having higher temperatures than rural areas (Torkashvand, 2016). Li et al. (2018) used a new method to quantize the intensity of urban heat islands. This method determines the intensity of an urban heat island by using the relationship between land surface temperature and impermeable surfaces. Remote sensing data and the nuclear density method were used to evaluate them; the results showed that the linear function of the Earth’s surface temperature was consistent with impermeable surfaces and there was a positive correlation between ground surface temperature and nuclear density (Li et al., 2018). In a study, Li et al. (2020) examined UHI levels in the metropolitan area of Berlin and measured the results using a hybrid network observation method with the WRF-Chm model (Li et al., 2020). Mackie et al. implemented a variety of UHI mitigation measures in a Chicago city study that produced a significant impact on Albedo citywide (Henao et al., 2020).
The study of Yang et al. (2020) aimed to assess the impact of a neighborhood-scale urban heat island (UHI) on the energy performance of buildings. Hourly air temperature and relative humidity were continuously measured for 3 years in 10 neighborhoods of Nanjing, China, which were selected based on the Local Climate Zone (LCZ) scheme. Data collected from the LCZ sites and suburban meteorological stations were analyzed and used as inputs for building energy simulations. Analysis of the warmest and coldest days showed that the average daily peak cooling load of residential (office) buildings was increased by 6–14% (5–9%), and the average daily peak heating load was decreased by 4–15% (3–14%). The study indicated that the spatial–temporal variability of UHI at the local scale can exert different effects on the energy performance of buildings (Yang et al., 2020). In an article titled “Urban form and transportation energy consumption, Effect of Land Use Policies such as City Form Change and Density,” this has been discussed. Rich data collected from different sources have been used to test the effect of the city’s form on energy consumption in the transportation sector and, using demographic and economic characteristics, the effect of different dimensions of the city form on energy consumption was measured (Kaza, 2020). In research about the relationship between urban form and the intensity of heat islands and its impact on urban development, considering the intensity of appropriate light, population density and area size, they classified different levels of urban development and found that horizontal and continuous growth of the city (scale and density) increases the intensity of heat islands (Liang et al., 2019). A study titled “Effects of urban growth spatial pattern (UGSP) on the land surface temperature (LST): A study in the Po Valley (Italy)” concluded that the spatial structures of artificial land uses play an important role in the local thermal pattern and that the form base patterns of the city have a significant relationship with day, night, climatic and temperature conditions (Zullo et al., 2019). Finally, by reviewing the previous research and results, in this study, we investigate the effect of the form and typologies of parcels on the intensity of heat islands in the hope that a new door can be opened to strategies to reduce energy consumption.
Building form typology
Combining the typology of the form approach initiated by Martin and March and the typology of the function approach, we define typology by three characteristics: function, footprint shape and building height. The function category includes office, residential, mixed use and commercia buildings. The shapes of building footprints are divided into three typologies based on the basic categories defined by Martin and March: rectangle, court, and cross (Li et al., 2016).
Effects of urban form on heat islands and temperature of urban environments
Elements of urban form include building height, building type, floor area ratio (FAR), segmentation, block size, block shape and building density. Urban form can be defined, for urban morphological studies, as variables that affect ambient temperature, such as elevation to width ratio (H/w), sky view factor (SVF), building wall materials, roof cover and ground. It can have a significant effect on ambient temperature due to the level of access to sunlight, wind flow, air temperature and surfaces; meanwhile, the ratio of height to width (H/w) and the orientation of passageways affect the intensity of environmental conditions in cities. It also causes the modification of microclimatological conditions in different directions of urban streets so that cities, because of the difference in the climatic variables of the city (air temperature, humidity, speed and wind direction, the amount of rainfall) with the less compact areas around it, experience certain climatic conditions and the urban form is a factor that plays an important role in determining the urban microclimate and environmental temperature (Sanagar Darbani et al., 2020). Conceptual framework is demonstrated in Figure 1.
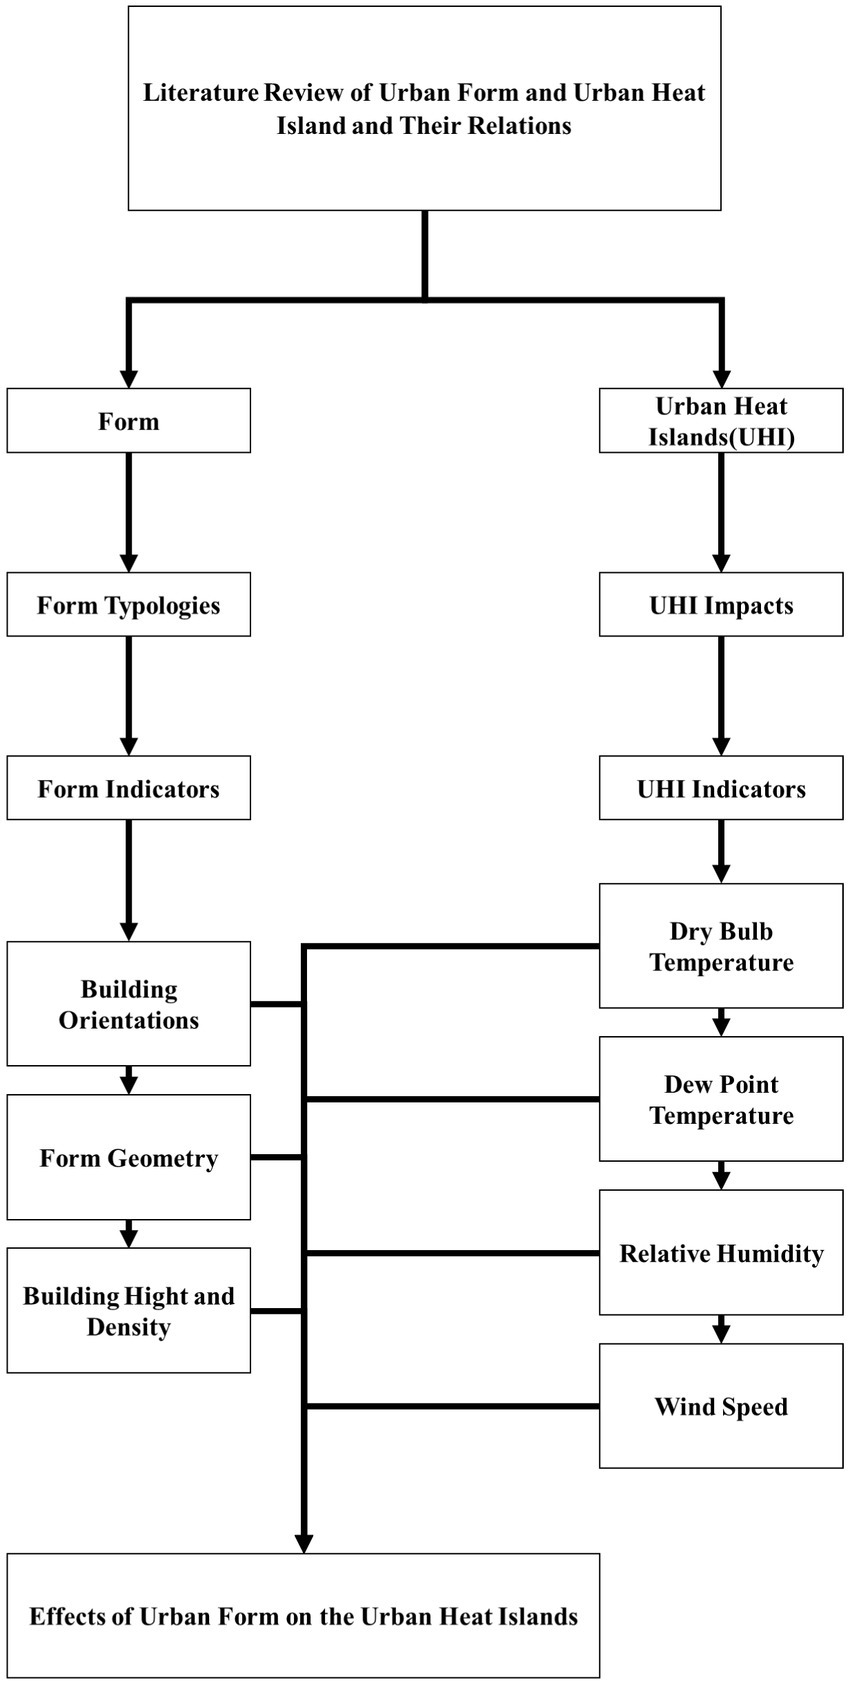
Figure 1. Conceptual framework.
Materials and methods
The Ferdous neighborhood is one of the newly developed and built neighborhoods with a regular context in district 2 of Tabriz city. This neighborhood is economically one of the most prosperous neighborhoods and, in terms of regional value, is one of the most valuable areas of Tabriz. In terms of climate and micro-climate, due to its proximity to El GOLI Park and the soft existence of abundant spaces and vegetation, it has high desirability. The physical density of this neighborhood is very high and, despite the existence of one-floor and two-floor duplex houses, 9–12 floor residential towers are within the range (Figure 2). The research method for this study is based on quantitative methodology. In this research, library and documentary studies were collected through reviewing books, articles, reports, documents and designs in the field of heat islands, the forms and factors affecting it and the relationship between them. Then, by identifying the existing form typologies, a UHI indicator of heat islands in the three forms of rectangular, Cross and L-typed was analyzed and the intensity of the heat islands in each form was measured according to the current situation on the coldest and warmest days of the year. Heat islands’ intensity modelling and form parcel coding were performed for analysis in RHINOCEROS software using Urban Weather Generator (UWG) engine which is used by Dragonfly as the interface.
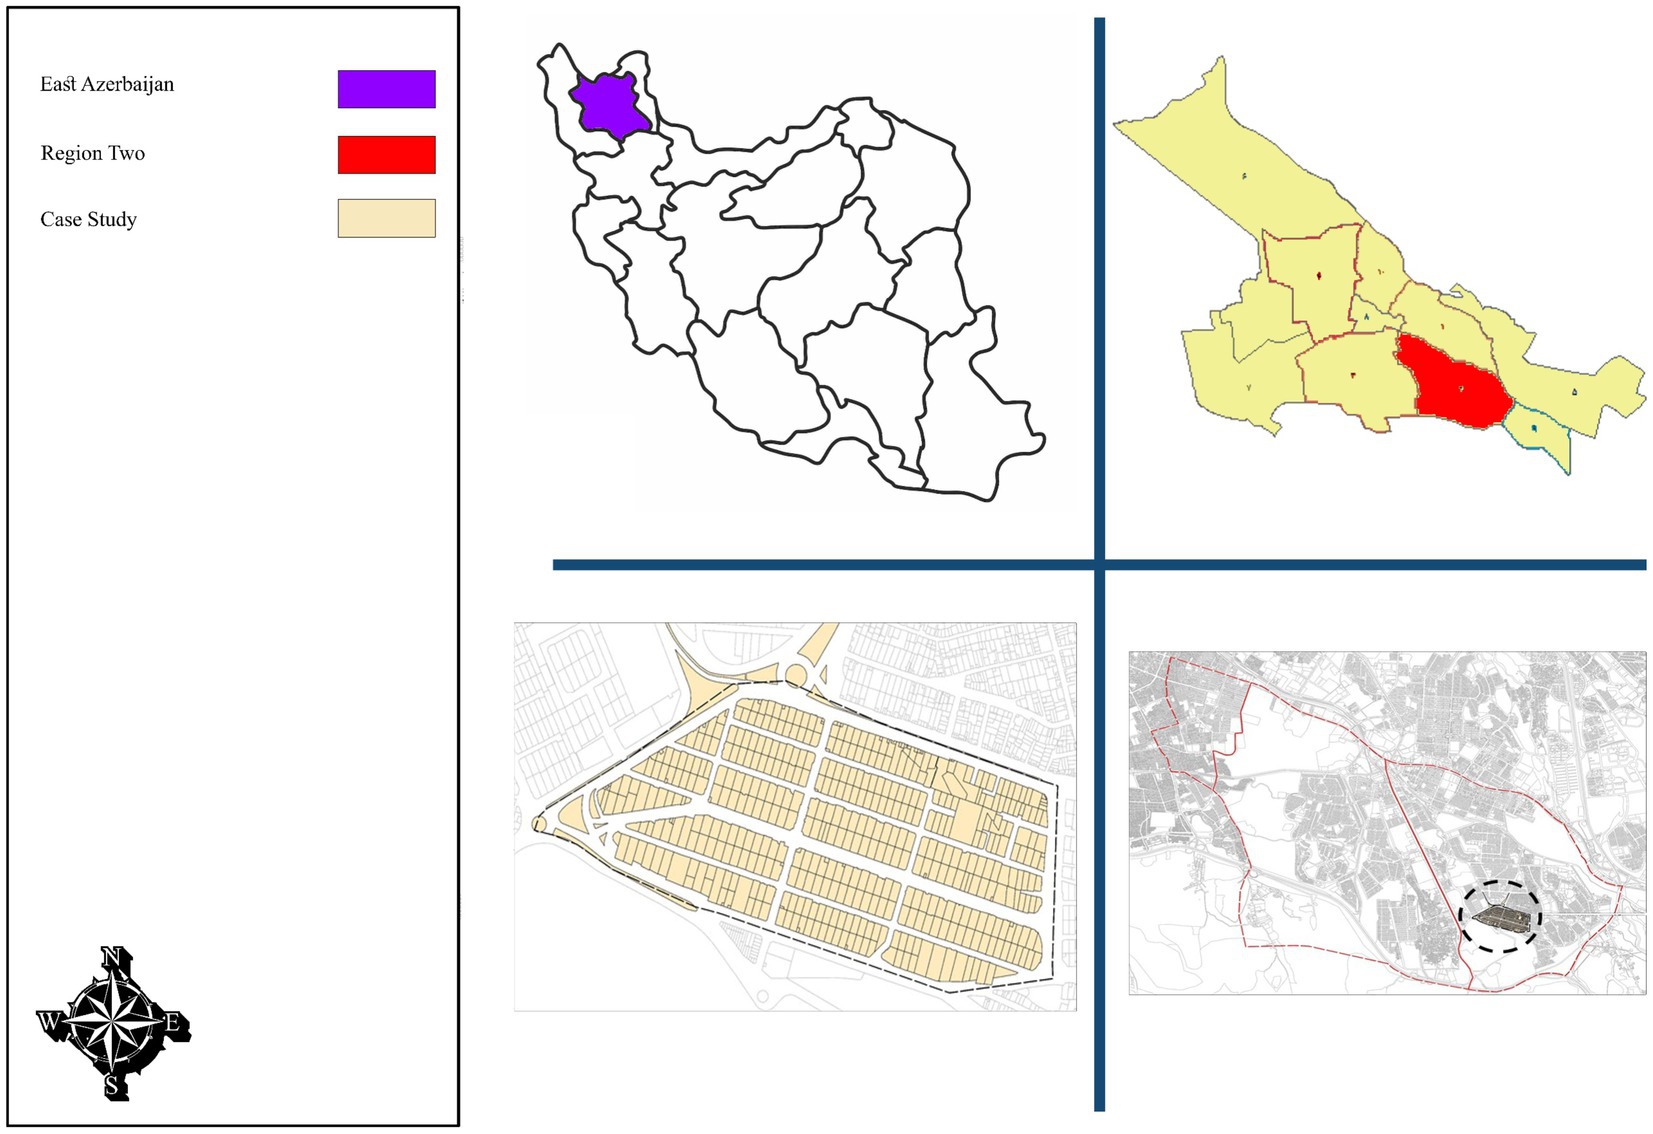
Figure 2. Case study area.
Nakano et al. (2015) developed UWG using a building energy model based on the Town Energy Balance scheme and energy balances applied to control volumes in the urban canopy and boundary layers. UWG calculates the hourly values of urban air temperature and humidity based on reference weather data typically measured outside a city. It requires an Energy Plus weather (EPW) file and an Extensible Markup Language (xml) file describing the urban and rural site characteristics. The process of creating the xml file is further broken down into four different parts: (1) building construction; (2) internal loads from occupants, equipment, and lighting; (3) geometric parameters and anthropogenic heat defining the urban space; and (4) information concerning the measurement of the weather data at the rural site. The template library is included to facilitate quick parametric simulations using different building construction, schedules, and so forth. The UI takes in multiple building templates and weighs their effects on the urban climate by the distribution of building types. The Rhino version shares a similar UI as the standalone version. It takes advantage of Rhino’s and UMI’s functions to automatically extract the site coverage ratio, façade-to-site ratio, average building height (weighted by building footprint) and characteristic length (√site area), as well as the average window-to-wall ratio and the U-value (weighted by facade area) to further reduce user inputs and the extra step previously required to manually calculate or use the Grasshopper definition provided above to obtain these parameters (Nakano et al., 2015).
The process of analyzing and reviewing the present study is summarized as follows:
1. Step 1: Modelling 3 form typologies. In the first Step, the plan form, number of floors, land uses, life of buildings, green spaces and parking lots, trees, lighting and balconies of the desired areas were designed and prepared by observational and experimental studies in Autodesk AutoCAD and Arc GIS software. Then, in order to model them, the data were entered into RIHNOCEROS software, and were coded, designed with the GRASSHOPPER plugin (in all three forms of Rectangular-Type, L-Type and Cross-Type).
2. Step 2: Input data & Geometries. At this point, the desired data were added to the plugins, Grasshopper, Ladybug, Honeybee and Dragonfly. In the desired area, the number of floors of residential units, 1 to 12 floors, commercial units, number 1, 2, 4 and 5 floors, as well as a 3.2 × 2(A × B) m parking space for each unit and a radius of 3 m for trees were considered.
3. Step 3: Building Typologies. Then, according to the inputted data (residential, commercial and parking units), the type of building form was run in three forms: Rectangular-Type, L-Type and Cross-Type (Figure 3).
4. Step 4: City Parameters. In this step, the city parameters (Traffic, Vegetation and Pavement Parameters) were entered as inputs in order to construct the city model. Each of these parameters requires a number of data that have been entered by observational and experimental studies and global standards. These parameters are presented in Table 1.
5. Step 5: Run City. In this step, using the Dragonfly plugin, city form models were run using their parameters (Traffic, Vegetation and Pavement Parameters). City model inputs including the parameters Building Typologies, Terrain, Trees, Grass and Climate Zone (Climate Zone for Tabriz: 7) were entered.
6. Step 6: Run UWG (Urban Weather Generator). At this point, an Urban Weather Generator was built according to the city model and open space (Rural) Energy Plus Weather file. Considering that the intensity of heat islands is calculated by the difference in the temperature of the city and the surrounding rural environments, the Energy Plus Weather file (EPW) is considered as an open space or rural area for analysis without any construction. According to the construction of the city model using parameters and form typologies, an Energy Plus Weather file was created for each form of the city, each of which contained microclimate data proportional to the typification and orientation of the construction form. UWG requires a number of data that have been added according to observational and experimental studies and global standards. These parameters are presented in Table 1.
7. Import EPW (Rural and Urban). At this point, the Energy Plus Weather files of the village and city were inputted into the model to provide the latest prerequisites and data to simulate and capture the outputs of UHI indicators.
8. Step 8: Export Data and Charts (Tdb, DP, RH, WS). Finally, UHI indices (Tdb, DP, RH, WS) were taken as raster charts and raw Excel data as hourly, daily, weekly and annual averages (it should be noted that, using these raw data, the coldest and warmest days of the year were determined for analysis).
9. Step 9: Extracting data on the warmest and coldest days of the year. After extracting the statistics in Excel tables and raster diagrams and charts, the hourly average during the whole year, the monthly average and the coldest and warmest days of the year were determined and the four indices were analyzed for these 2 days.
10. Step 10: Calculating UHI intensity (in 3 form typologies) at the warmest and coldest day of year and logarithmic Diagrams. As a result, after extracting UHI indices, using the Oak Howard formula to calculate the intensity of UHI, this rate was investigated in all three models and displayed in logarithmic diagram (on the coldest and warmest days of the year).
11. Step 11: Drawing the matrix on the warmest and coldest days of the year to determine the optimal model. In order to select the optimal model, two matrices were prepared and displayed for the warmest and coldest days of the year, in which the four UHI indices and their intensity for all three forms were investigated and the optimal model was selected and presented in the results.
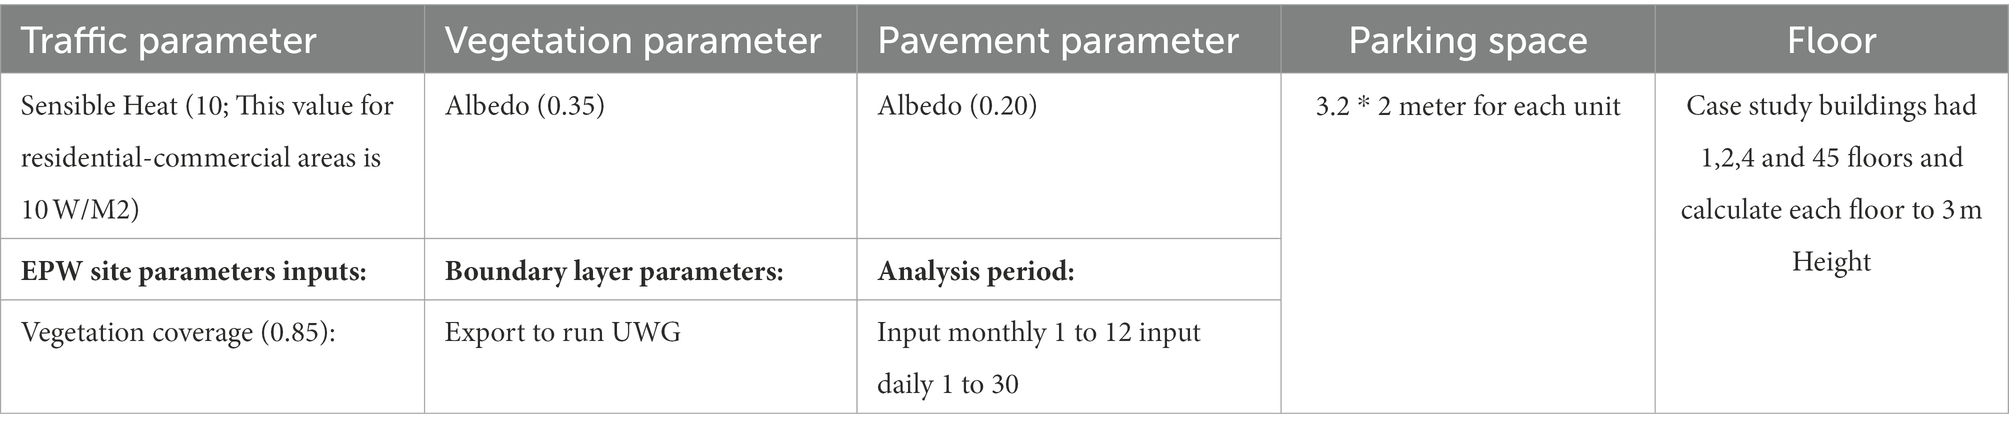
Table 1. Parameters (Nakano et al., 2015).
Results
According to the research method and the presented steps, the data of the coldest and warmest days of the year were taken from the annual and monthly average output charts. Using UWG and UHI Intensity functions, three form types of analysis and results were presented in the form of logarithmic tables and diagrams, and in order to achieve the optimal model among these three models, two matrixes were prepared for the coldest and warmest days of the year and the optimal model was selected (Figure 3).
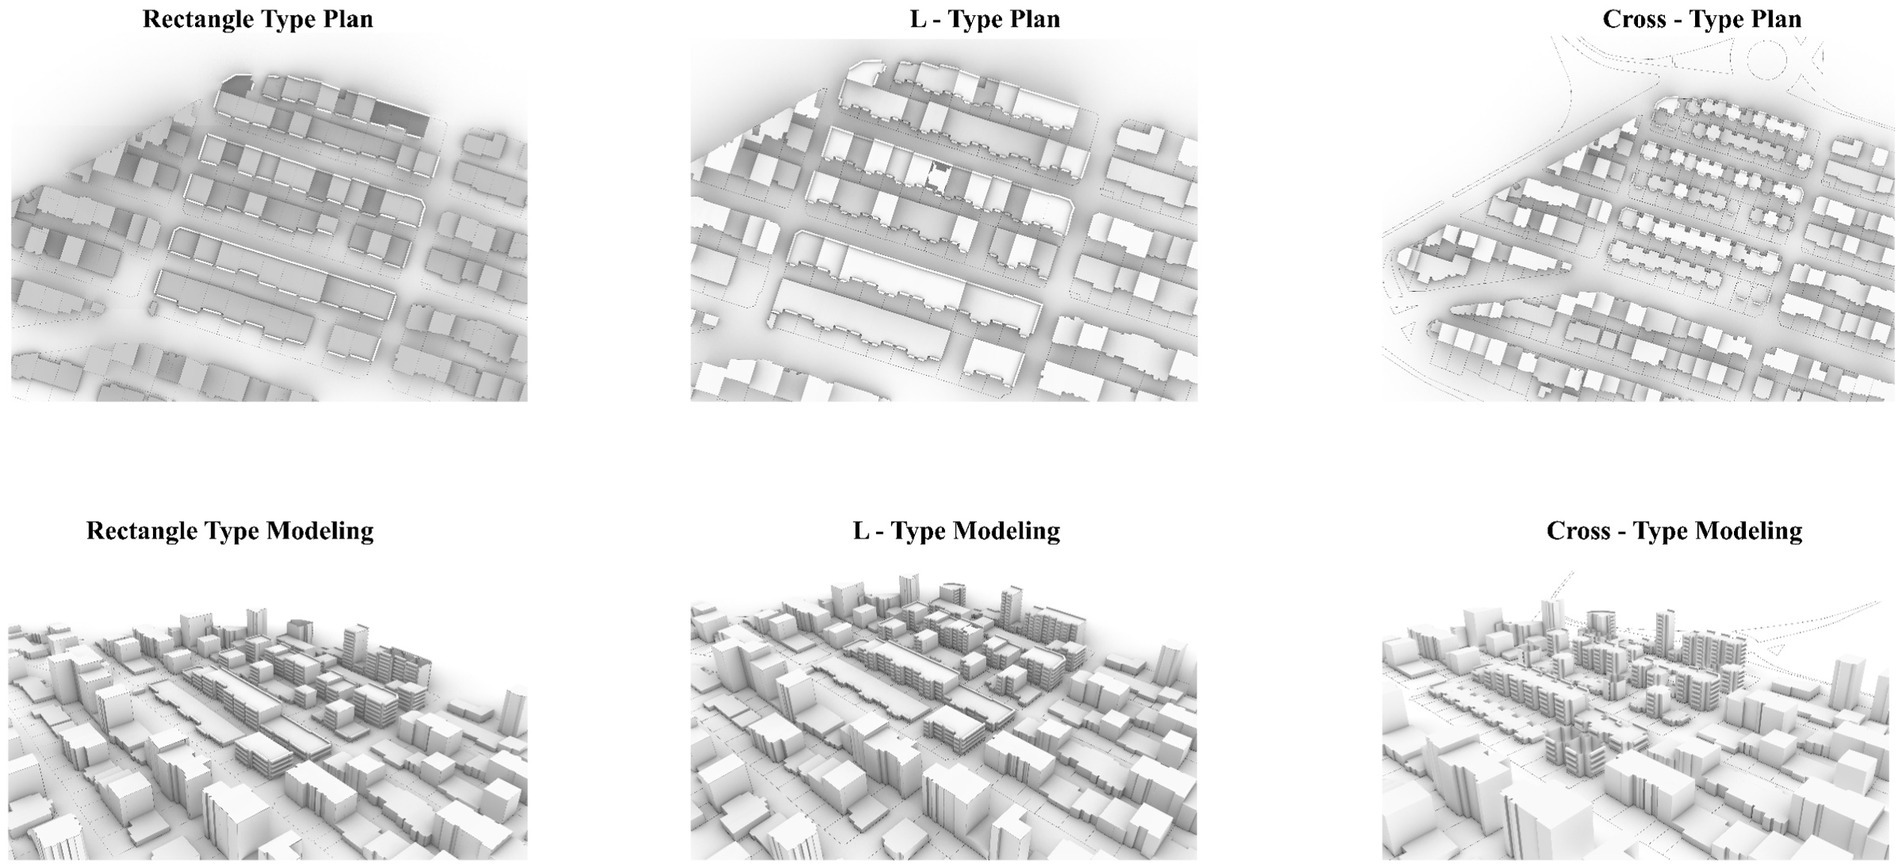
Figure 3. 3D modeling.
Statistical analysis and structural equation model
Figure 4 presents the full structural equation model, examining the relationships between the urban typologies and urban heat islands’ intensity. The model is based on the theoretical background and the model of the method presented in Section 3 above. Personal characteristics are also included in the model as UWG indicators linked to the three main form typologies and UHI intensity indicators of the study: UWG characteristics, form typologies and UHI intensity indicators. The UWG characteristics that are examined in the study are: traffic, vegetation, pavement parameters and energy plus weather data (EPW). The placement of UWG characteristics in our model derives from the model of the method and empirical studies from the Ferdous neighborhood of Tabriz. In cases such as Ferdous, form typologies can influence UHI intensity and cities’ parameters and therefore these variables are considered.
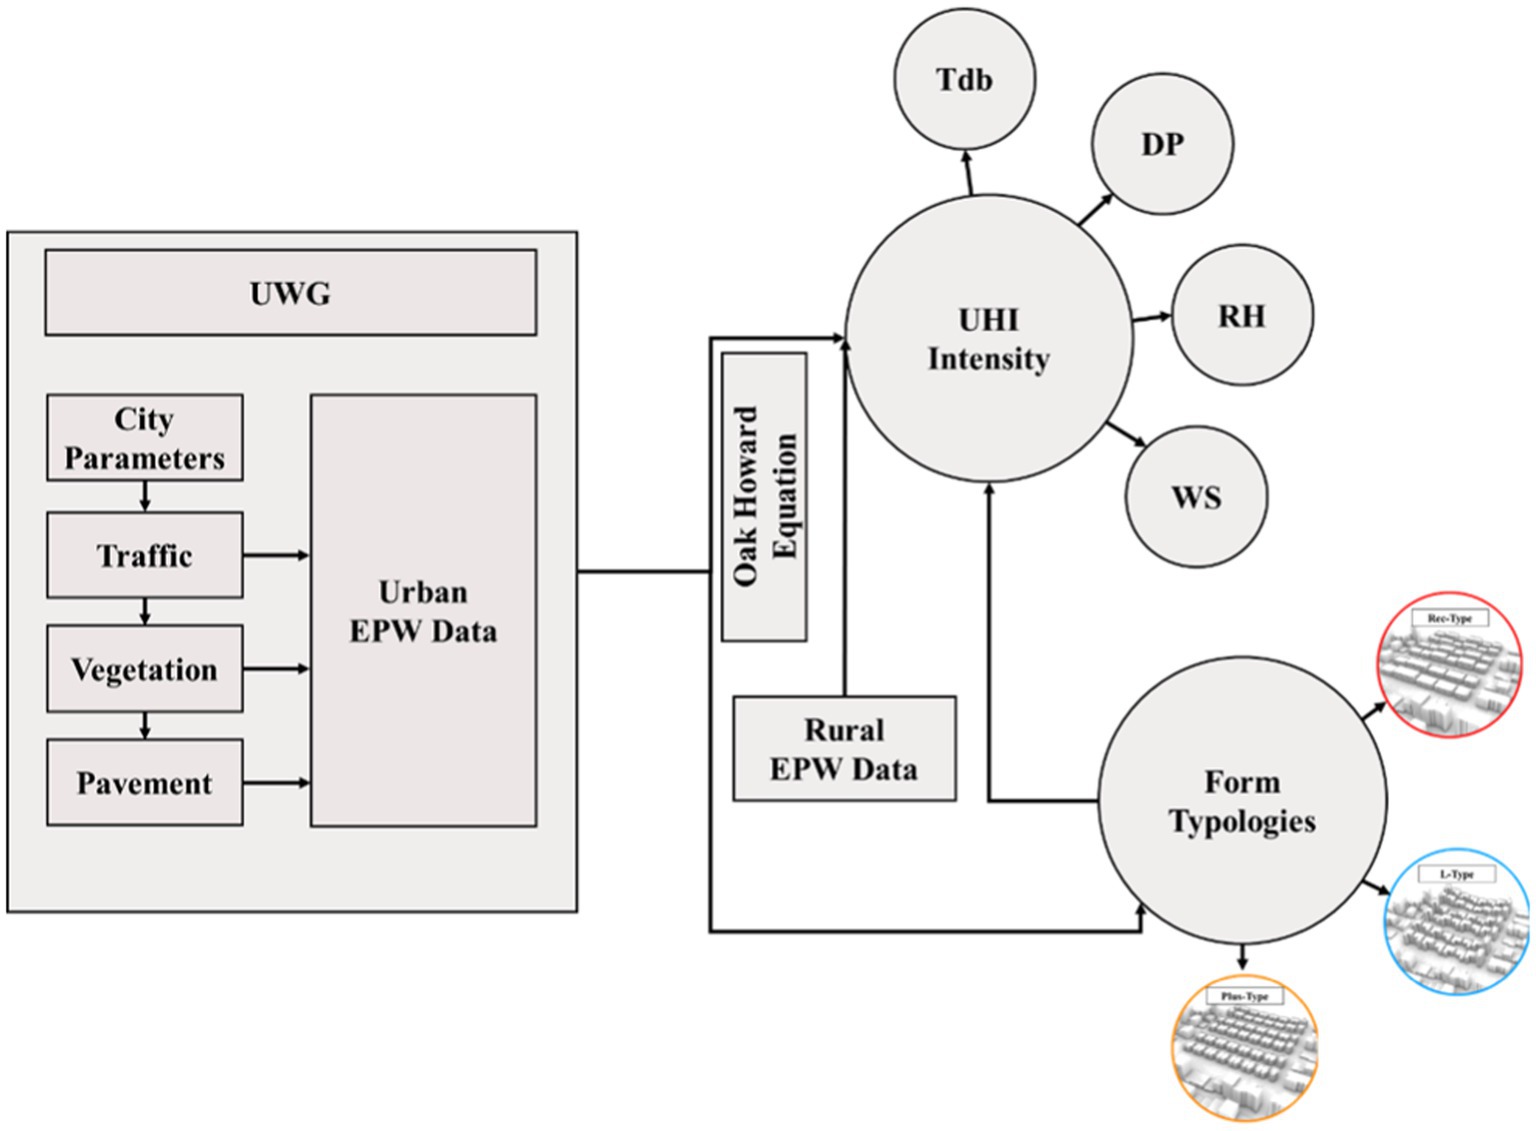
Figure 4. Statistical analysis and structural equation model.
Heat islands are in fact different from the temperature of urban and rural areas; in rural spaces it is assumed that there are no buildings in the area, and in urban areas the status quo of the buildings in the area with the desired form has been investigated and the intensity of UHI has been used according to the oak formula 1981 (Formula 1):
Formula (1): Oak 1981 formula to calculate UHI intensity (Alijani et al., 2017; This formula applied in these studies, see Table 2).
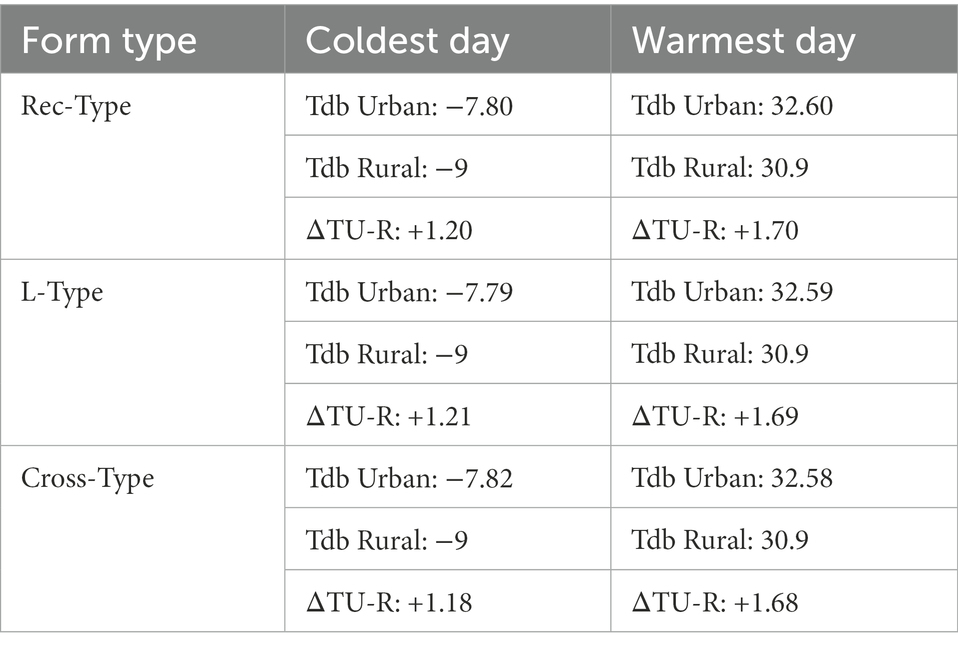
Table 2. UHI intensity (in 3 form typologies) on the warmest and coldest days of the year.
In the Formula (1) of ΔTU-R(Max), the maximum heat island intensity and H/W is the ratio between the average height of the building and the average width of the street. The intensity of the heat island is calculated according to the data extracted from the UHI model (Rural and Urban (Rec, L, Cross) and is displayed in the form of tables and logarithmic diagrams.
At first, the raster files of dry bulb temperature (Tdb), dew point temperature (DP), relative humidity (RH) and wind speed (WS) were output. The above diagram shows the dry bulb temperature in rural spaces, and the below diagram shows the urban space indicators with the desired pattern (with the number of floors and orientation and type of the current situation in three forms L, Cross, Rec) taken out. Then, according to the data extracted from the analysis of the model, the warmest and the coldest days of the year were determined—2 January is the coldest day and 3 August is the warmest day of the year (Figure 5).
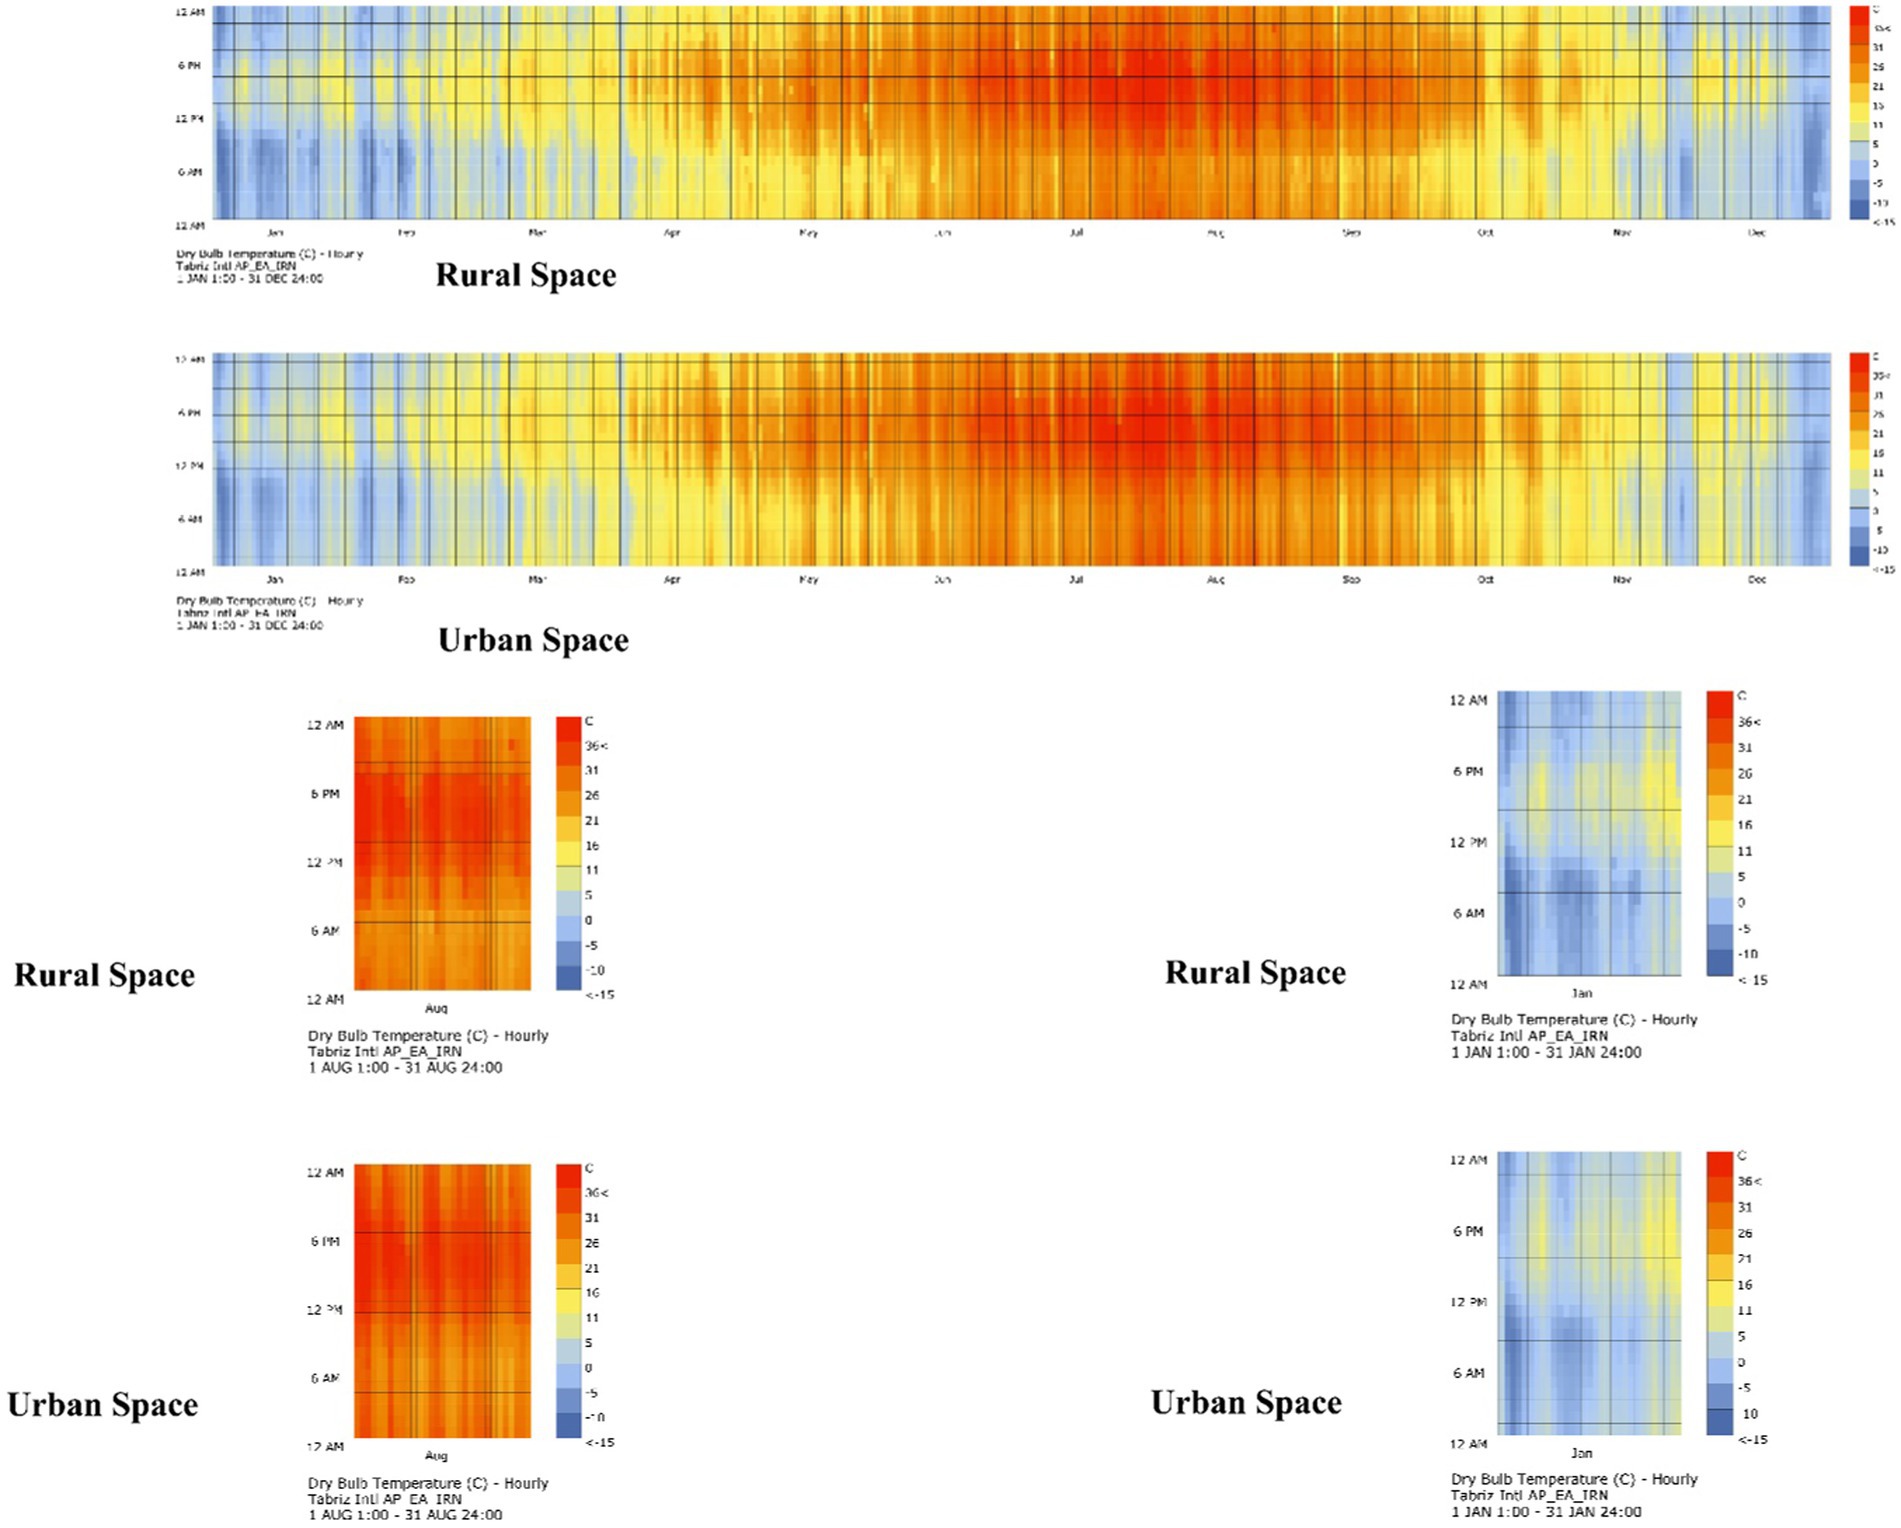
Figure 5. Raster charts − Hourly Average quadruple Indicators (Tdb) for the year and the time averaged chart of the coldest and warmest months of the year (data from the coldest and warmest days of the year are extracted in this chart). It should be noted that red color represents heat and blue color represents cold.
After reviewing the four indices in the three models, the heat island intensity was calculated in the coldest (2 January) and warmest (3 August) days of the year. In the intensity of the heat island, the higher the temperature difference between the urban space and the village, the higher the need for energy consumption and the use of cooling devices in summer and heating devices in winter, meaning the amount of energy consumption increases. In order to investigate the amount of energy loss in each of these three models, the intensity of UHI is measured and displayed in the form of tables and diagrams (Table 2). On the warmest day of the year, this intensity is higher in Rec-type and energy consumption is higher than that of the L-type and Cross -type, and Cross -type has the lowest energy loss in terms of UHI intensity. On the coldest day of the year, this intensity is higher in the L-type model and energy consumption is higher than that of the Rec- type and Cross-type, and Cross-type has the lowest energy loss in terms of UHI intensity (Figure 6).
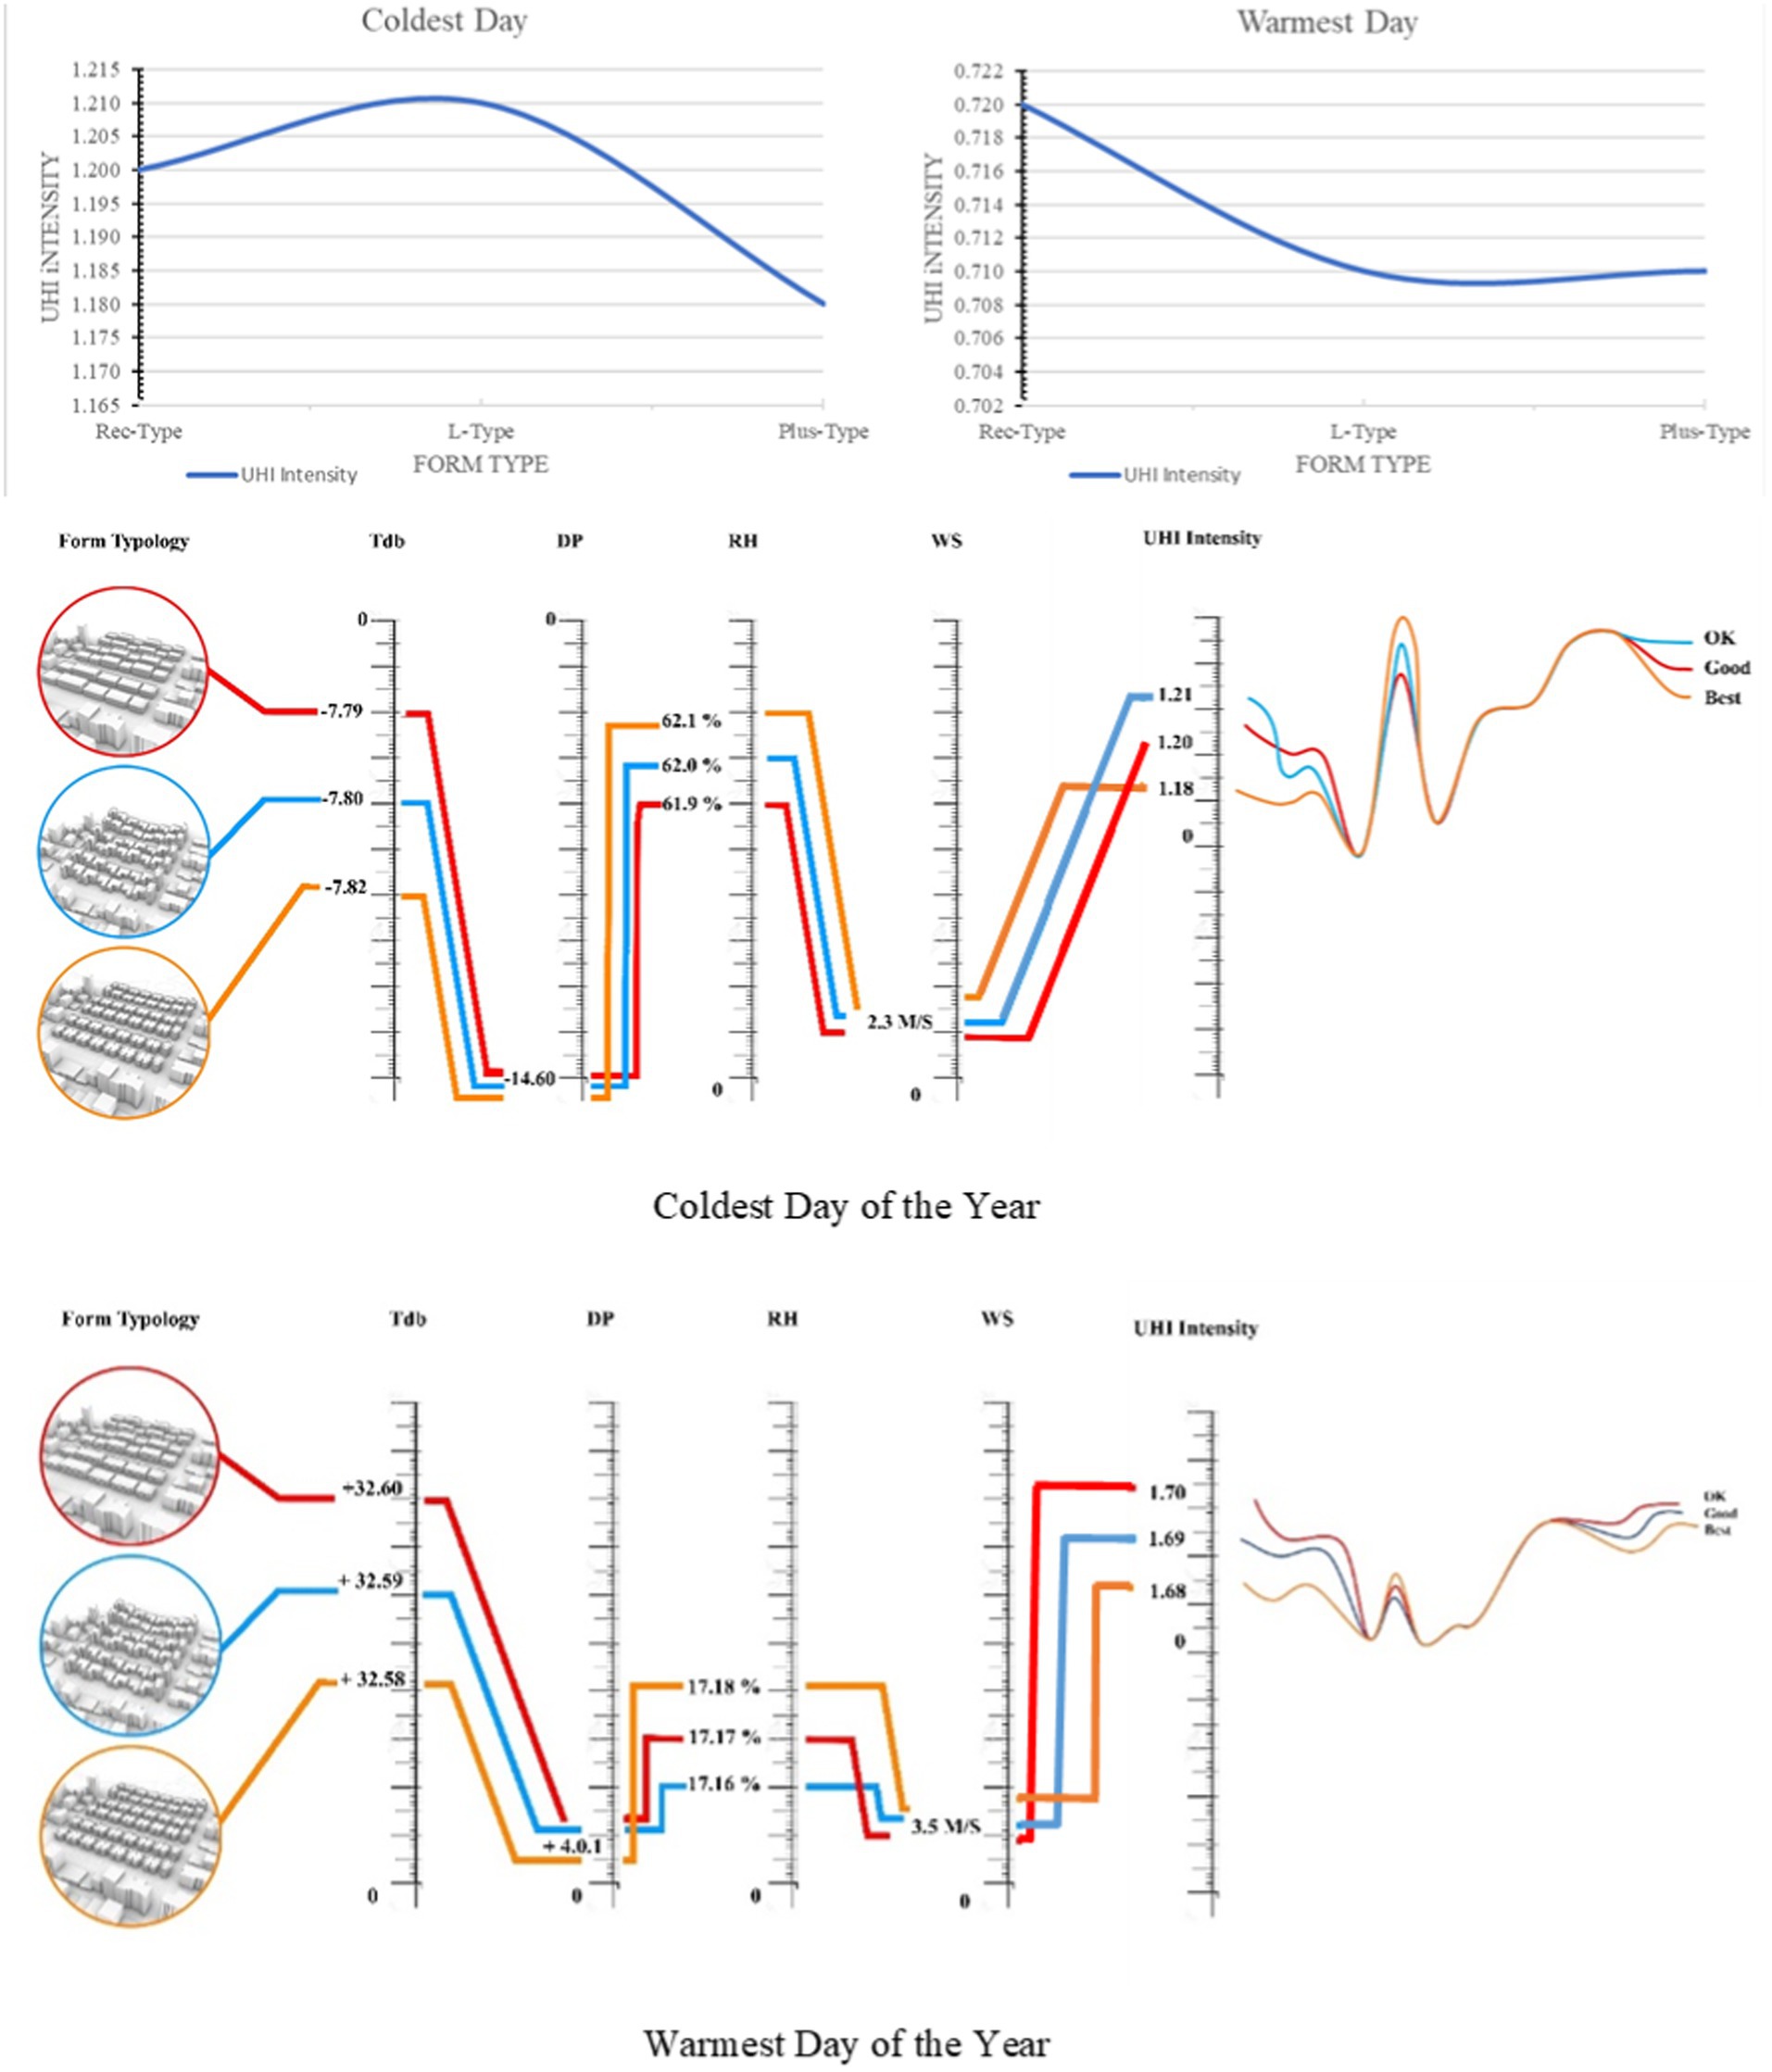
Figure 6. UHI intensity Ln Chart (in 3 form typologies) on the warmest and coldest days of the year and its matrices. It should be noted that this classification is based on Table 2 and evaluation of 4 climatic indicators.
Discussion
The increase in temperature is especially noticeable for urban areas. One of the urban problems that has arisen as a result of unplanned growth in cities is the heat island, especially in metropolises. Urban heat Islands (UHIs) are the product of urban climate and are considered one of the most important environmental problems of the 21st century. In fact, heat island refers to the increase in air temperature, but can also be considered as relative surface heat, so studying urban heat islands can lead to many problems (Dadashi Roudbari and Aliabadi, 2017; Table 3).
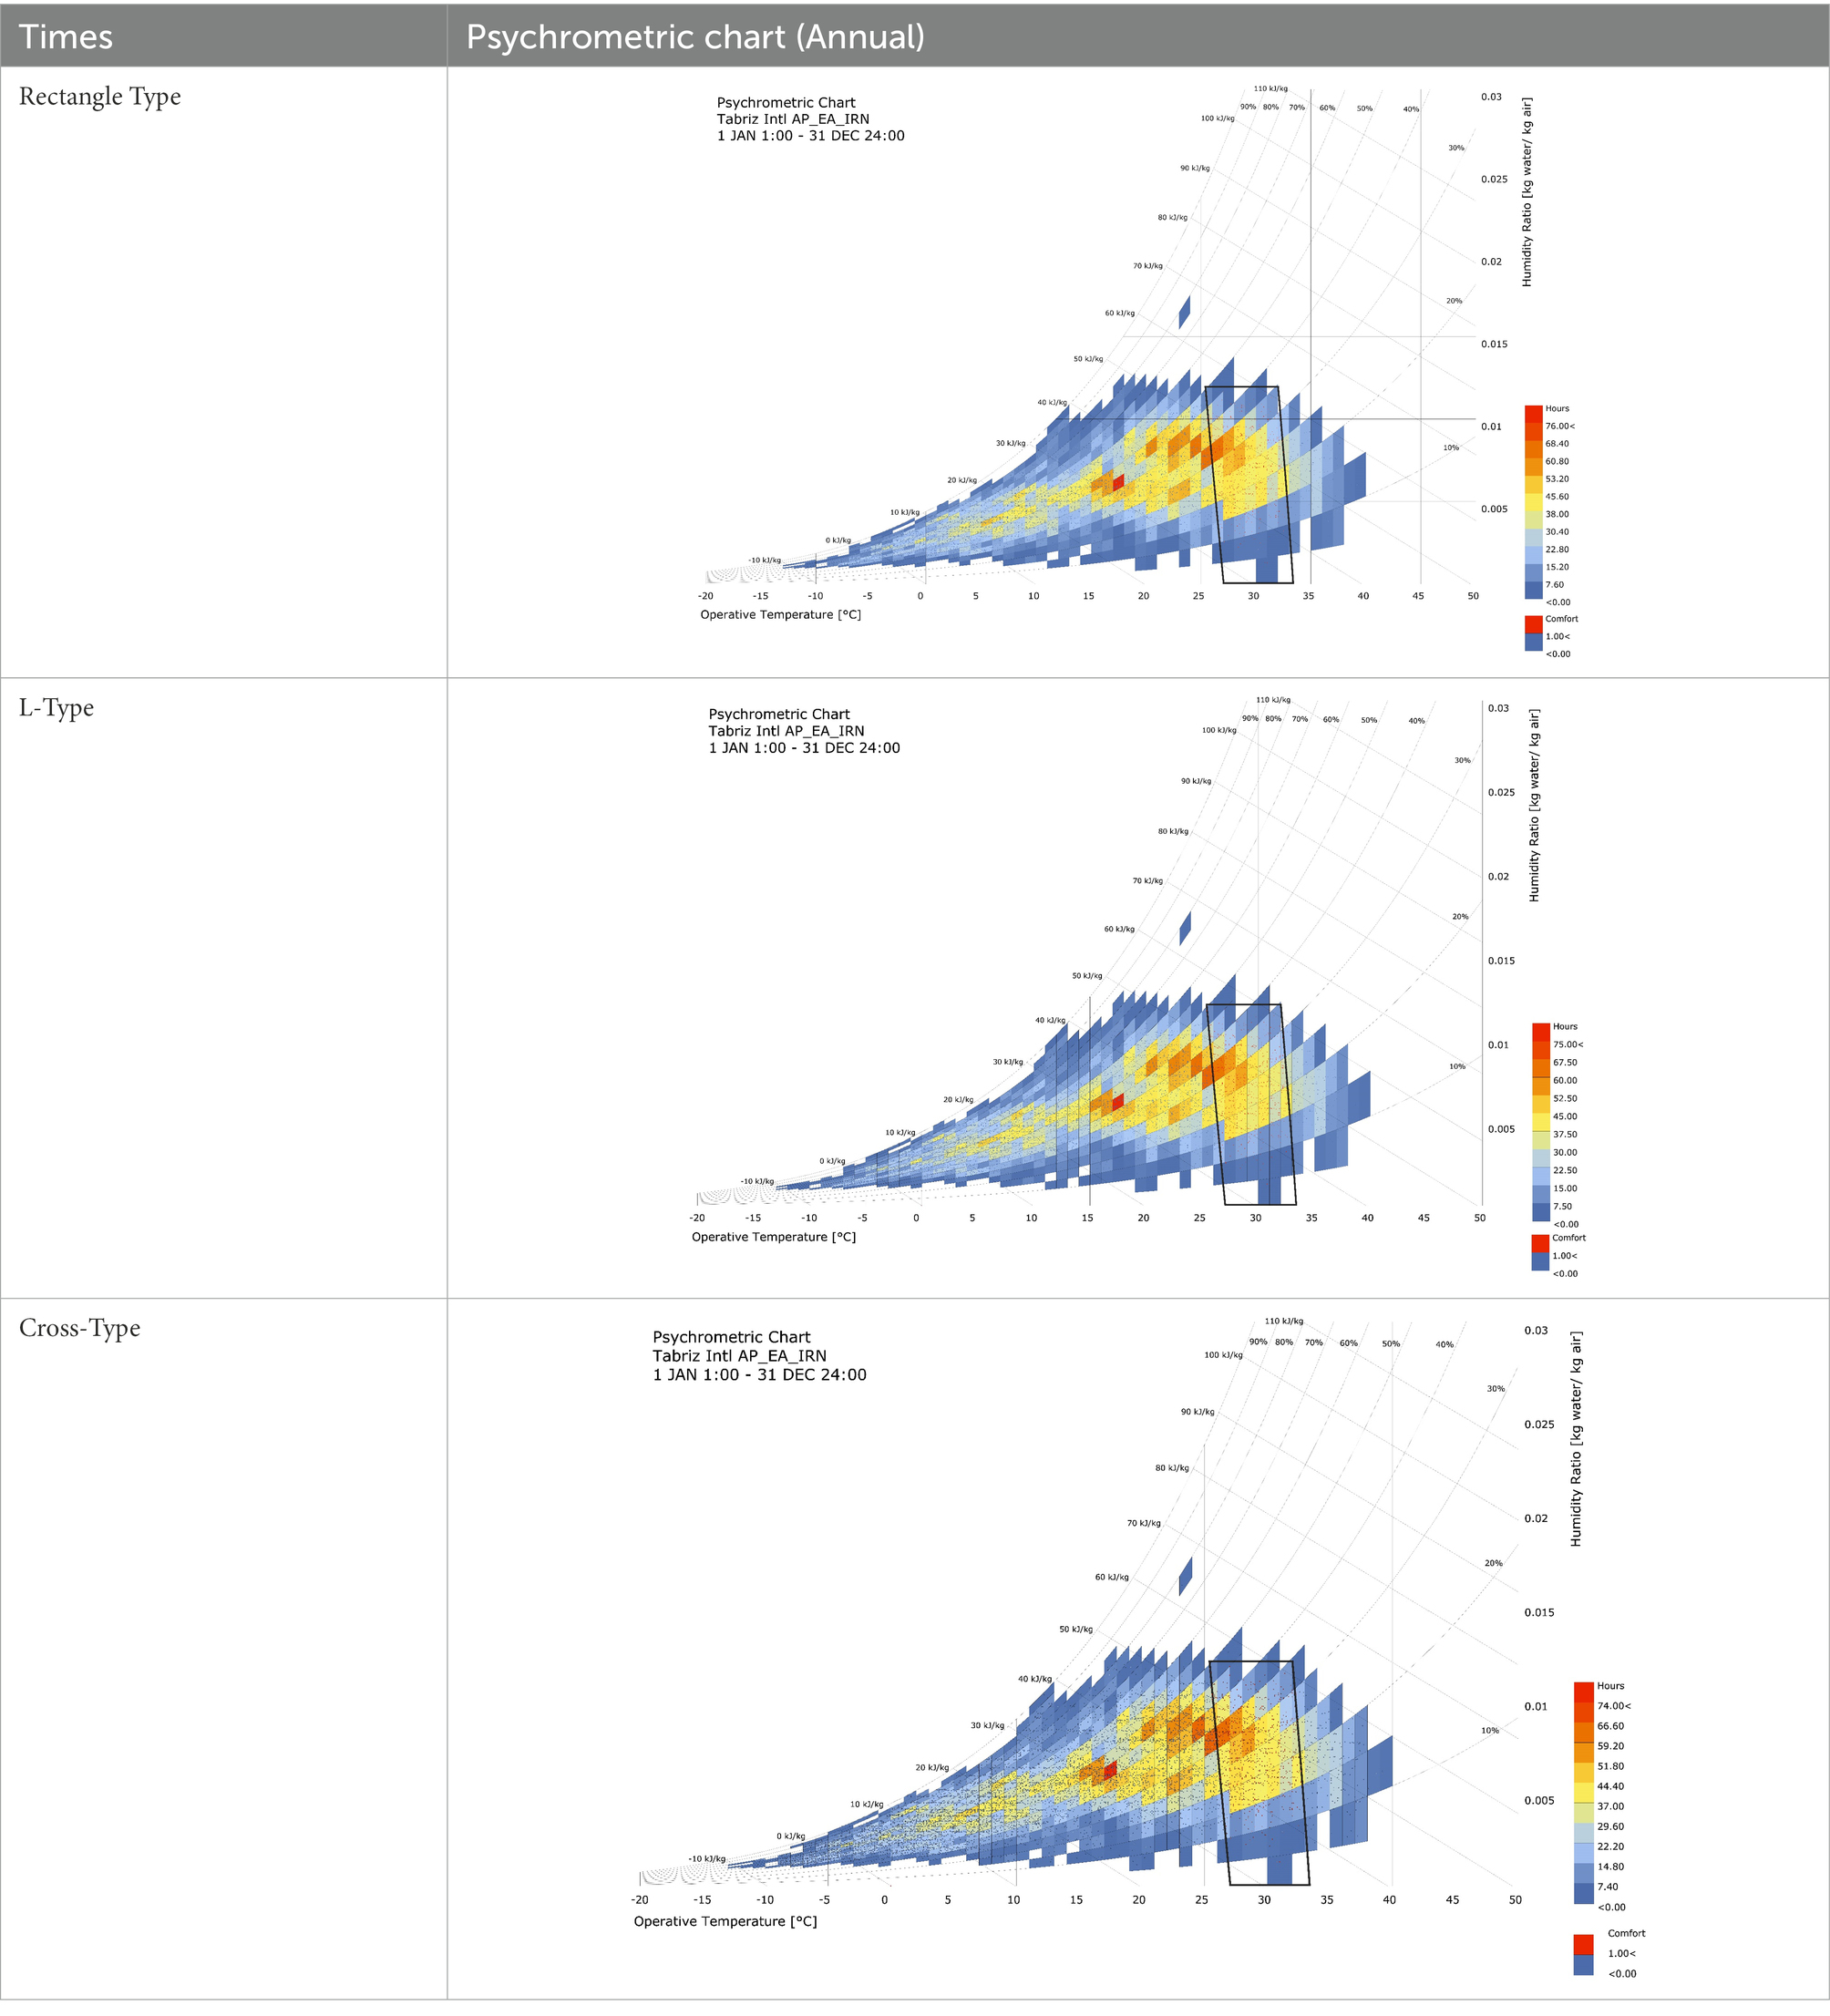
Table 3. Psychrometric Chart (in 3 form typologies) on the warmest and coldest days of the year.
Urban heat island is the increase in the temperature of cities compared to rural and suburban areas. Contrary to regional climate differences, the cities of the world have a special feature called the heat island of the city. In fact, urban areas have higher temperatures than rural areas (Shirvani Moghadam and Saeedi Mofrad, 2018). Heat islands increase energy consumption, reduce thermal comfort and pose a threat to human health. In urban areas, heat is enclosed within impermeable surfaces such as concrete and asphalt, and when cities are faced with high concentrations of air pollution and increased human activity, heat islands are intensified, generally providing tall buildings with shade and reducing ambient temperature. However, at the same time, they also absorb a lot of sunlight and this causes the ambient temperature to be closely related to the urban form (Sanagar Darbani et al., 2020).
Variable descriptions
The four indices of UHI intensity measurement—Dry Bulb Temperatures, Dew Point Temperature, Relative Humidity and Wind Speed—were investigated in order to understand their effect on the type and form typologies and then these indicators were introduced for statistical analysis and structural equation modeling. It should be noted that the two indicators of relative humidity and wind speed have been measured and evaluated using psychrometric chart and EPW data (Wind speed and relative humidity data are available in the EPW file of the studied area) (Table 3).
Dry bulb temperatures
Dry bulb temperature is ambient air temperature, which is what the normal air temperature is called with a thermometer (Parsons, 2015). Dry bulb temperature, commonly called air temperature, is the air property that is most commonly used. It is called “dry temperature” because the temperature is represented by a thermometer that is not affected by the humidity of the air. Dry bulb temperature (Tdb) is measured using a conventional thermometer that is freely exposed to air but protected from radiation and humidity. Temperatures are usually measured in degrees Celsius or Fahrenheit (0F). The Si unit is Kelvin (K). Zero Kelvin is −273oC. Dry bulb temperature is an indicator of heat (National Oceanic and Atmospheric Administration, 2020).
Dew point temperature
A dew point is the temperature at which water vapor condenses from outside the air (a temperature at which the air is completely saturated). Above this temperature, humidity stays in the air.
• If the dew point temperature is close to the dry bulb temperature, relative humidity is high;
• If the dew point temperature is below the dry bulb temperature, relative humidity is low.
Dew Point temperature is always lower than dry bulb temperature and is identical to 100% relative humidity (air is in the saturation line). When the steam in the air starts to condense outside the can, the thermometer’s temperature is almost close to the dew point of the actual air (Dry Bulb, 2001).
Relative humidity
Relative humidity is the percentage (or ratio) of water vapor in the air relative to the amount needed to saturate the air at the same temperature. Although commonly used, relative humidity is not the best measure of humidity as it depends on air temperature. Hot air has more water vapor than cool air (Parsons, 2015).
Wind speed
Air velocity plays an important role in the amount of heat and how a body’s surface heat is transmitted through evaporation. A speed of less than 19.7 fpm (0.1 m/s) creates a throbbing or generally brewed state so that, due to a lack of air flow, the air around the surface of the body reaches saturation and prevents evaporation (Soltandoost, 2013).
In our studies, after reviewing the four indices in the three models, the heat island intensity was calculated for the coldest (2 January) and warmest (3 August) days of the year.
The pattern of wind direction has been changed according to the form of the buildings. The pattern of the buildings is currently a rectangular pattern, and in order to investigate and measure the effect of the shape of the buildings on the intensity of UHI, all the buildings have been replaced with two patterns, L and + (there were buildings with these patterns in the whole context). And the change in the form of buildings has controlled the flow of wind movement. 2 factors Tdb and DP independently and RH and WS are dependent on the intensity of UHI.
We calculated UHI intensity (in three form typologies) for the warmest and coldest days of the year and used logarithmic diagrams. As a result, after extracting UHI indices and using the Oak Howard formula to calculate the intensity of UHI, this rate was investigated in all three models and was displayed in a logarithmic diagram (on the coldest and warmest days of the year).
On the warmest day of the year, this intensity is higher in Rec-type and energy consumption is higher than in the L-type and Cross -type, and the Cross -type has the lowest energy loss in terms of UHI intensity. On the coldest day of the year, this intensity is higher in the L-type model and energy consumption is higher than in the Rec- type and Cross-type, and the Cross-type has the lowest energy loss in terms of UHI intensity (as displayed in Figure 6).
Therefore, a matrix is drawn for the warmest and coldest days of the year to determine the optimal model (Figure 6). In order to select the optimal model, two matrices were prepared and displayed for the warmest and coldest days of the year, in which the four UHI indices and their intensity for all three forms were investigated and the optimal model was selected and presented in the results.
Thus, the Cross model is more favorable in terms of energy consumption and low UHI index than the Rectangular and L-typed models, and the L-typed model has a more favorable status than the rectangular model for warm days and seasons. Finally, two matrices were formed for the coldest (2 January) and warmest (3 August) days of the year in order to determine the optimal form pattern with the microclimatic conditions of the region. According to the analysis and in the matrices, the conditions and indicators of heat islands and the effect of (Rec-L-Cross) forms on the intensity of the islands were investigated.
Conclusion
As mentioned earlier, in previous studies, the relationship and effectiveness of form and UHI, in the form of a conceptual and executive model based on the orientation and typification of the urban form, has not yet been investigated. In this research, the direct effect of UHI and its forms and types, and the calculation of UHI intensity in different urban forms, has been investigated and the aim is to understand to what extent the variability of typologies and the direction of form base, parcels and urban blocks affects the amount of UHI changes and climate changes? Form and physical typologies have a direct effect on the distribution of temperature in cities. According to the analysis in the study area, form typologies were Rectangular, L and Cross types, and for each of these patterns the intensity of the heat islands (UHI Intensity) was analyzed. The most appropriate model for the current situation is in terms of controlling the cooling and heating of the building and to some extent controlling the energy consumption of the Cross model.
Using the desired form and typologies and, proportional to the microclimatic conditions, the amount of cooling and heating of the building, to some extent the amount of energy consumption can be controlled. Two matrices have been prepared to analyze the three patterns (Rec-Type), (L-type) and (Cross -Type), on the coldest and warmest days of the year (Figure 6). According to the matrices, the intensity of UHI in the L-typed model (coldest day) and the Rec-Type model (the warmest day) is higher than the other two models and the rate of increase in the temperature of the city environment is higher. High dry bulb temperatures (larger than dew point temperatures) and low wind speeds exacerbate this, causing energy loss. If you take a closer look at the matrices, the humidity difference is 0.1 per model for a warm and a cold day, indicating that, by changing the form and physical typologies, the intensity of the heat islands can be partially controlled. Among these three types of patterns, the desired type on both cold and warm days of the year is the Cross -type, because the intensity of UHI is lower and the humidity will be higher to increase the range of winter and summer comfort. Of course, the form alone cannot control the amount of energy consumption and microclimatology changes, but it is an important factor and, along with using the design of the form and desirable types of building, passive strategies can also be used, such as passive solar solutions and green materials, which can be very desirable for energy storage and increasing the thermal comfort of the environment. Future research will investigate how much climatic comfort, cooling and heating of buildings and energy consumption will be controlled by using passive solutions in these forms and typologies, and whether the combination of these forms and typologies can lead to more energy storage or not.
Data availability statement
The raw data supporting the conclusions of this article will be made available by the authors, without undue reservation.
Author contributions
ZA: conceptualization, software, formal analysis, investigation, visualization, supervision, and project administration. ZA, HA, and SM: methodology. ZA, HA, SM, and SS: validation, resources, data curation, and writing—original draft preparation. ZA and HA: writing—review and editing. SM: funding acquisition. All authors contributed to the article and approved the submitted version.
Acknowledgments
The authors would like to acknowledge Hamed Ali Mohtasham (To help analyze and investigate information and climate data).
Conflict of interest
The authors declare that the research was conducted in the absence of any commercial or financial relationships that could be construed as a potential conflict of interest.
Publisher’s note
All claims expressed in this article are solely those of the authors and do not necessarily represent those of their affiliated organizations, or those of the publisher, the editors and the reviewers. Any product that may be evaluated in this article, or claim that may be made by its manufacturer, is not guaranteed or endorsed by the publisher.
Supplementary material
The Supplementary material for this article can be found online at: https://www.frontiersin.org/articles/10.3389/fevo.2022.1065538/full#supplementary-material
References
Abrantes, P., Rocha, J., Marques da Costa, E., Gomes, E., Morgado, P., and Costa, N. (2017). Modelling urban form: a multidimensional typology of urban occupation for spatial analysis. Environ. Plan. B Urban Anal. City Sci. 46, 47–65. doi: 10.1177/2399808317700140
Ahmadi Vanhari, A., Ghaffari, A., and Tahbaz, M. (2016). The city’s physical evolution and its thermal reflection case study: Isfahan. Art Univ. Q. 17, 156–157.
Alexandri, E., and Jones, P. (2008). Temperature decreases in an urban canyon due to green walls and green roofs in diverse climates. Build. Environ. 43, 480–493. doi: 10.1016/j.buildenv.2006.10.055
Alijani, B., Tulabinezhad, M., and Sayadi, F. (2017). Calculation of heat island intensity based on urban geometry, (Case Study: District of Kucheh bagh in Tabriz). JSAEH 4, 99–112.
Boarnet, M., and Crane, R. (2001). The influence of land use on travel behavior: specification and estimation strategies. Transp. Res. Part A: Policy Pract. 35, 823–845. doi: 10.1016/S0965-8564(00)00019-7
Brownstone, D., and Golob, T. F. (2009). The impact of residential density on vehicle usage and energy consumption. J. Urban Econ. 65, 91–98. doi: 10.1016/j.jue.2008.09.002
Burgess, E. W. (2008). The growth of the city: an introduction to a research project. City 18, 71–78. doi: 10.1007/978-0-387-73412-5_5
Changyeon, L. (2020). Impacts of two-scale urban form and their combined effects on commute modes in U.S. metropolitan areas. J. Transp. Geogr. 88:102821. doi: 10.1016/j.jtrangeo.2020.102821
Chow, W. T. L., Pope, R. L., and Brazel, A. J. (2010). Observing and modelling the nocturnal park cool island of an arid city: horizontal and vertical impacts. Theor. Appl. Climatol. 103, 197–211. doi: 10.1007/s00704-010-0293-8
Dadashi, R. A., and Aliabadi, K. (2017). The Role of geographic components on the temperature dispersion at urban area using remote sensing techniques case study of mashhad city. Geographical Planning of Space 7, 131–142.
Dahal, K. R., Benner, S., and Lindquist, E. (2017). Urban hypotheses and spatiotemporal characterization of urban growth in the Treasure Valley of Idaho, USA. Appl. Geogr. 79, 11–25. doi: 10.1016/j.apgeog.2016.12.002
Dry Bulb (2001). Wet Bulb and dew point temperatures. In engineering toolbox. Available at: https://www.engineeringtoolbox.com/dry-wet-bulb-dew-point-air-d_682.html#:~:text=The%20evaporation%20from%20the%20wet,temperature%20and%20the%20Dew%20Point [Accessed February 5, 2020].
Equere, V., Mirzaei, P. A., and Riffat, S. (2020). Definition of a new morphological parameter to improve prediction of urban heat island. Sustain. Cities Soc. 56:102021. doi: 10.1016/j.scs.2020.102021
Halabian, A., and Soltani, Z. (2020). Analysis of spatial- temporal variation of urban thermal islands and landuse based on an environmental approach in Shiraz. Urban Structure and Function Studie 7, 73–97. doi: 10.22080/usfs.2020.15874.1736
Hashemi Darebadami, S., Darvishi Boloorani, A., AlaviPanah, S. K., and Bayat, R. (2019). Investigation of changes in surface urban heat-island (SUHI) in day and night using multi-temporal MODIS sensor data products (Case Study: Tehran metropolitan). JGS 19, 113–128.
He, B., and Zhu, J. (2018). Constructing community gardens? Residents’ attitude and behavior towards edible landscapes in emerging urban communities of China. Urban For. Urban Green. 34, 154–165. doi: 10.1016/j.ufug.2018.06.015
Henao, J. J., Rendón, A. M., and Salazar, J. F. (2020). Trade-off between urban heat island mitigation and air quality in urban valleys. Urban Clim. 31:100542. doi: 10.1016/j.uclim.2019.100542
Jones, C., and Kammen, D. M. (2014). Spatial distribution of U.S. household carbon footprints reveals suburbanization undermines greenhouse gas benefits of urban population density. Environ. Sci. Technol. 48, 895–902. doi: 10.1021/es4034364
Karimi Firozjaei, M., Kiavarz Mogaddam, M., and Alavi Panah, S. K. (2017). Monitoring and predicting spatial-temporal changes heat island in babol city due to urban sprawl and land use changes. JGIT 5, 123–151.
Kaza, N. (2020). Urban form and transportation energy consumption. Energy Policy 136:111049. doi: 10.1016/j.enpol.2019.111049
Lei, H., Wu, F., and Xie, X. (2020). The spatial characteristics and relationships between landscape pattern and ecosystem service value along an urban-rural gradient in Xi’an city, China. Ecol. Indic. 108:105720. doi: 10.1016/j.ecolind.2019.105720
Li, Z. J., Quan, S., and Yang, P. P.-J. (2016). Energy performance simulation for planning a low carbon neighborhood urban district: a case study in the city of Macau. Habitat Int. 53, 206–214. doi: 10.1016/j.habitatint.2015.11.010
Li, H., Sodoudi, S., Liu, J., and Tao, W. (2020). Temporal variation of urban aerosol pollution island and its relationship with urban heat island. Atmos. Res. 241:104957. doi: 10.1016/j.atmosres.2020.104957
Li, H., Zhou, Y., Li, X., Meng, L., Wang, X., Wu, S., et al. (2018). A new method to quantify surface urban heat island intensity. Sci. Total Environ. 624, 262–272. doi: 10.1016/j.scitotenv.2017.11.360
Liang, Z., Wu, S., Wang, Y., Wei, F., Huang, J., Shen, J., et al. (2019). The relationship between urban form and heat island intensity along the urban development gradients. Sci. Total Environ. 708:135011. doi: 10.1016/j.scitotenv.2019.135011
Liu, C., and Shen, Q. (2011). An empirical analysis of the influence of urban form on household travel and energy consumption. Comput. Environ. Urban. Syst. 35, 347–357. doi: 10.1016/j.compenvurbsys.2011.05.006
Lotfi, S., Shole, M., Farmand, M., and Fattah, K. (2016). Urban Design Criteria for Zero-Carbon Neighborhoods. Naqshejahan 6, 80–92.
Lowry, J., and Lowry, M. (2014). Comparing spatial metrics that quantify urban form. Comput. Environ. Urban. Syst. 44, 59–67. doi: 10.1016/j.compenvurbsys.2013.11.005
Matkan, A. A., Nohegar, A., Mirbagheri, B., and Torkchin, N. (2014). Assessment relations of land use in heat islands using time series ASTER sensor data (Case study: Bandar Abbas city). J. GIS RS for Natur. Res. 5, 1–14.
Nakano, A., Bueno, B., Norford, L., and Reinhart, C. (2015). “Urban weather generator—a novel workflow for integrating urban heat island effect within urban design process.” in Proceedings of the 14th conference of international building performance simulation association (IBPSA). Hyderabad, India. 7–9 December 2015.
National Oceanic and Atmospheric Administration (2020). Temperature. US Dept of Commerce. Available at: https://www.weather.gov/source/zhu/ZHU_Training_Page/definitions/dry_wet_bulb_definition/dry_wet_bulb.html [Accessed February 5, 2020].
Park, J.-H., Kim, J., Yoon, D. K., and Cho, G. H. (2016). The influence of Korea’s green parking project on the thermal environment of a residential street. Habitat Int. 56, 181–190. doi: 10.1016/j.habitatint.2016.05.005
Parsons, R. L. (2015). Microsprinkler irrigation for frost protection of citrus in Florida. Acta Hortic. 1065, 1437–1442.
Peng, L. L. H., and Jim, C. Y. (2013). Green-roof effects on neighborhood microclimate and human thermal sensation. Energies 6, 598–618. doi: 10.3390/en6020598
Pourdeihimi, S., Tahsildoost, M., and Ameri, P. (2019). Effect of vegetation cover on energy consumption optimization due to reduction of urban heat Island intensity: case of tehran metropolitan area. Qtly. J. Environ. Policy Plan. Res. 5, 97–122.
Qi, J., Ding, L., and Lim, S. (2020). Ontology-based knowledge representation of urban heat island mitigation strategies. Sustain. Cities Soc. 52:101875. doi: 10.1016/j.scs.2019.101875
Sanagar Darbani, E., Rafieian, M., Hanaee, T., and Monsefi Parapari, D. (2020). The effects of urban heat Islands mitigation on human health through change in urban form hot and arid climate of mashhad (case study: graticular texture of shahed and organic texture of pachenar neighborhoods). J. Environ. Sci. Technol. 22, 375–387.
Shirvani Moghadam, S., and Saeedi Mofrad, S. (2018). The evaluation effectiveness of spatial distribution of population on urban climate change with emphasis on Heat Island. JSAUD 6, 79–88. doi: 10.22061/jsaud.2018.983
Shoshtari, S., Ghalehnoee, M., Ezzatian, V., Maleki, A., Paknejad, M., and Rahpou, R. (2018). Studying the combined method in identifying Urban Heat Islands and their Mitigation via Urban Green Spaces (case study: Isfahan City). Motaleate Shahri, 7, 41–54.
Soltandoost, M. Climate, architecture, air conditioning. YAZDA Publishing: Tehran, Iran. (2013). 2, p. 171.
Stevens, M. R. (2017). Does compact development make people drive less. J. Am. Plan. Assoc. 83, 7–18. doi: 10.1080/01944363.2016.1240044
Tao, M., Konopka, P., Ploeger, F., Riese, M., Müller, R., and Volk, C. M. (2015). Impact of stratospheric major warmings and the quasi-biennial oscillation on the variability of stratospheric water vapor. Geophys. Res. Lett. 42, 4599–4607. doi: 10.1002/2015GL064443
Torkashvand, M. G. (2016). Detection of heat Islands over Arak City based on spatial autocorrelation analysis. 9, 123–148.
Ward, H. C., Kotthaus, S., Järvi, L., and Grimmond, C. S. B. (2016). Surface urban energy and water balance scheme (SUEWS): development and evaluation at two UK sites. Urban Clim. 18, 1–32. doi: 10.1016/j.uclim.2016.05.001
Yang, X., Peng, L. L., Jiang, Z., Chen, Y., Yao, L., He, Y., et al. (2020). Impact of urban heat island on energy demand in buildings: local climate zones in Nanjing. Appl. Energy 260:114279. doi: 10.1016/j.apenergy.2019.114279
Yang, J., Shi, B., Xia, G., Xue, Q., and Cao, S. J. (2020). Impacts of urban form on thermal environment near the surface region at pedestrian height: a case study based on high-density built-up areas of Nanjing City in China. Sustainability 12:1737. doi: 10.3390/su12051737
Zandi, R., Karami, M., and Taheri, J. (2020). The role of land use changes in spatial form of heat islands in Mashhad city. Physical Social Planning 6, 93–104. doi: 10.30473/psp.2020.6590
Keywords: Grasshopper, Rhinoceros, Tabriz, urban heat island, urban weather generator, form typologies
Citation: Abdi Z, Alizadeh H, Mohammadi S and Sabouri S (2023) Analysis of urban form typology using urban heat island indicators: Case study of Ferdous neighborhood of Tabriz. Front. Ecol. Evol. 10:1065538. doi: 10.3389/fevo.2022.1065538
Edited by:
Xuezhen Zhang, Institute of Geographic Sciences and Natural Resources Research (CAS), ChinaReviewed by:
Ata Chokhachian, Technical University of Munich, GermanyWenjian Pan, Huazhong University of Science and Technology, China
Suraj Kumar Singh, Gyan Vihar University, India
Copyright © 2023 Abdi, Alizadeh, Mohammadi and Sabouri. This is an open-access article distributed under the terms of the Creative Commons Attribution License (CC BY). The use, distribution or reproduction in other forums is permitted, provided the original author(s) and the copyright owner(s) are credited and that the original publication in this journal is cited, in accordance with accepted academic practice. No use, distribution or reproduction is permitted which does not comply with these terms.
*Correspondence: Zanyar Abdi, emFueWFyLmFiZGkxOTk2QGdtYWlsLmNvbQ==