 Yuan Liu
 Yulong Guo
 Guangxing Ji
95% of researchers rate our articles as excellent or good
Learn more about the work of our research integrity team to safeguard the quality of each article we publish.
Find out more
ORIGINAL RESEARCH article
Front. Ecol. Evol. , 10 January 2023
Sec. Environmental Informatics and Remote Sensing
Volume 10 - 2022 | https://doi.org/10.3389/fevo.2022.1058055
This article is part of the Research Topic Hydrology, Water Resources, and Ecosystem Sustainable Development View all 10 articles
The Lancang River Basin (LCRB) is the largest international river in Southeast Asia, and any change in its streamflow, i.e., due to the ecological environment and runoff, may lead to disputes between countries to a certain extent. However, the impact of vegetation change on streamflow in the LCRB needs to be clarified. To assess the impact of vegetation change on streamflow in the LCRB, the functional relationship between Budyko parameter (ω) and Normalized Difference Vegetation Index (NDVI) was first computed for constructing a modified Budyko formula. Finally, we quantitatively estimated the influence of different factors on streamflow variation in the LCRB using the modified Budyko formula and the elastic coefficient method. The conclusions were as follows: (1) A sudden change in streamflow at the Yunjinghong hydrological station appeared in 2005; (2) Budyko parameter (ω) has a good linear functional relationship with NDVI in the LCRB (p < 0.01); ND (3) vegetation variation played the largest driving force behind streamflow variation in the LCRB, accounting for 34.47%. The contribution rates of precipitation, potential evaporation, and anthropogenic activities on streamflow variation from 1982 to 2015 were 16.83, 17.61, and 31.09%, respectively.
Since the Industrial Revolution, the global temperature rise has been confirmed by a large number of climate observation data (Allen et al., 2009; Yin et al., 2021). The rise in global temperature affects the changes in different events such as precipitation, terrestrial water storage, runoff, and vegetation (Zhu et al., 2016; Chen et al., 2019; Jing et al., 2020a,b; Yin et al., 2022a), leading to frequent occurrences of extreme meteorological and hydrological disasters (Yin et al., 2018, 2022b; Gu et al., 2022; Ji et al., 2022a), which in turn have a series of huge and far-reaching impacts on human health, industrial and agricultural production, and social economy (Moore and Diaz, 2015). Climate warming has also become a major global social problem of common concern to all mankind (Tilley, 2015). In recent decades, many vegetation restoration projects have been undertaken across China, and the vegetation coverage has increased rapidly (Wei et al., 2008; Lü et al., 2015). Vegetation plays a vital role in terrestrial ecosystems and is involved in the process of radiation balance and hydrological cycle, which effectively regulates the ecological environment (Ji et al., 2021a). Vegetation change affects the streamflow to a large extent by changing hydrological processes (vegetation transpiration and interception) and then affects the availability of water resources in the river basin (Bi et al., 2020; Ji et al., 2022b). Runoff is a vital part of the hydrological cycle. Streamflow variation directly affects human activity and life, and its sustainable development in the river basin. Previous studies found that, under the comprehensive influence of various factors, the streamflow of many rivers in the world shows a significantly decreasing trend (Vörösmarty, 2000; Ji et al., 2021b). Therefore, calculation of the impact of vegetation changes on streamflow quantitatively helps to evaluate the hydrological effects of ecological restoration measures and provide scientific guidance for water resource management and ecological environmental protection in the river basin.
To assess the impact of vegetation change on the water cycle, many scholars carried out relevant research works. Liang et al. (2015) found that Budyko parameter was positively correlated with the area of ecological restoration in most river basins of the Loess Plateau and ecological restoration measures are the leading factor for the decline in runoff in most watersheds. Li S. et al. (2016) found that the Normalized Difference Vegetation Index (NDVI) in the Kuye River basin showed a significant increase in the trends after 2000, while the runoff coefficient showed a significant decline in the trends, mainly because the vegetation change led to a reduction in surface albedo and a significant increase in vegetation evapotranspiration eventually led to a decline in runoff. Li Y. et al. (2016) analyzed the impact of climate change and human activities on the runoff in the middle and the lower reaches of the Yellow River using the Budyko formula and the elastic coefficient method. They arrived at the conclusion that the change in the underlying surface caused by the conversion-of-farmland-to-forest project has been the main factor for causing this decline in runoff in the Kuye River basin since 2000. Wang et al. (2020) discovered that a 1% increase of vegetation coverage would increase by 3~4 mm evapotranspiration, while ecological restoration plays an important role in the decline in runoff in the middle reaches of the Yellow River. Most of the studies calculated the contribution of underlying surface change to runoff through the change in Budyko parameter, but the functional relationship between vegetation change and Budyko parameter was not clearly given because of which we cannot directly quantify the contribution of vegetation change to runoff.
The Lancang River Basin (LCRB) is the largest international river in Southeast Asia (Jing et al., 2020c). For transboundary watersheds, changes in its streamflow, i.e., the ecological environment and runoff, may lead to disputes between countries to a certain extent. In recent years, due to the combined action of human activities and climate change, the vegetation and streamflow of the LCRB have undergone significant changes. Therefore, many scholars have analyzed the characteristics and influencing factors of vegetation changes and streamflow changes in the LCRB. Li and Liu (2012) investigated the change characteristics of vegetation coverage in the LCRB and its relationship with climate factors. Their results illustrated that the vegetation coverage in the LCRB had a fluctuating and increasing tendency during the period from 2000 to 2009 and that each year's average annual NDVI was >0.45, indicating that its ecological environment showed a trend in improvement. Fan et al. (2012) analyzed the dynamic changes in vegetation coverage in the LCRB from 2001 to 2010, and the results showed that, from 2001 to 2010, the vegetation coverage in the LCRB showed an upward trend as a whole. There were regional differences in the change rate of NDVI, and most of the regions showed an increasing trend in the change rate of NDVI. Tang et al. (2014) found that the impact of human activities on streamflow variation in the LCRB is slightly greater than that of climate change (54.6 and 45.4%, respectively). Han et al. (2019) assessed the impact of climate factors and human activities on streamflow variation in the Lancang River Basin. Compared to the base period (1980–1986), the contribution rates of human activities to streamflow variation were 43 (1987–2007) and 95% (2008–2014), respectively. Liu et al. (2020) found that the annual average precipitation (Pr) of the LCRB did not decrease significantly, the annual potential evaporation (ET0) increased significantly, and the runoff depth (R) decreased significantly. Compared with the base period (1961–2004), the reduction in Pr is the main reason for the decline in runoff depth during the 2005–2015 period, with a contribution rate of 45.64%. The contribution rates of ET0 and human activities to streamflow variation were 13.91 and 40.45%, respectively. However, a few studies have computed the quantitative contribution of vegetation variation to streamflow variation in the LCRB.
Therefore, this study assesses the impact of vegetation variation on the streamflow variation in the Lancang River Basin (LCRB) by the following three steps: (1) Analyzing the change characteristics of meteorological and hydrological elements; (2) calculating the functional relationship between the underlying surface parameters (ω) and NDVI, and constructing a modified Budyko formula; and (3) estimating quantitatively the influence of human activities, climate factors, and vegetation on streamflow variation in the Lancang River Basin using the modified Budyko formula. This study is conducive to understanding the impact of ecological restoration project on water cycle and is beneficial to the management and rational utilization of water resources in the LCRB.
The Lancang River Basin (LCRB) originates from Jifu Mountain in the Qinghai Province and flows through Qinghai, Tibet, and Yunnan provinces, between 94.39°~103.66°E and 20.87°~33.36°N (Figure 1). After flowing out of China, the river is called the Mekong River. The terrain in the LCRB is high and fluctuates greatly. Therefore, the climate in the river basin varies greatly. The temperature and precipitation increase from the north to the south. The higher the altitude, the lower the temperature and the lesser the precipitation. The runoff of the river basin mainly comes from precipitation, groundwater, and snowmelt. Dry and wet seasons in the LRCB are distinct. The wet season lasts from May to October, and the dry season lasts from November to April. The precipitation in the wet season accounts for ~85%, and heavy rains are mostly concentrated during the period from June to August. Few torrential rains are witnessed in the upper reaches, while main torrential rain areas are witnessed in the middle reaches of the basin. Due to the changeable climate type and geographical environment, the vegetation distribution in the river basin shows latitude zonality and vertical zonality. The vegetation types include alpine vegetation, meadow, shrub, coniferous forest, mixed coniferous and broad-leaved forest, and broad-leaved forest. The NDVI value of the river basin rises from northwest to southeast with strong spatial heterogeneity. The low NDVI values are mostly distributed in the Naqu, Yushu, the west of Chengdu, and the north of Diqing, with an altitude above 4,000 m. The vegetation types are mainly alpine, alpine meadow, and shrub. The high NDVI values are mainly distributed in Pu'er and Xishuangbanna with rich vegetation types, mainly subtropical and tropical vegetation (Zhang et al., 2020).

Figure 1. The location of hydro-meteorological stations in and around the study region.
The NDVI data from 1982 to 2015 were obtained from NOAA Climate Data Record Advanced Very High Resolution Radiometer (NOAA CDR AVHRR) data (https://www.ncei.noaa.gov/products/climate-data-records/normalized-difference-vegetation-index). First, data format conversion and projection conversion were carried out on the NDVI data. Then, the average value composite method eliminated the influence of some random factors and was applied for calculating the average of the grid. Finally, the NDVI data set of the Lancang River Basin was obtained.
The data of meteorological stations in and around the Lancang River Basin from 1982 to 2015 were gathered from China Meteorological Data Service Center's science data sharing service network (https://www.cma.gov.cn/), mainly including precipitation, temperature, wind speed, and relative humidity.
The runoff data of the Yunjinghong hydrological station from 1982 to 2015 were obtained from the Hydrological Yearbook and the National Earth System Science Data Center (http://www.geodata.cn/).
The Bernaola-Galvan segmentation algorithm (BG segmentation algorithm) is a heuristic mutation detection method for non-stationary time series data (Bernaola-Galvan and Ch Ivanov, 2001). BG segmentation algorithm divides non-stationary sequence data into multiple stationary sequences. Each subsequence datum has different average values and represents different physical backgrounds. After decomposition, each subsequence datum has the variability of average periodic scale. Therefore, BG segmentation algorithm is a new method to effectively detect mutation years. Its calculation steps are as follows (Feng et al., 2005; Wang et al., 2018):
(1) Taking the ith point as the dividing point, calculate the average value and standard deviation of the left and right segments around the ith point, which are recorded as μL(i), μR(i), SL(i), and SR(i) (I = 1, 2, 3…, N – 1), respectively.
(2) Use the t-test to measure the significance of the difference between UL and UR and is rescored as T(i):
SD is the joint variance; NL and NR are the numbers of samples in the left and right segments around the ith point, respectively.
(3) Calculate the significance probability P(Tmax) corresponding to the maximum value (Tm) of t-test statistics by the Monte Carlo simulation.
γ = 4.19InN – 11.54, δ = 0.40, N is the sample of the time series x(t), v = N – 2, IX(a, b) is the incomplete β function. P0 is a threshold set in this study, and its value range is [0.5, 0.95]. If P(Tmax) ≥ P0, X(t) is divided into two sequences; otherwise, it is not divided.
(4) Repeating Steps (1)–(3), respectively, for the two newly sequences to detect all mutation points. In addition, to ensure the effectiveness of statistics, if the length of the subsequence is ≤ l0, the subsequence will not be segmented. Furthermore, l0 ≥ 25.
The Budyko hypothesis represents the fact that actual evapotranspiration is limited by water supply conditions (mainly precipitation) and energy supply conditions (mainly potential evaporation). It is an effective method to decompose quantitatively the impact of different factors on streamflow variation, which has been used widely (Wu et al., 2017; Ji et al., 2021c).
The water balance equation in a basin is given as follows:
In the formula, R is the runoff depth, Pr is the precipitation, and ET is the actual evaporation, which can be calculated according to the Choudhury-Yang formula (Choudhury, 1999; Yang et al., 2008).
ω is the characteristic parameter of the underlying surface, and its value reflects the change of human activity intensity. Human activities can affect runoff variation in the Lancang River Basin from many aspects, including vegetation restoration projects, construction of water conservancy engineering facilities, urban residents' domestic water, and agricultural irrigation water. ET0 represents the potential evaporation (mm), which can be calculated by the Penman-Monteith formula.
Combining Equations 5 and 6, we converted the water balance equation to the following equation:
Li et al. (2013) studied the relationship between NDVI and Budyko parameter (ω) in 26 rivers and found that there is a good univariate linear function relationship between them.
The elasticity coefficient is equal to the ratio of the dependent variable change rate to the independent variable change rate, which analyzes the sensitivity of dependent variable to independent variable (Liu et al., 2012). The greater the absolute value of elasticity coefficient, the stronger the sensitivity of streamflow to various influencing factors. The elasticity coefficient of streamflow to other factors can be expressed as follows:
εx is the elastic coefficient; R is the runoff depth (mm); and x refers to specific factors, such as precipitation, potential evaporation, and vegetation. If εx > 0, it indicates that runoff increases with the increase in variable x and vice versa. The greater the absolute value of εx, the stronger the sensitivity of runoff to variable x.
The elastic coefficients of runoff on precipitation (εPr), potential evaporation (εET0), underlying surface characteristic parameters (εω), and NDVI (εNDVI) can be calculated by Equations 12–15 (Xu et al., 2014; Ji et al., 2022b).
The runoff time series data are divided into two periods: the base period (T1) and the change period (T2). The average annual precipitation rates in the T1 and T2 periods are marked as Pr1 and Pr2. The change in annual precipitation (ΔPr) from T1 to T2 period is expressed as follows:
Similarly, the change in potential evaporation (ΔET0), characteristic parameters of underlying surface (Δω) and NDVI (ΔNDVI) from T1 to T2 all are calculated.
ΔRPr, ΔRE0, ΔRw, ΔRNDVI, and ΔRH, respectively, represent the runoff depth change values caused by the change in precipitation, potential evaporation, underlying surface feature parameters, NDVI, and anthropogenic factors from the T1 to T2 period.
ηRPr, ηRET0, ηRNDVI, and ηRH, respectively, represent the contribution rates of precipitation, potential evaporation, NDVI, and human factors on runoff variation.
The linear regression method was used to analyze the change trends of runoff depth, precipitation, and potential evaporation in the LCRB from 1982 to 2015, and the results are shown in Figure 2.
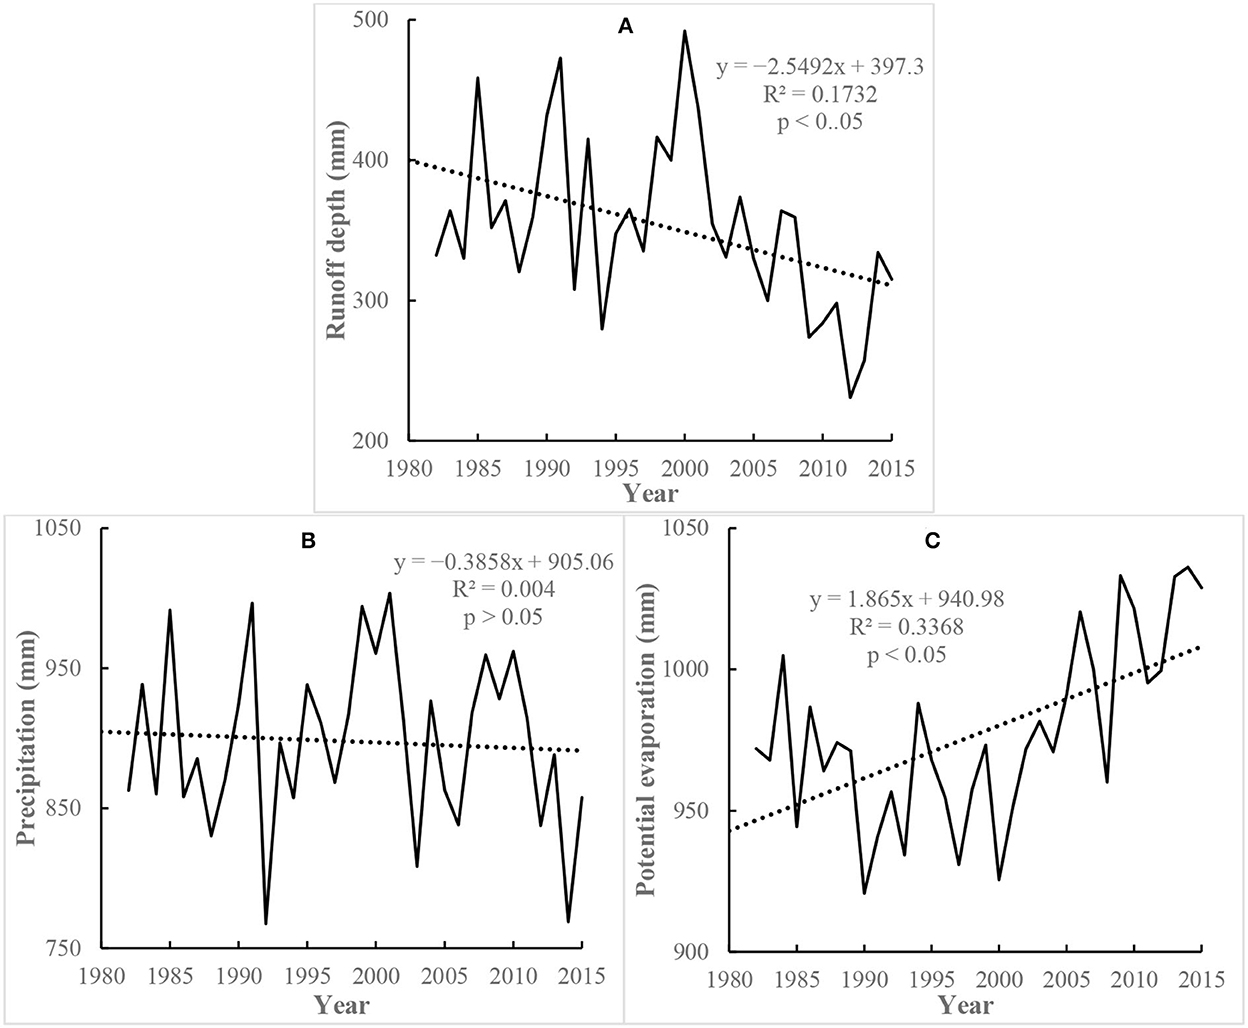
Figure 2. Interannual variation of runoff depth (A), precipitation (B), and potential evaporation (C) in the Lancang River Basin (LCRB) from 1982 to 2015.
From 1982 to 2015, the runoff depth of the LCRB showed a fluctuation and significant reduction trend (p < 0.05), with a slope of −2.5492 mm/a (Figure 2A). During the period of 1982–2015, the runoff depth of the river basin in 2,000 was the maximum (492.05 mm), and the runoff depth in 2012 was the lowest (230.91 mm).
During the period of 1982–2015, the precipitation showed a non-significant decreasing trend (p > 0.05), with a slope of −0.3858 mm/a (Figure 2B). From 1982 to 2015, the precipitation in 2001 was the maximum (1,003.63 mm) and that in 1992 was the lowest (767.51 mm).
There was a significant fluctuating growth trend in potential evaporation (p < 0.05), with a slope of 1.865 mm/a (Figure 2C). During the period of 1982–2015, the potential evaporation was the maximum in 2014 (1,036.25 mm) and was the minimum in 1991 (920.77 mm).
In this study, the BG segmentation algorithm is used to distinguish the abrupt years of the annual runoff data from 1982 to 2015 in the LCRB (Figure 3). P0 is set to 0.68 and l0 is set to 25. From Figure 3, we found that t-test statistics takes the largest value in 2005 and it is ~3.75, which showed that the annual runoff of the Yunjinghong hydrological station changed dramatically in 2005 and its mutation year may be fixed as 2005. According to formula (4), we calculated the significance probability P(Tmax), corresponding to the maximum value (Tm) of t-test statistics, by the Monte Carlo simulation. If P(Tmax) > P0, we believe that the sudden change in runoff is significant. The result showed that the significance probability P(Tmax), corresponding to the maximum value (Tm) of t-test statistics (2005), is 0.688 > 0.68. This result further proves the reliability of the result that the annual runoff series data of the Yunjinghong hydrological station mutated in 2005.
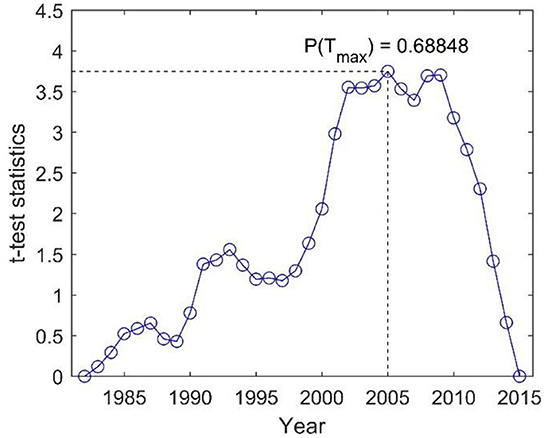
Figure 3. The Bernaola-Galvan (BG) segmentation result of runoff depth in the Lancang River Basin (LCRB) from 1982 to 2015.
For the Choudhury-Yang formula, if the values of precipitation and potential evaporation in each year during the period of 1982–2015 can be obtained, we calculated the Budyko parameter (ω) in each year. The changing trend of NDVI and Budyko parameter (ω) in the LCRB is shown in Figure 4. From 1982 to 2015, the NDVI of the Lancang River Basin displayed a significant fluctuation increasing trend (p < 0.05), and its average annual growth rate was 0.0023/a (Figure 4A). The Budyko parameter (ω) displayed a significant growth trend (p < 0.05), with a slope of 0.094/10a (Figure 4B).
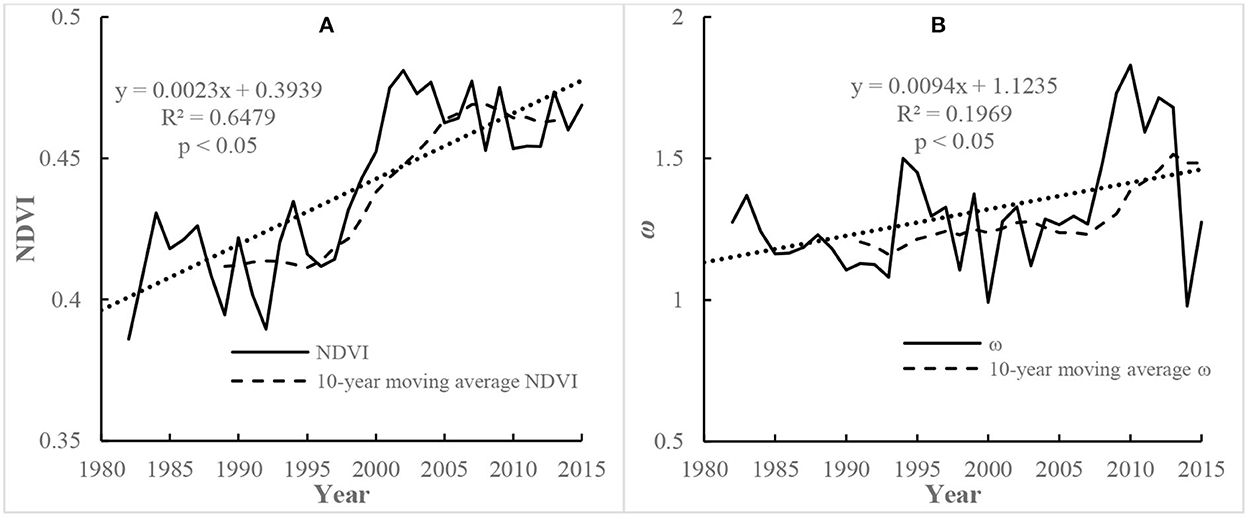
Figure 4. (A, B) Change trend of Normalized Difference Vegetation Index (NDVI) and Budyko parameter (ω) in the Lancang River Basin (LCRB) from 1982 to 2015.
In the Budyko formula, precipitation (Pr), potential evaporation (ET0), and underlying surface parameters (ω) are the three driving factors affecting streamflow change. ω denotes the characteristic parameters of the underlying surface and is applied to characterize the influence of human factors. Previous studies showed that vegetation changes have a significant impact on Budyko parameter (ω) (Zeng and Cai, 2016; Zhang et al., 2016; Abatzoglou and Ficklin, 2017). Li et al. (2013) studied the relationship between NDVI and Budyko parameter (ω) in 26 rivers and found that there is a good univariate linear function relationship between them.
To reveal the quantitative relationship between vegetation and Budyko parameters and identify the impact of vegetation change on streamflow, this study established a linear functional equation between NDVI and Budyko parameter (ω) by the following two steps: (1) calculating the 10-year moving average value of NDVI and ω, respectively, and (2) calculating the coefficients (a and b) of the univariate linear regression equation by the least square method. Finally, a linear regression equation was obtained (Figure 5), a = 3.1418, b = −0.0928, and its R2 is 0.5105 and adjusted R2 is 0.4892 (p < 0.01).
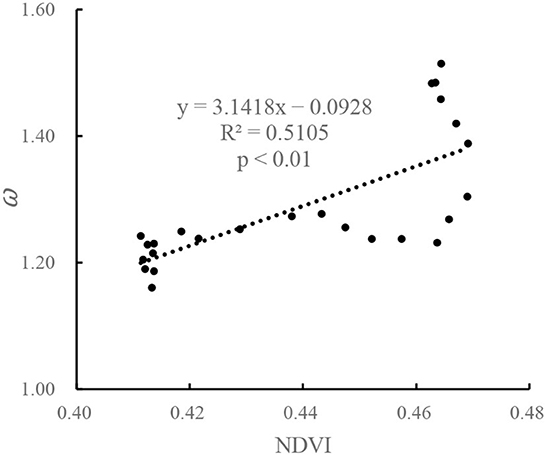
Figure 5. The functional relationship between Normalized Difference Vegetation Index (NDVI) and Budyko parameter (ω).
According to the BG segmentation result of runoff data from 1982 to 2015, we divided the entire study period into two phases: T1 (1982–2004) and T2 (2005–2015). Table 1 displays the values of different variables in T1 (1982–2004) and T2 (2005–2015) periods. The average runoff depths in the T1 (1982–2004) period were ~375.905 and 304.147 mm in the T2 (2005–2015) period. The average annual runoff depth decreased by 71.758 mm from T1 to T2, and the relative change rate was −19.09%. The precipitation decreased by 18.336 mm from 903.475 mm in the T1 period to 885.139 mm in the T2 period, with a relative change rate of −2.03%. The potential evaporation, Budyko parameter (ω), and NDVI all increased from the T1 period to the T2 period, and their relative change rates were 5.15, 17.39, and 8.18%, respectively.
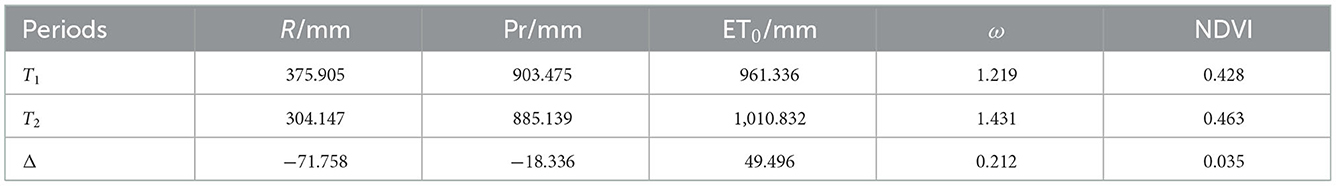
Table 1. The eigenvalues of climate, hydrology, and Normalized Difference Vegetation Index (NDVI) variables in the Lancang River Basin (LCRB).
In this study, Budyko equation and the elastic coefficient method were used to calculate the influence of various factors on the streamflow variation in the LCRB (Table 2). The elastic coefficient of runoff on precipitation (εPr) is 1.73, indicating that a 10% increase in precipitation causes a 17.3% increase of streamflow. The elastic coefficients of potential evaporation (εET0), underlying surface characteristic parameters (εω) and NDVI (εNDVI), are −0.73, −0.83, and −0.89, respectively. These values indicated that a 10% increase of potential evaporation, ω, and NDVI decreases by 7.3, 8.3, and 8.9% of streamflow. Overall, the streamflow change in the LRCB is the most sensitive to precipitation and the least sensitive to potential evaporation.

Table 2. Attribution analysis of streamflow variation in the Lancang River Basin (LCRB).
Compared to the period during 1982–2004, the contribution rate of climatic factors to runoff depth variation during the period from 1982 to 2015 is 34.47%. Among them, precipitation and potential evaporation contributed 16.83 and 17.61%, respectively. Moreover, the contribution rates of vegetation variation and anthropogenic activities to runoff depth variation during the period from 1982 to 2015 are 34.47 and 31.09%, respectively. Overall, vegetation variation played the largest driving force for streamflow variation in the LCRB.
The change in river runoff is caused by many factors, such as human activities, climate change, and vegetation change. The ecological and hydrological effects of vegetation change serves as the research focus of hydrology and ecology. Many studies assumed that the increase in afforestation or vegetation reduces the runoff (Zhang et al., 2021; Ji et al., 2022b), and the results of this study are consistent with the conclusion (Table 2). With further restoration of vegetation, the NDVI increases significantly. Although the precipitation in this period increased by 2.03% and the potential evapotranspiration increased by 5.15%, the runoff decreased by 19.19%, indicating that vegetation gradually became the dominant factor in controlling the runoff changes (Tables 1, 2). Vegetation changes can affect runoff changes in many ways as per the following points: (1) the increase in vegetation leaf area increases evapotranspiration from plant leaves, leading to a decrease in soil water content, which in turn affects the surface runoff and (2) the increase in vegetation coverage effectively increases the interception capacity of rainfall, thus influencing the variability of runoff. However, vegetation restoration cannot lead to an unlimited increase of NDVI; therefore, with the vegetation restoration and stabilization, the vegetation change will not have a great impact on the runoff change.
The implementation of a series of water and soil conservation and ecological restoration measures in the LCRB has significantly changed the underlying surface parameters (ω). The value of ω in the Budyko equation is closely related to soil, terrain, and vegetation coverage types. The soil and terrain do not change in a short time, while vegetation factors become the main factors affecting ω. NDVI and ω showed a strong synergistic trend (Figure 5). The contribution analysis of vegetation restoration to runoff changes verifies further the fact that the increase in vegetation coverage causes the attenuation of runoff in the LCRB (Table 2).
The situation that improper vegetation reconstruction reduces water resources should be highly concerning. The government should reasonably plan vegetation restoration according to the actual conditions prevalent at the river basin. Yang et al. (2019) analyzed the impact of different vertical structures on water yield conducting a simulated rainfall experiment in the field, and recorded that the vertical structure of vegetation is an important factor influencing water yield. Therefore, according to the vegetation coverage conditions, the area can be divided into two: vegetation restoration period and key protected areas. The key protection areas can be optimized and the vegetation structure adjusted to increase the runoff as much as possible while keeping the ecological environment less changed. Moreover, the vegetation restoration area should be based on artificial vegetation restoration, and the restoration structure of vegetation should be planned scientifically in the restoration process to control the reduction of runoff flow as much as possible, and, these works need to be studied further.
Although this study has analyzed in depth the sensitivity of streamflow variation in vegetation variation in the LCRB, there are still some indefiniteness as given in the following points: (1) There are a few meteorological stations in the study area. To increase the number of meteorological stations, some meteorological station data outside the study area are added to the study, but there are only 29 meteorological stations. Obtaining the mean value of meteorological elements' data in the LCRB through the Kriging interpolation method would lead to some indefiniteness. (2) The attribution analysis of streamflow variation assumes that the precipitation, potential evaporation, and underlying surface parameter are independent. However, in fact, the three variables are interrelated. Climate change affects the growth of vegetation (Liu et al., 2016). The underlying surface change also provides feedback on atmospheric movement and affects regional and even global climate change. (3) The water conservancy project built by humans directly affects the temporal and spatial changes of monthly and annual runoff. However, this study considers only the impact of ecological restoration on runoff, neglecting the impact of water and soil conservation engineering measures on runoff leads to some indefiniteness.
In the follow-up study, the water heat coupling model (Leuning et al., 2008; Zhang et al., 2018) reflecting the information on vegetation change should be used for accurately simulating the hydrological process of streamflow variation affected by climate factors, vegetation variation, and reservoir operation. In addition, most of the studies ignored the influence of climate change on the vegetation in the river basin and did not distinguish the contribution rate of human activities and climate factors to vegetation change. Subsequently, we will calculate the contribution of vegetation restoration caused by climate change to runoff change.
Based on the meteorological, hydrological, and NDVI data of the Lancang River Basin from 1982 to 2015, this study analyzed first the change characteristics of meteorological and hydrological elements. Then, the functional relationship between Budyko parameter (ω) and NDVI was calculated for constructing a modified Budyko formula. Finally, we estimated quantitatively the influence of vegetation variation on streamflow variation in the LCRB using the modified Budyko formula and the elastic coefficient method.
The conclusions showed that (1) the sudden change in streamflow at the Yunjinghong hydrological station appeared in 2005, (2) Budyko parameter (ω) has a good linear functional relation with NDVI in the LCRB (p < 0.01), and (3) vegetation variation played the largest driving force for streamflow variation in the LCRB, accounting for 34.47%. The contribution rates of precipitation, potential evaporation, and anthropogenic activities on streamflow variation from 1982 to 2015 are 16.83, 17.61, and 31.09%, respectively.
Publicly available datasets were analyzed in this study. The names of the repository/repositories and accession number(s) can be found in the article/supplementary material.
Conceptualization: GJ. Data curation: YL, JH, XW, and YG. Methodology and writing—original draft: YL and GJ. Funding acquisition: WC, LL, and JH. Project administration: WC and LL. Writing—review and editing: WC, LL, and GJ. All authors contributed to the article and approved the submitted version.
This research work was funded by the National Key R&D Program of China (2021YFD1700900), the National Natural Science Foundation of China (42077004), the Research Project of Henan Science and Technology Think Tank (HNKJZK-2022-04C), and the Special Fund for Top Talents in Henan Agricultural University (30501031).
The authors declare that the research was conducted in the absence of any commercial or financial relationships that could be construed as a potential conflict of interest.
All claims expressed in this article are solely those of the authors and do not necessarily represent those of their affiliated organizations, or those of the publisher, the editors and the reviewers. Any product that may be evaluated in this article, or claim that may be made by its manufacturer, is not guaranteed or endorsed by the publisher.
Abatzoglou, J., and Ficklin, D. (2017). Climatic and physiographic controls of spatial variability in surface water balance over the contiguous United States using the Budyko relationship. Water Resour. Res. 53, 7630–7643. doi: 10.1002/2017WR020843
Allen, M. R., Frame, D. J., Huntingford, C., Jones, C. D., Lowe, J. A., Meinshausen, M., et al. (2009). Warming caused by cumulative carbon emissions towards the trillionth tonne. Nature 458, 1163–1166. doi: 10.1038/nature08019
Bernaola-Galvan, P., and Ch Ivanov, P. (2001). Nunes Amaral. Scale Invariance in the nonstationarity of human heart rate. nPhys 87, 1–4. doi: 10.1103/PhysRevLett.87.168105
Bi, Z., Li, Y., Lin, Y., Bu, T., and Huang, H. (2020). Quantitative assessment on the effects of vegetation changes on runoff based on Budyko theory in the Kuyehe River Basin of northern China. J. Beijng For. Univ. 42, 61–71.
Chen, C., Park, T., Wang, X., Piao, S., Xu, B., Chaturvedi, R. K., et al. (2019). China and India lead in greening of the world through land-use management. Nat. Sustain. 2, 122–129. doi: 10.1038/s41893-019-0220-7
Choudhury, B. J. (1999). Evaluation of an empirical equation for annual evaporation using field observations and results from a biophysical model. J. Hydrol. 216, 99–110.
Fan, N., Xie, G. D., Zhang, C. S., Chen, L., Li, W. H., and Cheng, S. K. (2012). Spatial-temporal dynamic changes of vegetation cover in Lancang River Basin during 2001–2010. Resour. Sci. 34, 1222–1231.
Feng, G. L., Gong, Z. Q., Dong, W. J., and Li, J. P. (2005). Abrupt climate change detection based on heuristic segmentation algorithm. Acta Phys. Sin. 54, 5494–5499. doi: 10.7498/aps.54.5494
Gu, L., Chen, J., Yin, J., Slater, L. J., Wang, H. M., Guo, Q., et al. (2022). Global increases in compound flood-hot extreme hazards under climate warming. Geophys. Res. Lett. 49, e2022GL097726. doi: 10.1029/2022GL097726
Han, Z., Long, D., Fang, Y., Hou, A., and Hong, Y. (2019). Impacts of climate change and human activities on the flow regime of the dammed Lancang River in Southwest China. J. Hydrol. 570, 96–105. doi: 10.1016/j.jhydrol.2018.12.048
Ji, G., Huang, J., Guo, Y., and Yan, D. (2022b). Quantitatively calculating the contribution of vegetation variation to runoff in the middle reaches of Yellow River Using an Adjusted Budyko Formula. Land 11, 535. doi: 10.3390/land11040535
Ji, G., Lai, Z., Xia, H., Liu, H., and Wang, Z. (2021b). Future runoff variation and flood disaster prediction of the Yellow River basin based on CA-Markov and SWAT. Land 10, 421. doi: 10.3390/land10040421
Ji, G., Lai, Z., Yan, D., Wu, L., and Wang, Z. (2022a). Spatiotemporal patterns of future meteorological drought in the Yellow River Basin based on SPEI under RCP scenarios. Int. J. Clim. Change Strat. Manag. 14, 39–53. doi: 10.1108/IJCCSM-01-2021-0004
Ji, G., Song, H., Wei, H., and Wu, L. (2021a). Attribution analysis of climate and anthropic factors on runoff and vegetation changes in the source area of the Yangtze River from 1982 to 2016. Land 10, 612. doi: 10.3390/land10060612
Ji, G., Wu, L., Wang, L., Yan, D., and Lai, Z. (2021c). Attribution analysis of seasonal runoff in the source region of the Yellow River using seasonal Budyko Hypothesis. Land 10, 542. doi: 10.3390/land10050542
Jing, W., Di, L., Zhao, X., Yao, L., Xia, X., Liu, Y., et al. (2020b). A data-driven approach to generate past GRACE-like terrestrial water storage solution by calibrating the land surface model simulations. Adv. Water Resour. 143, 103683. doi: 10.1016/j.advwatres.2020.103683
Jing, W., Zhang, P., Zhao, X., Yang, Y., Jiang, H., Xu, J., et al. (2020a). Extending GRACE terrestrial water storage anomalies by combining the random forest regression and a spatially moving window structure. J. Hydrol. 590, 125239. doi: 10.1016/j.jhydrol.2020.125239
Jing, W., Zhao, X., Yao, L., Jiang, H., Xu, J., Yang, J., et al. (2020c). Variations in terrestrial water storage in the Lancang-Mekong river basin from GRACE solutions and land surface model. J. Hydrol. 580, 124258. doi: 10.1016/j.jhydrol.2019.124258
Leuning, R., Zhang, Y. Q., Rajaud, A., Cleugh, H., and Tu, K. (2008). A simple surface conductance model to estimate regional evaporation using MODIS leaf area index and the Penman-Monteith equation. Water Resour. Res. 44, 1–17. doi: 10.1029/2007WR006562
Li, D., Pan, M., Cong, Z., and Wood, E. (2013). Vegetation control on water and energy balance within the Budyko framework. Water Resour. Res. 49, 969–976. doi: 10.1002/wrcr.20107
Li, S., Liang, W., Fu, B., Lü, Y., Fu, S., Wang, S., et al. (2016). Vegetation changes in recent large scale ecological restoration projects and subsequent impact on water resources in China's Loess Plateau. Sci. Total Environ. 569, 1032–1039. doi: 10.1016/j.scitotenv.2016.06.141
Li, Y., Liu, C., Zhang, D., Liang, K., Li, X., and Dong, G. (2016). Reduced runoff due to anthropogenic intervention in the Loess Plateau, China. Water 8, 458. doi: 10.3390/w8100458
Li, Y., and Liu, G. (2012). Characteristics of vegetation cover changes in Lancang Basin based on MODIS vegetation index products (MOD13). Resour. Sci. 34, 1214–1221.
Liang, W., Bai, D., Wang, F., Fu, B., Yan, J., Wang, S., et al. (2015). Quantifying the impacts of climate change and ecological restoration on streamflow changes based on a Budyko hydrological model in China's Loess Plateau. Water Resour. Res. 51, 6500–6519. doi: 10.1002/2014WR016589
Liu, C., Li, Y., Liu, X., Bai, P., and Liang, K. (2016). Impact of vegetation change on water transformation in the Middle Yellow River. Yellow River 38, 7–12.
Liu, H., Wang, Z., Ji, G., and Yue, Y. (2020). Quantifying the impacts of climate change and human activities on runoff in the Lancang River basin based on the Budyko Hypothesis. Water 12, 3501. doi: 10.3390/w12123501
Liu, X., Liu, C., Luo, Y., Zhang, M., and Xia, J. (2012). Dramatic decrease in streamflow from the headwater source in the central route of China's water diversion project: climatic variation or human influence? J. Geophys. Res. Atmosp. 117, 1–10. doi: 10.1029/2011JD016879
Lü, Y., Zhang, L., Feng, X., Zeng, Y., Fu, B., Yao, X., et al. (2015). Recent ecological transitions in China: greening, browning, and influential factors. Sci. Rep. 5, 8732. doi: 10.1038/srep08732
Moore, F. C., and Diaz, D. B. (2015). Temperature impacts on economic growth warrant stringent mitigation policy. Nat. Clim. Change 5, 127–131. doi: 10.1038/nclimate2481
Tang, J., Yin, X., Yang, P., and Zhang, Z. (2014). Assessment of contributions of climatic variation and human activities to streamflow changes in the Lancang River, China. Water Resour. Manag. 28, 2953–2966. doi: 10.1007/s11269-014-0648-5
Tilley, H. (2015). The global governance of climate change. Revista Portuguesa De Pneumologia 16SA, S83–S88.
Vörösmarty, C. J. (2000). Global water resources: vulnerability from climate change and population growth. Science 289, 284–288. doi: 10.1126/science.289.5477.284
Wang, F., Wang, Z. M., Yang, H. B., and Zhao, Y. (2018). Study of the temporal and spatial patterns of drought in the Yellow River basin based on SPEI. Sci. China Earth Sci. 61, 1098–1111. doi: 10.1007/s11430-017-9198-2
Wang, X., Yang, D., Fang, X., Cheng, C., Zhou, C., Zhang, X., et al. (2020). Impacts of ecological restoration on water resources in middle reaches of Yellow River. Bull. Soil Water Conserv. 40, 205–212.
Wei, X., Sun, G., Liu, S., Jiang, H., Zhou, G., and Dai, L. (2008). The forest-streamflow relationship in China: a 40-year retrospect. J. Am. Water Resour. Assoc. 44, 1076–1085. doi: 10.1111/j.1752-1688.2008.00237.x
Wu, J., Miao, C., Wang, Y., Duan, Q., and Zhang, X. (2017). Contribution analysis of the long-term changes in seasonal runoff on the Loess Plateau, China, using eight Budyko-based methods. J. Hydrol. 545, 263–275. doi: 10.1016/j.jhydrol.2016.12.050
Xu, X., Yang, D., Yang, H., and Lei, H. (2014). Attribution analysis based on the Budyko hypothesis for detecting the dominant cause of runoff decline in Haihe basin. J. Hydrol. 510, 530–540. doi: 10.1016/j.jhydrol.2013.12.052
Yang, C., Yao, W., Xiao, P., and Qin, D. (2019). Effects of vegetation cover structure on runoff and sediment yield and its regulation mechanism. J. Hydraul. Eng. 50, 1078–1085.
Yang, H., Yang, D., Lei, Z., and Sun, F. (2008). New analytical derivation of the mean annual water- energy balance equation. Water Resour. Res. 44, W03410. doi: 10.1029/2007WR006135
Yin, J., Gentine, P., Zhou, S., Sullivan, S. C., Wang, R., Zhang, Y., et al. (2018). Large increase in global storm runoff extremes driven by climate and anthropogenic changes. Nat. Commun. 9, 4389. doi: 10.1038/s41467-018-06765-2
Yin, J., Guo, S., Gentine, P., Sullivan, S. C., Gu, L., He, S., et al. (2021). Does the hook structure constrain future flood intensification under anthropogenic climate warming? Water Resour. Res. 57, e2020WR028491. doi: 10.1029/2020WR028491
Yin, J., Guo, S., Wang, J., Chen, J., Zhang, Q., Gu, L., et al. (2022a). Thermodynamic driving mechanisms for the formation of global precipitation extremes and ecohydrological effects. Sci. China Earth Sci. 65, 1–19. doi: 10.1007/s11430-022-9987-0
Yin, J., Slater, L., Gu, L., Liao, Z., Guo, S., and Gentine, P. (2022b). Global increases in lethal compound heat stress-hydrological drought hazards under climate change. Geophys. Res. Lett. 49, e2022GL100880. doi: 10.1029/2022GL100880
Zeng, R., and Cai, X. (2016). Climatic and terrestrial storage control on evapotranspiration temporal variability: analysis of river basins around the world. Geophys. Res. Lett. 43, 185–195. doi: 10.1002/2015GL066470
Zhang, D., Liu, X., Zhang, Q., Liang, K., and Liu, C. (2016). Investigation of factors affecting intra-annual variability of evapotranspiration and streamflow under different climate conditions. J. Hydrol. 543, 759–769. doi: 10.1016/j.jhydrol.2016.10.047
Zhang, D., Liu, X. M., and Bai, P. (2018). Different influences of vegetation greening on regional water-energy balance under different climatic conditions. Forests 9, 412. doi: 10.3390/f9070412
Zhang, J., Zhang, C., Bao, Z., Li, M., Wang, G., Guan, X., et al. (2021). Effects of vegetation cover change on runoff in Huang-Huai-Hai River Basin. Adv. Water Sci. 32, 813–823.
Zhang, T., Yi, G., and Zhang, T. (2020). Spatial-temporal variation in NDVI and its response ton climate in the Lanncang River Basin from 2000 to 2017. Geomat. Spatial Inform. Technol. 43, 49–53.
Keywords: streamflow variation, vegetation variation, attribution analysis, adjusted Budyko equation, Lancang River
Citation: Liu Y, Chen W, Li L, Huang J, Wang X, Guo Y and Ji G (2023) Assessing the contribution of vegetation variation to streamflow variation in the Lancang River Basin, China. Front. Ecol. Evol. 10:1058055. doi: 10.3389/fevo.2022.1058055
Received: 30 September 2022; Accepted: 13 December 2022;
Published: 10 January 2023.
Edited by:
Wenlong Jing, Guangzhou Institute of Geography, ChinaReviewed by:
Jiabo Yin, Wuhan University, ChinaCopyright © 2023 Liu, Chen, Li, Huang, Wang, Guo and Ji. This is an open-access article distributed under the terms of the Creative Commons Attribution License (CC BY). The use, distribution or reproduction in other forums is permitted, provided the original author(s) and the copyright owner(s) are credited and that the original publication in this journal is cited, in accordance with accepted academic practice. No use, distribution or reproduction is permitted which does not comply with these terms.
*Correspondence: Guangxing Ji,  Z3Vhbmd4aW5namlAaGVuYXUuZWR1LmNu
Disclaimer: All claims expressed in this article are solely those of the authors and do not necessarily represent those of their affiliated organizations, or those of the publisher, the editors and the reviewers. Any product that may be evaluated in this article or claim that may be made by its manufacturer is not guaranteed or endorsed by the publisher.
Research integrity at Frontiers
Learn more about the work of our research integrity team to safeguard the quality of each article we publish.