 Guilherme Sanches Corrêa-do-Nascimento
 Gustavo Rocha Leite
- 1Unidade de Medicina Tropical, Universidade Federal do Espírito Santo (UFES), Vitória, Brazil
- 2Programa de Pós Graduação em Biologia Animal (PPGBAN), Universidade Federal do Espírito Santo (UFES), Vitória, Brazil
Introduction: Rhodnius domesticus is a kissing bug with known occurrence around the Atlantic coast of South America and is considered to be the only endemic species of the Atlantic Forest for the Rhodniini tribe. In this study, we aimed to indicate the species trends in possible distribution in the current and paleoclimate scenarios from the last glacial maximum (LGM).
Methods: We revised R. domesticus distribution information and created ecological niche models (ENMs) between the current time and Pleistocene end scenarios for the study regions. Models were built and validated using Maxent, KUENM, and ENMeval packages in R and ArcMap. We considered the models' uncertainty when calculating the average model variance and using mobility-oriented parity (MOP) analyses to indicate extrapolation risk areas in transfer scenarios.
Results: We found 44 different geographical species records, and our current time models indicate suitable areas in coastal regions of the Atlantic and surrounding locations in higher and lower latitudes. Paleoclimate models indicate general suitability in coastal regions and change in suitability in the interior region through time.
Discussion: Our revision and ENMs indicate two main points: Despite the fact that R. domesticus records are spatial and time concentrated in some coastal regions of the Atlantic Forest, species could have a broader distribution area, including regions outside the biome delimitations in northeast and southwest areas of South America. Paleodistribution models indicate species broader distribution in Atlantic Forest-related areas in LGM and northern interior regions of South America from late Pleistocene to the current times. In glaciation scenarios, continental shelf distribution was relevant and species' different connectivity routes with other biomes may be developed after LGM.
Introduction
The triatomines, also known as Kissing Bugs, are mainly neotropical insects of the Triatominae subfamily (Monteiro et al., 2018). The group is well known to be the vector related to Chagas disease, and since this epidemiological discovery by Chagas (1909), advances in clarifying the group taxonomy (e.g., Lent and Wygodzinsky, 1979; Galvão et al., 2003), ecology (e.g., Forattini et al., 1978; Abad-Franch et al., 2015), and evolution (e.g., Abad-Franch et al., 2009; de Paula et al., 2021) were made by researchers.
One strategic epidemiological knowledge is on the species distribution. For this reason, fieldwork is constantly being carried out for the group (e.g., Silveira et al., 1984; Leite et al., 2011; Mendes-Sousa et al., 2020), and ecological niche models (ENMs) approaches, which indicate areas of suitable conditions based on abiotic factors, are also being developed in more recent years (e.g., Gurgel-Gonçalves and Cuba, 2009; Gurgel-Gonçalves et al., 2012; Bender et al., 2020; de Paula et al., 2021). Works on the compilation of species register also provide an extensive database on the triatomine distribution (Ceccarelli et al., 2018, 2022).
Despite the great effort bestowed in conducting studies on Kissing Bugs, many sylvatic species still have gaps related to their ecological traits (Noireau et al., 2005). That is the case of Rhodnius domesticus (Neiva and Pinto, 1923) (Hemiptera:Reduviidae:Triatominae), which also presents scarce sampling in some areas of its distribution (e.g. Mendes-Sousa et al., 2020; Corrêa-do-Nascimento et al., 2021) and has taxonomic incongruencies (e.g., Lent, 1942; Galvão and Gurgel-Gonçalves, 2014).
Rhodnius domesticus belongs to the Rhodniini tribe and has been considered the only endemic species of the Atlantic Forest for the group (Abad-Franch et al., 2009; Gurgel-Gonçalves et al., 2012). Evolutionary studies also indicated that the R. domesticus speciation event is one of the oldest in the tribe (Abad-Franch et al., 2009; de Paula et al., 2021). Other studies indicate its sister species to be Rhodnius neivai (Justi et al., 2016), which occurs in the northernmost areas of South America (Galvão et al., 2003). The distant distribution from the evolution groups and its early speciation event may be related to widely spread ancestor distribution or large dispersion history. Therefore, in addition to the general epidemiological importance of the species, R. domesticus paleodistribution could help understand ancestral patterns of distribution in Rhodniini evolution.
Paleodistribution studies for Atlantic Forest species are crucial for understanding the biogeographical history of biomes. A model using species with distinct distribution within the biome and theoretical delimitations indicates different patterns in geographical suitability and distinct trends related to biogeographical events, as a connection to the Amazon and distribution in paleoenvironmental scenarios (e.g., Carnaval and Moritz, 2008; Carnaval et al., 2009; Leite et al., 2016; Ledo and Colli, 2017). We trust that single-species distribution models can indicate rich insights into the diversity of biogeographical histories that compose the biomes.
This study explores the possible distribution areas of R. domesticus from the Pleistocene end to current environmental conditions. We revised species distribution information and created transferred ENMs for time and spatial scenarios of interest to reach this goal. Using this approach, we advanced the discussion on distribution uncertainties, challenged species endemism in Atlantic Forest, and indicated new areas for sample investigation. In paleoclimate models, we show relation to species distribution on the continental shelf, propose a history of colonization and in the northeast areas, discuss a possible Amazon connection, and hypothesize niche conservationism from the Amazonian ancestral. We also proposed a new approach to deal with consensus for several time scenarios.
Materials and methods
Species and study area
Rhodnius domesticus (Neiva and Pinto, 1923), Hemiptera:Reduviidae, is a kissing bug that, despite the specific epithet, is considered to have sylvatic habits (Lent, 1942) and records related to the Atlantic Forest (e.g., Abad-Franch et al., 2009; Gurgel-Gonçalves et al., 2012). We conducted the study in the Neotropics and near surrounding areas, comprising the region with species records and other possible areas of occurrence. A rectangle delimitated the study region with latitudes near 33 and−60 and longitude of −122 and−25 degrees (Figure 1A).
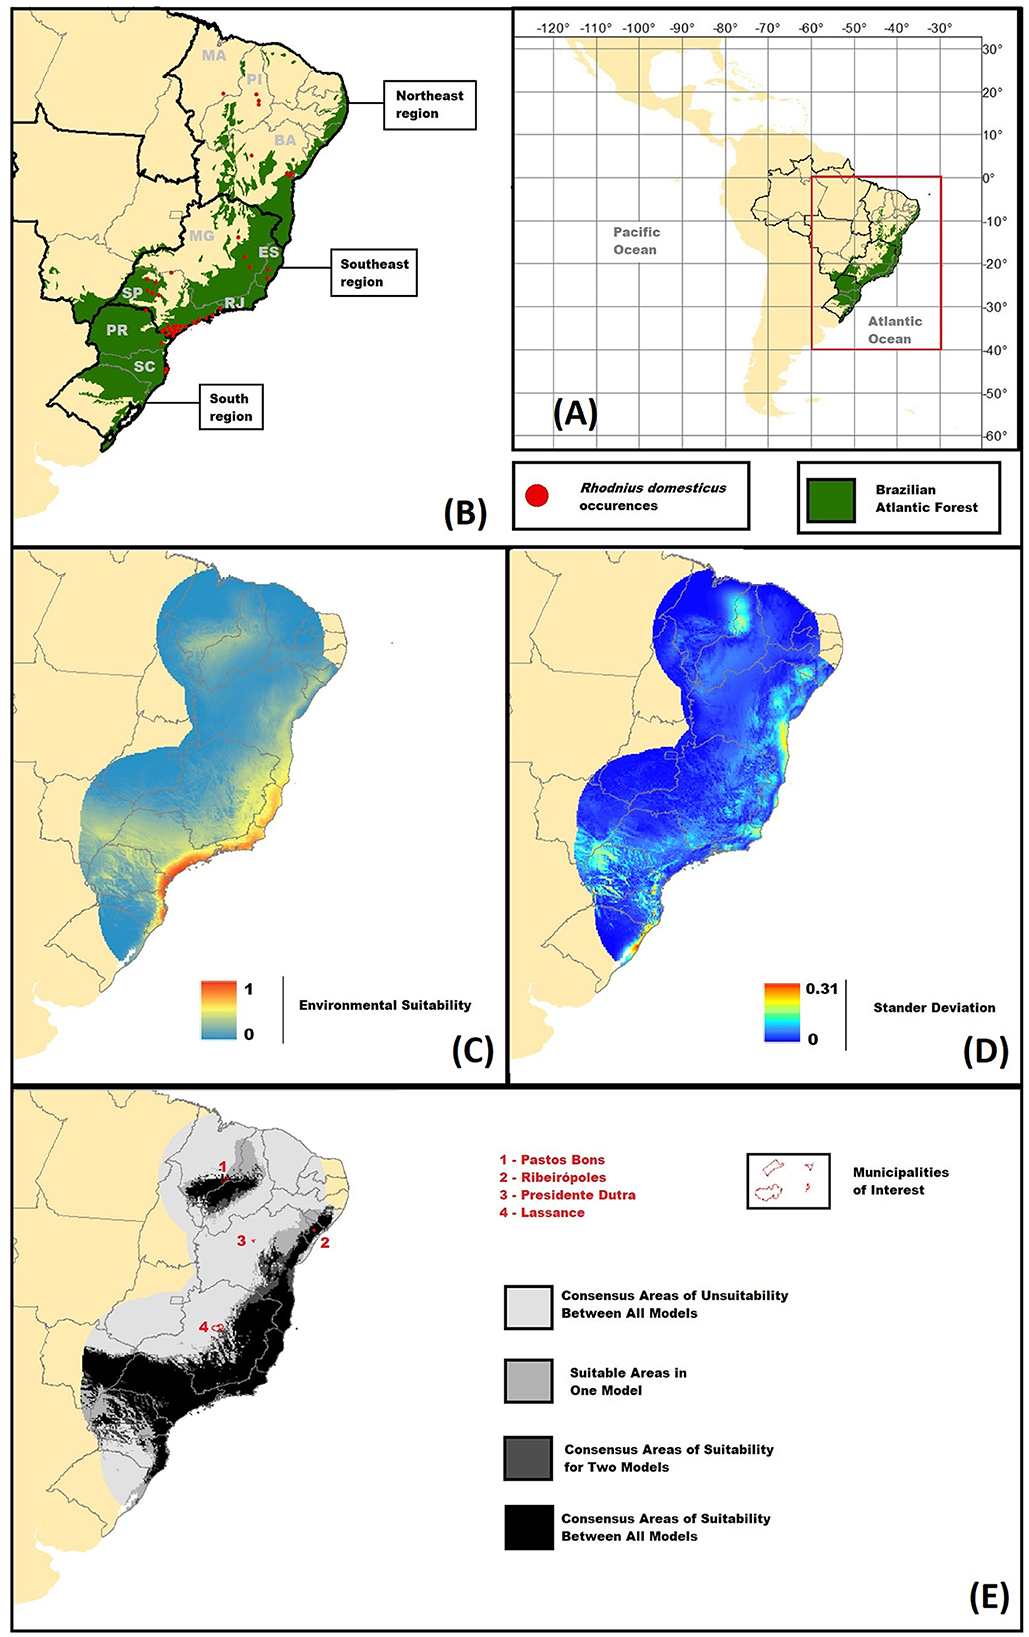
Figure 1. Spatial data and Ecological Niche models (ENMs) results for Rhodnius domesticus. (A) Study area delimitation project using WGS 1984 datum and coordinate system. (B) Map of R. domesticus known distribution. Red dots represent species records; the green area represents the Brazilian Atlantic Forest; black lines represent macrogeopolitical divisions, and gray lines state delimitations. Macrogeopolitical areas are indicated by names and states by their initials: South Region – states of Paraná (PR) and Santa Catarina (SC); Southeast Region, states of São Paulo (SP), Rio de Janeiro (RJ), Espiríto Santo (ES), and Minas Gerais; Northeast Region – states of Bahia (BA), Piauí (PI), and Maranhão (MA). (C) Average Ecological Niche Model (ENM) for the calibration area. Environmental Suitability ranges from 0 to 1, values are represented by increasing colder to warmer colors. (D) Standard Deviation model of the calibration area ENM. Values range from 0 to 0.31, increasing from colder to warmer colors. Values are represented by increasing colder to warmer colors. (E) Binary map of occurrence. Light gray areas represent consensus unsuitability, and darker colors represent increasing suitability between source models [Models (A–C)].
Rhodnius domesticus occurrence information
Rhodnius domesticus occurrence information was accessed first by the revision of extensive literature. We consulted the literature database Web BibTri V3.0 (2022) and libraries to access the oldest literature. Later, a significant amount of register for the state of São Paulo (SP) was also provided by the Superintendence for Endemic diseases Control of the São Paulo State Department of Health (Superintendência de Controle de Endemias da Secretaria de Estado da Saúde de São Paulo – SUCEN). After gathering species occurrence data, we georeferenced the records for the production of ENMs by the centroid of geopolitical administrations (municipalities or localities) using GADM V.3.6 and ArcMap V.10.8 (ESRI, 2011). For the registers in Santa Teresa (Corrêa-do-Nascimento et al., 2021) and Açucena (Ferreira et al., 2014), the geographic coordinate was provided in the article and by map base georeferencing, respectively. DataTri (Ceccarelli et al., 2018) was also consulted to certify that there was no missing register, but no further data were added to our analyses.
Ecological Niche Models (ENMs)
The ENMs were built in the calibration area, assuming to be accessible geographically for the species, and later transfer to further regions of interest that may possess new environmental conditions, regions M and G in the Biotic interactions, Abiotic conditions, and Movement (BAM) diagram, respectively (Soberon and Nakamura, 2009; Cobos et al., 2019a,b). We produced the ENMs using Maxent version 3.4 in R (Phillips et al., 2021; R Core Team, 2021) for calibration areas and transfer in different geographical and chronological scenarios. We used the KUENM package that works with a combination of variables and Maxent parameters in model selection and provides the base code for transfer and extrapolation risk analyses (For detailed information on the KUENM approach see Cobos et al., 2019a,b). To evaluate the model's settings further, we used different spatial approaches in data partitions using ENMeval V.2.0.3 (Kass et al., 2021).
Environmental data
We obtained all the environmental data from the Paleoclim.org database (Brown et al., 2018). For the current time, we used a dataset between 1979 and 2013 from Climatologies at high resolution for the Earth's land surface areas (CHELSA) (Karger et al., 2017; Karger – Dryad Digital Repository). We used the following paleoclimate layers for models of the neotropics and surrounding regions in different time periods: CHELSA's Last Glacial Maximum (LGM), 21 thousands of years ago (kyr) (Karger et al., 2021); Heinrich Stadial 1, 17.0–14.7 kyr; Bølling-Allerød, 14.7–12.9 kyr; Younger Dryas Stadial, 12.9–11.7 kyr; early-Holocene, Greenlandian, 11.7–8.326 kyr; mid-Holocene, Northgrippian, 8.326–4.2 kyr; and late-Holocene, Meghalayan, 4.2–0.3 kyr (Fordham et al., 2017). We used the spatial resolution of 5 arc minutes; a coarser resolution was chosen from the available data to better fit the spatial bias from centroid georeferenced geopolitical administrations.
We worked with 17 out of the 19 most common bioclimatic environmental layers for ENMs. Bio 8, 9, 18, and 19 were appointed to possess spatial artifacts in other modeling studies (e.g., Escobar et al., 2014; Samy et al., 2016; Raghavan et al., 2019; Hosni et al., 2020). We observed that bio 18 and 19 possess abrupt changes in their variation, creating odd shapes in spatial distribution, so they were excluded from the modeling process. However, for bio 8 and 9, the same spatial pattern was not clear, and they were maintained in our analyses (see Supplementary material 1 for variable names and spatial distribution).
ENMs choice of predictable variables, parameters and evaluation
In model building, we first defined the calibration area by five decimal degree buffer around all occurrences registered for the species, as previously applied in ENMs for kissing bugs (Bender et al., 2020). Then, a thorough approach made to the analysis of variables' combination and Maxent parameters was also applied to the choice of ENMs. To deal with the tremendous computational demand, we divided the analyses into two steps: the first being the choice of environmental variables and prelaminar models' parameters and the second being the exploration on further regularization multipliers (RMs) (Cobos et al., 2019a,b).
In the first step, we create several candidate models using the combination of different sets of environmental variables, five RMs (0.1, 0.5, 1, 2.5, 5), and seven feature classes based on a single feature or including more than one feature for each variable: linear (L); quadratic (Q); product (P); linear and quadratic (LQ); linear and product (LP); quadratic and product (QP); linear, quadratic, and product (LQP). The environmental sets were produced from the combination of three variables from the 17 previously defined and posterior exclusion of sets that had highly correlated variables (|r| > 0.8). We applied this strategy to deal with collinearity between predictors (Dormanm et al., 2013).
Theoretical works indicate that Maxent's claim to take advantage of the existing collinearity in finding the best parameters seems robust (De Marco and Nóbrega, 2018; Feng et al., 2019). However, excluding highly correlated variables serves as a way to decrease the number of combinations and consequentially processing time (Altamiranda-Saavedra et al., 2020). We trust that it would also allow different responses from collinear variables to be considered in transfer scenarios if found to be equally good in model calibration.
We obtained the predictor variables' correlation using the SDM toolbox (Brown, 2014) in ArcMap V.10.8 (ESRI, 2011). We performed data cleaning using the spThin package in R (Aiello-Lammens et al., 2015) by applying a 10 Km buffer to remove duplicate locality registers and decrease spatial clusters in occurrence data. We evaluated the candidate models by using statistical significance based on the partial receiver operating characteristic curve (ROC) (with 500 iterations and 50% of data for bootstrapping), omission rate below the 20% threshold, and AICc criteria. In addition, we accepted high omission rates of 20% due to occurrence data including specific amounts of error (Peterson et al., 2007).
In the second step, we considered the chosen environmental sets of the first step, the same feature classes, and evaluation criteria. The chosen RMs of the first step were applied with an addition of possible five new values under and above their range using a 0.1 interval. To further evaluate models' settings, we used three spatial partition types and area under the curve (AUC) values of the complete ROC curve for each chosen model with background points for the entire pixel length of the calibration area: 100 replicates of random k-fold validation with four partitions (K = 4), latitudinal and longitudinal blocks oriented, and longitudinal and latitudinal blocks oriented.
We obtained the final ENM by using all occurrence data points (e.g., Del Carro et al., 2020) after spatial thinning and background data points were equal to the pixel length of the study calibration area. Average and standard deviation models were built in the ArcMap raster calculator using the best models of step 2 with different environmental sets. Average AUC values from Maxent output were also calculated for the final models.
ENMs transfer and extrapolation risk analyses
Transfer models were built, allowing free extrapolation, and mobility-oriented parity (MOP) analyses (Owens et al., 2013) were applied to identify extrapolation risk areas in the geographical space using 5% of M reference points. The strategy follows the recommendation indicating model uncertainty due to environmental novelty (Feng et al., 2019). Final average and standard deviation models were drawn up as the calibration models. Regions of strict extrapolation were embodied in the maps from each set of chosen environmental variables, and the areas were overlapped on the top of the models using ArcMap V.10.8.
Binary ENMs
Three binary models were built based on the chosen ENMs of the KUENM approach. A model for the calibration area was created to test if uncertain species registers embody a model-suitable condition. In this step, we also tested if Rhodnius zeledoni, possibly belonging to the same species as R. domesticus (Galvão and Gurgel-Gonçalves, 2014), would fit inside the species possible distribution. If models were able to predict the registers, they would support the occurrence in the area and possible synonyms between species. For this model, every chosen ENM was transformed in binary using their corresponding 10 percentile training presence thresholds and was summed to create a final model indicating ENMs congruence of prediction.
Binary models were also built for transfer scenarios to explore suitability traits through time. The models were based on the final average ENM and were transformed to binary by average values of 10 percentile training presence thresholds of the corresponding chosen models. The first model is the sum of transferred binary models from current conditions to the LGM, indicating the general suitability areas, given all-time scenarios. The second model was built to explore the stability of current scenario suitable areas. Using simple algebraic arguments in raster calculation, we created a map that indicates the number of consecutive scenarios suitable from LGM to the current time. The code used in ArcMap for this part of the process is available in Supplementary material 2.
Results
Rhodnius domesticus occurrence data
Our data revision found 34 R. domesticus records from scientific literature, 48 were made available by SUCEN, and 44 different sites were found for the species in all records. Records range from the species description of 1923 to 2017–2019. However, many registers did not give any information on time for the specimen collection or indicate the period when the record was made. All records are from Brazil, occurring in the three macro geopolitical regions that historically the Atlantic Forest was mainly comprised, with few records out of the biome delimitation (Figure 1B): South region, three sites for species register in the states of Santa Catarina (SC) and two in Paraná (PR); Southeast region, 25 in the state of São Paulo (SP), one in Rio de Janeiro (RJ), two in Espírito Santo (ES), and three in Minas Gerais (MG); and the northeast region, four in Bahia (BA), three in Piaui (PI), and one in Maranhão (MA). We present a table of all registers with the corresponding geographical and time information in Supplementary material 3.
Four localities were chosen to be analyzed in our binary model for the calibration area, given uncertainties raised in our literature revision: Lassance (MG), a record previously invalidated for the species (Lent, 1942); Presidente Dutra (BA) and Pastos Bons (MA), records made in a large national campaign of triatomine collection in Brazil (Silveira et al., 1984) that diverge from the most common species distribution; and Ribeirópoles in the state of Sergipe (SE), the only record of R. zeledoni that is probably a synonym of R. domesticus (Jurberg et al., 2009; Galvão and Gurgel-Gonçalves, 2014).
Ecological Niche Models (ENMs)
The calibration area for R. domesticus ENMs presents a total length of 41754 pixels comprising a large part of the Atlantic Forest and some surrounding areas (Figures 1B–E). Correlation analyses indicated values over |0.8| between 28 pairs of the environmental variables (see Supplementary material 4). There were 680 sets resulting from the combination of three of the seventeen variables, and only 346 with respect to the correlation threshold. In the spatial thinning process, all duplicated occurrences were removed, and only a single register from Florianopolis (SC) was excluded due to the cluster at a 10 Km distance. Therefore, 43 different sites were used in the ENM analyses.
In the first run of the model's choice of parameters, 12,110 candidates were built from the combination of five RMs, seven feature class combinations, and 346 variable sets. Model performance evaluation indicates 11,491 models as statistically significant, 9,584 meet the omission rate, and only three meet AICc criteria (see Supplementary material 5). Three models meet all criteria using 0.1 RMs and the following additional parameters:
Model (A): QP feature classes; Mean Diurnal Range (bio 2), Temperature Seasonality (bio 4), and Precipitation of Wettest Month (bio 13) predictor variables.
Model (B): LQ feature classes; Mean Diurnal Range (bio 2), Temperature Seasonality (bio 4), and Mean Temperature of Driest Quarter (bio 9) predictor variables.
Model (C): LQP feature classes; Temperature Seasonality (bio 4), Temperature Annual Range (bio 7), and Precipitation of Wettest Month (bio 13) predictor variables.
In the second run, 126 candidate models were built from the combination of six RMs (0.1, 0.2, 0.3, 0.4, 0.5, 0.6), seven feature class combinations, and the three variable sets previously selected. Model performance evaluation indicates all models as statistically significant, 109 meet the omission rate, and only five meet AICc criteria (see Supplementary material 5). In addition to the three previously chosen models, the A and B versions with RMs of 0.3 and 0.2, respectively, meet all criteria. However, the models with RMs of 0.1 present smaller AICc values; therefore, the first run's A, B, and C models were chosen to produce the final model.
In an extended evaluation using a complete ROC curve with different spatial partitions, the average models present test AUC ranging from 0.815 to 0.883. The final average A, B, and C model using all data points also indicates a high average AUC of 0.8717 (AUC values are presented in Supplementary material 6). In the final average model, the higher suitability pixels are found close to coastal areas, but large interior regions have significant suitability (Figure 1C). Standard deviation models indicate higher values in areas of medium to low suitability (Figure 1D). For the calibration area, binary models show large consensus in most presence regions, with some divergence in northern areas. The four municipalities explored in this method show that Pastos Bons and Ribeirópolis seem highly related to presence prediction; Lassance was more uncertain; Presidente Dutra appears to be outside the prediction area (Figure 1E; see Supplementary material 2 for values of 10 percentile training presence threshold).
In the final average ENMs transfer models, there were areas of high suitability in a few zones of North America, some regions of Central America, and the lowest latitudes present in our study region (see Supplementary material 7). However, those areas possess broader strict extrapolation zones and are discontinuous with the prediction related to known occurrences for the species. Therefore, we focused our discussion more on the central regions of South America that continue to possess suitable conditions for occurrence near known occurrence for the species geocoordinate delimitation of 14 and−36 decimal degrees of latitude and −82 and −32 of longitude (Figure 2). The MOP analyses for the three models used in the final average model possess significant visual consensus in strict extrapolation of geographical distribution in all-time scenarios. Areas of strict extrapolation tend to match areas with low suitability and standard deviation values. This fact may indicate that model's divergence does not come from extrapolation of due conditions not present in the model calibration area. Furthermore, MOP similarity values between calibration and transfer scenarios seem close (see Supplementary material 7). Transfer binary models of general areas of suitability in space through time indicate large regions of suitability in the study area (Figure 3A). However, the models that explore a suitable stable area at the current time indicate narrower distribution (Figure 3B).
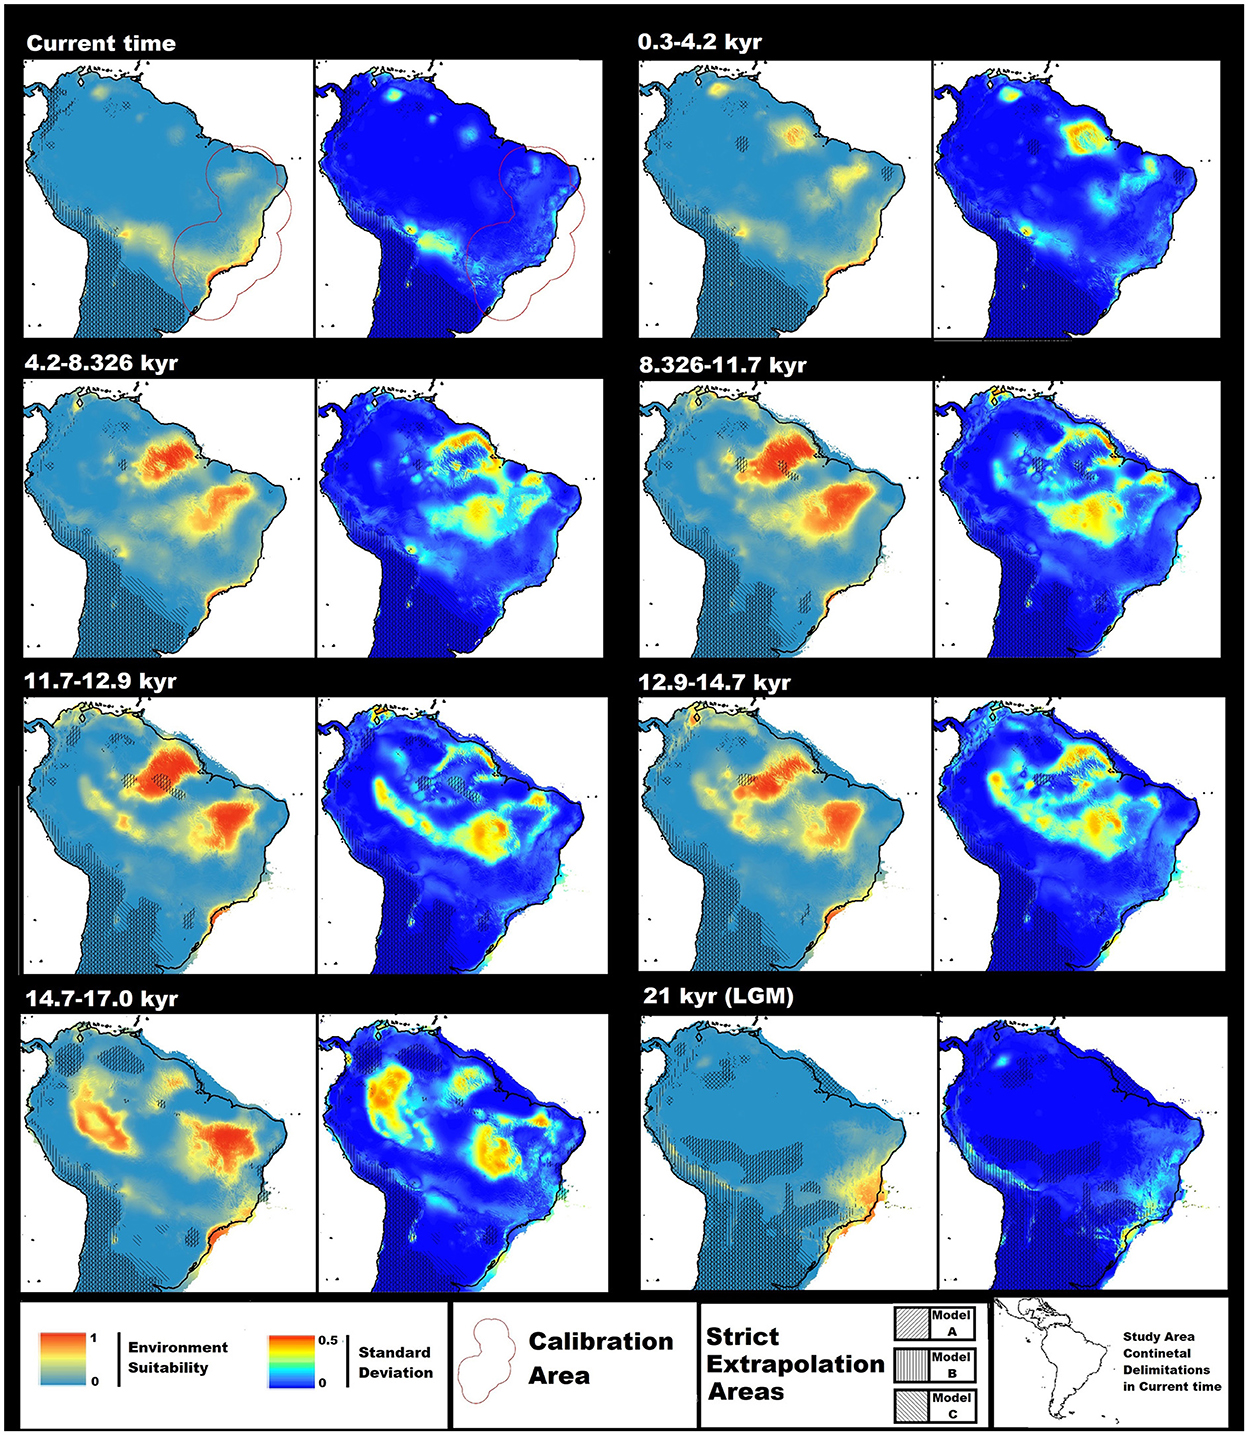
Figure 2. Average Ecological Niche Model (ENM) and standard deviation models for Rhodnius domesticus transfers in different spatial and temporal scenarios: Current time; 0.3–4.2; 4.2–8.326; 8.326–11.7; 11.7–12.9; 12.9–14.7; 14.7–17.0; and 21 kyr [last glacial maximum (LGM)]; names above the corresponding ENM in the left and standard deviation in right. Environmental suitability ranges from 0 to 1, standard deviation ranges from 0 to 0.5, both represented by values increasing from colder to warmer colors. Values were normalized as maximum 1 and 0.5, respectively, to allow models' comparisons. The red polygon indicates the calibration area in the current time map. The black line indicates continental delimitation for the current time. Strict extrapolation areas for Models (A–C) are indicated by different patterns and overlapped on top of corresponding average transfer ENMs. Regions outside this line emerge continental shelf for the period. The maps have been projected using WGS 1984 datum and coordinate system and delimitated by a rectangle in latitudes 14 and −36 and longitudes −82 and −32.
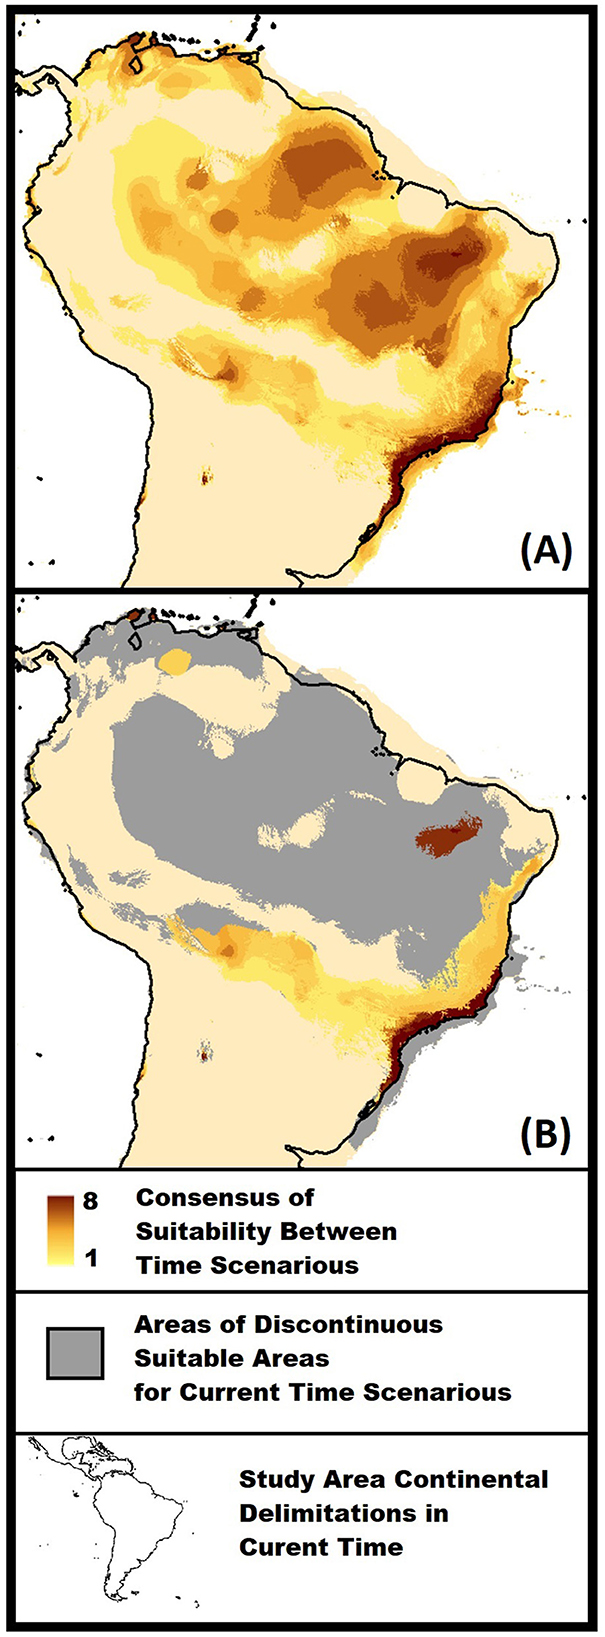
Figure 3. Models of binary consensus through time. Consensus values range from 1 to 8 and are represented by light yellow to dark brown. Models were based on the following time scenarios: Current time; 0.3–4.2; 4.2–8.326; 8.326–11.7; 11.7–12.9; 12.9–14.7; 14.7–17.0; and 21 kyr [ast glacial maximum (LGM)]. The maps have been projected using WGS 1984 datum and coordinate system, and delimitated by a rectangle in latitudes 14 and −36 and longitudes −82 and −32. The black line indicates continental delimitation for the current time. (A) In the general consensus model, the increasing values represent correspondent suitability between the eight models over time. (B) Modes of remaining stability for the current time scenario. High values indicate consensus from older time scenarios, and small values represent stability from earlier scenarios. Gray areas indicate discontinued suitability from past to current scenarios.
Discussion
R. domesticus occurrence records
Our register's revision indicates R. domesticus occurrence records to be more time and spatially consistent in areas close to SP and more coastal regions (Figure 1B and Supplementary material 3). This happened partially due to a large amount of data provided by SUCEN. Accessing geographical species data from other states' health surveillance groups could improve information on occurrence. Registers from southern and northern areas of the Atlantic Forest are less common and are often making an active search for the species in the regions important for sampling improvement. Spatial data were lost since most registers were not originally georeferenced, and some occurrences were made in the same administration spatial units. Only the records in Açucena (Ferreira et al., 2014) and Santa Teresa (Corrêa-do-Nascimento et al., 2021) had specific geographical representation within geopolitical areas. The lack of original geographic coordinates for the species or precise map representations increases spatial bias in the knowledge of general occurrence and further spatial distribution analyses. Therefore, we call attention to the necessity of gathering and making available species coordinates for future samples.
We highlight the fact that R. domesticus was registered between 2017 and 2019 in Inhaúma, Itainópolis, and Picos, all municipalities of Piauí (PI) (Mendes-Sousa et al., 2020). An earlier extensive revision work of Chagas disease comprises PI regions in the distribution of R. domesticus (Carcavallo et al., 1999). However, searching through the book's referenced literature, we found no mention of the species in the geopolitical area (Lent and Wygodzinsky, 1979; Silveira et al., 1984; Carcavallo and Martínez, 1985; Espinola, 1985). Therefore, the founding of R. domesticus in PI between 2017 and 2019 (Mendes-Sousa et al., 2020) could be the first time the species has been adequately reported in the state.
Ecological Niche Models (ENMs)
Our final average ENM was based on three models with different combinations of variables. bio 4 was always present, bio 2 and 13 were used in two models, and bio 7 and 9 appeared only one time. Temperature seasonality (bio 4) has been indicated as an important variable and Precipitation of Wettest Month (bio 13) was indicated to have low importance in ENMs for several unrelated Atlantic Forest triatomines in previous studies, including Rhodnius brethesi, Rhodnius ecuadoriensis, and Rhodnius prolixus (Eberhard et al., 2020). Despite bio 4 following the patterner, bio 13 shows relevance for ENMs, giving the reason as to why it was chosen in two of our three models for R. domesticus. The difference suggests that precipitation plays a more significant role in ENMs for species with a related distribution to the Atlantic Forest. This is a preliminary suggestion and a proper comparison must be done to test the hypothesis and ecological reasoning must be explored.
Rhodnius domesticus is mainly a sylvatic species that is found to be associated with bromeliads, palms, and marsupial and rodent nests, occasionally invading human domiciles when attracted by artificial light sources (Lent, 1942). Evolutionary study indicates that Rhodniini tribe ancestor could be adapted to invade this habitat, feeding on vertebrate inquilines and possessing available water and thermal damping (de Paula et al., 2021). R. domesticus may reattain the ancestor trait and be dependent on the collected water in those microhabitats; however, the reason why this could be related to the Precipitation of Wettest Month indicated in a macro scale seems unclear or absent.
It's also important to note that model with no precipitation variable was chosen, Model B containing the variables bio 2, 4, and 9, and each of these had low correlation with bio 13 (|r| < 0.27) (Supplementary material 4). This indicate that there are explanatory variables capable to provide suitable models for the species based only in temperature and with distinct spatial variation. Causality between variables and the suitable areas for the species are risky to be infer in those conditions, especially given the lack of species information in sylvatic habitats and therefore their ecological traits. However, as the final model was based on the average of model with different set of variables, the general spatial trends of suitability in areas with low standard deviation values are robust and provide important biogeographical information.
In the first step of our analysis, many statistically significant candidate models with omission rates below the 20% threshold were present. This fact indicates that probably other variable combinations could create good models. The chosen models were massively restricted by AICc criteria, which have already been challenged as a fit format of evaluation for ENMs (Velasco and González-Salazar, 2019). We believe that using a more comprehensive range of models with different variable combinations in the final average model could be an exciting way to explore model uncertainty, especially in dealing with collinearity shifts. However, due to a large number of suitable candidate models, the computational time demanded would be unfeasible in our study conditions, and using AICc criteria is a more practical strategy.
Occurrence data available in the literature and our calibration model show R. domesticus distribution to have a high degree of relation to the Atlantic Forest (Figure 1). The Parana dominion's biogeographical regionalism area is divided into six provinces (Morrone et al., 2022), and the Atlantic Forest possesses close spatial distribution with most of them. Our results indicate for the dominion a possible trend of species presence in the close distribution of the Atlantic and northern parts of Parana Forest provinces, more uncertainly in Chapada and Southern Espinhaço provinces, and absence in Araucaria Forest and Esteros del Ibera province. The results also indicate distribution outside the biome delimitations, a large disjunctive area in the northern interior regions of the calibration model, takes place in the Cerrado biome (Figure 1). The lack of continuous information on occurrences in this area makes it hard to understand if R. domesticus maintain viably or sink populations. Works on kissing bugs' dispersion capability would help debate this matter and provide better ways to define ENMs calibration areas, building more robust ENMs (Barve et al., 2011). However, we are aware of a few studies that help clarify accessible geographical areas for kissing bugs (e.g., Hamer et al., 2018), and it seems that we are far from understanding this ecological trait.
Using our binary calibration model (Figure 1E) to investigate the uncertain registers for R. domesticus, we found consensus in positive and negative predictions for the records made in the municipalities of Pastos Bons (MA) and Presidente Dutra (BA), respectively. In Lassance (MG), the municipality falls into the transition zone of suitability, indicating that species could occur in the area or there are near geographically suitable conditions for species to occasionally disperse from. The model in consensus indicates that the suitable area embodies Ribeirópoles (SE), type locality of the single harmed species that described R. zeledoni (Jurberg et al., 2009; Galvão and Gurgel-Gonçalves, 2014). Therefore, we trust the species to be synonyms, but we agree with previous works that conclude that taxonomical information is required (de Paula et al., 2021).
This study presents current spatial time transfer models (Figure 2) that embody most of the coastal areas previously indicated in ENMs built for Brazil (Galvão and Gurgel-Gonçalves, 2014). However, the prediction for more interior continental regions is closer to the binary model made available for the species in the neotropics, indicating extensive suitability in closer longitude of SPs' occurrences (de Paula et al., 2021). The main difference with the latter ENM is that ours indicates a narrower general distribution and a new suitable region in the interior northeast area of Brazil. The new area is comprised inside the Cerrado delimitations, but nearer to fragments of the Atlantic Forest in the northern parts of the biome (Figure 1). As all previous ENMs were built using Maxent, we assume differences in results would arise due to different uses of variables, occurrence data, and/or ENMs parameters. The previous models used a 2.5-min resolution for the environmental variables and all the 19 most common explanatory variables for ENMs. Our models were based on a 5-min resolution and in the average of three models based on different sets with three variables. However, de Paula et al. (2021) binary models were similar to ours, indicating that scale or environmental choice did not explain the difference between the more coastal and further interior predictions. Previous works do not indicate the use of calibration areas and use less interior occurrence data than ours, especially Galvão and Gurgel-Gonçalves (2014). The difference in background points and the presence in new environmental conditions may produce models' differences (e.g., VanDerWal et al., 2009).
When building transfer ENMs, we noticed that using Chelsea's environmental data set for the current time (Karger et al., 2017) and the LGM (Karger et al., 2021) result in models with less suitable areas for the species than the ones done with data between 17 and 0.3 Kyr (Fordham et al., 2017; Brown et al., 2018) (Figure 2). The Pleistocene environmental conditions had significant transformations (Barnosky et al., 2012; Fordham et al., 2017), and we wonder if the average value for thousands of years could have created artificial environmental conditions that may lead to larger suitable areas for R. domesticus. Using a sparser time range, mean of decades or hundreds of years, would be interesting for the analyses. However, the given conditions of variables seem to allow the observation of general trends in R. domesticus change of suitable area through time (Figure 2). Building models using environmental data based on different global circulation models (GCMs) and indicating their variation would be another critical step, as previous ENMs works indicate a significant difference in projections between GCMs for past environmental scenarios (e.g., Varela et al., 2015).
For the transfer models into LGM, we observe a solid relation to suitability in coastal and surrounding areas of the Atlantic Ocean (Figure 2). Works on the distribution of the Atlantic Forest in LGM propose that the biome decline into refuges and our model prediction comprises some matching suitability with the proposed stable areas for the biome (Carnaval and Moritz, 2008; Carnaval et al., 2009). However, the distribution of R. domesticus is broader and partially due to extensively available conditions in emerged landmasses. Our result is closer to the Atlantis Forest Hypothesis that indicates Atlantic Forest expansion in LGM with suitable conditions in areas of the continental shelf (Leite et al., 2016). Interior suitable areas comprise regions of high elevation that tend to have a low temperature, making us believe that the colder conditions in LGM would not be the main factor in R. domesticus occurrence limitation. Standard deviation models for LGM (Figure 2) indicate that southern areas possess a higher level of uncertainty and standard deviation in general interior areas also tends to be high, making the relation to resistance to colder climate and occurrence in the area more uncertain. In more coastal regions, including the continental shelf, there is less variance between source models (Figure 2). Despite the strong relation of the species with the Atlantic Forest, our models use occurrences outside the biome delimitation, which could have influenced the distribution in LGM.
In our transfer models from 21 kyr to current times, we observe that the species gain large suitability as neotropical left the LGM, gaining area in more northwestern interior regions and generally being more related to southern areas in their coastal distribution (Figure 2). Near Atlantic Forest delimitations, the large expansion area that appears in LGM is lost, restricting the species to the coastal region in the biome. The precise environmental reason for the change in distribution is not clear, but it is obvious that glaciation extreme conditions had a particular pattern of species distribution, unlike any other time scenario. From 17 kyr to the current times, the general trend was the loss of suitability in northwestern interior regions and gain in more northern areas of the coastal and southwestern areas (Figure 2). Continental shelf distribution relevance is seen until 11.7 kyr, highlighting the importance of the land masses' previous proposal for the Atlantic Forest in LGM (Leite et al., 2016) to end of glaciation conditions. The standard deviation values between 17 and 0.3 kyr indicate some uncertainty of suitability in coastal areas, but are especially high in the northern-/centermost regions of the continent, in both areas with large and small suitability (Figure 2). This fact indicates that suitability is present, but spatial distribution is imprecise.
Paleoclimate analyses of Cerrado in LGM indicate as a dry period of time (Vitorino et al., 2016; Bueno et al., 2017; De Oliveira et al., 2019), and the absence in R. domesticus of suitability in the biome would be coherent to the generally suitable condition of the Atlantic Forest in current time that species occur. However, the largely present suitability that starts in 17 kyr would make us to expect areas of Cerrado to be quite different than for current conditions. Despite the idea of Atlantic Forest like Cerrado being unlikely, the end of glaciation, ~17 to 11 kyr would tend to create a more humid environment for the biome than LGM and with lower values of temperature (Bueno et al., 2017). This cooler and more humid environment may fit species' macro environmental requirements and may allow connections to the Amazon, even though the suitability in the Atlantic Forest distribution tended to be more related to coastal regions (Figure 2). As the temperature rises in Holocene to current time, conditions related to the new environment may lead the region toward less suitability for the species.
Relations between the Amazonian and the Atlantic Forest biological groups seem complex and different, nevertheless three primary biome connections have been proposed (Costa, 2003). Our models indicate (Figure 2) the absence of connection in LGM; a time-limited connection between areas related to the northeast route through the Cerrado between 17 and 4.2 kyr; and a more recent possible trend in reconnection through areas related to the southeast–northwest route; the central route connection did not seem to take part in R. domesticus distribution history in the study time range. Our models indicate the importance of the same routes as theoretical models. However, it does not occur in matching time scenarios (Ledo and Colli, 2017). Works on precipitation in the Amazon for the past 45 kyr indicate that the biome would be widely drier in the periods, although the rainforest persists throughout this time (Wang et al., 2017). Suitable conditions for species could be related to warmer periods after LGM in each precipitation or related variables could be closer to the current Atlantic Forest conditions. As temperature and precipitation increase toward present time, suitability in the regions could disappear for the species. The choice of the variable Precipitation of Wettest Month (Bio 13) in two of our source models may support this idea, indicating that high precipitation could be as much of limited factor on R. domesticus occurrence as dry conditions.
LGM suitable areas for R. domesticus were remarkably different to glaciation end, 17 to 11.7 kyr. It indicates that the particular distribution of 21 kyr is related to extreme conditions In all our ENMs, two variables were selected that were related to temperature variation, bio 4, 2, or 7, and only one related to mean values of temperature or precipitation, bio 9 or 13. The discrepancy in response may be explained better by an abrupt change in the temperature range rather than change in mean values of temperature and precipitation. In Holocene, 11.7 to current time, is observed continuous loss of suitability in northern interior regions and gain in coastal regions and interior lower latitudes (Figure 2). The general trend of global warming between our two most extreme scenarios, LGM and current time, indicates that variables-related extreme temperature and precipitation conditions would make the northern interior region least suitable for species in scenarios related to extreme climate conditions in the region.
The binary model of the general area of suitability in space through time indicates large suitable areas in South America (Figure 3A). However, many regions appear only in a few time scenarios, and the extent of distribution could be an artifact of overprediction due to centroid georeferenced of occurrences data (Park and Davis, 2017; Cheng et al., 2021). Two areas with a high consensus of suitability in time scenarios call attention due to the extent and species' known occurrence: The southern distribution area in the coastal Atlantic region and the interior northeast region (Figure 3A). We are most confident that those were significant areas of R. domesticus distribution history in the Pleistocene end to Anthropocene. The binary model of stable areas in the current time indicates that those two regions conserve suitability since time near the LGM (Figure 3B). That would mean that given the current predicted suitable areas, coastal regions were more stable in the south, and the continued northern and interior regions were more recently colonized. For the disjunct northeast region, R. domesticus populations may be remnant for a larger distribution that appears after LGM and decreases since 17 kyr (Figures 2, 3B).
The large area in northern South America comprises some regions of the current Amazonian distribution with high-time scenarios' consensus (Figure 3A) that were not present in the current distribution (Figure 3B). Evolutive studies on the Rhodniini tribe indicate the R. domesticus speciation to be one of the earliest divergence processes in the group phylogeny (de Paula et al., 2021), an evolutive group that may have originated in Amazon areas (Abad-Franch and Monteiro, 2007; Abad-Franch et al., 2009). According to niche conservatism, species retain ancestral ecological traits (Wiens and Graham, 2005). Accepting this hypothesis, the large suitability in northern regions could be an ecological inheritance from an Amazonian ancestral. Binary models also show the same aspect in the northernmost area of South America (Figure 3A), the region of distribution of Rhodnius neivai (de Paula et al., 2021), which is proposed to be the sister species of R. domesticus (Justi et al., 2016). A general trend of past suitability in regions that today comprise Amazon areas and sister species distribution could support the hypothesis of the speciation in the region.
Biogeographical studies, using phylogeny, molecular clock, and spatial analyses, propose the vicariant speciation of R. domesticus and R. neivai around 10 to 7 million years ago by the Acre System (Justi et al., 2016). A recent study on the Rhodniini tribe found close results in the time of R. domesticus speciation with the time range of the geological event (de Paula et al., 2021). The system consists of a hydrological barrier that divides South America horizontally through the east side Andes to the Atlantic coast near the latitude of the northeast area of the continent (Hoorn et al., 2010). In this scenario, R. domesticus and R. neivai would speciate from southern and northern populations, respectively (Justi et al., 2016). The time gap between our models and the speciation does not allow us to claim that the species occur near each other in times that succeed the proposed vicariant event. However, we can demonstrate that those geographical regions are suitable for R. domesticus in several different environmental scenarios. The species could have happened in matching conditions in those areas millions of years ago without significant evolution in niche space.
Despite the noise created by the large area of suitable conditions in the binary model (Figure 3A), the sequence of ENMs transfer in time (Figure 2) indicates different suitability scenarios for southern and northern interior areas. Suitability on the continental shelf was also visually high to a large extent (Figure 3). The absence of high consensus in time observed in the binary model (Figure 3A) is due to the change in distribution (Figure 3B) and the loss of land by being submerged in the Atlantic Ocean. Our models indicate suitability in other regions of the study area. However, the disjunctive distribution of known occurrences and model uncertainty (see Supplementary material 7) make us believe that other strategies should be applied in the transfer for those regions in posterior studies.
It is essential to bear in mind that areas environmentally suitable for species may not represent their distribution; other biotic features and species' evolutive history could be important elements in exploring their occurrence (Crisci, 2011; Wisz et al., 2013). Areas with the presence of palm species for example could be more suitable for Rhodnius species, despite not necessarily being essential (Calderón and González, 2020). Suitable conditions of occurrence can also be found all across the globe for triatomines (Eberhard et al., 2020); however, they are mainly restricted to the neotropics (Galvão et al., 2003). As we also debate, variations and uncertainty are derived from variables and algorithms that could not be accounted for in the models. This study, however, indicates novelty in R. domesticus ENMs for current time scenarios, is the first ENMs study for paleoclimate conditions from LGM to current time for kissing bugs, explores the possible bias and next steps to improve models for the species, and uses a new approach in indicating consensus of transfer ENMs in time scenarios, to deal with important theoretical biogeographic neotropical matters that, as we are aware, had few explorations using insect groups.
For the next steps in R. domesticus biogeographical studies, further sampling for species distribution must be made and our models can help providing exploration sites to find species and deal with spatial sampling bias. With improvement on occurrence register for the species more robust analyses can be produce using refine resolution and allowing more variables in the ENMs. Those efforts could be especially important for paleoclimate models, in which the use of few registers and small number of variables makes ENMs less robust. The patterns found in thousand years ago provide insights on species evolutionary history, but possess limitations. With development of further studies based on different biogeographical approach it will be possible to better understand the different distribution of Rhodnius species in different spatial and time scenarios and test the hypothesis that were provide in this study.
Data availability statement
The original contributions presented in the study are included in the article/Supplementary material, further inquiries can be directed to the corresponding author.
Author contributions
GC-d-N: research conceptualization, data collection, data analysis, discussion and conceptualization, manuscript writing, and funding acquirement. GL: research conceptualization revision, data analysis revision, manuscript writing revision, funding acquirement, and project supervision. Both authors contributed to the article and approved the submitted version.
Funding
This present work was supported by Fundação de Amparo à Pesquisa e Inovação do Espírito Santo (FAPES) - < T.O. - 021/2023>. The publication charges were dealt with FAPES financial support and the work was done under the Guilherme's Doctoral Grant (85618268/2019 - 011/2019) from FAPES. This study was financed in part by the Coordenação de Aperfeiçoamento de Pessoal de Nível Superior - Brasil (CAPES) - Finance Code 001. Data collection was partially made under Guilherme's master grant from CAPES.
Acknowledgments
Species records from São Paulo were kindly made available from Superintendência de Controle de Endemias da Secretaria de Estado da Saúde de São Paulo (SUCEN).
Conflict of interest
The authors declare that the research was conducted in the absence of any commercial or financial relationships that could be construed as a potential conflict of interest.
Publisher's note
All claims expressed in this article are solely those of the authors and do not necessarily represent those of their affiliated organizations, or those of the publisher, the editors and the reviewers. Any product that may be evaluated in this article, or claim that may be made by its manufacturer, is not guaranteed or endorsed by the publisher.
Supplementary material
The Supplementary Material for this article can be found online at: https://www.frontiersin.org/articles/10.3389/fevo.2022.1051454/full#supplementary-material
References
Abad-Franch, F., Lima, M. M., Sarquis, O., Gurgel-Gonçalves, R., Sánchez-Martín, M. Calzada, J., et al. (2015). On palms, bugs, and Chagas disease in the Americas. Acta Trop. 151, 126–141. doi: 10.1016/j.actatropica.2015.07.005
Abad-Franch, F., and Monteiro, F. A. (2007). Biogeography and evolution of Amazonian triatomines (Heteroptera: Reduviidae): implications for Chagas disease surveillance in humid forest ecoregions. Memórias Do Instituto Oswaldo Cruz. 102, 57–70. doi: 10.1590/S0074-02762007005000108
Abad-Franch, F., Monteiro, F. A., Jaramillo, O. N., Gurgel-Gonçalves, R., Dias, F. B., and Diotaiuti, L. (2009). Ecology, evolution, and the long-term surveillance of vector-borne Chagas disease: a multi-scale appraisal of the tribe Rhodniini (Triatominae). Acta Trop. 110, 159–177. doi: 10.1016/j.actatropica.2008.06.005
Aiello-Lammens, M. A., Boria, R. A., Radosavljevic, A., Vilela, B., and Anderson, R. P. (2015). spThin: an R package for spatial thinning of species occurrence records for use in ecological niche models. Ecography 38, 1132. doi: 10.1111/ecog.01132
Altamiranda-Saavedra, M., Osorio-Olvera, L., Yáñez-Arenas, C., Marín-Ortiz, J. C., and Parra-Henao, G. (2020). Geographic abundance patterns explained by niche centrality hypothesis in two Chagas disease vectors in Latin America. PLoS ONE 15, e0241710. doi: 10.1371/journal.pone.0241710
Barnosky, A. D., Hadly, E. A., Bascompte, J., Berlow, E. L., Brown, J. H., Fortelius, M., et al. (2012). Approaching a state shift in Earth's biosphere. Nature 486, 52–58. doi: 10.1038/nature11018
Barve, N., Barve, V., Jiménez-Valverde, A., Lira-Noriega, A., Maher, S. P., Peterson, A., et al. (2011). The crucial role of the accessible area in ecological niche modeling and species distribution. Ecol. Modell. 222, 1810–1819. doi: 10.1016/j.ecolmodel.2011.02.011
Bender, A., Python, A., Lindsay, S. W., Golding, N., and Moyes, C. L. (2020). Modelling geospatial distributions of the triatomine vectors of Trypanosoma cruzi in Latin America. PLoS Negl. Trop. Dis. 14, e0008411. doi: 10.1371/journal.pntd.0008411
Brown, J. L. (2014). SDMtoolbox: a python-based GIS toolkit for landscape genetic, biogeographic and species distribution model analyses. Methods Ecol. Evol. 5, 694–700. doi: 10.1111/2041-210X.12200
Brown, J. L., Hill, D. J., Dolan, A. M., Carnaval, A. C., and Haywood, A. M. (2018). PaleoClim, high spatial resolution paleoclimate surfaces for global land areas. Nat. Sci. Data. 5, 180254. doi: 10.1038/sdata.2018.254
Bueno, M. L., Pennington, R. T., Dexter, K. G., Kamino, L. H. Y., Pontara, V., Neves, D. M., et al. (2017). Effects of Quaternary climatic fluctuations on the distribution of Neotropical savanna tree species. Ecography, 40, 403–414. doi: 10.1111/ecog.01860
Calderón, J. M., and González, C. (2020). Co-occurrence or dependence? Using spatial analyses to explore the interaction between palms and Rhodnius triatomines. Parasites Vectors 13, 211. doi: 10.1186/s13071-020-04088-0
Carcavallo, R. U., Galíndez-Girón, I., Jurberg, J., and Lent, H (Eds.). (1999). Atlas of Chagas disease vectors in the Americas/Atlas dos vetores da doença de Chagas nas Américas. (3 Vols.) Rio de Janeiro: Editora Fiocruz.
Carcavallo, R. U., and Martínez, A. (1985). Biología, ecología y distribución geográfica de los triatominos americanos. in Carcavallo, R. U., Rabinovich, J. E., and Tonn, R. J (Eds.). Factores Biologicos y Ecologicos en La Enfermedad de Chagas. Tomo I: Epidemiologia – Vectores. pp. 149-208. Ministerio de Salud y Acción Social, República Argentina.
Carnaval, A. C., Hickerson, M. J., Haddad, C. F. B., Rodrigues, M. T., and Moritz, C. (2009). Stability predicts genetic diversity in the Brazilian atlantic forest hotspot. Science. 323, 785–789. doi: 10.1126/science.1166955
Carnaval, A. C., and Moritz, C. (2008). Historical climate modelling predicts patterns of current biodiversity in the Brazilian Atlantic forest. J. Biogeogr. 35, 1187–1201. doi: 10.1111/j.1365-2699.2007.01870.x
Ceccarelli, S., Balsalobre, A., Medone, P., et al. (2018). DataTri, a database of American triatomine species occurrence. Sci. Data 5, 180071. doi: 10.1038/sdata.2018.71
Ceccarelli, S., Balsalobre, A., Vicenti, M. E., et al. (2022). American triatomine species occurrences: updates and novelties in the dataTri database. Gigabyte 3, 62. doi: 10.46471/gigabyte.62
Chagas, C. (1909). Nova tripanozomiaze humana: estudos sobre a morfolojia e o ciclo evolutivo do Schizotrypanum cruzi n. gen., n. sp., ajente etiolojico de nova entidade morbida do homem. Memórias Do Instituto Oswaldo Cruz. 1, 159–218. doi: 10.1590/S0074-02761909000200008
Cheng, Y., Tjaden, N. B., Jaeschke, A., Thomas, S. M., and Beierkuhnlein, C. (2021). Using centroids of spatial units in ecological niche modelling: effects on model performance in the context of environmental data grain size. Global Ecol Biogeogr. 2, 1–11. doi: 10.1111/geb.13240
Cobos, M. E., Peterson, A. T., Barve, N., and Osorio-Olvera, L. (2019a). kuenm: an R package for detailed development of ecological niche models using Maxent. PeerJ 7, e6281. doi: 10.7717/peerj.6281
Cobos, M. E., Peterson, A. T., Osorio-Olvera, L., and Jiménez-García, D. (2019b). An exhaustive analysis of heuristic methods for variable selection in ecological niche modeling and species distribution modeling. Ecol. Inform. 3, 100983. doi: 10.1016/j.ecoinf.2019.100983
Corrêa-do-Nascimento, G. S., Moreira, D. O., Galvão, C., dos Santos, C. B., Falqueto, A., and Leite, G. R. (2021). The rediscovery of Rhodnius domesticus Neiva & Pinto, 1923 (Hemiptera: Reduviidae: Triatominae) in the state of Espírito Santo, Brazil. Rev. Soc. Bras. Med. Trop. 54. doi: 10.1590/0037-8682-0323-2020
Costa, L. P. (2003). The historical bridge between the Amazon and the Atlantic Forest of Brazil: a study of molecular phylogeography with small mammals. J. Biogeogr. 30, 71–86. doi: 10.1046/j.1365-2699.2003.00792.x
Crisci, J. V. (2011). (2001). The voice of historical biogeography. J. Biogeogr. 28, 157–168. doi: 10.1046/j.1365-2699.2001.00523.x
De Marco, P. J, and Nóbrega, C. C. (2018). Evaluating collinearity effects on species distribution models: an approach based on virtual species simulation. PLoS ONE. 13, e0202403. doi: 10.1371/journal.pone.0202403
De Oliveira, P. E., Raczka, M., McMichael, C. N. H., Pinaya, J. L. D., and Bush, M. B. (2019). Climate change and biogeographic connectivity across the Brazilian cerrado. J. Biogeogr. 3, 1–12. doi: 10.1111/jbi.13732
de Paula, A. S., Barreto, C., Telmo, M. C. M., Diotaiuti, L., and Galvão, C. (2021) Historical biogeography the evolution of hematophagy in rhodniini (Heteroptera: Reduviidae: Triatominae). Front. Ecol. Evol. 9, 660151. doi: 10.3389/fevo.2021.660151
Del Carro, K. B., Leite, G. R., Oliveira Filho, d. e., dos Santos, A. G. C.B., de Souza Pinto, I., Fux, B., et al. (2020). Assessing geographic and climatic variables to predict the potential distribution of the visceral leishmaniasis vector Lutzomyia longipalpis in the state of Espírito Santo, Brazil. PLoS ONE 15, e0238198. doi: 10.1371/journal.pone.0238198
Dormanm, C. F., Elith, J., Bacher, S., Buchmann, C., Carl, G., Carré, G., et al. (2013). Collinearity: a review of methods to deal with it and a simulation study evaluating their performance. Ecography 36, 027–046. doi: 10.1111/j.1600-0587.2012.07348.x
Eberhard, F. E., Cunze, S., Kochmann, J., and Klimpel, S. (2020). Modelling the climatic suitability of Chagas disease vectors on a global scale. eLife 9, e52072. doi: 10.7554/eLife.52072
Escobar, L. E., Lira-Noriega, A., Medina-Vogel, G., and Peterson, A. T. (2014). Potential for spread of the white-nose fungus (Pseudogymnoascus destructans) in the Americas: use of Maxent and NicheA to assure strict model transference. Geospat. Health 9, 221. doi: 10.4081/gh.2014.19
Espinola, H. N. (1985). Brasil. In Carcavalo, R. U., Rabinovich, J. E., and Tonn, R. J (Eds.). Factores Biologicos y Ecologicos en La Enfermedad de Chagas. Tomo II: Parasitos - Reservorios - Control - Situacion Regional. Ministerio de Salud y Acción Social, República Argentina. pp. 363-372.
Feng, X., Park, D. S., Liang, Y., Pandey, R., and Pape,ş, M. (2019). Collinearity in ecological niche modeling: confusions and challenges. Ecol E. 9, 10365–10376. doi: 10.1002/ece3.5555
Ferreira, R. A., Silva, J. D., Faria, T. S. M., Lage, D. L., Barbosa, S. E., and Diotauiti, L. G. (2014). Primeiro encontro de Rhodnius domesticus Neiva and Pinto, 1923 (Hemiptera: reduvidae) no município de Açucena, Minas Gerais, Brasil. Rev Patol Trop. 43, 369–375. doi: 10.5216/rpt.v43i3.32205
Forattini, O. P., Ferreira, O. C., Silva, E. O. R., and Rabello, E. X. (1978). Aspectos ecológicos da tripanossomíase americana. XII - Variação regional da tendência de Panstrongylus megistus à domiciliação. Rev Saúde públ., S. Paulo 12, 209–33. doi: 10.1590/S0034-89101978000200013
Fordham, D. A., Saltré, F., Haythorne, S., Wigley, T. M. L., Otto-Bliesner, B. L., Chan, K. C., et al. (2017). PaleoView: a tool for generating continuous climate projections spanning the last 21 000 years at regional and global scales. Ecography. 40, 1348–1358. doi: 10.1111/ecog.03031
Galvão, C., Carcavallo, R. U., Rocha, D. S., and Jurberg, J. (2003). A checklist of the current valid species of the subfamily Triatominae Jeannel, 1919 (Hemiptera, Reduviidae) and their geographical distribution, with nomenclatural and taxonomic notes. Zootaxa 3, 1–36. doi: 10.11646/zootaxa.202.1.1
Galvão, C., and Gurgel-Gonçalves, R. (2014). Vetores conhecidos no Brasil. In: Galvão, C. (Eds), Vetores da doença Chagas no Brasil (Vol.1 ed, pp 88-170). Curitiba: Sociedade Brasileira de Zoologia. doi: 10.7476/9788598203096
Gurgel-Gonçalves, R., and Cuba, C. A. C. (2009). Predicting the potential geographical distribution of rhodnius neglectus (Hemiptera, Reduviidae) based on ecological niche modeling. J. Med. Entomol. 46, 952–960. doi: 10.1603/033.046.0430
Gurgel-Gonçalves, R., Galvão, C., Costa, J., and Peterson, A. T. (2012). Geographic distribution of Chagas disease vectors in Brazil based on ecological niche modeling. J. Trop. Med. 2012, 1–15. doi: 10.1155/2012/705326
Hamer, G. L., Bejcek, J. R., Valdez, E. A., Curtis-Robles, R., and Hamer, S. A. (2018). A pilot radio telemetry field study of triatomine vectors (Hemiptera: Reduviidae) of the Chagas disease parasite. J. Med. Entomol. 25,1380–1385. doi: 10.1093/jme/tjy094
Hoorn, C., Wesselingh, F. P. ter Steege, H., Bermudez, M. A., Mora, A., Sevink, J., et al. (2010). Amazonia through time: andean uplift, climate change, landscape evolution, and biodiversity. Science 330, 927–931. doi: 10.1126/science.1194585
Hosni, E. M., Nasser, M. G., Al-Ashaal, S. A., Rady, M. H., and Kenawy, M. A. (2020). Modeling current and future global distribution of Chrysomya bezziana under changing climate. Sci. Rep. 10, 4947. doi: 10.1038/s41598-020-61962-8
Jurberg, J., Rocha, D. S., and Galvão, C. (2009). Rhodnius zeledoni sp. nov. afim de Rhodnius paraensis Sherlock, Guitton and Miles, 1977 (Hemiptera, Reduviidae, Triatominae). Biota. Neotrop. 9, 123–128. doi: 10.1590/S1676-06032009000100014
Justi, S. A., Galvão, C., and Schrago, C. G. (2016). Geological changes of the Americas and their influence on the diversification of the neotropical kissing bugs (Hemiptera: Reduviidae: Triatominae). PLoS Negl. Trop. Dis. 10, e0004527. doi: 10.1371/journal.pntd.0004527
Karger, D. N., Conrad, O., Böhner, J., Kawohl, T., Kreft, H., Soria-Auza, R. W., et al. (2017). Climatologies at high resolution for the Earth land surface areas. Sci. Data 4 170122doi: 10.1038/sdata.2017.122
Karger, D. N., Nobis, M. P., Normand, S., Graham, C. H., and Zimmermann, N. E. (2021). CHELSA-TraCE21k v1, 0. Downscaled transient temperature and precipitation data since the last glacial maximum. Clim. Past Disc. 3, 1–27. doi: 10.5194/cp-2021-30
Kass, J. M., Muscarella, R., Galante, P. J., Bohl, C. L., Pinilla-Buirago, G. E., Boria, A. R., et al. (2021). ENMeval: An R package for conducting spatially independent evaluations and estimating optimal model complexity for Maxent ecological niche models. Methods Ecol. Evol. 12, 1602–1608. doi: 10.1111/2041-210X.13628
Ledo, R. M. D., and Colli, G. R. (2017). The historical connections between the Amazon and the Atlantic Forest revisited. J. Biogeogr. 3, 1–13. doi: 10.1111/jbi.13049
Leite, G. R., dos Santos, C. B., and Falqueto, A. (2011). Influence of the landscape on dispersal of sylvatic triatomines to anthropic habitats in the Atlantic Forest. J. Biogeogr. 38, 651–63. doi: 10.1111/j.1365-2699.2010.02442.x
Leite, Y. L. R., Costa, L. P., Loss, A. C., Rocha, R. G., Batata-Filho, H., Bastos, A. C., et al. (2016). Neotropical forest expansion during the last glacial period challenges refuge hypothesis. Proc Natl Acad Sci USA. 113, 1008–1013. doi: 10.1073/pnas.1513062113
Lent, H. (1942). Transmissores da moléstia de Chagas no estado do Rio de Janeiro. Revista Lent H. Transmissores da moléstia de Chagas no estado do Rio de Janeiro. Rev. Fluminense de Med. 7, 151–162.
Lent, H., and Wygodzinsky, P. (1979). Revision of the Triatominae (Hemiptera, Reduviidae), and their significance as vectors of Chagas' disease. Bul. Am. Museum. Nat. Hist. 163, 127–520.
Mendes-Sousa, A. F., Araújo, L. D., Sousa, S. S., Alencar, S. D., Sousa Júnior, W. A., Sousa, L. M., et al. (2020). Triatomine bugs (Hemiptera, Reduviidae, Triatominae) in the Domiciles of the Guaribas Valley Territory, in Northeastern Brazil. Rev. Soc. Bras. Med. Trop. (53). doi: 10.1590/0037-8682-0177-2020
Monteiro, F. A., Weirauch, C., Felix, M., Lazoski, C., and Abad-Franch, F. (2018). Evolution, systematics, and biogeography of the triatominae, vectors of Chagas disease. Adv. Parasitol. 99, 265–344. doi: 10.1016/bs.apar.2017.12.002
Morrone, J. J., Escalante, T., Rodríguez-Tapia, G., Carmona, A., Arana, M., and Mercado-Gómez, J. D. (2022). Biogeographic regionalization of the Neotropical region: new map and shapefile. An. Acad. Bras. Cienc. 94, e20211167. doi: 10.1590/0001-3765202220211167
Neiva, A., and Pinto, C. (1923). Estado actual dos conhecimentos sobre o gênero Rhodnius Stal, com a descrição de uma nova espécie. Brazil-Med. 37, 20–24.
Noireau, F. Carbajal-de-la-Fuente, A. L., Lopes, C. M., and Diotaiuti, L. (2005). Some considerations about the ecology of Triatominae. Anais Da Academia Brasileira de Ciências. 77, 431–436. doi: 10.1590/S0001-37652005000300006
Owens, H. L., Campbell, L. P., Dornak, L., Saupe, E. E., Barve, N., Soberón, J., et al. (2013). Constraints on interpretation of ecological niche models by limited environmental ranges on calibration areas. Ecol. Mod. 263, 10–18. doi: 10.1016/j.ecolmodel.2013.04.011
Park, D. S., and Davis, C. C. (2017). Implications and alternatives of assigning climate data to geographical centroids. J. Biogeogr. 44, 2188–2198. doi: 10.1111/jbi.13029
Peterson, A. T., Papes, M., and Soberón, J. (2007). Rethinking receiver operating characteristic analysis applications in ecological niche modeling. Ecol. Modell. 213, 63–72. doi: 10.1016/j.ecolmodel.2007.11.008
Phillips, S. J., Dudík, M., and Schapire, R. E. Maxent software for modeling species niches distributions (Version 3, 4.4). (2021). Available online at: http://biodiversityinformatics.amnh.org/open_source/maxent/ (accessed September 01, 2022).
R Core Team (2021). R: A Language and Environment for Statistical Computing. Vienna: R Foundation for Statistical Computing. Available online at: https://www.r-project.org/ (accessed September 01, 2022).
Raghavan, R. K., Barker, S. C., Cobos, M. E., Barker, D., Teo, E. J. M., Foley, D. H., et al. (2019). Potential spatial distribution of the newly introduced long-horned tick, haemaphysalis longicornis in North America. Sci. Rep. 9, 498. doi: 10.1038/s41598-018-37205-2
Samy, A. M., Elaagip, A. H., Kenawy, M. A., Ayres, C. F. J., Peterson, A. T., and Soliman, D. E. (2016). Climate change influences on the global potential distribution of the mosquito culex quinquefasciatus, vector of west nile virus and lymphatic filariasis. PLoS ONE. 11, e0163863. doi: 10.1371/journal.pone.0163863
Silveira, A. C., Feitosa, V. R., and Borges, R. (1984). Distribuição de triatomíneos capturados no ambiente domiciliar, no período 1975/83, Brasil. Rev. Bras. Malariol. Doenças. Trop. 36, 15–312.
Soberon, J., and Nakamura, M. (2009). Niches and distributional areas: concepts, methods, and assumptions. Proc. Nat. Acad. Sci. 106(Supplement_2), 19644–19650. doi: 10.1073/pnas.0901637106
VanDerWal, J., Shoo, L. P., Graham, C., and Williams, S. E. (2009). Selecting pseudo-absence data for presence-only distribution modeling: how far should you stray from what you know? Ecol. Model. 220, 589–594. doi: 10.1016/j.ecolmodel.2008.11.010
Varela, S., Lima-Ribeiro, M. S., and Terribile, L. C. (2015). A short guide to the climatic variables of the last glacial maximum for biogeographers. PLoS ONE 10, e0129037. doi: 10.1371/journal.pone.0129037
Velasco, J. A., and González-Salazar, C. (2019). Akaike information criterion should not be a “test” of geographical prediction accuracy in ecological niche modelling. Ecol. Inf. 51, 25–32. doi: 10.1016/j.ecoinf.2019.02.005
Vitorino, L. C., Lima-Ribeiro, M. S., Terribile, L. C., et al. (2016). Demographical history and palaeodistribution modelling show range shift towards Amazon Basin for a Neotropical tree species in the LGMBMC. Evol. Biol. 16, 213. doi: 10.1186/s12862-016-0779-9
Wang, X., Edwards, R. L., Auler, A. S., Cheng, H., Kong, X., Wang, Y., et al. (2017). Hydroclimate changes across the Amazon lowlands over the past 45,000 years. Nature 541, 204–207. doi: 10.1038/nature20787
Web BibTri V3.0 (2022). Available online at: https://bibtri.cepave.edu.ar/webbibtri.php?wbt_view=12andlang=es (accessed October 21, 2022).
Wiens, J. J., and Graham, C. H. (2005). Niche conservatism: integrating evolution, ecology, and conservation biology. Annu. Rev. Ecol. Evol. Syst. 36, 519–539. doi: 10.1146/annurev.ecolsys.36.102803.095431
Wisz, M. S., Pottier, J., Kissling, W. D., Pellissier, L., Lenoir, J., Damgaard, C. F., et al. (2013). The role of biotic interactions in shaping distributions and realised assemblages of species: implications for species distribution modelling. Biol. Rev. Camb. Philos. Soc. 88, 15–30. doi: 10.1111/j.1469-185X.2012.00235.x
Keywords: Anthropocene, Atlantic Forest and Amazon connection, Atlantis Forest Hypothesis, ecological niche model, kissing bugs, last glacial maximum, paleoclimate, Rhodnius domesticus
Citation: Corrêa-do-Nascimento GS and Leite GR (2023) Current and paleoclimate models for an Atlantic Forest kissing bug indicate broader distribution outside biome delimitations. Front. Ecol. Evol. 10:1051454. doi: 10.3389/fevo.2022.1051454
Received: 22 September 2022; Accepted: 11 November 2022;
Published: 09 February 2023.
Edited by:
Jader Oliveira, University of São Paulo, BrazilReviewed by:
Augusto Ferrari, Federal University of Rio Grande, BrazilBrendan Case, University of Vermont, United States
Copyright © 2023 Corrêa-do-Nascimento and Leite. This is an open-access article distributed under the terms of the Creative Commons Attribution License (CC BY). The use, distribution or reproduction in other forums is permitted, provided the original author(s) and the copyright owner(s) are credited and that the original publication in this journal is cited, in accordance with accepted academic practice. No use, distribution or reproduction is permitted which does not comply with these terms.
*Correspondence: Guilherme Sanches Corrêa-do-Nascimento,  Z3Vpc2FuY2hlc2NuJiN4MDAwNDA7Z21haWwuY29t