 Nana Luo
 Bolong Wen1*
 Rui Yu
95% of researchers rate our articles as excellent or good
Learn more about the work of our research integrity team to safeguard the quality of each article we publish.
Find out more
ORIGINAL RESEARCH article
Front. Ecol. Evol. , 01 December 2022
Sec. Paleoecology
Volume 10 - 2022 | https://doi.org/10.3389/fevo.2022.1046076
This article is part of the Research Topic Paleolimnology: Insights from Sedimentary Archives View all 14 articles
Black carbon (BC) is an important inert carbon component in the cycling process of surface carbon. Polycyclic aromatic hydrocarbons (PAHs) are a kind of thick cyclic organic compounds with carcinogenic, teratogenic, and mutagenic effects. The incomplete burning process of biomass and carbolic fuel is the important source of their co-occurrence. This study collected a 60-cm peat core from the Jiadengyu (JDY), Altay Mountain. The core was dated using the 210Pb and 137Cs methods. The results showed BC, total organic carbon, and PAHs of the JDY peat core to be 1.14–72.6 mg g−1, 17.09–47.2%, and 260.58–1,610.77 ng·g−1, respectively. δ13CBC was between −31.5 and − 29.4‰ (mean of −30.56‰). The results of scanning electron microscopy (SEM) indicated irregular or lumpy peat BC particles, retaining a plant fiber structure. δ13CBC, ratios of PAHs, and the SEM revealed that the BC to be the dominant source of biomass combustion in the peatland. BC showed an increasing trend between 1950 and 1980, after which it decreased. The discrepancy between the change in BC and δ13CBC from the national pattern of BC emission likely reflects the effect of local agricultural exploration, and thus an increase in crop burning.
Black carbon (BC) is produced by incomplete combustion of fossil fuels or biomass in environment and plays an important role in the carbon biogeochemical process of ecosystem (Hammes et al., 2007; Ambade and Sankar, 2021; Ambade et al., 2021a). Total global BC can be broken down into residues of vegetation fires of 50–270 Tg C year −1 (Kuhlbusch, 1995) and from the consumption of fossil fuel of 4.4 Tg C a−1, showing a linear increasing trend (Bond et al., 2007). In recent years, the increased industrial and agricultural activities have significantly changed the global carbon cycle through the emission of greenhouse gases and BC particles (Kuhlbusch, 1995; Hu et al., 2020). For example, atmospheric contents of BC reached as high as 2 μg C m−3 in Shanghai and Beijing (China), exceeding that in Gosan (Korea) by a factor of almost 2.5 (Chen et al., 2013).
The identification of BC sources can improve understanding of the relative effects of anthropogenic activities and regional climate change on fluxes of BC fluxes (Lehndorff et al., 2015; Sun et al., 2017).The formation and morphological structure of BC is related to the type of fuel, the temperature and duration of combustion (Preston and Schmidt, 2006). Previous methods for identifying soil BC sources included potassium dichromic oxidation, 375°C thermal oxidation, Thermal-light transmission carbon analyzer (TOT), and Thermoscopic carbon analyzer (TOT/RT), ratio between BC and total organic carbon (TOC) analysis, stable carbon isotope analysis (δ13CBC), and scanning electron microscope observation (SEM; Gao et al., 2014; Li et al., 2019; Neupane et al., 2020). The δ13CBC analysis technology has been widely used in soil BC traceability analysis (Chen et al., 2013; Qi and Wang, 2019), because terrestrial plants have different stable δ13C compositions, −- > between −20 and − 32‰ for C3 plants, and between −10 and − 17‰ for C4 plants (Bird and Ascough, 2012; Kawashima and Haneishi, 2012) due to their different photosynthesis pathways of C3, C4, and CAM (Sage and Wedin, 1999). In addition, polycyclic aromatic hydrocarbons (PAHs) were usually used to identify burning sources and then indicate pyrolysis carbon sources of BC due to their co-emission from burning process (Pontevedra-Pombal et al., 2012; Ba et al., 2021). PAH ratios can act as indicators of PAH sources, with the dominant ratios being Ant/(Ant+Phe) and Fla./(Fla + Pyr), Flt/pyr (Yunker et al., 2002; Gao et al., 2018).
Black carbon is capable of absorbing and transporting PAHs, and thus forms a potential pollution source (Lohmann and Lammel, 2004; Ambade et al., 2021b). Recently, fluxes of PAHs and BC in sediment archives (e.g., peat bog and lake sediment) have been commonly utilized to reconstruct the history of regional environmental pollution and for assessing the contributions of anthropogenic and natural sources (Gao et al., 2014; Ruppel et al., 2015; Shen et al., 2020). Altay Mountain is located in the mid-high latitudes in the Alpine region, where the peat resources are abundant due to the cold and wet climate. This region is sensitive to climate change and it is gradually affected by human activities, especially with the increasing tourism. However, the research on anthropogenic impact on the wetland environment is quite limited.
The present study dated a 30-cm peat profile from Jiadengyu (JDY), Altay Mountain using the 210Pb and 137Cs methods, and multi-proxies including BC, 16 priorities of PAHs and δ13CBC were measured. The main objectives are: (1) to characterize the history of BC and PAHs fluxes in the JDY peat core; (2) to primarily reveal the main sources of BC fluxes in the Altay Mountain in China.
The JDY peatland (48°30′18.72″, 87°8′27.59″; 1,600 m above the sea level) is located in the Altay Mountains Kanas Nature Reserve of the northwestern Xinjiang Uygur Autonomous Region, China (Figure 1). It is an intermontane depression with an area of about 3 km2, and is characterized by poor drainage. It belongs to the temperate continental cold climate, with annual average temperature of −0.2°C and annual precipitation of 1065.4 mm (Zhang et al., 2018). The mountain intercepts a lot of moist air transported by westerly winds originating from the North Atlantic Ocean. The peatland receives water predominantly from glacial surface runoff and snowmelt, with a minor contribution from rainfall. Modern vegetation on the peatland is dominated by Carex and Sphagnum spp. The current vegetation of the study area has a meadow steppe and taiga composition and structure, respectively, and vegetation is at an altitude of between 1,500 and 2,600 m in the Altay Mountains. Picea obovate (spruce) and Larix sibirica (larch) are the dominant plant species in the taiga belt, whereas sedges and mixed grass dominate the meadow steppe belt (Forestry Bureau of Altay Mountains in Xinjiang, 2003).
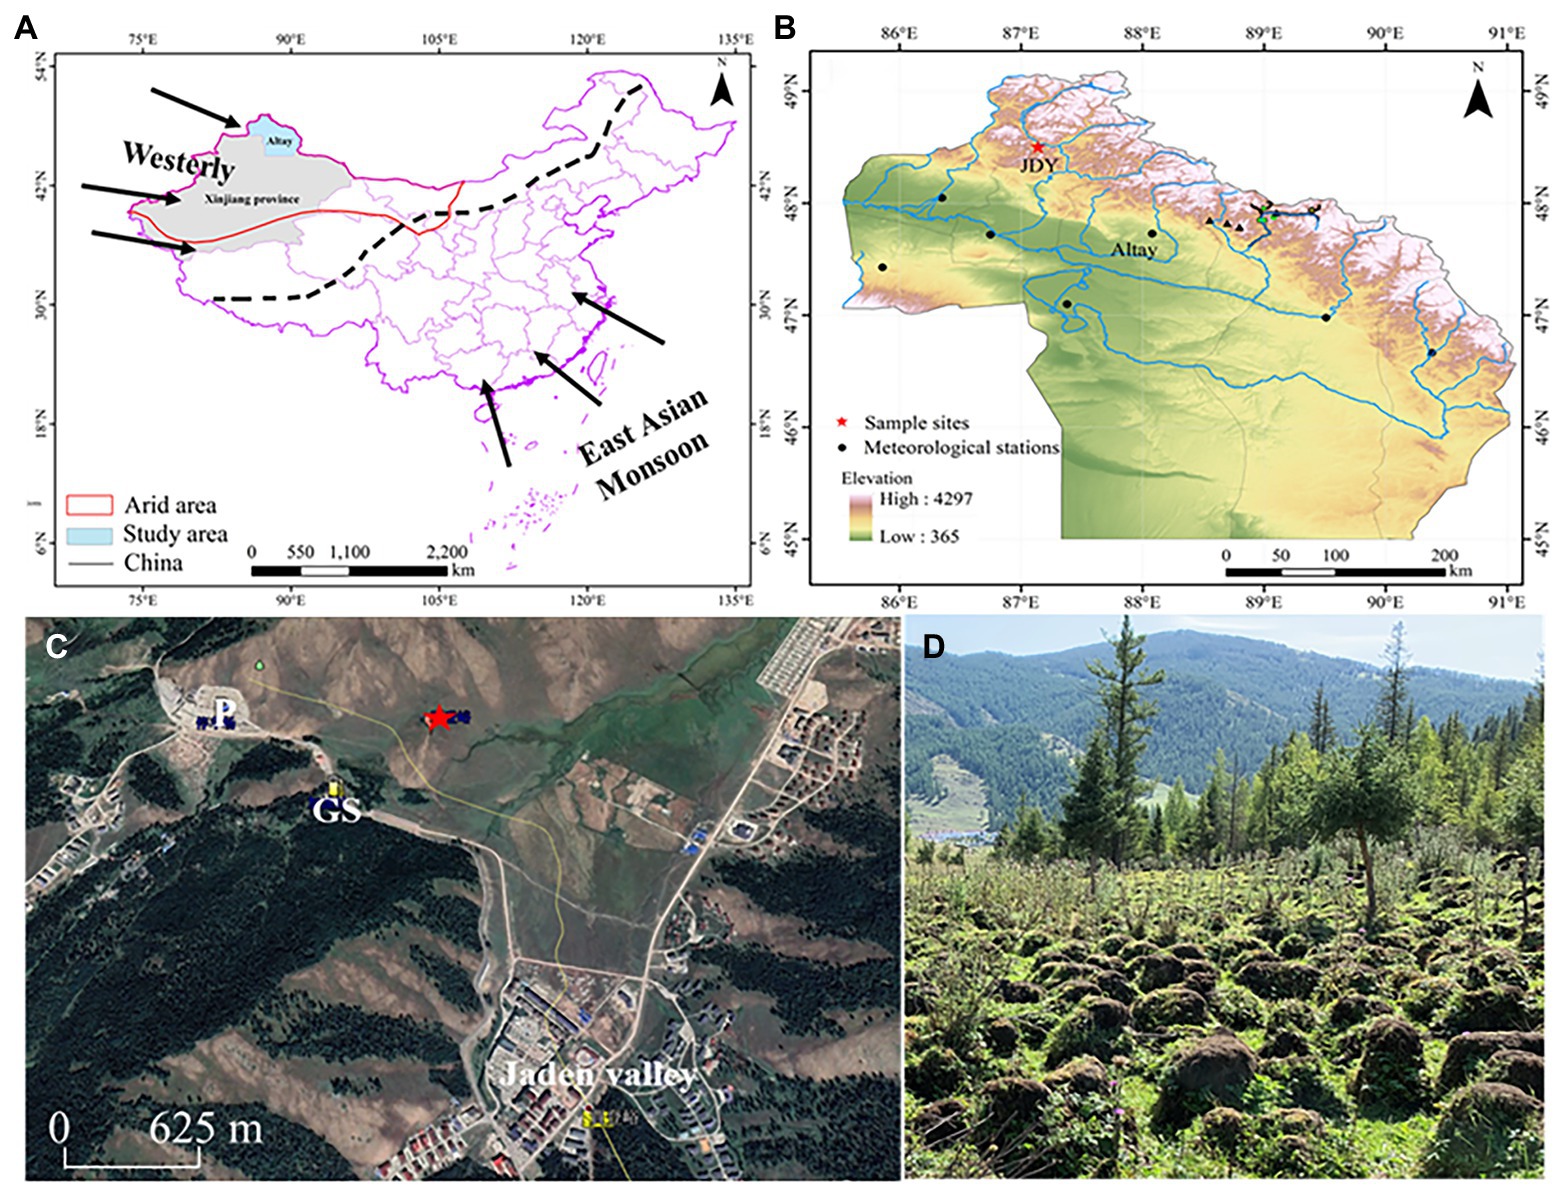
Figure 1. (A) China map showing the location of Jiadengyu in Northwest China and the Asian Monsoon and the Westerly; (B) Satellite image of the Jiadengyu valley (Google Earth) showing the location of JDY peatland (Red five pointed star) and of a car park and gas station; (C) Geographical map showing the sampling site in Altay Mountains, northwest China; and (D) Photo showing the summer scene in the studied peatland (photo in August 2019). Please refer to the Online version for the color figure.
In August 2019, a large block was dug up in the Jiadengyu peatland (marked as JDY). We sectioned in-site at 1-cm intervals by stainless steel knife, wrapped the sample separately with aluminum foil, and placed it in a separate polyethylene bag and then brought back to the laboratory for cryopreservation.
The peat samples were put into the aluminum box of fixed volume, dried at 105°C over 12 h, and then weighed to obtain the water content (WC, %) and dry bulk density (DBD, g·cm−3). The dry samples were transferred into muffle furnace at 550°C over 4 h for complete combustion. The ash content (Ash, %) was calculated through the loss on ignition method. These physicochemical measurements and the geochemical analyses below were conducted in the Analysis and Test Center of Northeast Institute of Geography and Agroecology, Chinese Academy of Sciences (CAS).
About 1 g of dry peat samples were ground to pass 200 meshes and were digested sufficiently by 3 mol/l of HCl to fully remove the carbonate. Then, they were washed to neutral with deionized water, and dried after centrifugation. The dry samples were ground and weighed for TOC analysis by the element analyzer (Italy Euro Vector Company, EA 3000 type).
Approximate 5 g dry samples of each slice were 210Pb- and 137Cs- dated by a γ-ray spectrometer with a low-background and high pure Ge semiconductor (ORTEC Instruments Ltd., United States). The dating was conducted at the State Key Laboratory of Lake Science and Environment, Nanjing Institute of Geography and Limnology, CAS. Bao et al. (2010) provides a detailed explanation of the techniques of radiometric dating and equations used for calculating the peat accumulation rate (PAR) and sedimentation rate (SR).
About 1 g dry samples were treated in 10-ml HCl (1 mol/L) for 20 h to remove inorganic carbon. Then, the contents were centrifuged and the residue was digested for 20 h with 10 ml acid mixture (3 mol/L HCl + 22 mol/L HF, volumetric ratio = 1:2). Then, after centrifuging samples, the residue was soaked for 10 h in 10-ml HCl. The residue is regarded to consist of organic matter, kerogen, and BC. NaOH (30 ml, 0.1 mol/L) was applied twice for 12 h, to remove humid acid, whereas kerogen was removed by a mixed solution of 0.1 mol/L K2Cr2O7 and 2 mol/L H2SO4 applied for 60 h, during which the color of the mixture was maintained as yellow. A 55°C bath was used in all steps. Residual carbon as δ13C and BC was quantified using a continuous-flow isotope ratios mass spectrometer (CF-IRMS), comprising an EA (Flash, 2000 series) combined with a mass spectrometer (Finnigan MAT 253; Gao et al., 2014). Measurements of BC were verified against BC reference material (charred wood) manufactured by the Department of Geography, University of Zurich (Hammes et al., 2006) was used to verify the BC measurement. The particle size, morphology, and porous structure of BC were analyzed by JSM–IT 500 HR microscope (Hitachi, Tokyo, Japan), which can perfectly combine the large field optical CCD images and SEM images until the smooth operation of high magnification observation, real-time analysis, and integration of SEM and EDS. Before the observation, it is necessary to remove the carbonate and silicate in the sample (Zhan et al., 2016; Liu et al., 2019).
A 5-g sample mixed with Na2SO4 (20 g) was extracted using 200-ml hexane acetone (1:1, v/v) through ultra-sonication at a temperature of 35°C. Then, after concentrating the extract, the solvent was exchanged with hexane using a rotary evaporator. Separation was conducted using a Na2SO4-silica gel-Na2SO4 column under leaching of 40-mL pentane solvent. After removing aliphatic ethers with pentane, hexane dichloromethane (2:3, v/v) was used to elute PAHs. Concentration of the elution solution was repeated, the solvent was exchanged with hexane, and the solution was increased to 1 ml. The analyses were conducted using GC/MS (QP5050A). The present study adopted the standard samples of 16 priority PAHs standard mixtures of the of the SEPA Institute as external standards for quantitative analysis, and rates of recovery rates of 80–110% were achieved (Cong et al., 2016). In order to guarantee of data quality, we have evaluated blank evolution. The mean value of Flt is 9.49 and Ant mean value is 15.48, the other 14 kinds of PAHs were not detected.
The present study calculated averages, standard deviations, and ranges of peat variables. Moreover, linear regression analysis was used to investigate the relationship between BC content in JDY peat core and TOC, PAHs, respectively. All statistical analyses were conducted in SPSS 22. p < 0.05 was assumed to indicate statistical significance.
The DBD and Ash showed similar variation with depth. They had a major peak in 7–11 cm section. The WC and TOC were correlated and their depth variations were contrast with the DBD and Ash (Figure 2). The DBD value varied from 0.12 to 0.29 g cm−3, and the mean value was 0.17 g cm−3 of the whole peat core. The DBD at 18–60 cm (mean: 0.16 g cm−3) were lower than those at 1–11 cm (mean: 0.21 g cm−3). The Ash ranged between 11.9 and 65.31%, with an average of 33.73% of the whole peat core. In addition, Ash (mean: 28.96%) at 18–60 cm were lower than those at 1–11 cm (mean: 55.45%). The TOC of whole peat core ranged from 17.09 to 47.2%, with an average value of 35.3% and the highest value was 47.2% at 18 cm and the lowest value (17.09%) at 11 cm. The WC ranged between 47.09 and 72.95% and the average was 62.51% of the whole peat core.
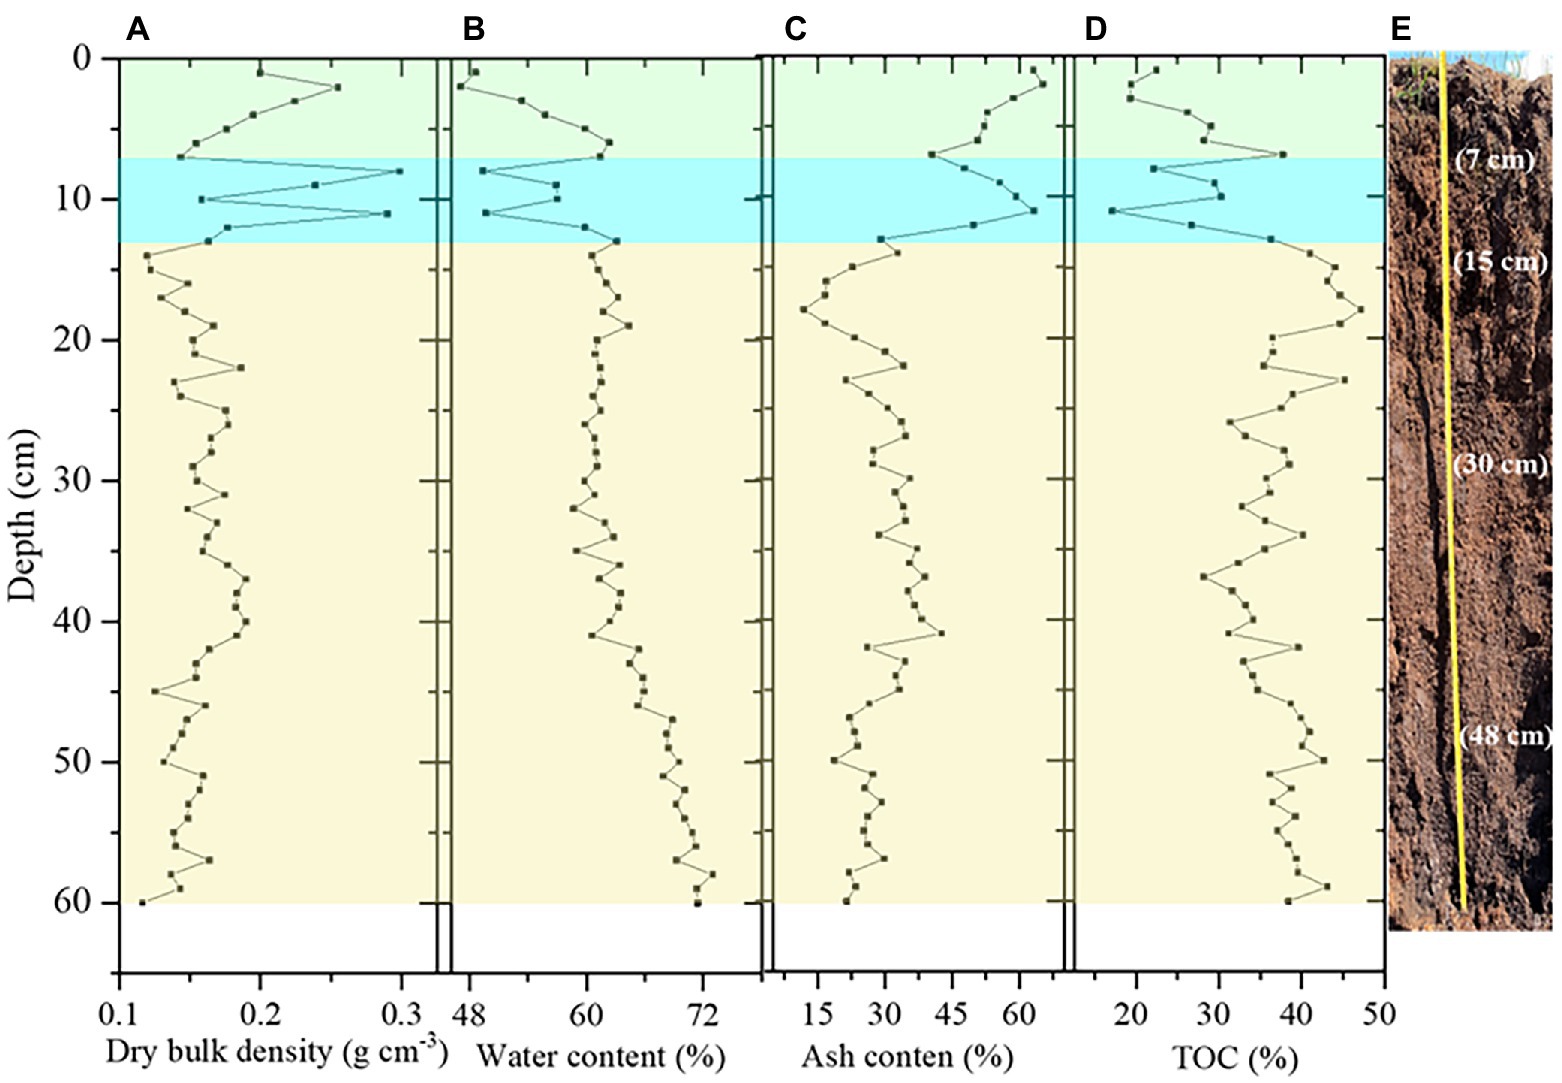
Figure 2. The depth profiles of dry bulk density (A), water content (B), ash content (C), TOC (D) and the core section of the peat column (E) in the JDY peat core in Altay Mountains, NW China.
According to the change of peat color, residue type, and decomposition degree, the 60 cm continuous peat core lithology was roughly divided into three layers from top to bottom as follows. The first layer is grass cortex at 0–7 cm, with vegetation coverage of about 80%. The grass roots are dense and contain green plants. The second is humus layer (7–18 cm), which is characterized by the poor decomposition, mainly in the incomplete decomposition of liverworts and mosses, modern plants with dense roots, dark brown loam soil, granular structure, loose, more roots. The third is the peat layer: 18–30 cm, dark brown, loamy to clay, granular or blocky, with more capillarity; 30–48 cm, dark brown silty clay, slightly compact, less root system; and below 48 cm, brown clay, and almost no roots.
The 210Pb activity decreased with depth in JDY peat profile (Figure 3). Rates of sedimentation and sediment ages were calculated utilizing the CRS Model in MATLAB 2012a. The activities of 210Pb decreased with depth downward. The peat record extended back by 134 years to A.D. 1883. The mean SR was 0.15 cm y−1 and the PAR is 0.025 g·cm−2 y−1.
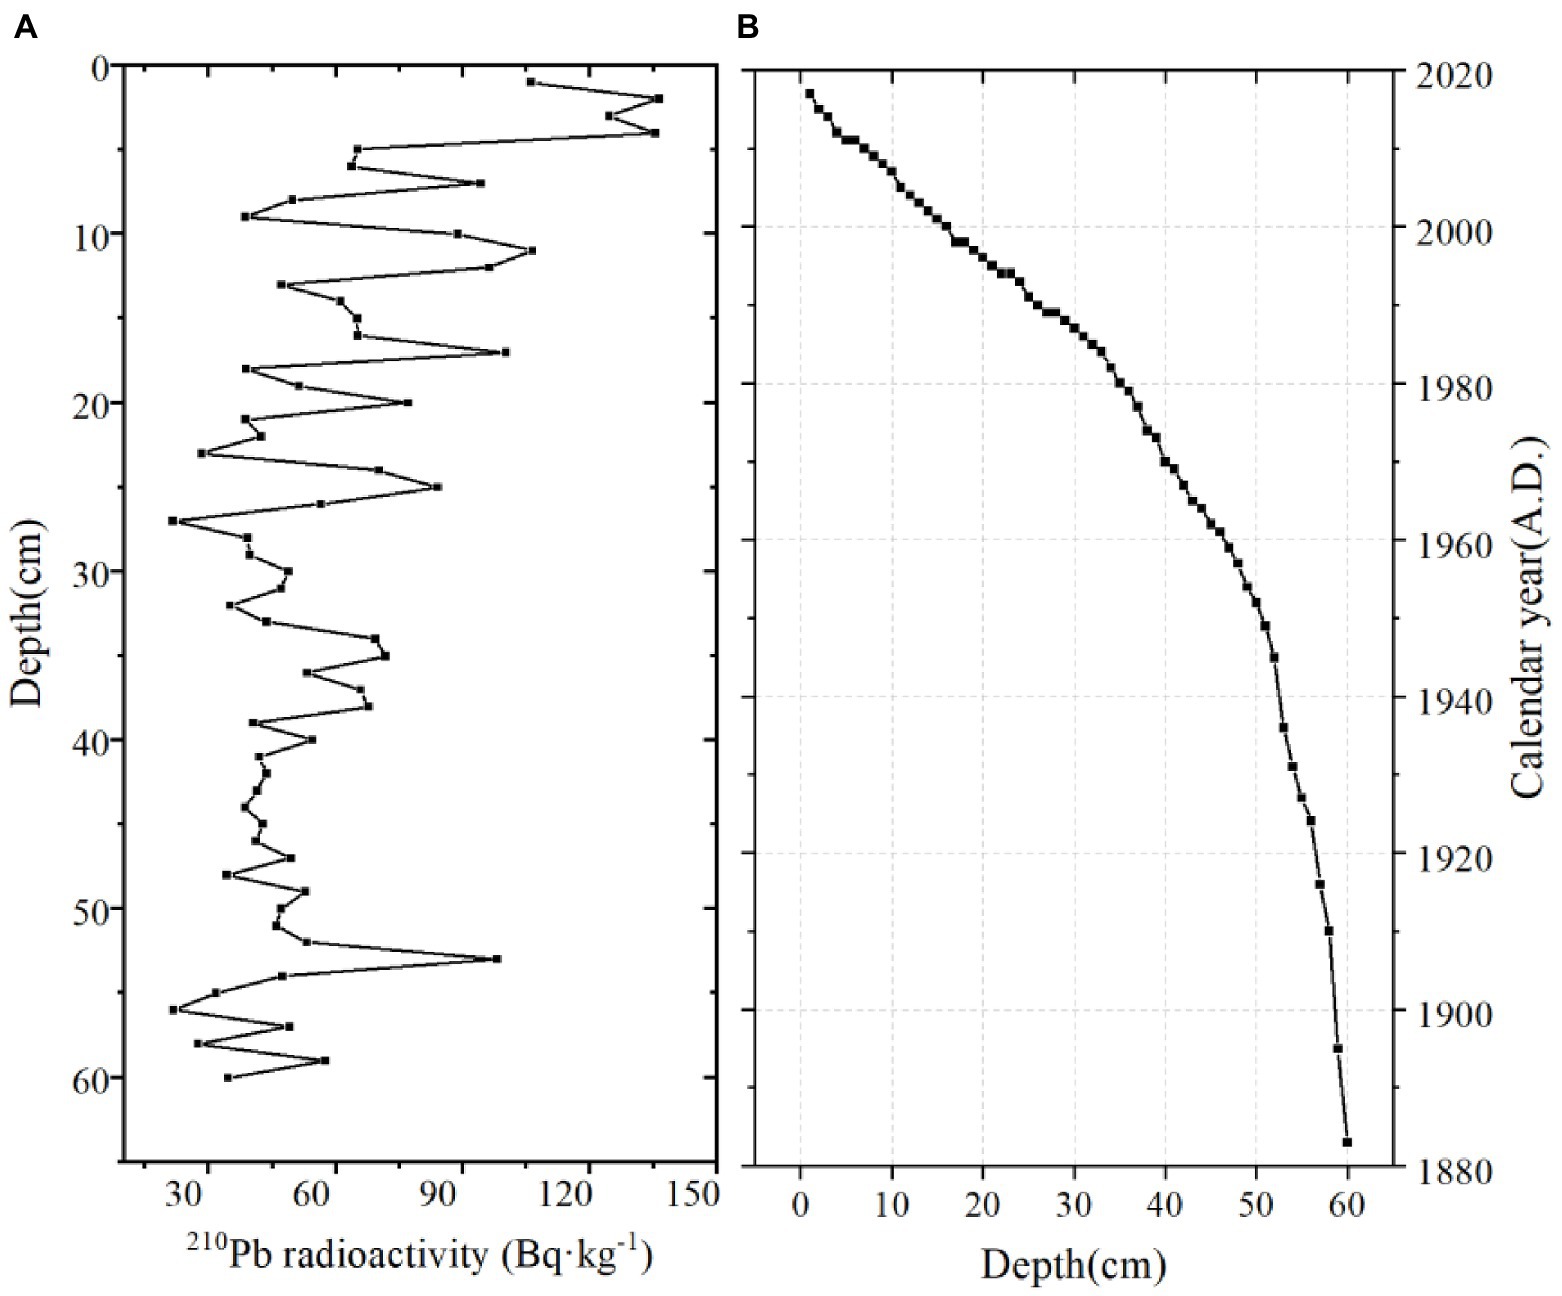
Figure 3. Radioactivity results for 210Pb (A), and the CRS calculated age (B), of the JDY peat core in Altay Mountains, NW China.
The average BC content was 25.55 mg g−1, with a range of 1.14–72.6 mg g−1 in the JDY peat core. The range of δ13CBC was from −31.5 to −29.4‰ with a mean of −30.6‰. During 1880–1950, the BC and δ13CBC consistently showed a trend of fluctuation change with first increase and then decrease (Figures 4A,B). From 1950 to 1980, the BC and δ13CBC showed an obviously decrease trend.
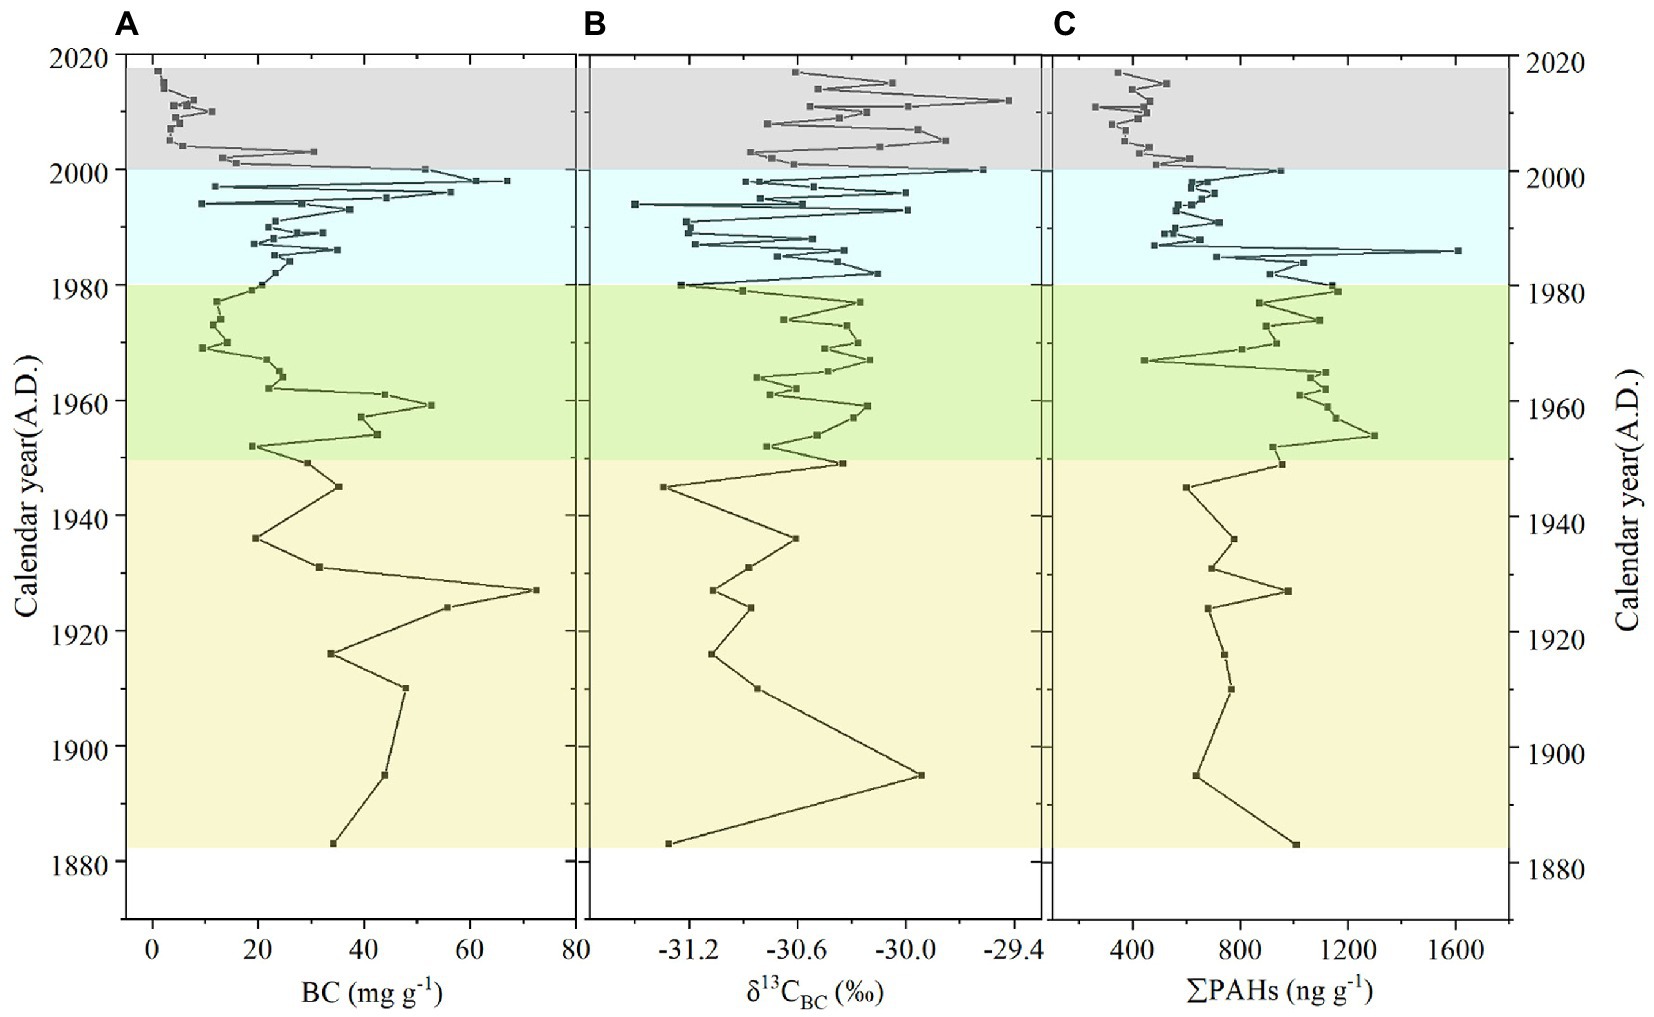
Figure 4. The contents of BC (A), δ13CBC (B), ratios, and the total PAHs content (C), in the core of JDY.
During the period of 1980–2000, the BC and δ13CBC showed an obviously increase trend. After 2000, the BC decreased obviously with time but the δ13CBC did not show consistent variation with the BC. The total PAHs in JDY peat core were 260.59–1610.77 ng g−1, and showed similar variation trend with the BC (Figures 4A,C). After 2000, the PAHs showed a decreased trend.
The PAHs was mainly composed of low molecular weight compounds (2–3 rings), and the content of Nap, Any, Flu, and Phe content was the highest (Figure 5). In general, the period of 1950–1980 had the highest values. The content of Nap, Phe, Flu, and Any prior to the 1950 (n = 10) was lower than that during 1950–1980 (n = 16), and the content of Nap and Any was the lowest after 1980 (n = 34). The concentration of high molecular weight PAHs (IcP, BaP, and DhA) prior to the 1950 (n = 10) was lower than the periods 1950–1980 (n = 16), after 1980 (n = 34), the content was the lowest. For middle molecular weight PAHs (BaA, Chr), BaA value was the lowest in the three periods, and Chr value was the highest in the period from 1950 to 1980. whereas for the Flt and Pyr higher content during 1950–1980 was compared to those before 1950 and after 1980.
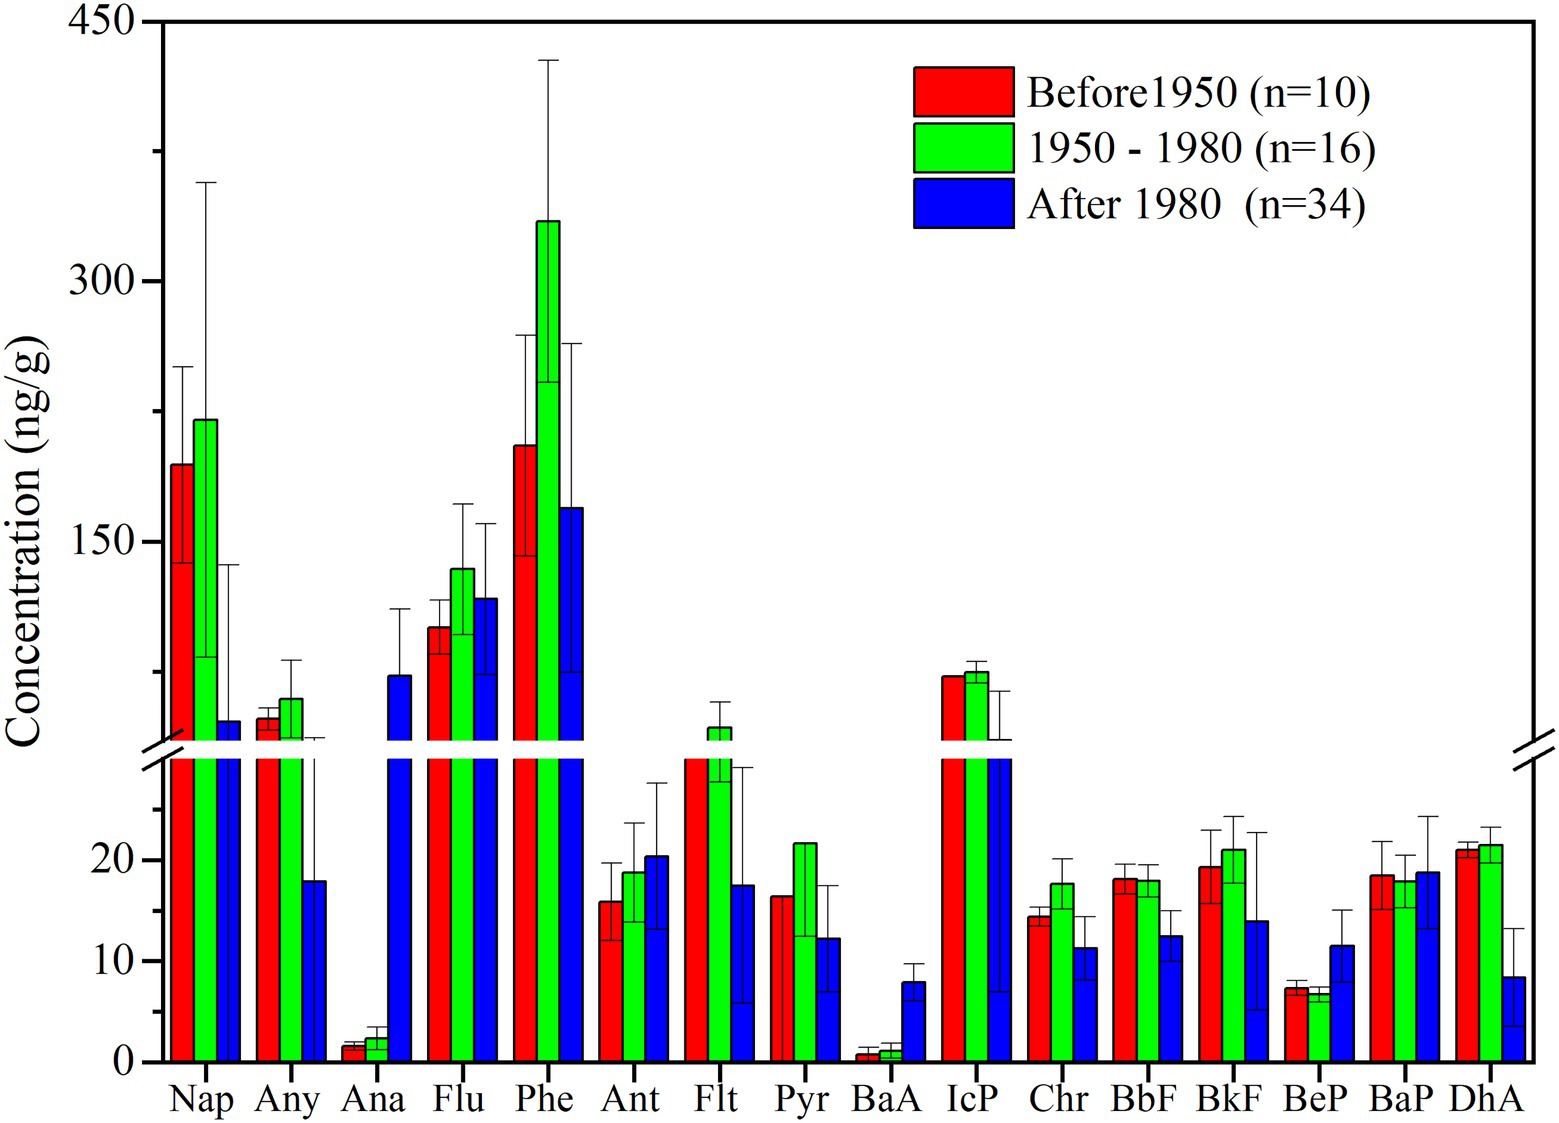
Figure 5. Profiles of PAHs in sediments from the JDY peat core, grouped according to the three periods. Nap, Naphthalene; Any, Acenaphthylene; Ana, Acenaphthene; Flu, Fluorene; Phe, Phenanthrene; Ant, Anthracene; Flt, Fluoranthene; Pyr, Pyrene; Chr, Chrysene; BaA, Benzo(a) anthracene; BbF, Benzo(b)fluoranthene; BkF, Benzo(k)fluoranthene; BeP, Benzo(e)pyrene; BaP, Benzo(a)pyrene; DhA, Dibenz[a,h] anthracene; and IcP, Ideno(1,2,3-cd) pyrene.
The mean BC content in the JDY peat profile was 21.06 mg g−1, which was similar with the average BC content of 24.85 mg g−1 in Tuqiang peat in Great Hinggan Mountains, China (Cong et al., 2016). In order to better explain the deposition characteristics and sources of BC we compared to other soils (e.g., forest soil and loess) and sediments (e.g., lake sediment and coastal sediment), contents of BC in the peats were the highest (Table 1), and represented a key stable part of the Earth’s soil carbon pool. The BC content in Nam Co Lake region (Tibetan Plateau, China) was most likely influenced by economic development in South Asia (Wang et al., 2005). In Changbai Mountain (Northeastern of China), local BC emission strongly influences the level and gradient of BC in the snowpack. Peatland, with slow degradation in anaerobic environment and continuous deposition process, is an ideal archive for recording the BC deposition history. Historical anthropogenic sources (e.g., residential and biomass burning) and natural sources (e.g., wildfire) caused more BC emitted and raised BC deposition fluxes. While, land drained and smoldering might lead BC modified in peat soils. It is necessary to study historical BC deposition progress and its influence factors in peatland, while, few studies had been reported.
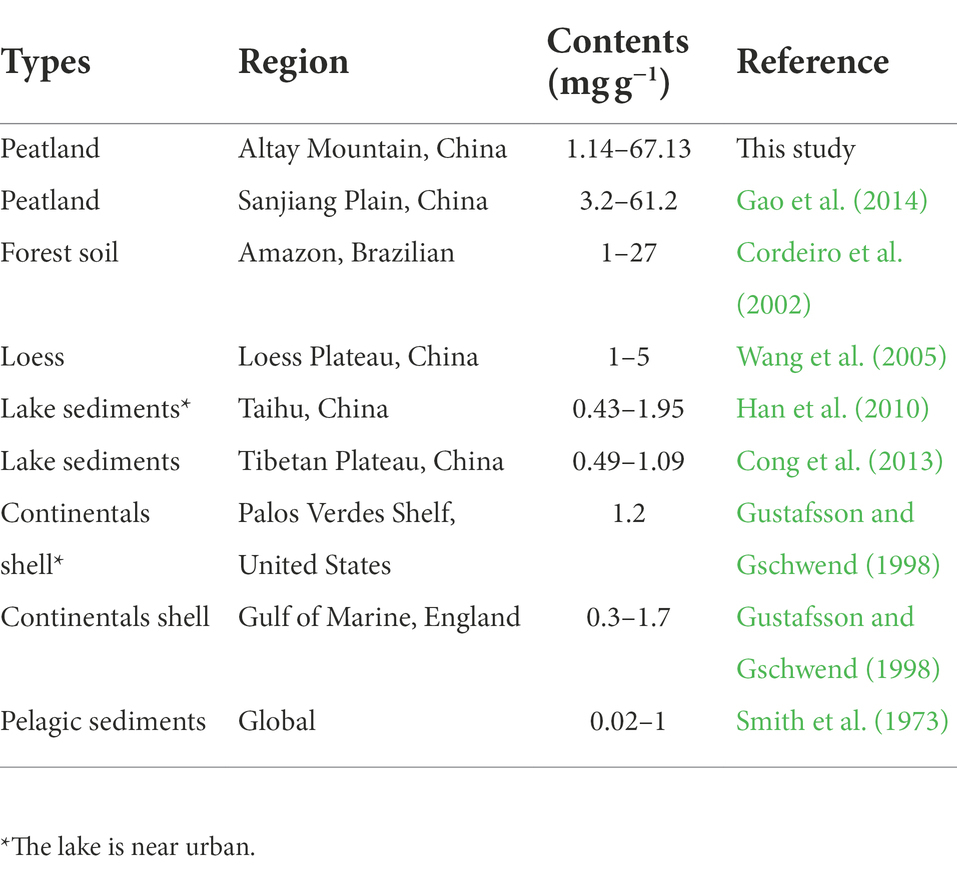
Table 1. The black carbon contents (mg g−1) for different deposition archives.
The δ13CBC values of C3 plant combustion are generally lower than −27‰, and those of fossil fuel combustion range from −23 to −26‰ (Bird and Ascough, 2012; Saiz et al., 2015) and the δ13C values in automobile exhaust gas range from −22 to −25‰ (Glaser et al., 2005). Here the δ13CBC in the JDY peat core varied from −29.4 to −31.5‰, with an average of −30.52‰, which is in the range of C3 plant burning type (−27 to −33‰). Therefore, the BC in the JDY peatland is dominantly from C3 plants burning.
The same pyrolysis sources always concurrently emit PAHs and BC. Therefore, the proportion contributions of different sources of PAHs can be utilized to calculate the proportion of BC sources (Yunker et al., 2002; Bucheli et al., 2004; Cao et al., 2020). It can be obtained from Table 2, the ratios of Flt/Pyr > 1, Fla./(Fla + Pyr) > 0.5, and Ant/(Ant+Phe) > 0.1 indicate that PAHs are mainly from biomass combustion (Yunker et al., 2002; Gao et al., 2018). In this study, the Flt/Pyr ratio, Fla./(Fla + Pyr), and Ant/(Ant+Phe) averages were 1.73, 0.56, and 0.13, respectively (Figure 6). Therefore, the main source of PAHs is biomass combustion in JDY profile, which is consistent with the main source revealed by the δ13CBC values.
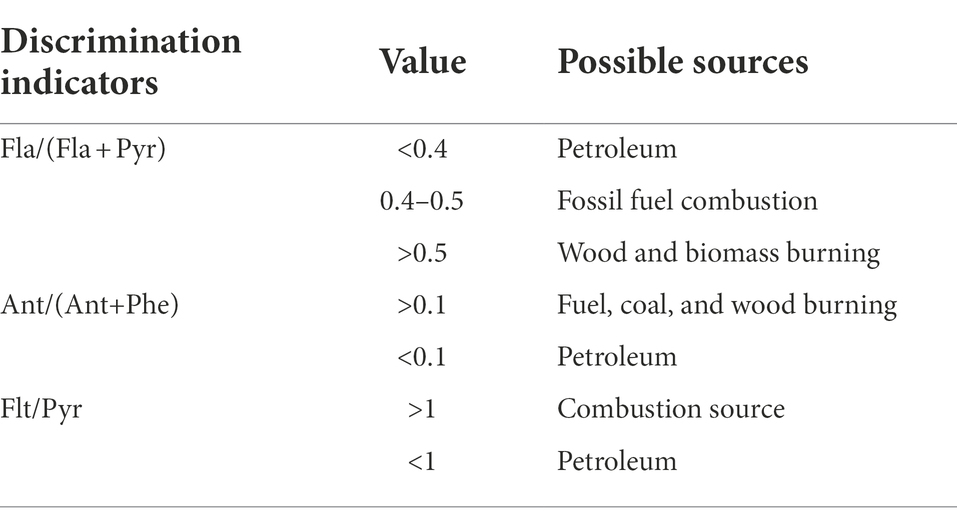
Table 2. Source discrimination indicators of PAHs in Jiadengyu peatlands in the Altay Mountains.
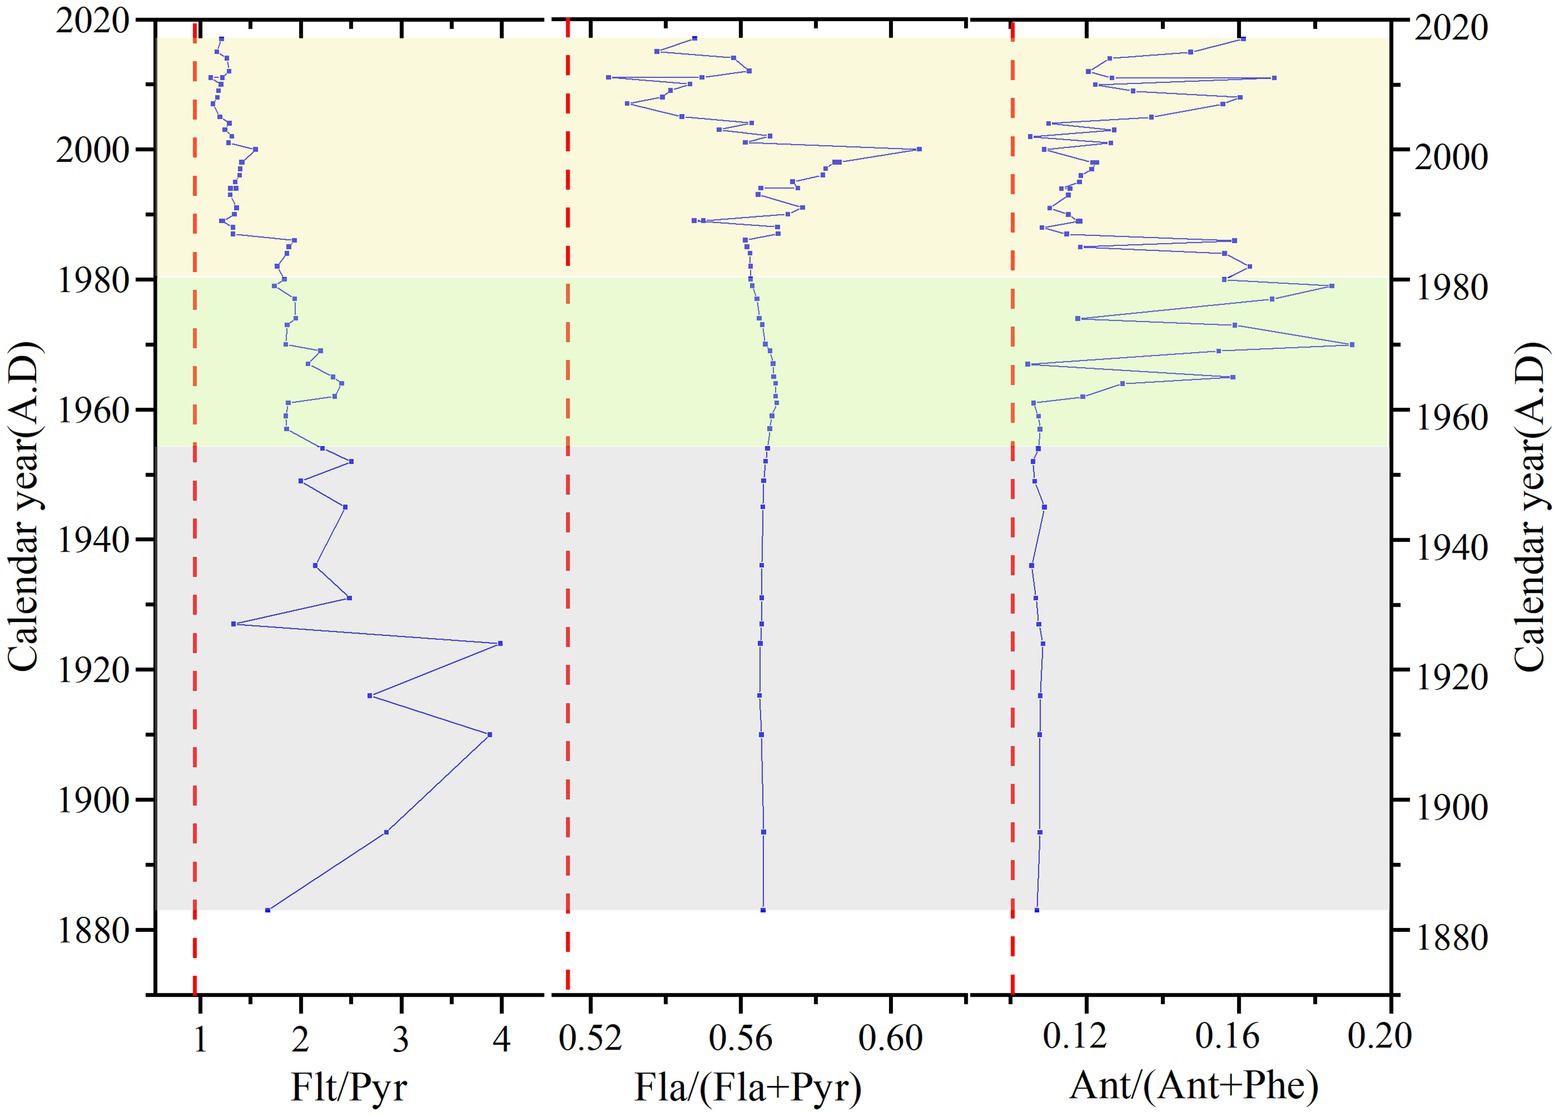
Figure 6. Variation of ratios of Flt/Pyr, Fla/(Fla + Pyr), and Ant/(Ant + Phe) in JDY peat core. The dashed lines indicated the boundaries for source assignments of PAHs after (Yunker et al., 2002).
Previous studies found that the BC particles emitted by diesel vehicle combustion were less than 50 nm and spherical in shape, with an agglomeration and long chain (Accardidey, 2003; Wang et al., 2015). The particle size and morphology of BC particles derived from gasoline vehicles are similar to those of diesel vehicles, but the polymerization is more obvious. BC particles emitted by coal burning are generally porous and not spherical in shape (Zhan et al., 2016). BC particles from biomass combustion releases have an irregular or lumpy shape and retain a plant fiber structure (porous or tubular; Masiello, 2004). The BC of samples at depths of 18 and 28 cm was lumpy or irregular in shape, which retained the structure of plant fibers (porous or tubular; Figure 7A,B), and indicated the effects of biomass combustion.
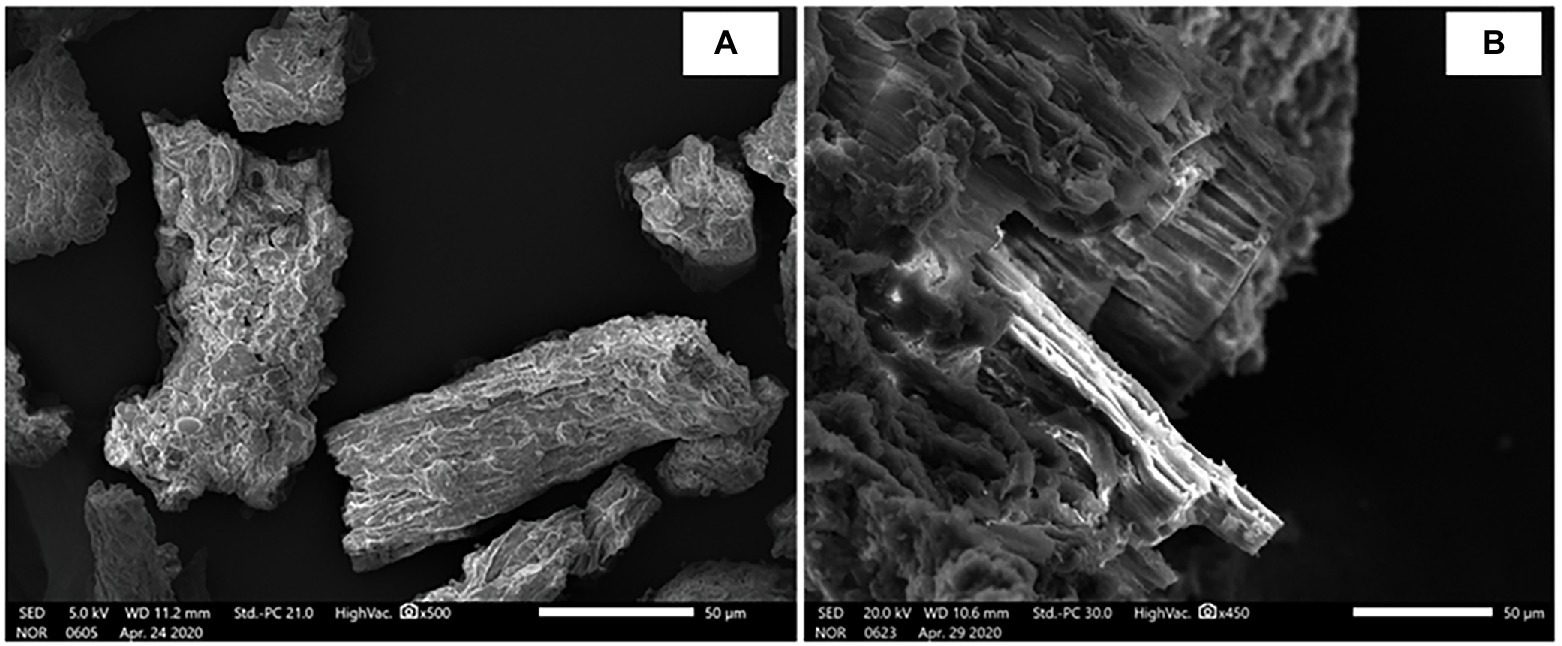
Figure 7. SEM images of BC examples from different samples. All scale bars represent 50 μm. (A) represents BC from biomass burning particles (BBP); (B) represents wood burning.
Compared with the regional background of China’s BC emissions (Gao et al., 2014), this study attempts to analyze the BC emission pattern in the Altay region during the last 150 years. The concentration of BC emissions in China has been increasing, especially after 1980, which is mainly controlled by the increase of industrial emissions (Figure 8A; Gao et al., 2014). However, the changes of BC content and BC flux in JDY show an increasing trend before 1980 but a decreasing trend after 1980 (Figure 8B). This is because the BC in JDY peat profile is mainly from biomass combustion, as discussed above. It was reported that the cultivated land area in 1949 from 9.43 km2 increased to 115.29 km2 in 1980 in Altay area (Statistics XUARBo, 2018). As a result, BC content in the JDY peatland significantly increased from 1950 to 1980. The decrease in the BC record in the peat is probably a response to the increasing regional environmental protection.
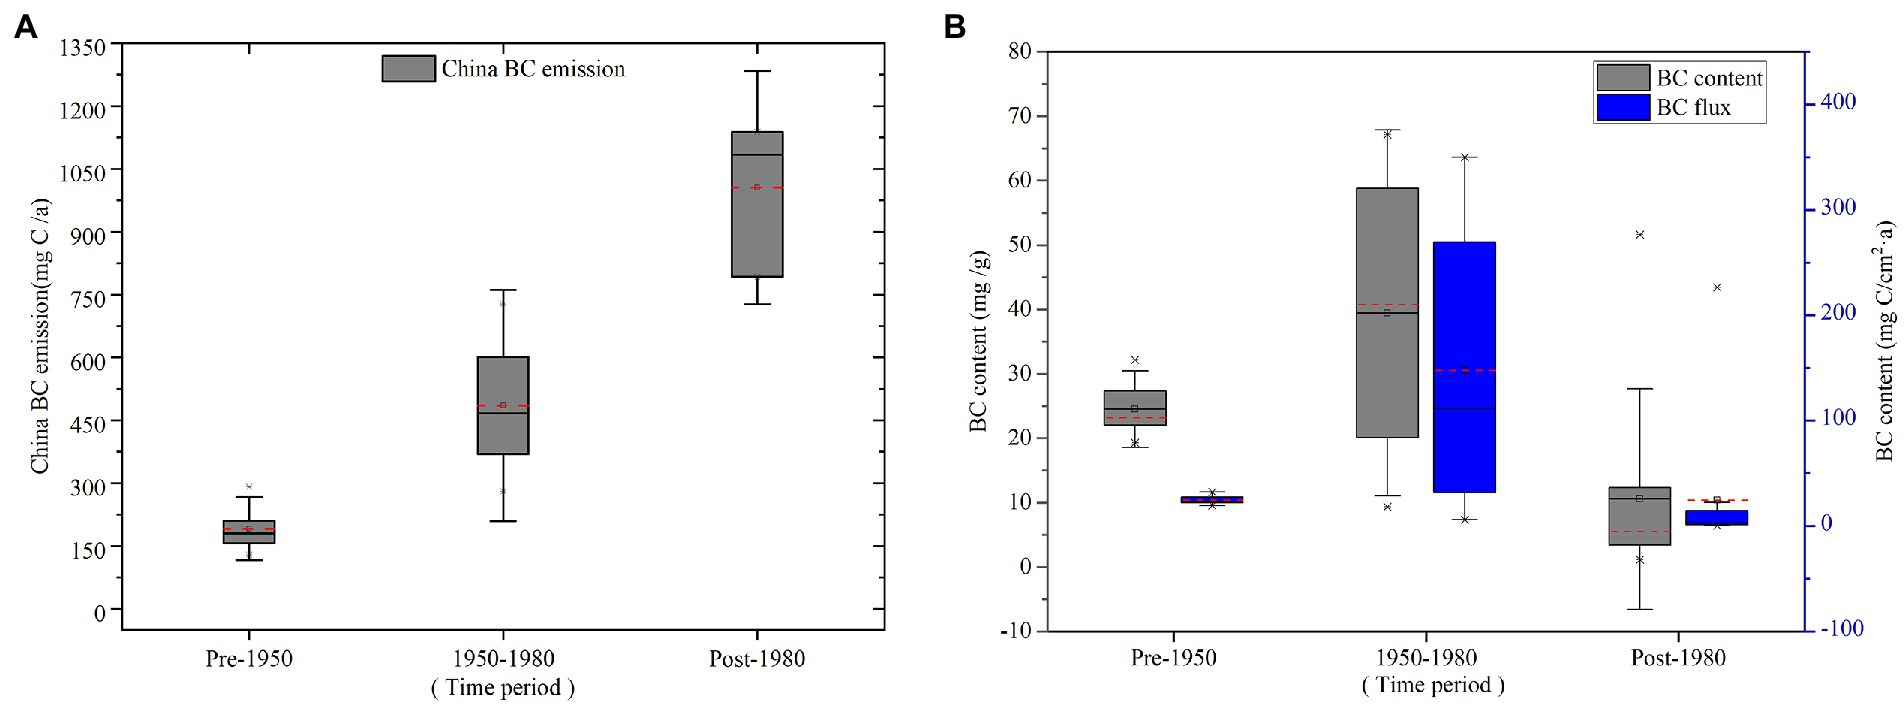
Figure 8. (A) Variation of China BC emission from different period, (B) BC content and BC flux from 1860 to 2019 in JDY peat core.
The average accumulation rate of BC in JDY peatland was 0.025 g·cm−2 year−1 since the 1880s. The range of δ13CBC was from 31.5 to −29.4‰. The results of SEM, δ13CBC, and the ratios of PAHs indicated that the dominant source of BC was the burning of C3 plants. The historical variations in BC content and flux were different from the national BC emission pattern in China. The JDY peat recorded an increase of BC emission in 1950–1980 probably due to the agricultural exploration and thus increasing crop burning. The decrease in the peat BC record after 1980 would be related to the increasing environmental protection.
The original contributions presented in the study are included in the article/supplementary material, further inquiries can be directed to the corresponding authors.
NL and KB: writing—original draft and writing—review. BW and XL: conceptualization, methodology, and supervision. RY and JS: methodology and investigation. All authors contributed to the article and approved the submitted version.
This research was funded by the National Basic Research Program of China (no. 2013FY111800), National Nature Science Foundation of China (no. 41971113), the Science and Technology Development Program of Jilin Province (Support Xinjiang), National Natural Science Foundation of China (no. 41701372), and Natural Science Foundation of Jilin Province (no. 20190103161JH).
The authors gratefully acknowledge the assistance of the Analysis and Test Center of the Northeast Institute of Geography and Agroecology, CAS.
The authors declare that the research was conducted in the absence of any commercial or financial relationships that could be construed as a potential conflict of interest.
All claims expressed in this article are solely those of the authors and do not necessarily represent those of their affiliated organizations, or those of the publisher, the editors and the reviewers. Any product that may be evaluated in this article, or claim that may be made by its manufacturer, is not guaranteed or endorsed by the publisher.
Accardidey, A. M. (2003). Black carbon in marine sediments: quantification and implications for the sorption of polycyclic aromatic hydrocarbons. Massach. Instit. Technol. 20, 171–177. doi: 10.1111/j.1748-1090.1980.tb00961.x
Ambade, B., Kurwadkar, S., Sankar, T. K., and Kumar, A. (2021a). Emission reduction of black carbon and polycyclic aromatic hydrocarbons during COVID-19 pandemic lockdown. Air Qual. Atmos. Health 14, 1–15. doi: 10.1007/s11869-021-01004-y
Ambade, B., and Sankar, T. K. (2021). Source apportionment and health risks assessment of black carbon aerosols in an urban atmosphere in East India. J. Atmos. Chem. 78, 177–191. doi: 10.1007/s10874-021-09418-9
Ambade, B., Sankar, T. K., Kumar, A., Gautam, A. S., and Gautam, S. (2021b). COVID-19 lockdowns reduce the black carbon and polycyclic aromatic hydrocarbons of the Asian atmosphere: source apportionment and health hazard evaluation. Environ. Dev. Sustain. 23, 12252–12271. doi: 10.1007/s10668-020-01167-1
Ba, A., Sss, A., Sk, B., Ak, A., and Tks, A. (2021). Toxicity and health risk assessment of polycyclic aromatic hydrocarbons in surface water, sediments and groundwater vulnerability in Damodar River basin. Groundw. Sustain. Dev. 13, 1–12. doi: 10.1016/j.gsd.2021.100553
Bao, K., Jia, L., Lu, X., and Wang, G. (2010). Grain-size characteristics of sediment in Daniugou peatland in Changbai Mountains, Northeast China: implications for atmospheric dust deposition. Chin. Geogr. Sci. 20, 498–505. doi: 10.1007/s11769-010-0427-z
Bird, M. I., and Ascough, P. L. Isotopes in pyrogenic carbon: a review. Org. Geochem. 42, 1529–1539. doi: 10.1016/j.orggeochem.2010.09.005
Bond, T. C., Bhardwaj, E., Dong, R., Jogani, R., Jung, S., Roden, C., et al. (2007). Historical emissions of black and organic carbon aerosol from energy-related combustion, 1850-2000. Glob. Biogeochem. Cycles 21. doi: 10.1029/2006GB002840
Bucheli, T. D., Blum, F., Desaules, A., and Gustafsson, O. (2004). Polycyclic aromatic hydrocarbons, black carbon, and molecular markers in soils of Switzerland. Chemosphere 56, 1061–1076. doi: 10.1016/j.chemosphere.2004.06.002
Cao, W., Geng, S. Y., Zou, J., Wang, Y. Y., Guo, Y. Q., Zhu, Y., et al. (2020). Post relocation of industrial sites for decades: ascertain sources and human risk assessment of soil polycyclic aromatic hydrocarbons. Ecotoxicol. Environ. Saf. 198, 1–9. doi: 10.1016/j.ecoenv.2020.110646
Chen, B., Andersson, A., Lee, M., Kirillova, E. N., Xiao, Q. F., Krusa, M., et al. (2013). Source forensics of black carbon aerosols from China. Environ. Sci. Technol. 47, 9102–9108. doi: 10.1021/es401599r
Cong, J. X., Gao, C. Y., Zhang, Y., Zhang, S. Q., He, J. B., and Wang, G. P. (2016). Dating the period when intensive anthropogenic activity began to influence the Sanjiang plain, Sci. Rep. 6, 1–9. doi: 10.1038/srep22153
Cong, Z., Kang, S., Gao, S., Zhang, Y., Li, Q., and Kawamura, K. (2013). Historical trends of atmospheric black carbon on Tibetan plateau as reconstructed from a 150-year Lake sediment record. Environ. Sci. Technol. 47, 2579–2586. doi: 10.1021/es3048202
Cordeiro, R. C., Turcq, B., Ribeiro, M. G., Lacerda, L. D., Capitaneo, J., da Silva, A. O., et al. (2002). Forest fire indicators and mercury deposition in an intense land use change region in the Brazilian Amazon (Alta Floresta, MT). Sci. Total Environ. 293, 247–256. doi: 10.1016/s0048-9697(02)00045-1
Forestry Bureau of Altay Mountains in Xinjiang (2003). Comprehensive scientific investigation of two river sources in Xinjiang Altai mountain nature reserve of China. Urumqi: Xinjiang Science and Technology Press.
Gao, C., Lin, Q., Zhang, S., He, J., and Wang, G. (2014). Historical trends of atmospheric black carbon on Sanjiang plain as reconstructed from a 150-year peat record. Sci. Rep. 4:5723
Gao, C., Liu, H., Cong, J., Han, D., Zhao, W., Lin, Q., et al. (2018). Historical sources of black carbon identified by PAHs and delta C-13 in Sanjiang plain of northeastern China. Atmos. Environ. 181, 61–69. doi: 10.1016/j.atmosenv.2018.03.026
Glaser, B., Dreyer, A., Bock, M., Fiedler, S., Mehring, M., and Heitmann, T. (2005). Source apportionment of organic pollutants of a highway-traffic-influenced urban area in Bayreuth (Germany) using biomarker and stable carbon isotope signatures. Environ. Sci. Technol. 39, 3911–3917. doi: 10.1021/es050002p
Gustafsson, O., and Gschwend, P. M. (1998). The flux of black carbon to surface sediments on the New England continental shelf. Geochim. Cosmochim. Acta 62, 465–472. doi: 10.1016/S0016-7037(97)00370-0
Hammes, K., Schmidt, M. W. I., Smernik, R. J., Currie, L. A., Ball, W. P., Nguyen, T. H., et al. (2007). Comparison of quantification methods to measure fire-derived (black/elemental) carbon in soils and sediments using reference materials from soil, water, sediment and the atmosphere. Glob. Biogeochem. Cycles 21, 1–18. doi: 10.1029/2006gb002914
Hammes, K., Smernik, R. J., Skjemstad, J. O., Herzog, A., Vogt, U. F., and Schmidt, M. W. I. (2006). Synthesis and characterisation of laboratory-charred grass straw (Oryza saliva) and chestnut wood (Castanea sativa) as reference materials for black carbon quantification. Org. Geochem. 37, 1629–1633. doi: 10.1016/j.orggeochem.2006.07.003
Han, Y., Cao, J., Jin, Z., Liu, S., and An, Z. (2010). Comparison of char and soot variations in sediments from Daihai and Taihu Lakes. Q. Sci. 30, 550–558. doi: 10.3969/j.issn.1001-7410.2010.03.13
Hu, K., Zhao, D. L., Liu, D. T., Ding, S., Tian, P., Yu, C. J., et al. (2020). Estimating radiative impacts of black carbon associated with mixing state in the lower atmosphere over the northern North China plain. Chemosphere 252, 1–13. doi: 10.1016/j.chemosphere.2020.126455
Kawashima, H., and Haneishi, Y. (2012). Effects of combustion emissions from the Eurasian continent in winter on seasonal δ~(13)C of elemental carbon in aerosols in Japan. Atmos. Environ. 46, 568–579. doi: 10.1016/j.atmosenv.2011.05.015
Kuhlbusch, T. A. J. (1995). Method for determining black carbon in residues of vegetation fires. Environ. Sci. Technol. 29, 2695–2702. doi: 10.1021/es00010a034
Lehndorff, E., Brodowski, S., Schmidt, L., Haumaier, L., Grootes, P. M., Rethemeyer, J., et al. (2015). Industrial carbon input to arable soil since 1958. Org. Geochem. 80, 46–52. doi: 10.1016/j.orggeochem.2015.01.003
Li, R., Han, Y., Wang, L., Shang, Y., and Chen, Y. J. (2019). Differences in oxidative potential of black carbon from three combustion emission sources in China. J. Environ. Manag. 240, 57–65. doi: 10.1016/j.jenvman.2019.03.070
Liu, H., Meng, Z.-H., Lv, Z.-F., Wang, X.-T., Deng, F.-Y., Liu, Y., et al. (2019). Emissions and health impacts from global shipping embodied in US-China bilateral trade. Nat. Sustain. 2, 1027–1033. doi: 10.1038/s41893-019-0414-z
Lohmann, R., and Lammel, G. (2004). Adsorptive and absorptive contributions to the gas-particle partitioning of polycyclic aromatic hydrocarbons:? State of knowledge and recommended Parametrization for modeling. Environ. Sci. Technol. 38, 3793–3803. doi: 10.1021/es035337q
Masiello, C. A. (2004). New directions in black carbon organic geochemistry. Mar. Chem. 92, 201–213. doi: 10.1016/j.marchem.2004.06.043
Neupane, B., Wang, J., Kang, S., Zhang, Y., Chen, P., Rai, M., et al. (2020). Black carbon and mercury in the surface sediments of Selin co, central Tibetan plateau: Covariation with total carbon. Sci. Total Environ. 721, 1–10. doi: 10.1016/j.scitotenv.2020.137752
Pontevedra-Pombal, X., Rey-Salgueiro, L., Garcia-Falcon, M. S., Martinez-Carballo, E., Simal-Gandara, J., and Martinez-Cortizas, A. (2012). Pre-industrial accumulation of anthropogenic polycyclic aromatic hydrocarbons found in a blanket bog of the Iberian Peninsula. Environ. Res. 116: 36–43. doi: 10.1016/j.envres.2012.04.015
Preston, C. M., and Schmidt, M. W. I. (2006). Black (pyrogenic) carbon: a synthesis of current knowledge and uncertainties with special consideration of boreal regions. Biogeosciences 3: 397–420. doi: 10.5194/bg-3-397-2006
Qi, L., and Wang, S. X. (2019). Fossil fuel combustion and biomass burning sources of global black carbon from GEOS-Chem simulation and carbon isotope measurements. Atmos. Chem. Phys. 19, 11545–11557. doi: 10.5194/acp-19-11545-2019
Ruppel, M. M., Gustafsson, O., Rose, N. L., Pesonen, A., Yang, H. D., Weckstrom, J., et al. (2015). Spatial and temporal patterns in black carbon deposition to dated Fennoscandian Arctic Lake sediments from 1830 to 2010. Environ. Sci. Technol. 49, 13954–13963. doi: 10.1021/acs.est.5b01779
Sage, R. F., and Wedin, D. A. (1999). The biogeography of C4 photosynthesis: Patterns and controlling factors.
Saiz, G., Wynn, J. G., Wurster, C. M., Goodrick, I., Nelson, P. N., and Bird, M. I. (2015). Pyrogenic carbon from tropical savanna burning: production and stable isotope composition. Biogeosciences 12, 1849–1863. doi: 10.5194/bg-12-1849-2015
Shen, X., Wang, P., Zhang, X., Cao, X., Shi, Y., Li, X., et al. (2020). Real-time measurements of black carbon and other pollutant emissions from residential biofuel stoves in rural China. Sci. Total Environ. 727:138649. doi: 10.1016/j.scitotenv.2020
Smith, D. M., Griffin, J. J., and Golderg, E. D. (1973). Elemental carbon in marine sediments: a baseline for burning. Nature 241, 268–270. doi: 10.1038/241268a0
Sun, W. W., Zhang, E. L., Liu, E. F., Ji, M., Chen, R., Zhao, C., et al. (2017). Oscillations in the Indian summer monsoon during the Holocene inferred from a stable isotope record from pyrogenic carbon from Lake Chenghai, Southwest China. J. Asian Earth Sci. 134, 29–36. doi: 10.1016/j.jseaes.2016.11.002
Wang, H. L., Nie, L., Liu, D., Gao, M. P., Wang, M. Y., and Hao, Z. P. (2015). Physico-chemical characterization and source tracking of black carbon at a suburban site in Beijing. J. Environ. Sci. 33, 188–194. doi: 10.1016/j.jes.2015.05.001
Wang, X., Peng, P. A., and Ding, Z. L. (2005). Black carbon records in Chinese loess plateau over the last two glacial cycles and implications for paleofires. Palaeogeogr. Palaeoclimatol. Palaeoecol. 223: 9–19. doi: 10.1016/j.palaeo.2005.03.023
Yunker, M. B., Macdonald, R. W., Vingarzan, R., Mitchell, R. H., Goyette, D., and Sylvestre, S. (2002). PAHs in the Fraser River basin: a critical appraisal of PAH ratios as indicators of PAH source and composition. Org. Geochem. 33, 489–515. doi: 10.1016/S0146-6380(02)00002-5
Zhan, C., Wan, D., Zhang, J., Han, Y., Cao, J., and Liu, X. (2016). Source apportionment of black carbon in the environment: a review of methods. Ecol. Environ. Sci. 25, 1575–1583. doi: 10.16258/j.cnki.1674-5906.2016.09.023
Zhang, Y., Ma, X., Liu, X., Tong, C., and Yang, P. (2018). Preliminary study on the morphology, development process and peat accumulation rate of palsas during the holocene in the Altai mountains, northern Xinjiang autonomous region, Northwest China. Q. Sci. 38, 1221–1232. doi: 10.11928/j.issn.10017410.2018.05.16
Keywords: peatlands, black carbon, PAHs, δ13 CBC, Altay Mountains
Citation: Luo N, Wen B, Bao K, Yu R, Sun J, Li X and Liu X (2022) Centennial records of Polycyclic aromatic hydrocarbons and black carbon in Altay Mountains peatlands, Xinjiang, China. Front. Ecol. Evol. 10:1046076. doi: 10.3389/fevo.2022.1046076
Edited by:
Adriana Aránguiz-Acuña, Universidad de Tarapacá, ChileReviewed by:
Shijun Jiang, Hohai University, ChinaCopyright © 2022 Luo, Wen, Bao, Yu, Sun, Li and Liu. This is an open-access article distributed under the terms of the Creative Commons Attribution License (CC BY). The use, distribution or reproduction in other forums is permitted, provided the original author(s) and the copyright owner(s) are credited and that the original publication in this journal is cited, in accordance with accepted academic practice. No use, distribution or reproduction is permitted which does not comply with these terms.
*Correspondence: Bolong Wen, Qm9sb25nV2VuQGlnYS5hYy5jbg==; Kunshan Bao, a3NiYW9Ac2NudS5lZHUuY24=
Disclaimer: All claims expressed in this article are solely those of the authors and do not necessarily represent those of their affiliated organizations, or those of the publisher, the editors and the reviewers. Any product that may be evaluated in this article or claim that may be made by its manufacturer is not guaranteed or endorsed by the publisher.
Research integrity at Frontiers
Learn more about the work of our research integrity team to safeguard the quality of each article we publish.