 Yongxing Ren1,2
 Dehua Mao
 Xiaoyan Li
 Zongming Wang
94% of researchers rate our articles as excellent or good
Learn more about the work of our research integrity team to safeguard the quality of each article we publish.
Find out more
ORIGINAL RESEARCH article
Front. Ecol. Evol., 10 November 2022
Sec. Environmental Informatics and Remote Sensing
Volume 10 - 2022 | https://doi.org/10.3389/fevo.2022.1043811
This article is part of the Research TopicRemote Sensing of Aquatic Environment and Its Implication for Environmental ManagementView all 8 articles
Examining vegetation aboveground biomass (AGB) changes is important to understanding wetland carbon sequestration. Here, we combined the field-measured AGB data (458 samples) from 2009 to 2021, moderate resolution imaging spectroradiometer reflectance products, and climatic data to reveal the AGB variations of marshes in Northeast China by comparing various models driven by different indicators. The results indicated that random forest model driven by six vegetation indices, land surface temperature, and land surface water index achieved accurate marsh AGB estimation with R2 being 0.78 and relative error being 16.71%. The mean marsh AGB in Northeast China from 2000 to 2021 was 682.89 ± 31.69 g·m−2, which generally increased from north to south in space. Temporally, annual marsh AGB declined slowly at a rate of 3.45 g·m−2·year−1 during the past 21 years driven mainly by the decrease in summer mean temperature that was characterized by a significantly positive correlation between them. Nevertheless, we highlighted that the temporal changes of marsh AGB spatially varied in response to inconsistent climate change, thus place-based measures are required for sustainable management of marshes.
As an important carbon pool in the Earth’s surface system, wetlands play an important role in global carbon cycle (Mitra et al., 2005; Batjes, 2014; Dargie et al., 2017). Wetland vegetation aboveground biomass (AGB) is regarded as a critical indicator of wetland ecosystem carbon sequestration capacity (Chopping et al., 2008; Shen et al., 2020; Temmink et al., 2022). Marsh is the most widely distributed vegetated wetland type and majorly contributes to terrestrial ecosystem carbon storage (Rocha and Goulden, 2009). Under the background of global change, the research on carbon sequestration capacity of marsh vegetation has become one of the important contents of global carbon cycle (Ewe et al., 2006; Cook et al., 2009; Byrd et al., 2018). Understanding the spatial pattern and temporal changes of marsh AGB in response to climate change relies on accurate spatial prediction and is of great significance for studies of terrestrial carbon sequestration.
Estimation of marsh AGB at large scales relying on a valid spatiotemporal prediction model has attracted tremendous efforts (Byrd et al., 2018; Shen et al., 2021). Previous studies have indicated a good correlation between marsh AGB and the vegetation index such as normalized difference vegetation index (NDVI) and enhanced vegetation index (EVI; Neba et al., 2014; Lu et al., 2022), therefore, vegetation index and power function model was often used to estimate marsh AGB (Gao et al., 2013; Wang et al., 2021). Whereas, marsh is non-zonal ecosystem with various vegetation types and discontinuous distribution, and its spectral information is clearly affected by surface water (Wan et al., 2019). Therefore, it is necessary to consider multiple factors comprehensively for estimating marsh AGB avoiding the uncertainty associated with using single vegetation index. Although multiple linear regression driven by multiple variables can effectively describe the linear relationship between marsh AGB and remotely sensed variables (O'Shea et al., 2021; Zhao et al., 2022), the results are unsatisfactory when faced with complex relationships between factors. In recent years, sophisticated machine-learning models have been widely used and indicated good results in spatially predicting ecological parameters (Ren et al., 2020; Li et al., 2022). Machine-learning algorithm, i.e., random forest, can fully consider the complex relationships and influences from different variables to achieve a better estimation of marsh AGB (Grimm et al., 2008; Wiesmeier et al., 2011). There are often differences in the accuracy of different models, mainly caused by different model mechanisms, incomplete specification of processes, and key inputs and parameters (Breiman, 2001; Ren et al., 2020). Therefore, it is necessary to compare different models to select the best model to simulate marsh AGB.
Climate change and anthropogenic disturbances are the main forces to the inter-annual change in marsh AGB. Warming climate can increase marsh AGB via promoting vegetation productivity, while increasing precipitation can promote vegetation growth and increase marsh AGB (Shen et al., 2021). Understanding the impacts of different climatic and anthropogenic factors on marsh AGB is critical to predict how marsh AGB change. Currently, there is still a lack of systematic studies on the response of marsh AGB to climate change on an annual scale or in different periods.
Northeast China has the largest area of marshes in China, which are important for protecting species diversity and regulating the regional climate and hydrology (Mao et al., 2014). Northeast China is also a climate change sensitive region in middle-and high-latitudes (Mao et al., 2020). This region has experienced increased precipitation and warmer temperature over the past few decades (Yao et al., 2018; Li et al., 2021). Specifically, the temperature increase in winter is significantly higher than that in summer, and changes in precipitation and temperature have been spatially heterogeneous (Zhao et al., 2021). Previous estimates based on site-scale measurements have revealed the spatial pattern and storage of marsh AGB (Suo et al., 2010; Li et al., 2011; Zhao et al., 2022). However, our knowledge about the long-term marsh AGB variations in response to climate change needs to be furtherly enhanced. Examining the spatial and temporal changes of marsh AGB and its relationship with climatic variables will benefit to understanding regional marsh responses to global change and carbon cycle.
The main purpose of this paper is to estimate the spatial and temporal distribution of marsh AGB in Northeast China, and quantify the responses of marsh AGB to climate change. The specific objectives of this study are to: (1) develop an optimal marsh AGB prediction model based on the field-measured data and moderate resolution imaging spectroradiometer (MODIS) data by comparing liner regression and machine-learning models, (2) examine the spatial pattern and annual changes of marsh AGB from 2000 to 2021, and (3) explore the impacts of climate change to marsh AGB.
Northeast China covering Heilongjiang, Jilin, and Liaoning Provinces, as well as the eastern parts of the Inner Mongolia Autonomous Region extends from 115°32′E to 135°09′E and from 38°42′N to 53°35′N (Figure 1). Northeast China locates on the corridor of migratory birds in East Asia-Australia (Kirby et al., 2008; Gu et al., 2021). Marshes are widely distributed in this area, with a total area of 76.7 × 10³ km2 in 2015 (Mao et al., 2018). A total of 18 wetland sites with international importance (Ramsar sites) distribute in this region. Northeast China includes three climatic divisions: semi-arid region, semi-humid region, and humid region. Spatially, temperature in this region increased gradually from north to south, with a mean annual value of −4°C to 12°C. Precipitation varies significantly within and between years, with 70% to 80% of total precipitation occurring between mid-June and mid-August. Precipitation decreases from 1,100 mm in the southeast to 250 mm in the northwest (Yao et al., 2018).
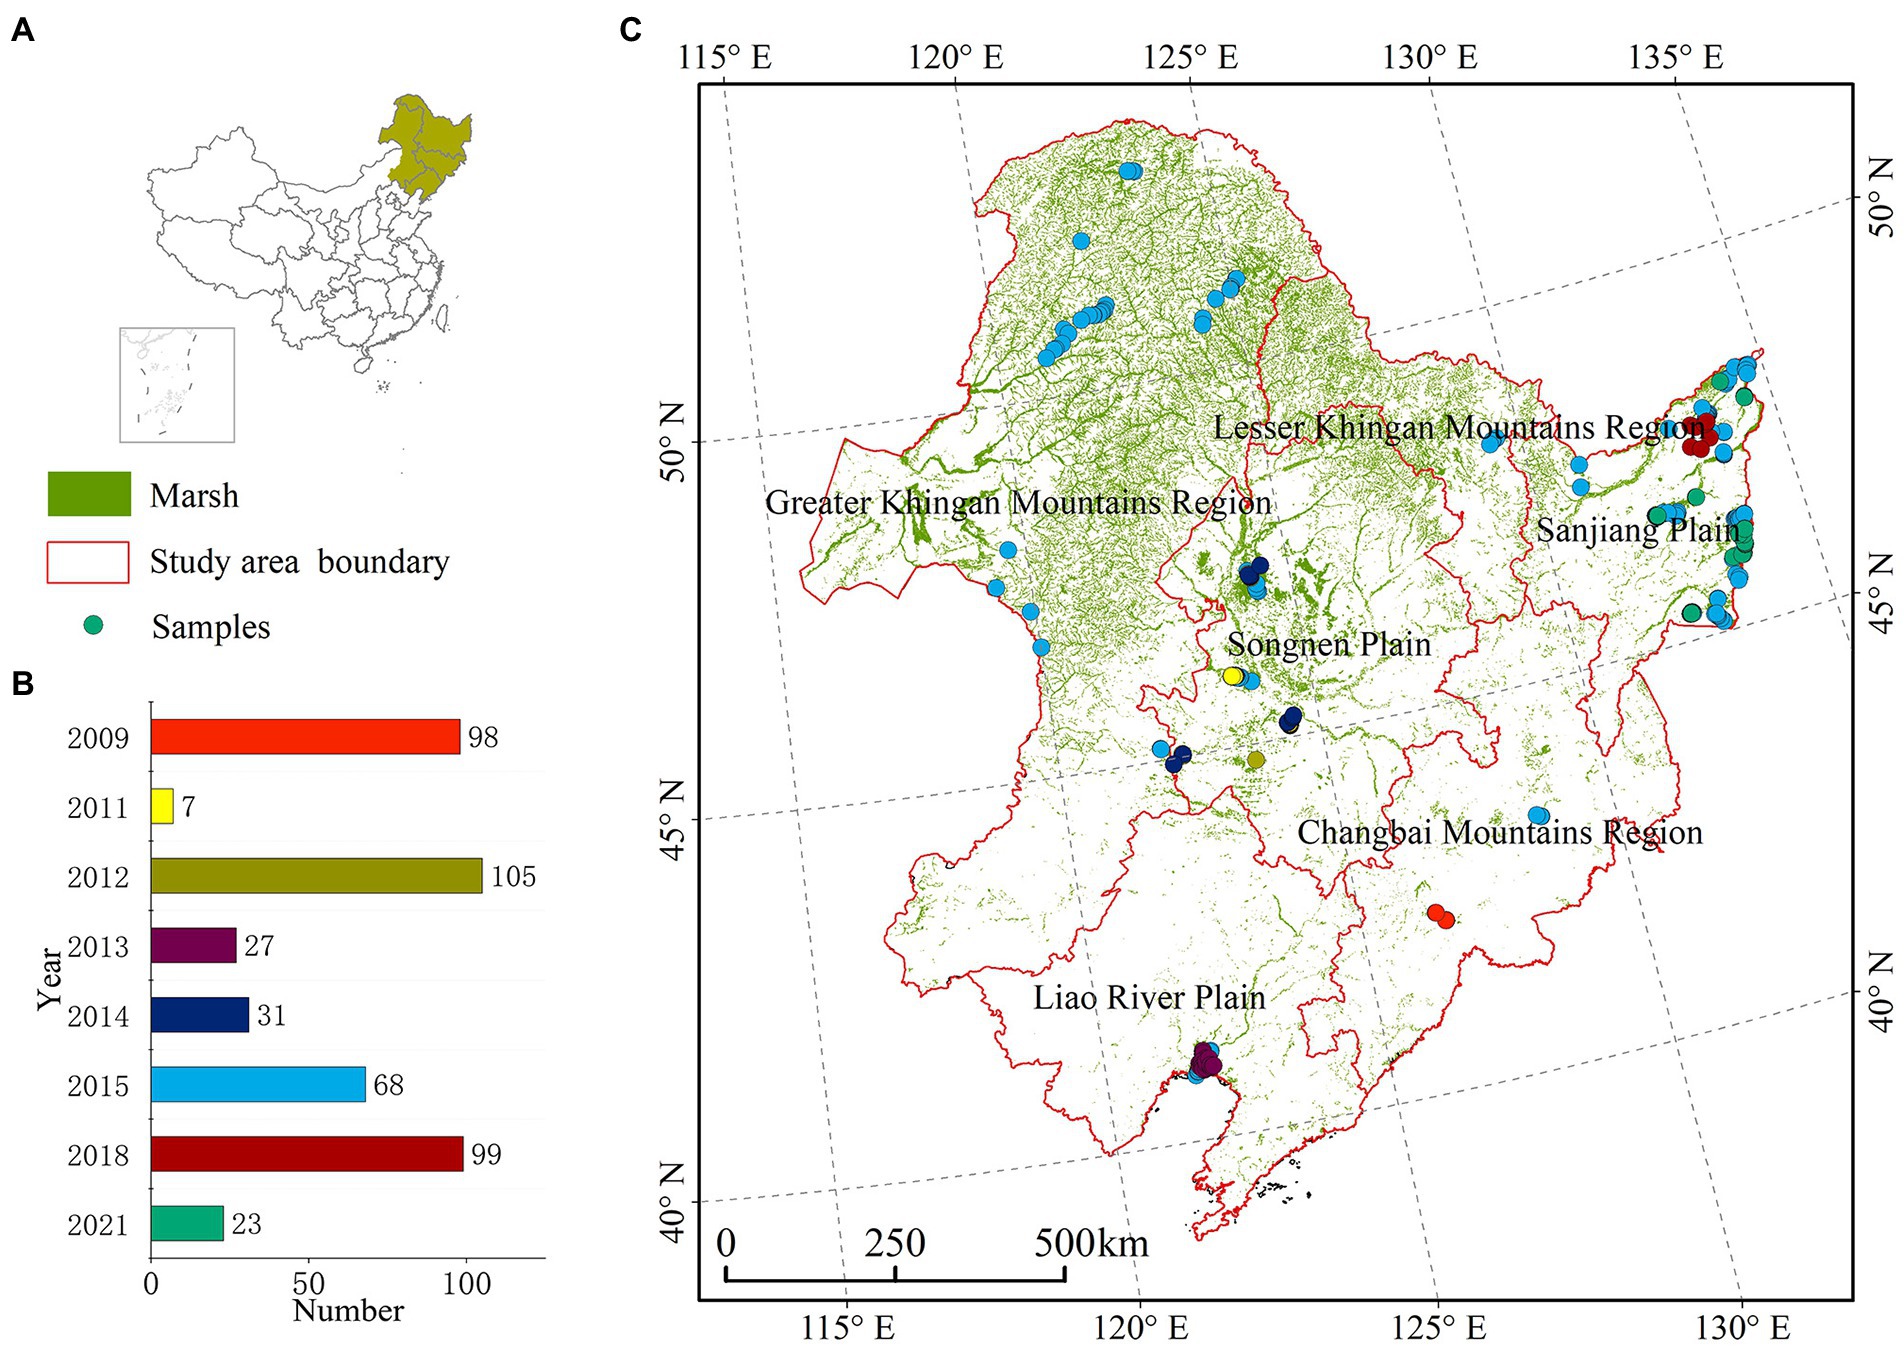
Figure 1. Location of Northeast China (A), spatial distribution of marshes and filed sampling sites of aboveground biomass (AGB) in Northeast China (B), and number of sampling sites in different years (C).
The marsh distribution dataset was extracted from the Landsat OLI images with a spatial resolution of 30 m in 2015 using the hybrid object-based and hierarchical classification approach (Mao et al., 2020). The dataset achieved reliable classification with an overall accuracy of 95.1% and thus has been used in many research (Yang et al., 2020; Zhang et al., 2021). For a comparative analysis of the spatial differences in marsh AGB, the study area was divided into six geographic regions referencing the study (Mao et al., 2019) including the Greater Khingan Mountains Region, Sanjiang Plain, Changbai Mountains Region, Lesser Khingan Mountains Region, Liao River Plain, and Songnen Plain (Figure 1).
We totally collected 458 sample plots in August from 2009 to 2021, as shown in Figure 1. All those sample plots were investigated with three repeats (0.5 m × 0.5 m) to get the mean value (1 m × 1 m) of the AGB. Fully considered the distribution of marshes, community types, and the accessibility of traffic, the sampling points were designed to evenly distributed as far as possible in order to represent the marshes in the whole study area. We recorded the geographic coordinates, elevation, and vegetation type for each plot. Marsh community types include Phragmites australis, Deyeuxia angustifolia, Carex spp., Carex tato, Carex lasiocarpa, Carex appendiculata, and Manna grass. The in-situ AGB samples were taken into the laboratory, oven-dried at 65°C, and then weighed to the nearest 0.01 g.
In this study, we used MODIS reflectance products (MOD09A1, MOD11A2, and MOD113A1) from 1 June 2000 to 1 October 2021 archived in the Google Earth Engine (GEE) cloud platform. Five vegetation indices were selected to perform regression analysis. NDVI, EVI, weighted difference vegetation index (WDVI), ratio vegetation index (RVI), and modified soil adjusted vegetation index (MSAVI) were calculated, as shown in Table 1.
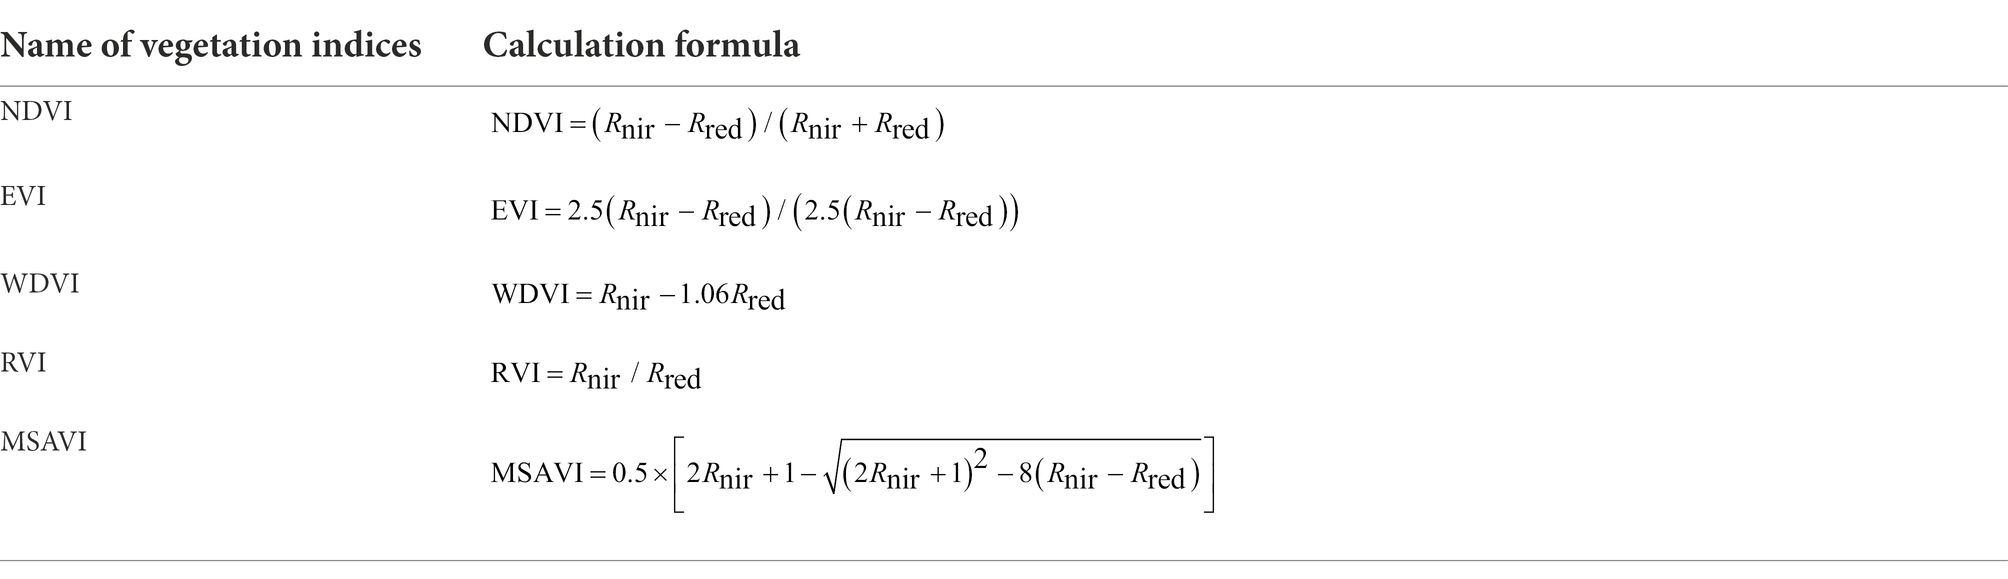
Table 1. Vegetation indices and calculation formulas.
Land surface temperature (LST) is related to growing duration and physiological activity of the top canopy leaves (Sims et al., 2008), while land surface water index (LSWI) is a representative parameter of land surface water content (Xiao et al., 2004). In some ecological process models that estimate net primary productivity or gross primary productivity, LST and LSWI were used to calculate the coefficient of temperature and water stress restriction, respectively (Kalfas et al., 2011). Therefore, LST and LSWI were used to characterize the hydrothermal condition. LST dataset (MOD11A2) was stored on grid as the average values of clear sky LST during 8-day periods. We calculated LSWI as follows:
We used the mean values during the growing season (May 1 to September 30) as the yearly data. We also calculated the annual NDVI Max as a simulation variable due to its good performance in simulating vegetation biomass (Wang et al., 2021).
Mean annual temperature, annual precipitation, seasonal average temperature, seasonal precipitation, monthly average temperature, and average precipitation were obtained from meteorological records during 1999–2021. These data were downloaded from the National Tibetan Plateau Data Center.1
We established multiple models (single-factor power function model, multiple linear regression models, and random forest models) with different combinations of input indicators, and selected the optimal model by comparing R2, relative error and root mean square error (RMSE). A 10-fold cross-validation method was used to evaluate the performance of the models. In this method, the whole dataset was randomly split into 10 folds, each of which contained 10% of the data. One fold of data was used as test data, while the other nine folds were used as training data. Then, another fold of data was used as test data and the remaining ones as training data, and so on and so ninth for a total of 10 times. Averages of 10 sets of R2, relative error, and RMSE were used as the model R2, relative error, and RMSE, respectively.
Single-factor power function model has been widely used to estimate AGB (Wang et al., 2021). The power function equation model is expressed as follows:
the above expression represents the true relationship between variables Y and x, where Y is the dependent variable marsh AGB, x is the independent remote sensing variable, is the coefficient, and is the power.
Multiple linear regression model is used to fit the curvilinear correlation between vegetation index and AGB, using an exponential model or high-order equation (Zhao et al., 2022). Although the model fitting accuracy has been improved, due to the basis of the algorithm itself, there will be large errors in the inversion results for uneven areas of vegetation coverage. The polynomial equation is the basic model of AGB, and the formula is as follows:
where is the dependent variable vegetation AGB, (i = 1, 2, … n) is the independent remote sensing variable, k is the number of explanatory variables, (j = 1, 2, … k) is the regression coefficient, and u is the error coefficient. The above formula is also known as the random expression of the population regression function.
The random forest regression is a machine-learning algorithm that takes an ensemble learning approach for prediction (Breiman, 2001). The algorithm generates the final results by averaging the class allocation probabilities of all produced trees. The trees are created by replacing a subset of training samples and randomly selecting variables in the R environment (v.4.0.2). It can estimate the importance of predictor variables and run efficiently on large databases (Akpa et al., 2016). When training the random forest model, we adjust the parameters of the model (mtry = 3, ntree = 500) to achieve the best model accuracy.
To explore potential impacts of climate change on the marsh AGB, Pearson’s correlation coefficient (R) between marsh AGB and annual, seasonal, and monthly temperature and precipitation in Northeast China were calculated according to the following formula:
where n is the number of years studied, i.e., 22 years, is the correlation coefficient between variable x and y; is the value of AGB for year i; is the value of climate factors for year ; and are the average value of the AGB and the climate factors, respectively.
It is worth noting that marsh AGB is the largest in August in Northeast China, and the climatic conditions in winter will not affect the AGB of that year. But winter temperatures and snow may affect vegetation growth the following year (Wahren et al., 2005; Heidi et al., 2009). Therefore, we performed the correlation analysis between the temperature and precipitation in winter and the marsh AGB in the following year.
In order to examine the spatial pattern and annual variations of marsh AGB, we made five steps to achieve our objects (Figure 2). First, we used the MODIS reflectance and equation to calculate the raster dataset of vegetation index and LSWI from 2000 to 2021. Second, we completed data cleaning, preprocessing, and quality control before data analysis. The raster dataset of MODIS and meteorological factors was resampled to 30 m resolution using the nearest neighbor method, to match with the raster grids of marshes. Third, we extracted the raster dataset of the corresponding year based on the coordinates of the field samples. Forth, we established and evaluated different regression models based on remote sensing and field observation data. Then we selected the optimal model for estimating marsh AGB based on the accuracy evaluation results. Moreover, we investigated the impact of climate change on marsh AGB. The downloading and processing of raster data were achieved on the GEE cloud platform, and the model establishment was performed in the R software (v. 4.0.2).
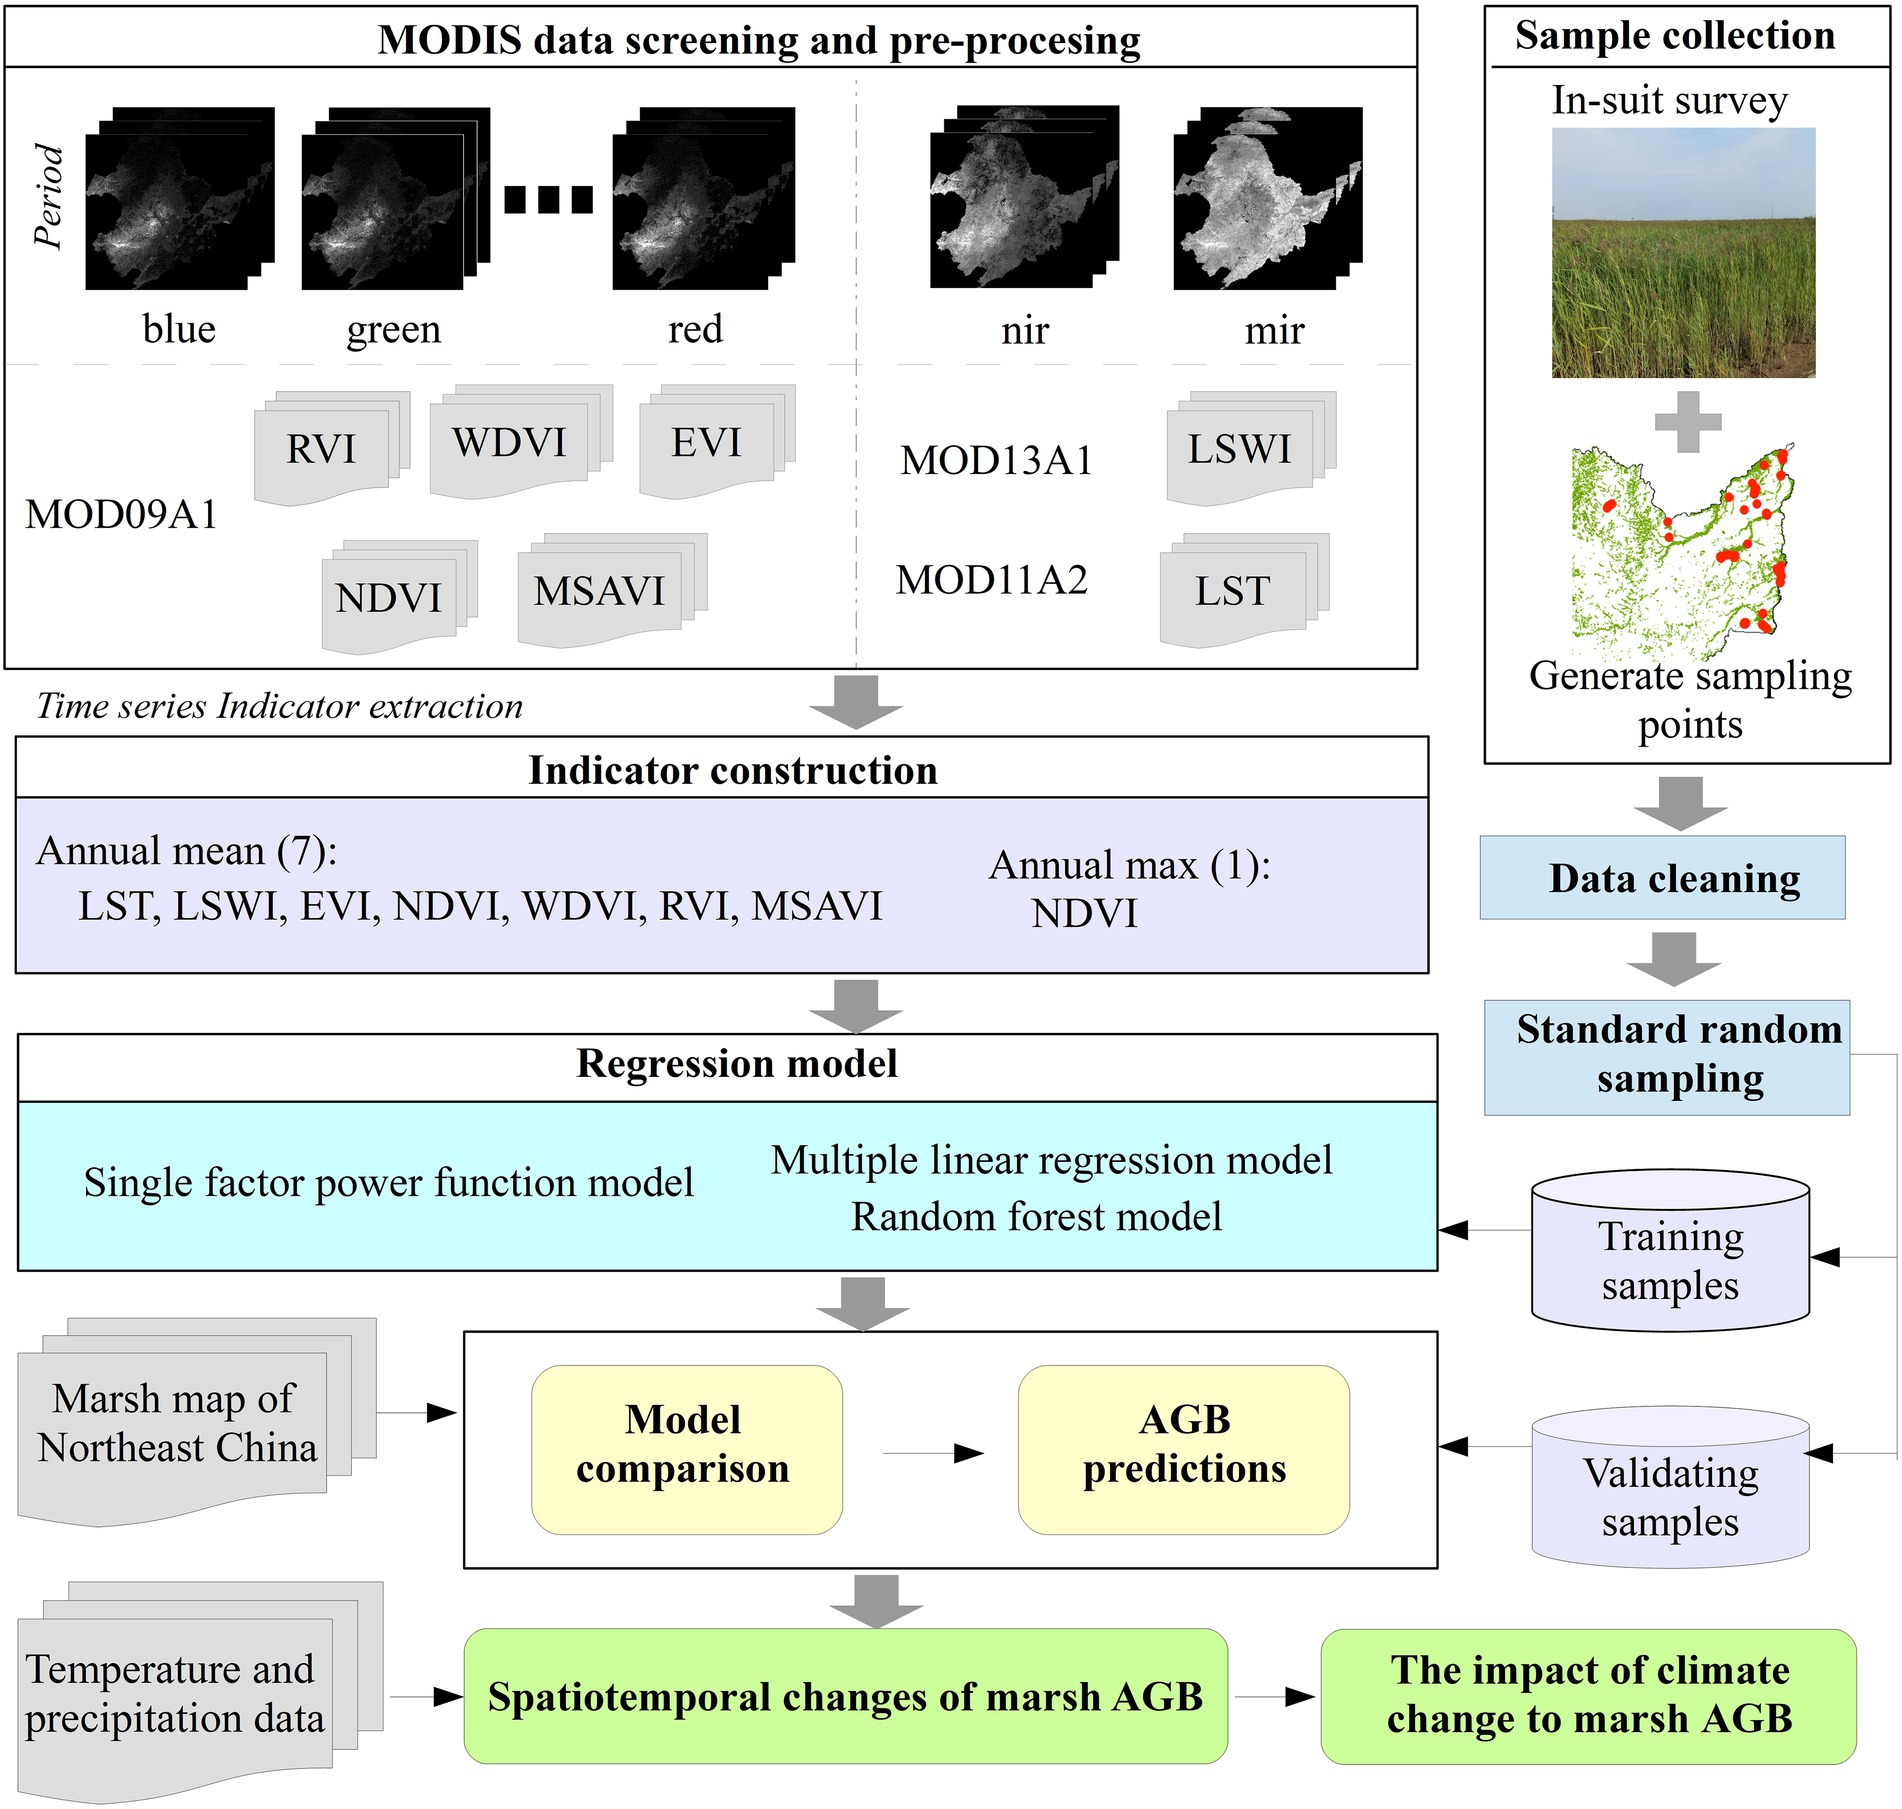
Figure 2. Flowchart for quantifying marsh AGB.
Table 2 presents the results of the single-factor power function model, the multiple linear regression model, and random forest model. As revealed, the random forest model driving by vegetation indices, LSWI, and LST achieved the best performance of predicting AGB with R2 of 0.78, relative error of 16.71%, and RMSE of 163.18. The accuracies of the models based on single vegetation index were low. The accuracies of the multi-factor model were significantly higher than that of the single-factor model. Among the models with the same factors, the accuracy of the random forest model was significantly higher than that of the multiple linear regression model. After adding the LST and LSWI, the accuracy of the multiple linear regression model and random forest model was significantly increased, resulting in the R2 of 0.67 and 0.78, respectively. Therefore, random forest model driving by vegetation indices, LSWI, and LST was selected in this study to estimate marsh AGB in Northeast China.
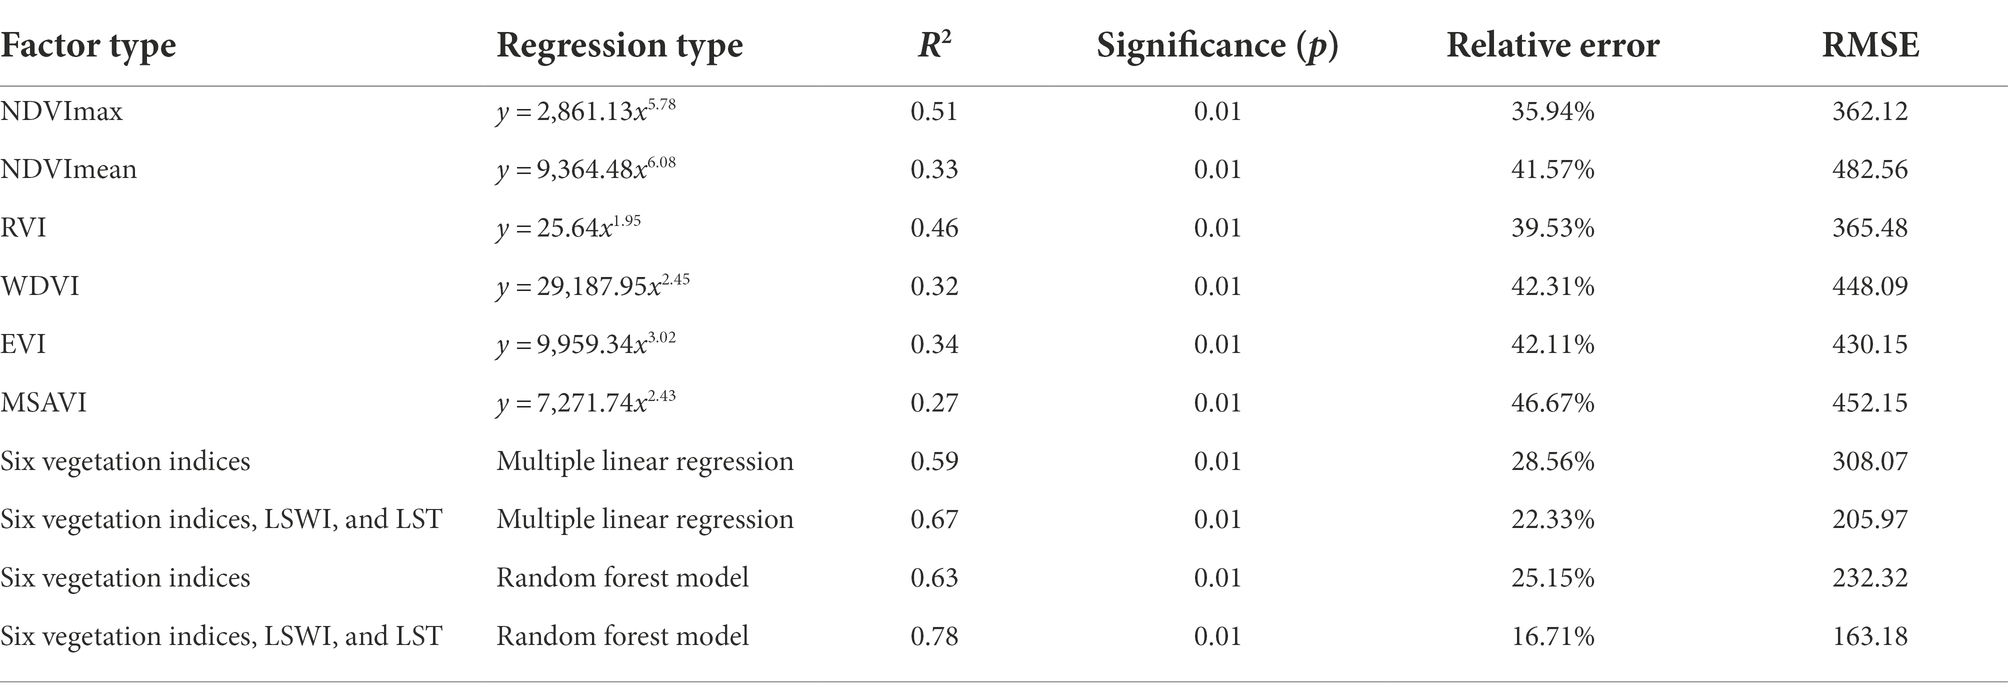
Table 2. Regressive results for estimating marsh aboveground biomass (AGB).
It was estimated that averaged marsh AGB from 2000 to 2021 was about 682.89 ± 31.69 g·m−2 (Figure 3). There was an obvious spatial heterogeneity for the mean annual marsh AGB in Northeast China (Figure 4). In general, marsh AGB exhibited a decreasing trend with increase of latitude. The highest values of marsh AGB were mainly found in the Liao River Plain, while low marsh AGB values, about 600 g·m−2, were primarily observed in the Greater Khingan Mountains Region and Lesser Khingan Mountains Region. From 2000 to 2021, the mean marsh AGB in Northeast China decreased slowly at a rate of 3.45 g·m−2·year−1. Annual changes of marsh AGB in Northeast China had obvious spatial heterogeneities. There were 71.16% of marsh AGB in Northeast China with a downward trend (Figure 4).
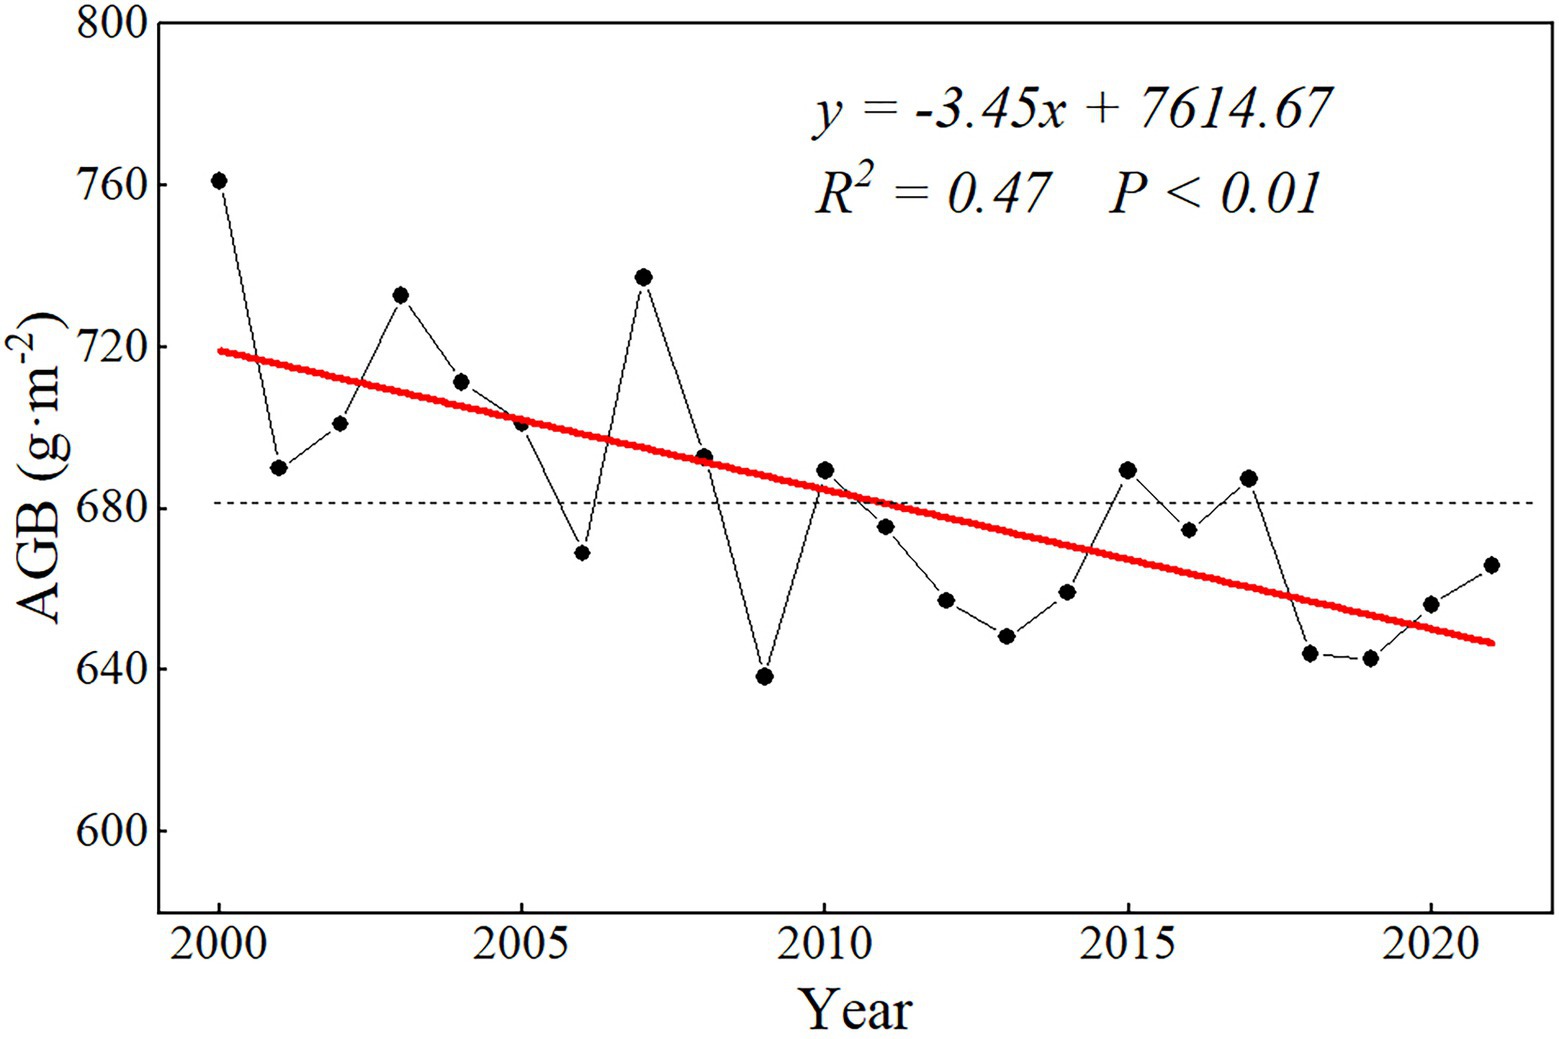
Figure 3. Temporal variation of marsh AGB in Northeast China from 2000 to 2021.
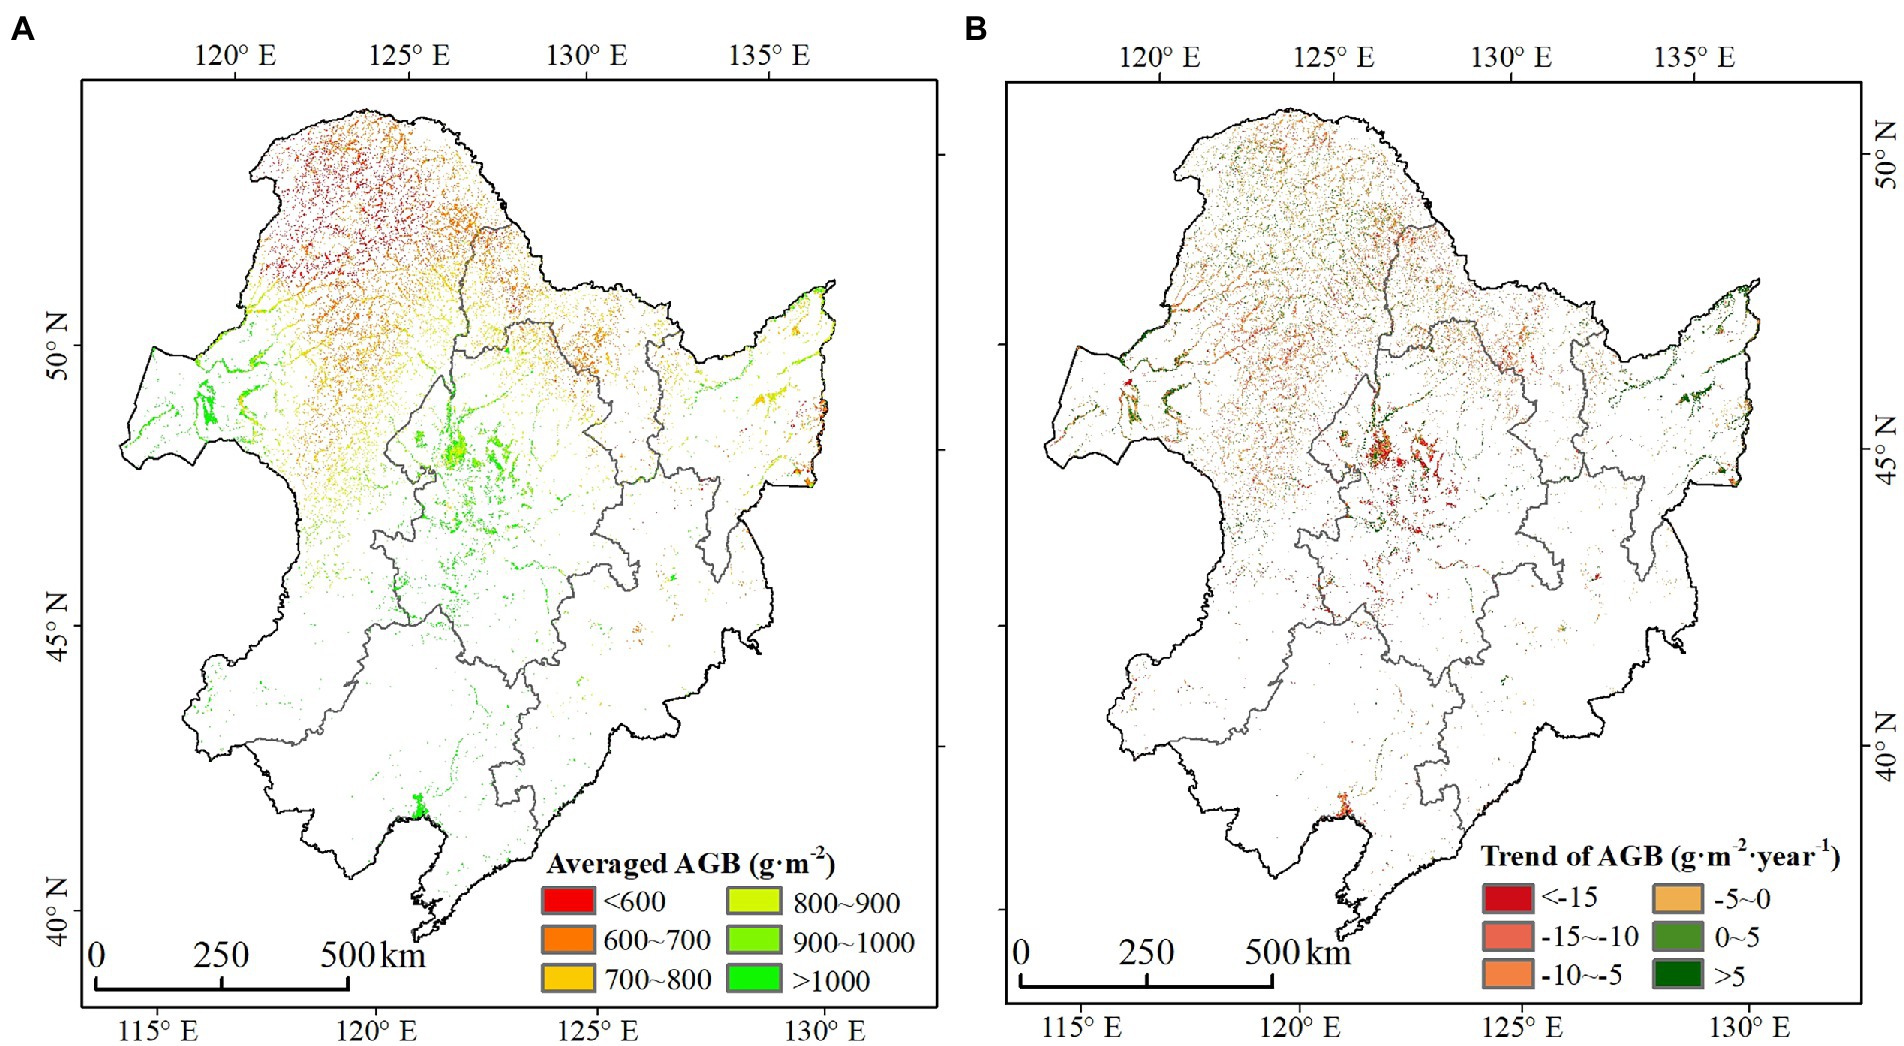
Figure 4. (A) Spatial patterns of averaged marsh AGB (g·m−2) and (B) variation trend of marsh AGB (g·m−2·year−1) from 2000 to 2021.
The correlation analysis suggested that marsh AGB had a significant positive correlation (r = 0.69, p < 0.01) with annual average temperature, and a positive correlation (r = 0.34, p < 0.05) with annual precipitation in Northeast China (Table 3). Marsh AGB in different seasons was positively correlated with the corresponding seasonal average temperature with significance at 95% level. In addition, marsh AGB was positively correlated (r = 0.26, p < 0.05) with summer precipitation (Table 3).
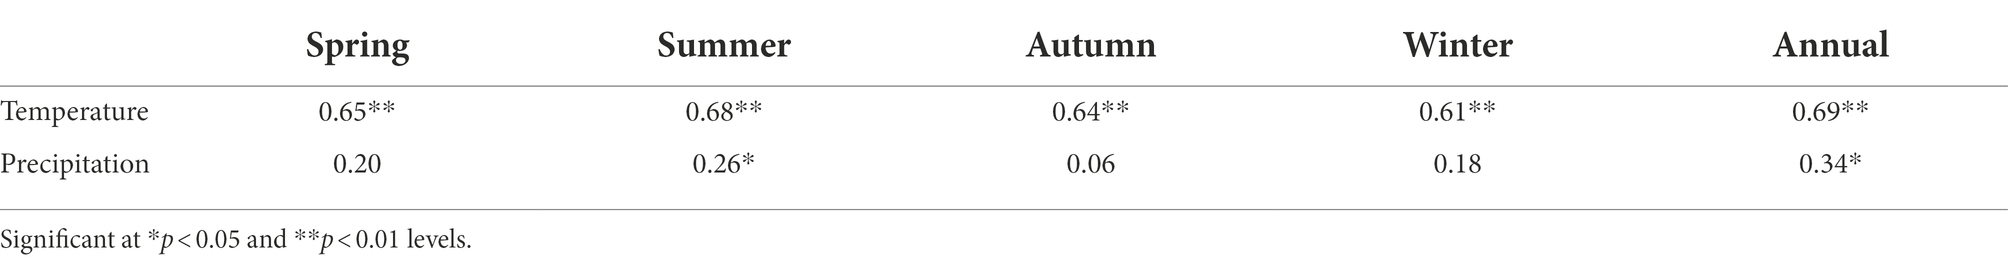
Table 3. Correlation coefficients between marsh AGB and seasonal climatic variables in Northeast China.
The correlations of marsh AGB with monthly precipitation and monthly average temperature are shown in Table 4. There was a significantly positive correlation between temperature and marsh AGB in different months, and the correlation was larger in months from June to August (r = 0.67, 0.69, 0.68, respectively, p < 0.01). Moreover, marsh AGB had a positive correlation with precipitation in May and July (Table 4).
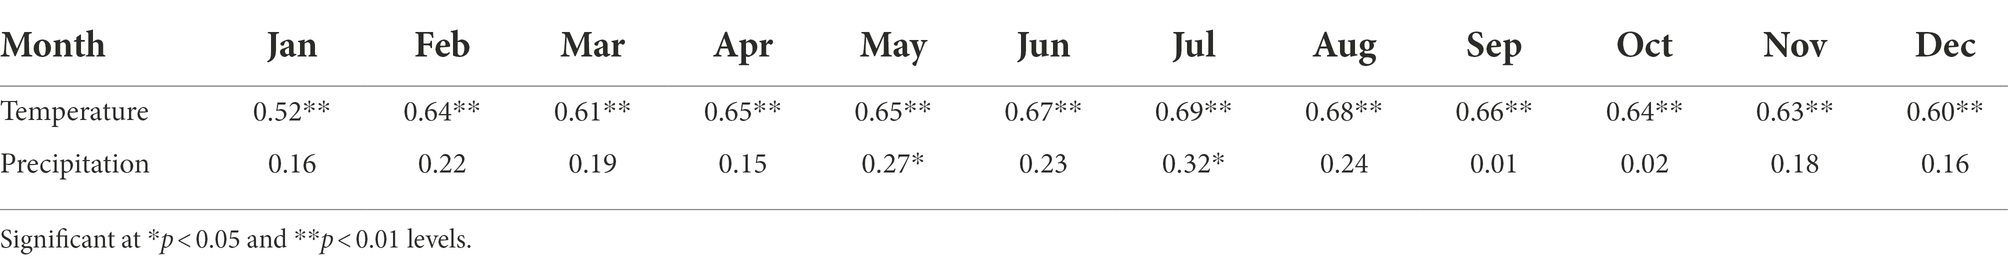
Table 4. Correlation coefficients between marsh AGB and monthly climatic variables.
Spatially, we found that the 44.39% of marsh AGB exhibited a significant positive correlation with temperature in Northeast China (Figure 5). In areas with higher latitudes, such as the Greater Khingan Mountains Region, Lesser Khingan Mountains Region, and Songnen Plain, the correlation was more remarkable. There was no significant correlation between marsh AGB changes and precipitation changes. Compared with precipitation, the correlation between marsh AGB and temperature was more significant.
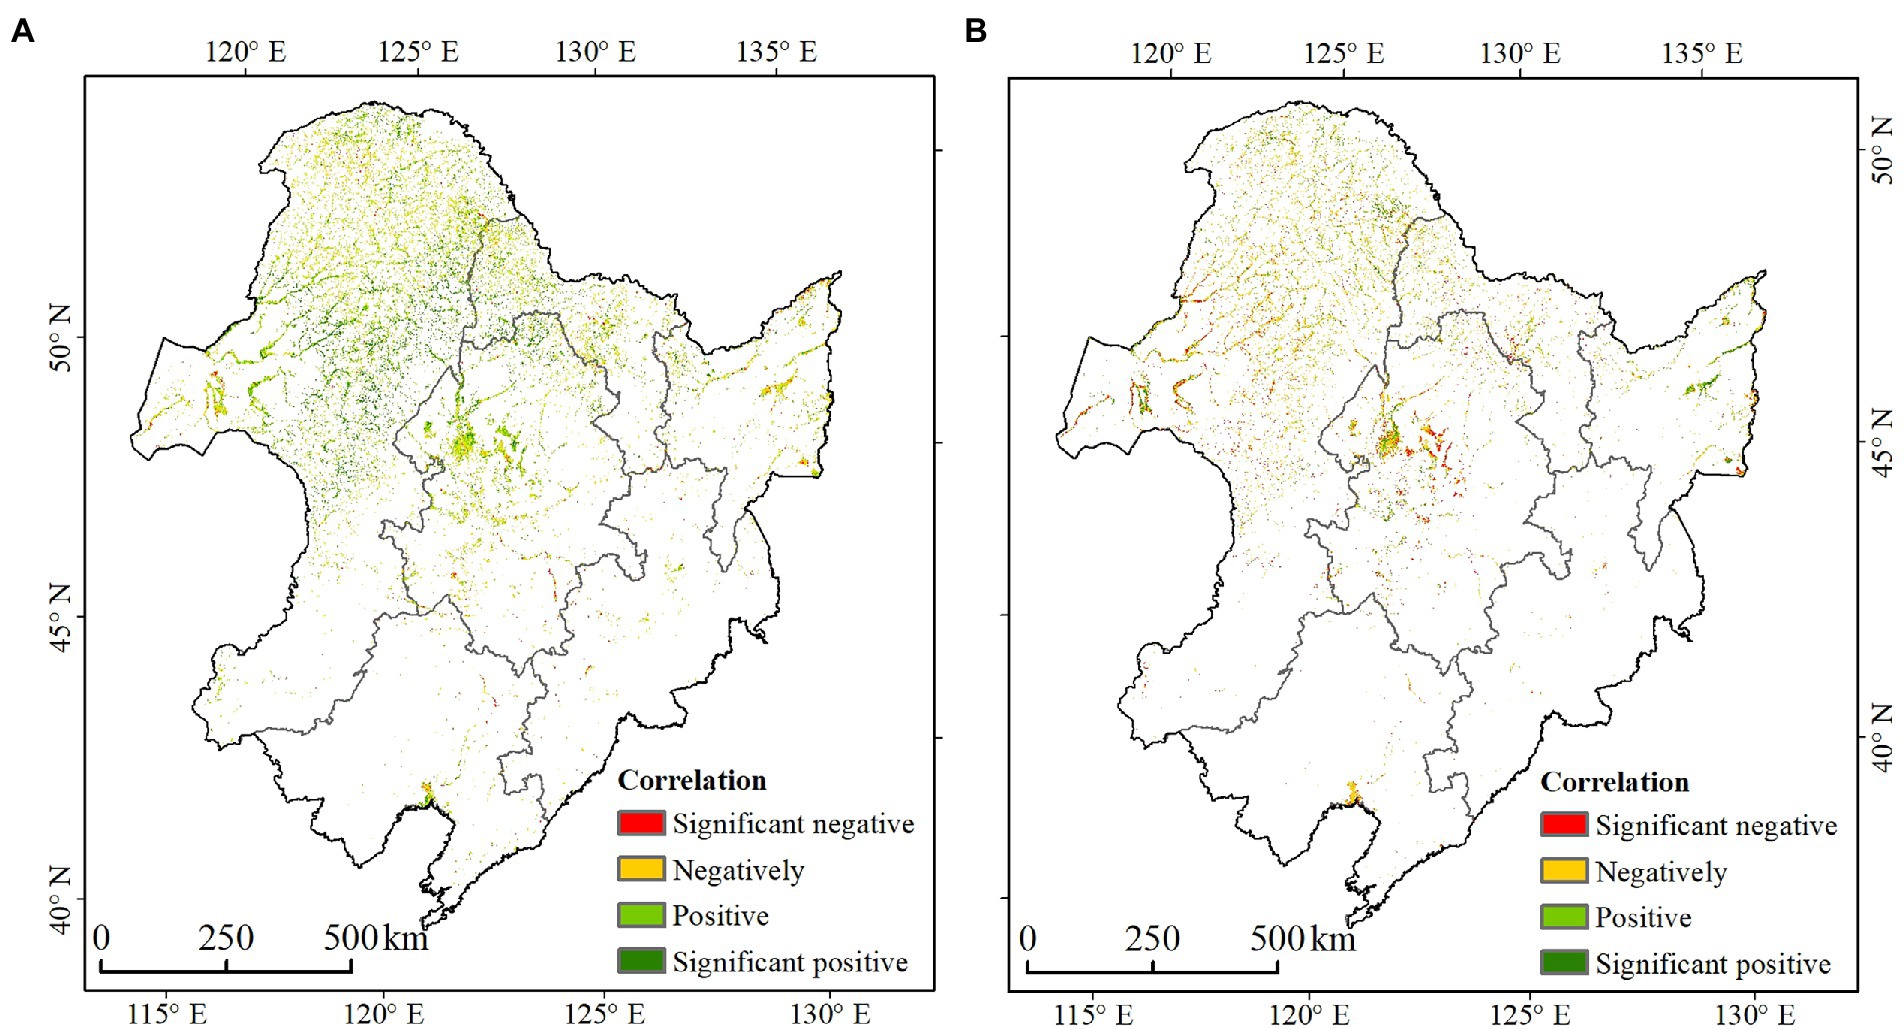
Figure 5. Correlation between marsh AGB and climatic variables in Northeast China from 2000 to 2021. (A) Spatial correlation with annual average temperature (p < 0.05) and (B) correlation with annual average temperature (p < 0.05).
Accurate estimation of marsh AGB is of great significance for assessing carbon cycle of wetland ecosystem. Our results demonstrated that the random forest model combining vegetation indices, LST, and LSWI was feasible in estimating marsh AGB in Northeast China. The differences in the models mainly come from two sources. First, the relationship between AGB and various spectral indices or environmental factors is complex, and a simple linear relationship cannot reflect this relationship well (Temmink et al., 2022). The random forest model can describe the nonlinear relationship between marsh AGB and environmental factors and reduce the error of the model (Breiman, 2001). Another source of error is that the images of different marsh vegetation types are quite different, so the estimation accuracy of the single vegetation index model for the whole area is low (Shen et al., 2021; Zhao et al., 2022). Therefore, combining vegetation index and environmental variables (LST and LSWI), the estimation accuracy of marsh AGB using the random forest model has been significantly improved compared with the multiple linear regression and single-factor power function model (Table 2).
Our results found that the marsh AGB distribution has obvious spatial heterogeneity and generally decreases with increasing latitude in Northeast China (Figure 4), and the temperature was considered the main force controlling the obvious spatial variation of marsh AGB. Temperature is one of the most important factors influencing the growth and development of vegetation. Warmer temperatures could delay the marsh vegetation growth season and increase the marsh AGB (Wang et al., 2021). The marsh AGB in the Liao River Plain was significantly higher than that in the Greater Khingan Mountains Region and the Lesser Khingan Mountains Region, which may be related to the high temperature and relatively favorable environmental conditions for vegetation growth in the Liao River Plain (Suo et al., 2010). We found that marsh AGB was positively correlated with precipitation in summer, and there was a significant positive correlation in May and July. This may be due to the fact that May was the start of the marsh vegetation growing season, and July was the fast-growing season for marsh vegetation. The precipitation mainly has a positive influence on marsh AGB (Liu et al., 2015). There are differences in precipitation in different regions, which further influenced the spatial distribution of marsh AGB.
Several studies have demonstrated that changes in temperature and precipitation have important effects on marsh AGB (Suo et al., 2010; Li et al., 2011; Wang et al., 2021). According to our results, temperature change is the main reason affecting the spatial variation of marsh AGB (Figure 5). Wang et al. (2014) also demonstrated that the marsh productivity had a positive correlation with temperature in most marshes. Most of the marshes in Northeast China are distributed in northern temperate zone and it is generally believed that low temperature limits vegetation growth (Bai et al., 2008; Mowll et al., 2015). The vegetation growth in Northeast China was concentrated from May to August, and the marsh AGB reached the maximum around August. Therefore, summer temperature had primary impact on marsh AGB, especially from June to August (Table 4). In the context of global warming, there are differences in temperature changes in different seasons in Northeast China (Xue et al., 2021). From 2000 to 2021, the winter and spring temperature in Northeast China increased significantly, while about 70% of the area showed a decreasing trend in summer temperature (Figures 6, 7). Therefore, we argue that the decline of annual marsh AGB is primarily correlated to the decreasing summer temperature in Northeast China.
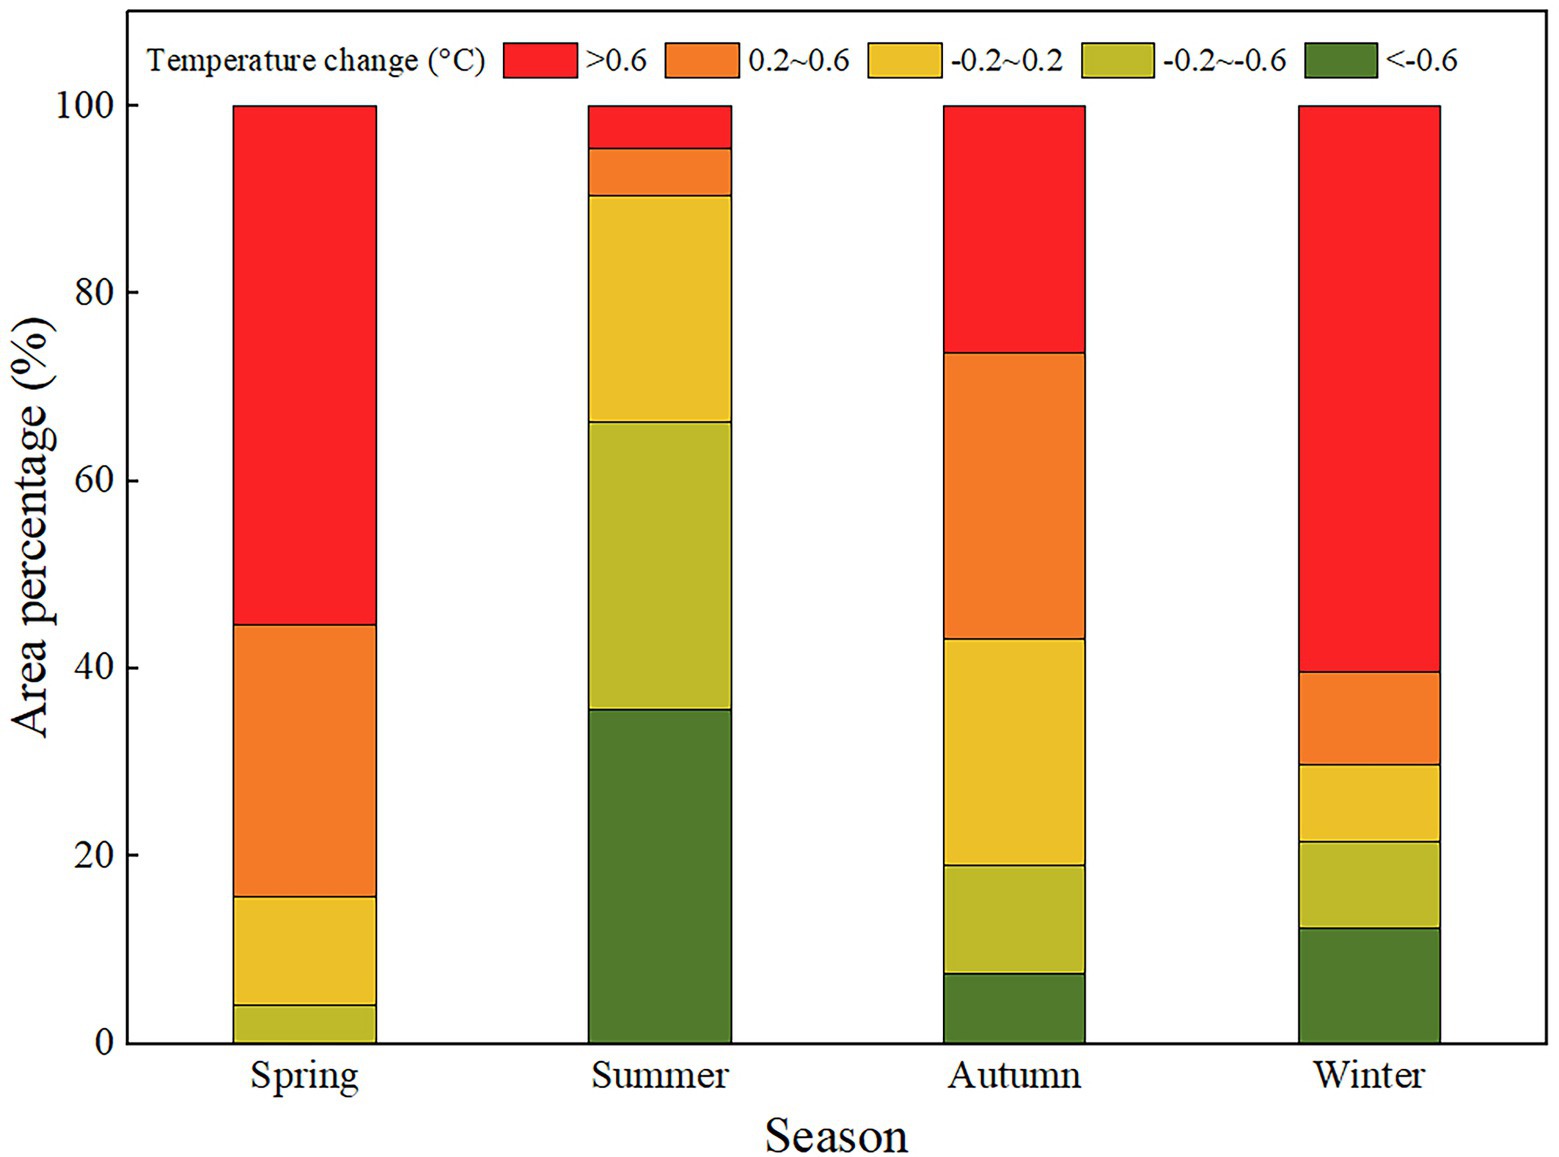
Figure 6. Climate change observations of 22 years of marsh area reveal a significant difference with season and temperature.
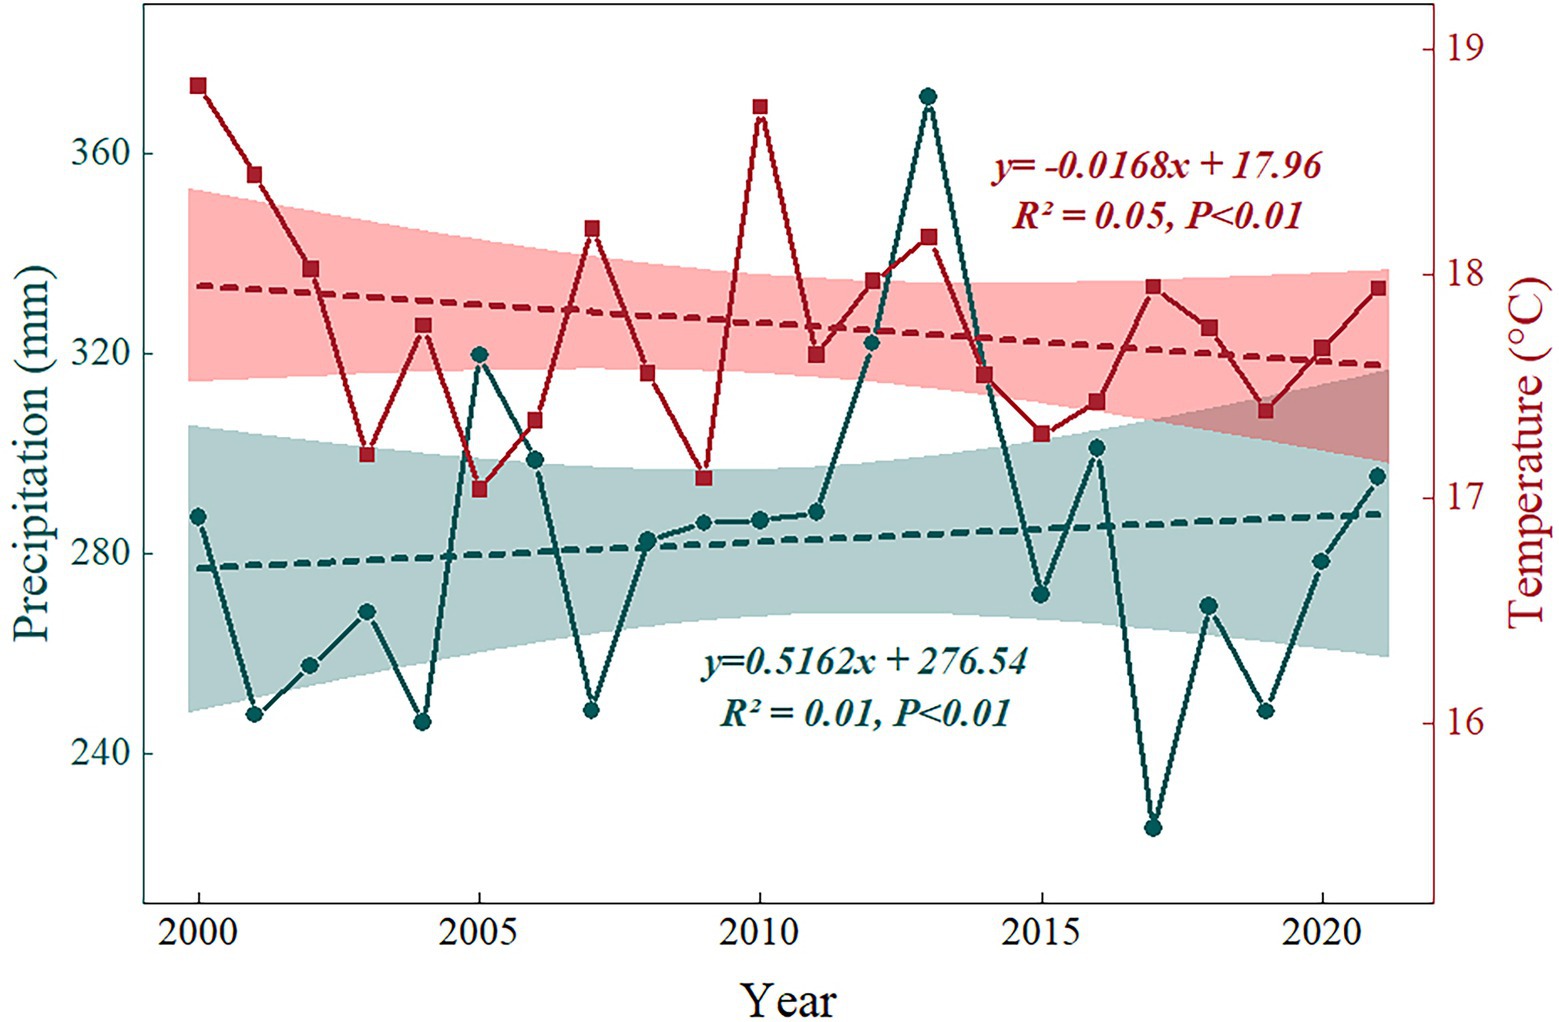
Figure 7. Variations of summer mean temperature and precipitation in Northeast China marshes from 2000 to 2021.
Although this study provided a comprehensive estimation of marsh AGB in Northeast China, some limitations still existed. Firstly, although we randomly obtain three quadrats in each sample plot, there may still be errors in the AGB representing the marsh pixels. Secondly, due to the relatively low spatial resolution, the vegetation index data probably could not accurately reflect the actual status of vegetation within a 250 m × 250 m area, which might lead to some uncertainties. Thirdly, changes in the area of marshes might cause certain errors (Mao et al., 2022). Marshes have been dynamically changing from 2000 to 2021, which might bring some differences in the average and total estimates of marsh AGB (Wang et al., 2011; Mao et al., 2018). In order to estimate the biomass of regional marsh vegetation more accurately, we need to further strengthen the work of high-precision remote sensing mapping and ground verification of marsh vegetation.
In this study, we only focused on the response of the marsh AGB variations to temperature and precipitation. However, some other climate factors should also be considered to affect marsh AGB such as evapotranspiration, wind, and solar radiation (Robert et al., 2012; Morecroft et al., 2019). Moreover, anthropogenic activities were also important factors affecting marsh AGB (Mao et al., 2018), which should be considered in the future to further assess the spatial–temporal variation of marsh AGB in Northeast China. In recent years, the government has strengthened the protection of marshes and continuously increased the area of marsh reserves, while marsh degradation and cropland occupation have also occurred in the area, which reduced the marsh area (Mao et al., 2019), but they were ignored in this study. We suggest that the marshes with special changes should be analyzed separately in the future in order to evaluate the total marsh AGB changes more accurately in Northeast China.
In this study, we examined the spatiotemporal changes of marsh AGB in Northeast China in response to climate change combining MODIS reflectance products and field-measured AGB data. Results showed that the accuracy of marsh AGB estimated by the random forest model based on vegetation indices, LST, and LSWI was higher than that of the single-factor model and the multivariate linear model (R2 = 0.78). We estimated that the annual average marsh AGB was about 5.24 × 10⁷ t in Northeast China from 2000 to 2021. The average value of AGB was 682.89 ± 31.69 g·m−2, and reduced at a rate of 3.45 g·m−2·year−1 from 2000 to 2021. The marsh vegetation AGB has a marked correlation with the summer temperature. We should pay more attention to the impact of temperature changes in different seasons on the marsh AGB of vegetation in Northeast China. This study provides methods and ideas for the accurate estimation of marsh AGB, and lays a foundation for the estimation of marsh vegetation carbon storage.
The original contributions presented in the study are included in the article/supplementary material, further inquiries can be directed to the corresponding author.
YR, DM, XL, ZW, YX, and KF contributed to the study conception and design, material preparation and data collection were performed by YR, XL, ZW, and DM. YX and KF performed the statistical analysis. The first draft of the manuscript was written by YR and all authors commented on previous versions of the manuscript. All authors contributed to the article and approved the submitted version.
This work was supported by the National Natural Science Foundation of China (42222103, 41771383, 42171328, and 41730643), the Science and Technology Development Program of Jilin Province (No. 20210101396JC), the funding from Youth Innovation Promotion Association of CAS (Nos. 2017277), and the Young Scientist Group Project of Northeast Institute of Geography and Agroecology, Chinese Academy of Sciences (2022QNXZ03).
We are very grateful to those who participated in the field soil surveys and thank the National Earth System Science Data Center of China for supporting geographic data (www.geodata.cn).
The authors declare that the research was conducted in the absence of any commercial or financial relationships that could be construed as a potential conflict of interest.
All claims expressed in this article are solely those of the authors and do not necessarily represent those of their affiliated organizations, or those of the publisher, the editors and the reviewers. Any product that may be evaluated in this article, or claim that may be made by its manufacturer, is not guaranteed or endorsed by the publisher.
Akpa, S. I. C., Inakwu, O. A. O., Thomas, F. A. B., Alfred, E. H., and Ishaku, Y. A. (2016). Total soil organic carbon and carbon sequestration potential in Nigeria. Geoderma 271, 202–215. doi: 10.1016/j.geoderma.2016.02.021
Bai, Z. G., Dent, D. L., Olsson, L., and Schaepman, M. E. (2008). Proxy global assessment of land degradation. Soil Use and Management 24, 223–234. doi: 10.1111/j.1475-2743.2008.00169.x
Batjes, N. H. (2014). Total carbon and nitrogen in the soils of the world. Eur. J. Soil Sci. 65, 2–3. doi: 10.1111/ejss.12115
Byrd, K. B., Ballanti, L., Thomas, N., Nguyen, D., Holmquist, J. R., Simard, M., et al. (2018). A remote sensing-based model of tidal marsh aboveground carbon stocks for the conterminous United States. ISPRS J. Photogramm Remote Sens. 139, 255–271. doi: 10.1016/j.isprsjprs.2018.03.019
Chopping, M., Su, L., Rango, A., Martonchik, J. V., Peters, D. P. C., and Laliberte, A. (2008). Remote sensing of woody shrub cover in desert grasslands using MISR with a geometric-optical canopy reflectance model. Remote Sens. Environ. 112, 19–34. doi: 10.1016/j.rse.2006.04.023
Cook, B. D., Bolstad, P. V., Sset, E. N., Anderson, R. S., Garrigues, S., and Morisette, J. T. (2009). Using LiDAR and quickbird data to model plant production and quantify uncertainties associated with wetland detection and land cover generalizations. Remote Sens. Environ. 113, 2366–2379. doi: 10.1016/j.rse.2009.06.017
Dargie, G. C., Lewis, S. L., Lawson, I. T., Mitchard, E., and Ifo, S. A. (2017). Age, extent and carbon storage of the Central Congo Basin peatland complex. Nature 542, 86–90. doi: 10.1038/nature21048
Ewe, S. M. L., Gaiser, E. E., Childers, D. L., Iwaniec, D., Rivera-Monroy, V. H., and Twilley, R. R. (2006). Spatial and temporal patterns of aboveground net primary productivity (ANPP) along two freshwater-estuarine transects in the Florida Coastal Everglades. Hydrobiologia 569, 459–474. doi: 10.1007/s10750-006-0149-5
Gao, T., Bin, X., Yang, X. C., Jin, Y. X., Ma, H. L., Li, J. Y., et al. (2013). Using MODIS time series data to estimate aboveground biomass and its spatio-temporal variation in Inner Mongolia's grassland between 2001 and 2011. Int. J. Remote Sens. 34, 7796–7810. doi: 10.1080/01431161.2013.823000
Grimm, R., Behrens, T., Mrker, M., and Elsenbeer, H. (2008). Soil organic carbon concentrations and stocks on Barro Colorado Island — digital soil mapping using random forests analysis. Geoderma 146, 102–113. doi: 10.1016/j.geoderma.2008.05.008
Gu, Z., Pan, S., Lin, Z., Hu, L., and Zhan, X. (2021). Climate-driven flyway changes and memory-based long-distance migration. Nature 591, 259–264. doi: 10.1038/s41586-021-03265-0
Heidi, S., Chris, L., Painter, T. H., Justin, A., and Edward, A. (2009). Biological consequences of earlier snowmelt from desert dust deposition in alpine landscapes. Proc. Natl. Acad. Sci. U. S. A. 106, 11629–11634. doi: 10.1073/pnas.0900758106
Kalfas, J. L., Xiao, X. M., Vanegas, D. X., Verma, S. B., and Suyker, A. E. (2011). Modeling gross primary production of irrigated and rain-fed maize using MODIS imagery and CO2 flux tower data. Agric. For. Meteorol. 151, 1514–1528. doi: 10.1016/j.agrformet.2011.06.007
Kirby, J. S., Stattersfield, A. J., Butchart, S., Evans, M. I., and Newton, I. (2008). Key conservation issues for migratory land-and waterbird species on the world's major flyways. Bird Conserv. Int. 18, S49–S73. doi: 10.1017/S0959270908000439
Li, H., Wu, Y., Liu, S., and Xiao, J. (2021). Regional contributions to interannual variability of net primary production and climatic attributions. Agric. For. Meteorol. 303:108384. doi: 10.1016/j.agrformet.2021.108384
Li, H. W., Wu, Y. P., Liu, S. G., Xiao, J. F., Zhao, W. Z., and Chen, J. (2022). Decipher soil organic carbon dynamics and driving forces across China using machine learning. Glob. Chang. Biol. 28, 3394–3410. doi: 10.1111/gcb.16154
Li, S., Zhang, Z. L., and Zhou, D. M. (2011). An estimation of aboveground vegetation biomass in a national natural reserve using remote sensing. Geogr. Res. 30, 278–290. doi: 10.11821/yj2011020008
Liu, Z. W., Chen, R. S., Song, Y. X., and Han, C. T. (2015). Aboveground biomass and water storage allocation in alpine willow shrubs in the Qilian Mountains in China. J. Mt. Sci. 12, 207–217. doi: 10.1007/s11629-013-2784-4
Lu, L. R., Luo, J. H., Xin, Y. H., Duan, H. T., Sun, Z., Qiu, Y. G., et al. (2022). How can UAV contribute in satellite-based Phragmites australis aboveground biomass estimating? Int. J. Appl. Earth Obs. Geoinf. 114:103024. doi: 10.1016/j.jag.2022.103024
Mao, D. H., He, X., Wang, Z. M., Tian, Y. L., and Zheng, H. (2019). Diverse policies leading to contrasting impacts on land cover and ecosystem services in Northeast China. J. Clean. Prod. 240:117961. doi: 10.1016/j.jclepro.2019.117961
Mao, D. H., Luo, L., Wang, Z. M., Wilson, M. C., Zeng, Y., Wu, B. F., et al. (2018). Conversions between natural wetlands and farmland in China: a multiscale geospatial analysis. Sci. Total Environ. 634, 550–560. doi: 10.1016/j.scitotenv.2018.04.009
Mao, D. H., Wang, Z. M., Du, B. J., Li, L., Tian, Y. L., and Jia, M. M. (2020). National wetland mapping in China: a new product resulting from object-based and hierarchical classification of Landsat 8 OLI images. ISPRS J. Photogramm. Remote Sens. 164, 11–25. doi: 10.1016/j.isprsjprs.2020.03.020
Mao, D. H., Wang, Z. M., Li, L., Song, K. S., and Jia, M. M. (2014). Quantitative assessment of human-induced impacts on marshes in Northeast China from 2000 to 2011. Ecol. Eng. 68, 97–104. doi: 10.1016/j.ecoleng.2014.03.010
Mao, D. H., Yang, H., Wang, Z. M., Song, K. S., Thompson, J. R., and Flower, R. J. (2022). Reverse the hidden loss of China’s wetlands. Science 376:1061. doi: 10.1126/science.adc8833
Mitra, S., Wassmann, R., and Vlek, P. (2005). An appraisal of global wetland area and its organic carbon stock. Curr. Sci. 102:516. doi: 10.1073/pnas.0408999101
Morecroft, M. D., Duffield, S., Harley, M., Pearce-Higgins, J. W., and Whitaker, J. (2019). Measuring the success of climate change adaptation and mitigation in terrestrial ecosystems. Science 366:eaaw9256. doi: 10.1126/science.aaw9256
Mowll, W., Blumenthal, D. M., Cherwin, K., Smith, A., Symstad, A. J., Vermeire, L. T., et al. (2015). Climatic controls of aboveground net primary production in semi-arid grasslands along a latitudinal gradient portend low sensitivity to warming. Oecologia 177, 959–969. doi: 10.1007/s00442-015-3232-7
Neba, S. G., Kanninen, M., Atyi, R. E. A., and Sonwa, D. J. (2014). Assessment and prediction of above-ground biomass in selectively logged forest concessions using field measurements and remote sensing data: case study in south East Cameroon. Forest Ecol. Manag. 329, 177–185. doi: 10.1016/j.foreco.2014.06.018
O'Shea, R. E., Pahlevan, N., Smith, B., Bresciani, M., and Vaiiūt, D. (2021). Advancing cyanobacteria biomass estimation from hyperspectral observations: demonstrations with HICO and PRISMA imagery. Remote Sens. Environ. 266:112693. doi: 10.1016/j.rse.2021.112693
Ren, Y. X., Li, X. Y., Mao, D. H., Wang, Z. M., Jia, M. M., and Chen, L. (2020). Investigating spatial and vertical patterns of wetland soil organic carbon concentrations in China's Western Songnen plain by comparing different algorithms. Sustainability 12:932. doi: 10.3390/su12030932
Robert, M., Galeotti, S. G., Mark, P., David, T., Kevin, S., and Zhang, T. J. (2012). Erratum: corrigendum: past extreme warming events linked to massive carbon release from thawing permafrost. Nature 490:292. doi: 10.1038/nature11424
Rocha, A. V., and Goulden, M. L. (2009). Why is marsh productivity so high? New insights from eddy covariance and biomass measurements in a Typha marsh. Agric. For. Meteorol. 149, 159–168. doi: 10.1016/j.agrformet.2008.07.010
Shen, X. J., Jiang, M., Lu, X. G., Liu, X. T., Liu, B., and Zhang, J. Q. (2021). Aboveground biomass and its spatial distribution pattern of herbaceous marsh vegetation in China. Sci. China Earth Sci. 64, 1115–1125. doi: 10.1007/s11430-020-9778-7
Shen, X. J., Liu, B., Jiang, M., and Lu, X. G. (2020). Marshland loss warms local land surface temperature in China. Geophys. Res. Lett. 47:e2020GL087648. doi: 10.1029/2020GL087648
Sims, D. A., Rahman, A. F., Cordova, V. D., El-Masri, B. Z., Baldocchi, D. D., and Bolstad, P. V. (2008). A new model of gross primary productivity for north American ecosystems based solely on the enhanced vegetation index and land surface temperature from MODIS. Remote Sens. Environ. 112, 1633–1646. doi: 10.1016/j.rse.2007.08.004
Suo, A. N., Zhao, D. Z., and Zhang, F. S. (2010). Carbon storage and fixation by wetland vegetation at the estuariesin northern China: a case of Panjin area, Liaohe Delta. J. Mar. Sci. 28, 67–71. doi: 10.3969/j.issn.1001-909X.2010.03.009
Temmink, R. J. M., Lamers, L. P. M., Angelini, C., Bouma, T. J., Fritz, C., and Koppel, J. (2022). Recovering wetland biogeomorphic feedbacks to restore the world’s biotic carbon hotspots. Science 376:eabn1479. doi: 10.1126/science.abn1479
Wahren, C. H. A., Walker, M. D., and Bret-Harte, M. S. (2005). Vegetation responses in Alaskan arctic tundra after 8 years of a summer warming and winter snow manipulation experiment. Glob. Chang. Biol. 11, 537–552. doi: 10.1111/j.1365-2486.2005.00927.x
Wan, R., Wang, P., Wang, X., Yao, X., and Dai, X. (2019). Mapping aboveground biomass of four typical vegetation types in the Poyang Lake wetlands based on random Forest modelling and Landsat images. Front. Plant Sci. 10, 1281–1294. doi: 10.3389/fpls.2019.01281
Wang, Z. M., Huang, N., Luo, L., Li, X., Ren, C. Y., Song, K. S., et al. (2011). Shrinkage and fragmentation of marshes in the west Songnen plain, China, from 1954 to 2008 and its possible causes. Int. J. Appl. Earth Obs. Geoinf. 13, 477–486. doi: 10.1016/j.jag.2010.10.003
Wang, G. X., Ran, F., Chang, R. Y., Yang, Y., Luo, J., Fan, J. R., et al. (2014). Variations in the live biomass and carbon pools of Abies georgei along an elevation gradient on the Tibetan Plateau, China. For. Ecol. Manag. 329, 255–263. doi: 10.1016/j.foreco.2014.06.023
Wang, Y. J., Shen, X. J., Jiang, M., Tong, S., and Lu, X. G. (2021). Spatiotemporal change of aboveground biomass and its response to climate change in marshes of the Tibetan plateau. Int. J. Appl. Earth Obs. Geoinf. 102:102385. doi: 10.1016/j.jag.2021.102385
Wiesmeier, M., Barthold, F., Blank, B., and Kögel-Knabner, I. (2011). Digital mapping of soil organic matter stocks using random Forest modeling in a semi-arid steppe ecosystem. Plant & Soil 340, 7–24. doi: 10.1007/s11104-010-0425-z
Xiao, X., Hollinger, D., Aber, J., Goltz, M., Davidson, E. A., Zhang, Q., et al. (2004). Satellite-based modeling of gross primary production in an evergreen needleleaf forest. Remote Sens. Environ. 89, 519–534. doi: 10.1016/j.rse.2003.11.008
Xue, Z. S., Jiang, M., Zhang, Z. S., Wu, H. T., and Zhang, T. T. (2021). Simulating potential impacts of climate changes on distribution pattern and carbon storage function of high㎜atitude wetland plant communities in the Xing'anling mountains, China. Land Degr. Dev. 32, 2704–2714. doi: 10.1002/ldr.3945
Yang, R., Li, X. Y., Mao, D. H., Wang, Z. M., and Dong, Y. L. (2020). Examining fractional vegetation cover dynamics in response to climate from 1982 to 2015 in the Amur River basin for SDG 13. Sustainability 12:5866. doi: 10.3390/su12145866
Yao, Y., Wang, X., Li, Y., Wang, T., Shen, M., and Du, M. (2018). Spatiotemporal pattern of gross primary productivity and its covariation with climate in China over the last thirty years. Glob. Chang. Biol. 24, 184–196. doi: 10.1111/gcb.13830
Zhang, M., Lin, H., Long, X. R., and Cai, Y. T. (2021). Analyzing the spatiotemporal pattern and driving factors of wetland vegetation changes using 2000–2019 time-series Landsat data. Sci. Total Environ. 780:146615. doi: 10.1016/j.scitotenv.2021.146615
Zhao, Y. X., Mao, D. H., Zhang, D. Y., Wang, Z. M., Du, B. J., and Yan, H. Q. (2022). Mapping Phragmites australis aboveground biomass in the Momoge wetland Ramsar site based on Sentinel-1/2 images. Remote Sens. 14:694. doi: 10.3390/rs14030694
Keywords: marsh, aboveground biomass, climate change, random forest, Northeast China
Citation: Ren Y, Mao D, Li X, Wang Z, Xi Y and Feng K (2022) Aboveground biomass of marshes in Northeast China: Spatial pattern and annual changes responding to climate change. Front. Ecol. Evol. 10:1043811. doi: 10.3389/fevo.2022.1043811
Edited by:
Yinghai Ke, Capital Normal University, ChinaReviewed by:
Gang Yang, Ningbo University, ChinaCopyright © 2022 Ren, Mao, Li, Wang, Xi and Feng. This is an open-access article distributed under the terms of the Creative Commons Attribution License (CC BY). The use, distribution or reproduction in other forums is permitted, provided the original author(s) and the copyright owner(s) are credited and that the original publication in this journal is cited, in accordance with accepted academic practice. No use, distribution or reproduction is permitted which does not comply with these terms.
*Correspondence: Xiaoyan Li, bHh5YW5Aamx1LmVkdS5jbg==
Disclaimer: All claims expressed in this article are solely those of the authors and do not necessarily represent those of their affiliated organizations, or those of the publisher, the editors and the reviewers. Any product that may be evaluated in this article or claim that may be made by its manufacturer is not guaranteed or endorsed by the publisher.
Research integrity at Frontiers
Learn more about the work of our research integrity team to safeguard the quality of each article we publish.