 Jianwei Zhou
 Chengpeng Ji
 Kechi Dong1
94% of researchers rate our articles as excellent or good
Learn more about the work of our research integrity team to safeguard the quality of each article we publish.
Find out more
ORIGINAL RESEARCH article
Front. Ecol. Evol., 02 December 2022
Sec. Ecophysiology
Volume 10 - 2022 | https://doi.org/10.3389/fevo.2022.1041322
This article is part of the Research TopicBehavioral and Physiological Adaptations of Mammals and Birds to Anthropogenic DisturbancesView all 11 articles
As ecosystem engineers, subterranean rodents excavate and inhabit burrow systems. However, the changes in their use of underground space are poorly recorded. There is conflicting evidence about whether the burrow systems of subterranean rodents, once established, are relatively stable as a result of the high energy costs of digging. We monitored the size of the home ranges of the plateau zokor (Myospalax baileyi) during different stages of its life cycle to show whether mating behavior and the characteristics of its habitat influence the size and location of its home range. We used radio-tracking to quantify the changes in, and overlap of, the home range of M. baileyi during a one-year period. The average size of the home ranges of male zokors was 6.5 times larger than that of female zokors during the mating season. The males expanded their burrows to overlap with multiple females to increase their chances of mating. However, there was no overlap between estrus females or males, perhaps to reduce the number of encounters and unnecessary fights. The home ranges of male and female zokors were similar in size after courtship and the home ranges of single zokors overlapped with those of several neighbors. Most individuals remained territorial and excluded intraspecific interactions from their home ranges. The location of female zokors was stable throughout the year, but half of the males changed the location of their nests and established completely new home ranges in the non-breeding season, mainly in October. The use of space by M. baileyi is flexible in response to a need for physical contact during the mating season and food resources. The home ranges of subterranean plateau zokors are dynamic and the home ranges of male zokors can change within one breeding cycle.
Basic theoretical studies of the use of space by animals are based on the concept of a home range, which was initially defined as the area in which an animal can meet its daily needs (Burt, 1943). The home range has more recently been defined as the area that an animal repeatedly traverses (Kenward et al., 2001; Powell and Mitchell, 2012). Most resident mammals limit their movements to a fairly well-defined area rather than just wandering randomly. The original definition of range has been explored in a variety of ways, including empirical and theoretical methods. The fact that the home range of most animals is dynamic in both size and location in spatiotemporal sequences There are thousands of articles quantifying seasonal dynamics of home ranges going back decades (Wada and Ichiki, 1980; Schoen and Kirchhoff, 1985; Lesage et al., 2000; Powell and Boitani, 2012). Ecologists have been linking animal movement with population dynamics for decades (e.g., Cooper, 1978; Boutin, 1979; Turchin, 1998). The seasonal changes in the home range of subterranean rodents were mainly concentrated in a few species, but the research objects based on different populations, and the radio-tracking based on the changes of home range in same population was rare (Šklíba et al., 2009). Most studies have focused on the factors that influence the size of the home range at a given point in time (Fisher and Owens, 2012).
Subterranean rodents successfully adapted to the underground environmental condition (Lessa, 2000; Shao et al., 2015). Compared with ground-dwelling species, their scope of activity and dispersal are greatly restricted by their underground environment. Most of their activities take place in underground burrow systems occupied by solitary and society individuals. Subterranean rodents mainly rely on the underground storage organs of plants for food and they must continuously extend their burrow systems to ensure adequate food resources. Begall et al. (2007) suggested that the burrow systems of subterranean rodents are continuously transformed by excavating new tunnels while abandoning part of the older tunnel network. Some subterranean rodents maintain an optimum size of their burrow systems through backfilling the tunnels with soil (Fisher and Owens, 2012). If the size of the home range of an animal is too large, it will be detrimental to the domain’s occupant because the cost of defending their territory increases dramatically as the home range expands (Hinsch and Komdeur, 2017). The food resource and soil characteristics directly influence the size of the home range and the dynamics of the burrow systems of subterranean rodents in different types of habitat (Fisher and Owens, 2012; Lovari et al., 2013; Lövy et al., 2015; Kubiak et al., 2017). Larger animals don’t ‘require’ more mates. They may have access to more mates through a competitive advantage, but it is not a requirement. Furthermore, home range size has been linked to a wide range of other biological factors beyond body size including habitat productivity, population density, etc. The range of activities of subterranean rodents is restricted by the underground physical environment. Analysis of home-range size could be useful also for revealing mating strategies. Lager male home ranges are expected to be used to encounter potential mates or recruiting. Cutrera et al. (2010) observed the intraspecific variation in home range size between two different sites in the South American Talas tuco-tuco (Ctenomys talarum). The size of the home range was influenced by both body size and the differences in soil characteristics (especially soil hardness) between the two study sites (Cutrera et al., 2006).
Live trapping and radio-tracking are valid tools with which to systematically collect data on the characteristics of movement and the use of space by small mammals inhabiting the underground environment. Studies of the size of home ranges have been carried out by radio-tracking a few species of Bathyergus, Ctenomys and Spalax (Rado and Terkel, 1989; Narins et al., 1992; Šumbera et al., 2008; Šklíba et al., 2016; Kubiak et al., 2017). Surprisingly, there have been few studies on the long-term use of space by subterranean rodents. Although there have been studies of the seasonal changes in the dynamics of the home range (Zhou and Dou, 1990; Rado et al., 1993), most previous studies have been conducted in different populations of the same species in different seasons. Nevo (1999) reported that the home ranges of underground mammals, once established and used for one breeding season, become essentially permanent for life. However, constantly shifting home ranges have been described (but not quantified) in solitary subterranean rodents, such as the blind mole rat (Spalax ehrenbergi) (Zuri and Terkel, 1996). Šklíba et al. (2009) tracked silvery mole rats (Heliophobius argenteocinereus) for three months in the non-breeding season and found that their home ranges were dynamic and continuously changing in space. We therefore assume that home ranges are dynamic patterns of the use of space by animals and result from life-history strategies or interactions between individuals and the external environment.
We analyzed the use of space and the stability of the home range in the plateau zokor Myospalax baileyi (Rodentia: Myospalacinae), a widely distributed solitary subterranean rodent from the Qinghai–Tibetan Plateau (Zhang, 2007). Adult females of plateau zokors give birth once a year between April and July. The periods of gestation and lactation each last about 50 days (Zheng, 1980). M. baileyi occurs in various habitats with different food supplies and soil properties in an environment with alternating cold and warm seasons and it exemplifies a successful adaptation to an extreme subterranean environment (Shao et al., 2015).
We investigated individual home ranges using a radio-telemetry system. We tracked individuals of M. baileyi from June 2016 to May 2017 to cover the physiological changes in the plateau zokor during the year and changes in the food supply and soil characteristics. M. baileyi occupies different habitats with varying characteristics of soil and food supply in a seasonal environment with regular changes between dry and rainy seasons. Our main objectives were (1) to quantify the home range dynamics in different months: the home range overlap between neighbors, the number of new mounds, changes in the location and size of the home range of single individuals and Whether the nest has moved; and (2) to assess how these animals explore their underground environment over a full year.
The study was conducted in Gansu Province in the eastern part of the Qinghai–Tibetan Plateau (Figure 1) at the Tianzhu alpine grassland system station of Gansu agricultural university (37° 18′ 34′′ N, 102° 36′ 22′′ E, elevation 2,892 m). The alpine meadow vegetation at this site consists of a mosaic of grasses (mainly Elymus nutans), sedges (mainly Kobresia humilis) and forbs. The climate in Tianzhu is characterized by a warm season (May–September) and a cold season (October–December/January–April) with precipitation mainly concentrated in June–September. The rainfall from June to September 2016 was 372.2 mm, accounting for 73.4% of the total rainfall in the research year (Figure 1). The average temperature and the soil temperature 15 cm underground were both < 0°C from November 2016 to March 2017 (Figure 1). The meteorological data were obtained from the China Meteorological Administration1.
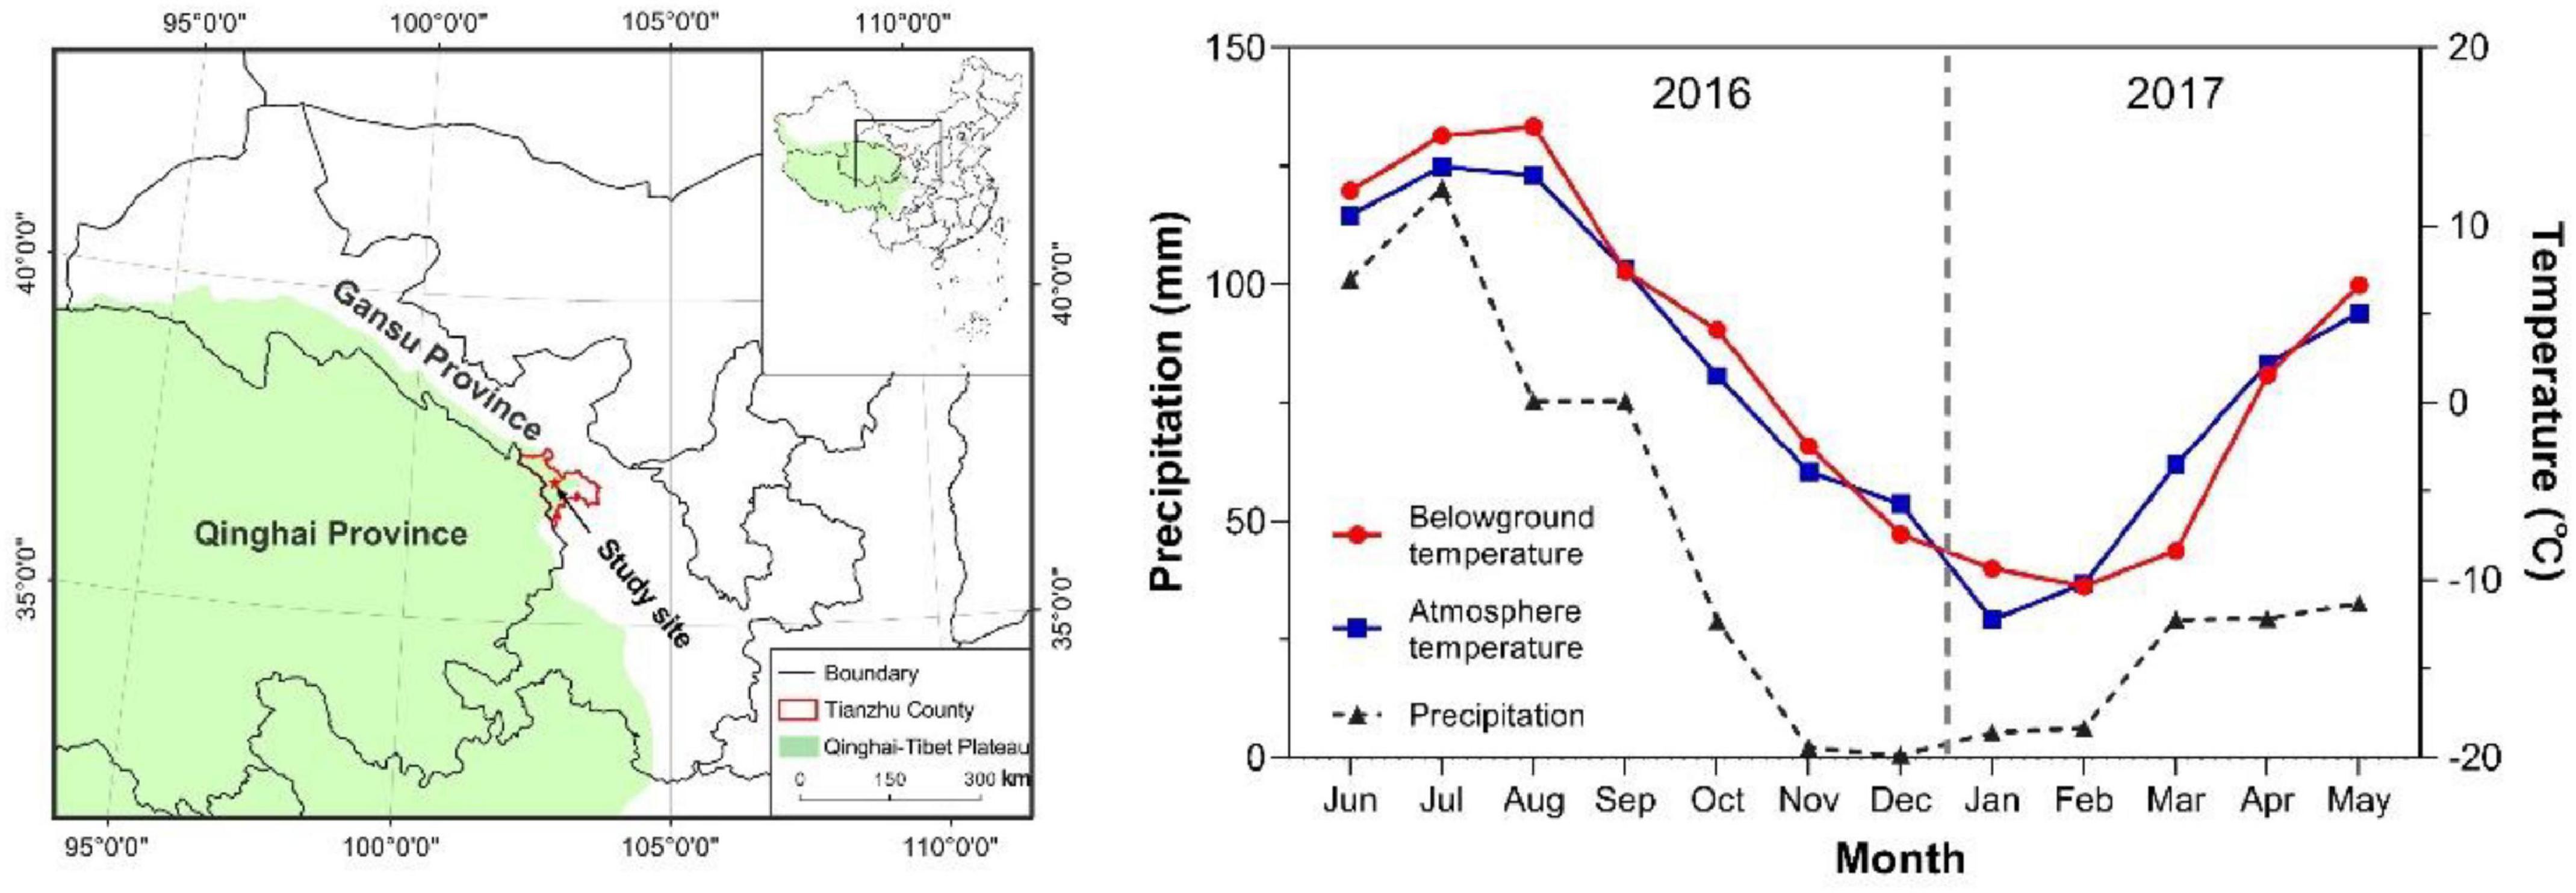
Figure 1. (Left-hand panel) Location of the study site. (Right-hand panel) Changes in temperature (air and 15 cm underground) and precipitation from June 2016 to May 2017.
Radio-tracking was carried out from June 2016 to May 2017. We captured 14 M. baileyi adults (seven females and seven males) in 2016 and 12 adults (five females and seven males) in 2017 (Table 1). We also captured a sub-adult (ID M981) in 2017, which was not included in the statistical analysis. The animals were captured using a live trap for subterranean rodents (Hua et al., 2015). To ensure the integrity of the tunnel, we did not recapture individual animals, so we did not obtain weight data for the other months of 2016. After capture the animals were anesthetized (1% pentobarbital, 0.5 mg/100 g body mass), weighed, sexed and fitted with a radio-collar (Ag 357, Biotrack Ltd., Wareham, Dorset, UK; battery life about nine months). The animals were released at the trap site when they were fully recovered from the effects of the anesthetic. The radio-collars weighed 4.75 g (<4% of the body weight of the smallest zokor in this study) (Zhou et al., 2013). The experimental procedures involving capture, handling and the use of radio-collars were approved by the Institutional Animal Care and Use Committee of the Grassland Science College of Gansu Agricultural University (GSC- IACUC-2018-0011).
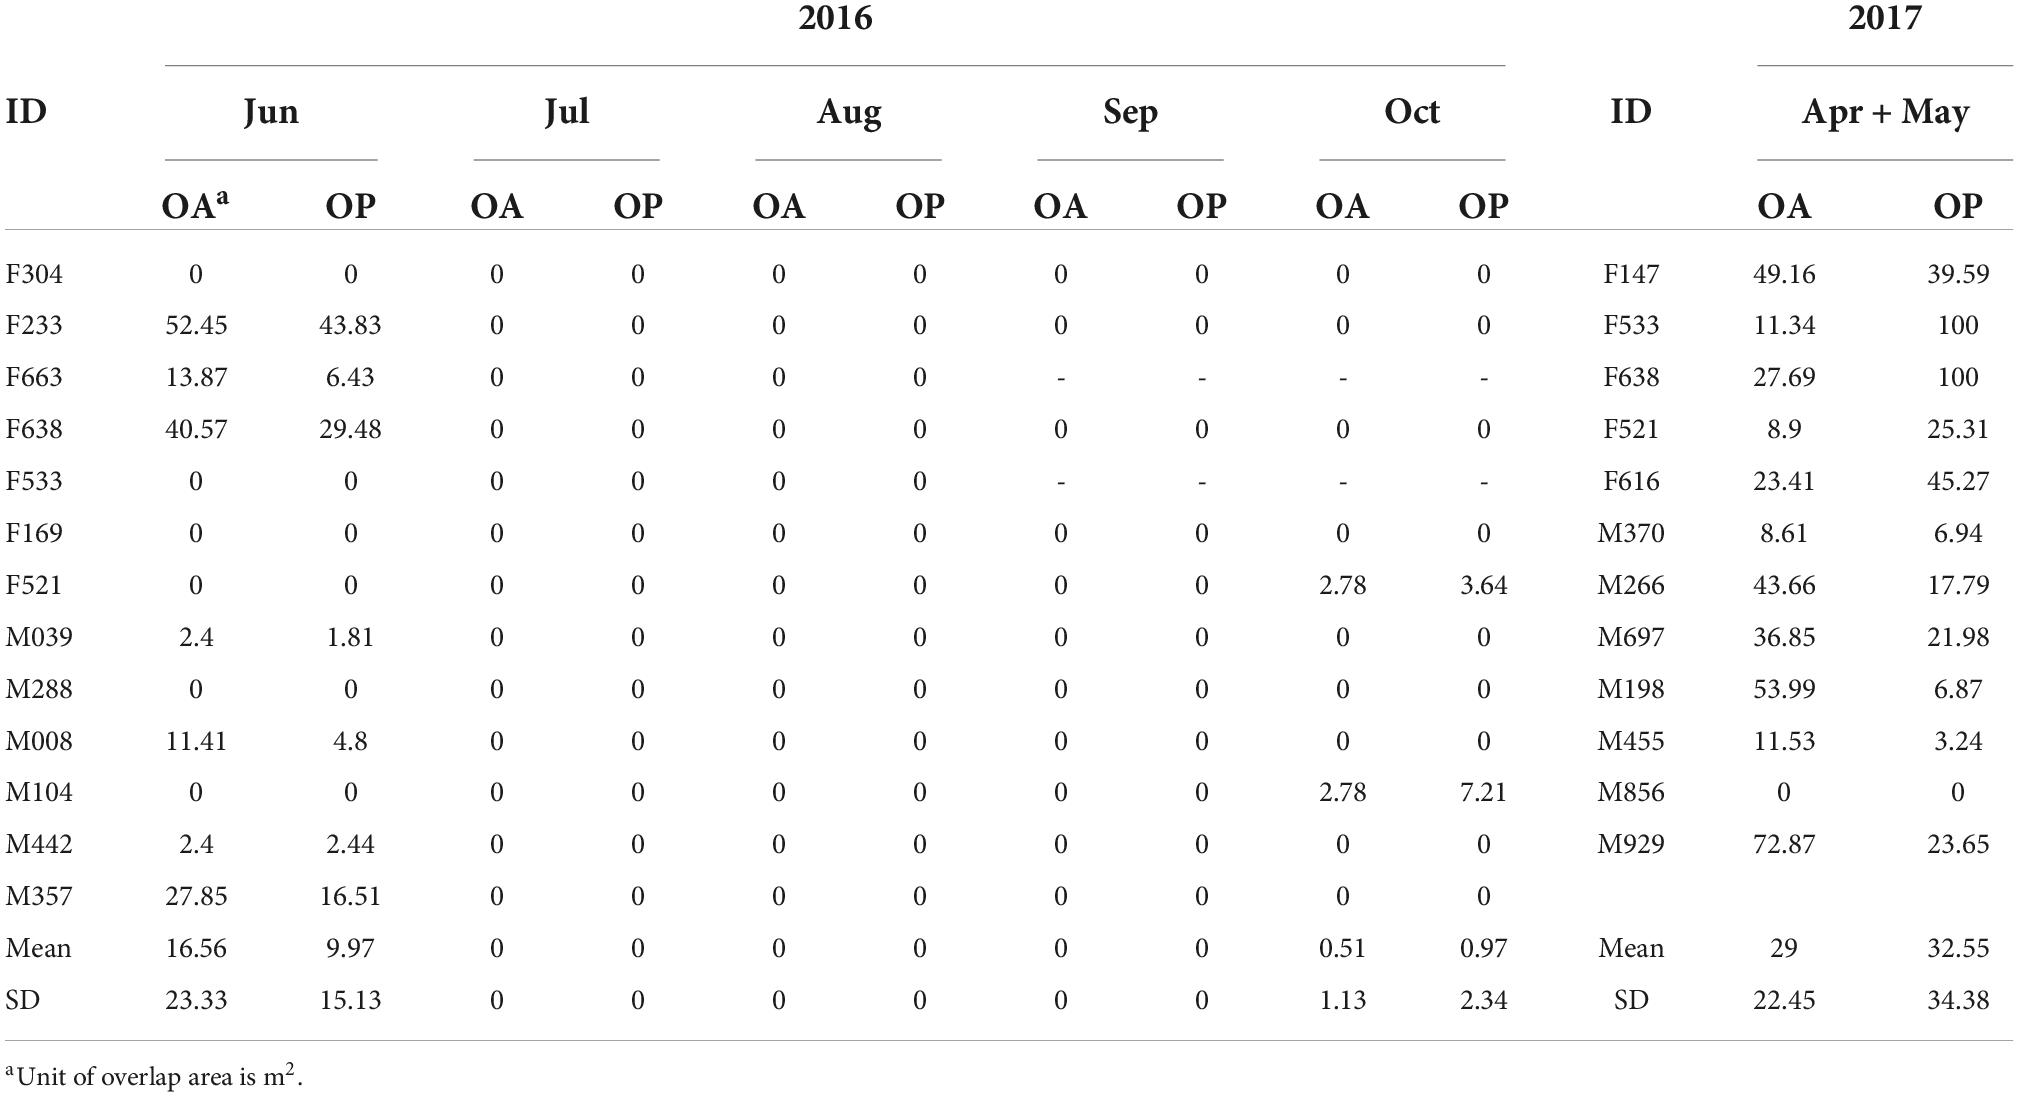
Table 1. Overlap area (OA) of a single individual’s home range with other individuals and the percentage of overlap (OP) in its home range in different months.
We used a Sika radio-tracking receiver (Biotrack Ltd.) and two-element Yagi antennas (Sirtrack Ltd., Havelock North, New Zealand) to locate the zokors. In 2016, radio fixes were taken during 24-h periods for 10 days each month (15th to 25th of each month). To ensure independence of the data collection, there was a 2-h time interval between fixes (Kubiak et al., 2017). In 2017, radio-tracking began 36–48 h after the release of the animal. All the individual animals were tracked until May 25. Radio fixes were taken over 12-h periods (08:00–20:00) with 2-h intervals between fixes. In total, we successfully radio-tracked 13 zokors (seven females and six males) from June to August, 11 zokors (five females and six males) in September and October 2016 and 12 (five females and seven males) in April and May 2017.
The radio-collars of two zokors (ID: F533, F663) fell off in September 2016 and we were not able to recapture the animals, so we did not obtain any further data from them. Another radio-collared male (ID M425) was not radio-tracked because it left its burrow system two days after release and moved above ground to outside the study area, where it created new caves in June 2016. We radio-tracked more than ten zokors continuously for more than ten months without damaging their burrow systems. The radio-collars did not affect their normal activities, including mating, excavating and building new surface mounds. The radio-collars could precisely locate the zokors, as shown by the fact that we were able to use the receiver to accurately find the two radio-collars that dropped off zokors F521 and F663. The data from individual animals with missing or incomplete transmission were not used in our analyses (see Supplementary Data 1). The battery power of the radio-collars of most individual animals was exhausted by March 2017, so we recaptured the individuals wearing the radio-collars and replaced them with a new one in April. The recaptured zokors and recycled radio-collars were used for studies in other areas (or other studies in this area).
The size of individual home ranges size was calculated using 95% kernel-density estimation (KDE) methods (Fleming et al., 2015). We also calculated 50% KDE. This method is commonly used to evaluate the size of the home range of subterranean rodents. To accurately record the current position of the zokors, we set up a georeferenced grid (5 m × 5 m cell size) above all the burrow systems before radio-tracking. By measuring the vertical distance between the fixes and the nearest tunnel, we estimated the accuracy of radio-tracking points to be <1 m. We found that the home ranges of some individuals overlapped and we calculated the degree of overlap by dividing the area of overlap of one individual with other intraspecific individuals by the total area of the zokor population. We calculated the KDE using all the tracking points from each individual for comparison with other studies. KDE and overlap calculations were performed using Ranges 8 version 2.1.6 software (Anatrack Ltd., Wareham, UK).
To evaluate the characteristics of soil and vegetation, we considered each individual nest as a central point. The plant biomass and soil compaction were sampled at each of the central points in the three sampling units located at a distance of 3 m in the three cardinal directions. We used the method of Galiano et al. (2014) to estimate the plant biomass and soil hardness. In brief, the vegetation present in a 0.25 m2 × 0.3 m sample was collected and separated into above-ground and subterranean portions, dried for 24 h at 80°C and then weighed to the nearest 0.1 g. Soil samples were taken from near the capture points. Soil compaction was measured at 12.5, 15, and 17.5 cm soil depth using an SC-900 soil compaction meter (Spectrum, USA). We calculated the mean of three depths as the compaction (units: kg⋅cm–2) of one sampling point because the tunnel depth at the capture point of the zokors was between 10 and 20 cm (Li et al., 2004). We calculated the mean of the three sampling units and then the mean in the analysis of the soil compaction and vegetation variables.
We applied Student’s t-tests or Mann–Whitney U-tests (where the assumptions of the t-test were not fulfilled) to compare the differences in the size of the home range and the overlap between sexes in the same months. We used the same analysis methods to compare the differences between male and female body mass over two years. The comparisons of the overlap area of the same individual’s home range between June and October and the percentage of the overlap ratio in the two months were examined using Student’s t-test or a Mann–Whitney U-test. A comparison of all variables (home range size, home range overlap and body mass between the sex) was implemented in GraphPad Prism version 8.0.1 (GraphPad Software, San Diego, CA, USA).
We use Kruskal-Wallis one-way ANOVA to compare home range sizes, number of new mounds, soil compaction and plant biomass (aboveground and underground) in different months. The ANOVA analyses were performed with STATISTICA StatSoft (version 17.0) for Windows. The influence of each row representing the matched data (soil compaction and aboveground or underground biomass) on the mean home range of females, males and individuals were tested using a linear regression analysis, as implemented in GraphPad Prism. The map of study area and home range was drawn with ArcGIS 9.2 (ESRI, Inc., CA, US). In all cases the critical significance level was set at P < 0.05. All results are given as mean ± SD values.
The sizes of the home ranges of females and males changed dynamically throughout the breeding season. Based on 95% KDE methods, the size of the home ranges of males (n = 7, average 327.10 ± 218.10 m2) was significantly larger than the home ranges of females (n = 5, average 50.01 ± 43.92 m2) during the courtship and mating stages (April and May, 2017) (Mann–Whitney U-test = 1, P = 0.005; Figure 2). During the period of pregnancy and lactation (June and July, 2016), the home ranges of males (n = 7) averaged 139.10 ± 56.01 m2 versus 87.66 ± 74.09 m2 for the home ranges of females (n = 6) in June and 34.05 ± 38.62 m2 versus 51.10 ± 53.74 m2 in July; these differences in size were not significant (unpaired t-test: June, t = 1.390, d.f. = 11, P = 0.192; July, t = 0.646, d.f. = 11, P = 0.532; Figure 2). During the mating period, female-male overlapping area accounted for 7.46 ± 5.20% of the male nest area (n = 5, male and female pairs), while the overlapping area accounted for 61.92 ± 35.59% of the female nest area (n = 5, male–female pairs; Figure 3F). No overlap was found between the home ranges of females. In addition, we found that the nests of females were within the overlap of the home ranges of both males and females and we detected the radio-collar signals of the males that overlapped with the female’s nest at the same time.
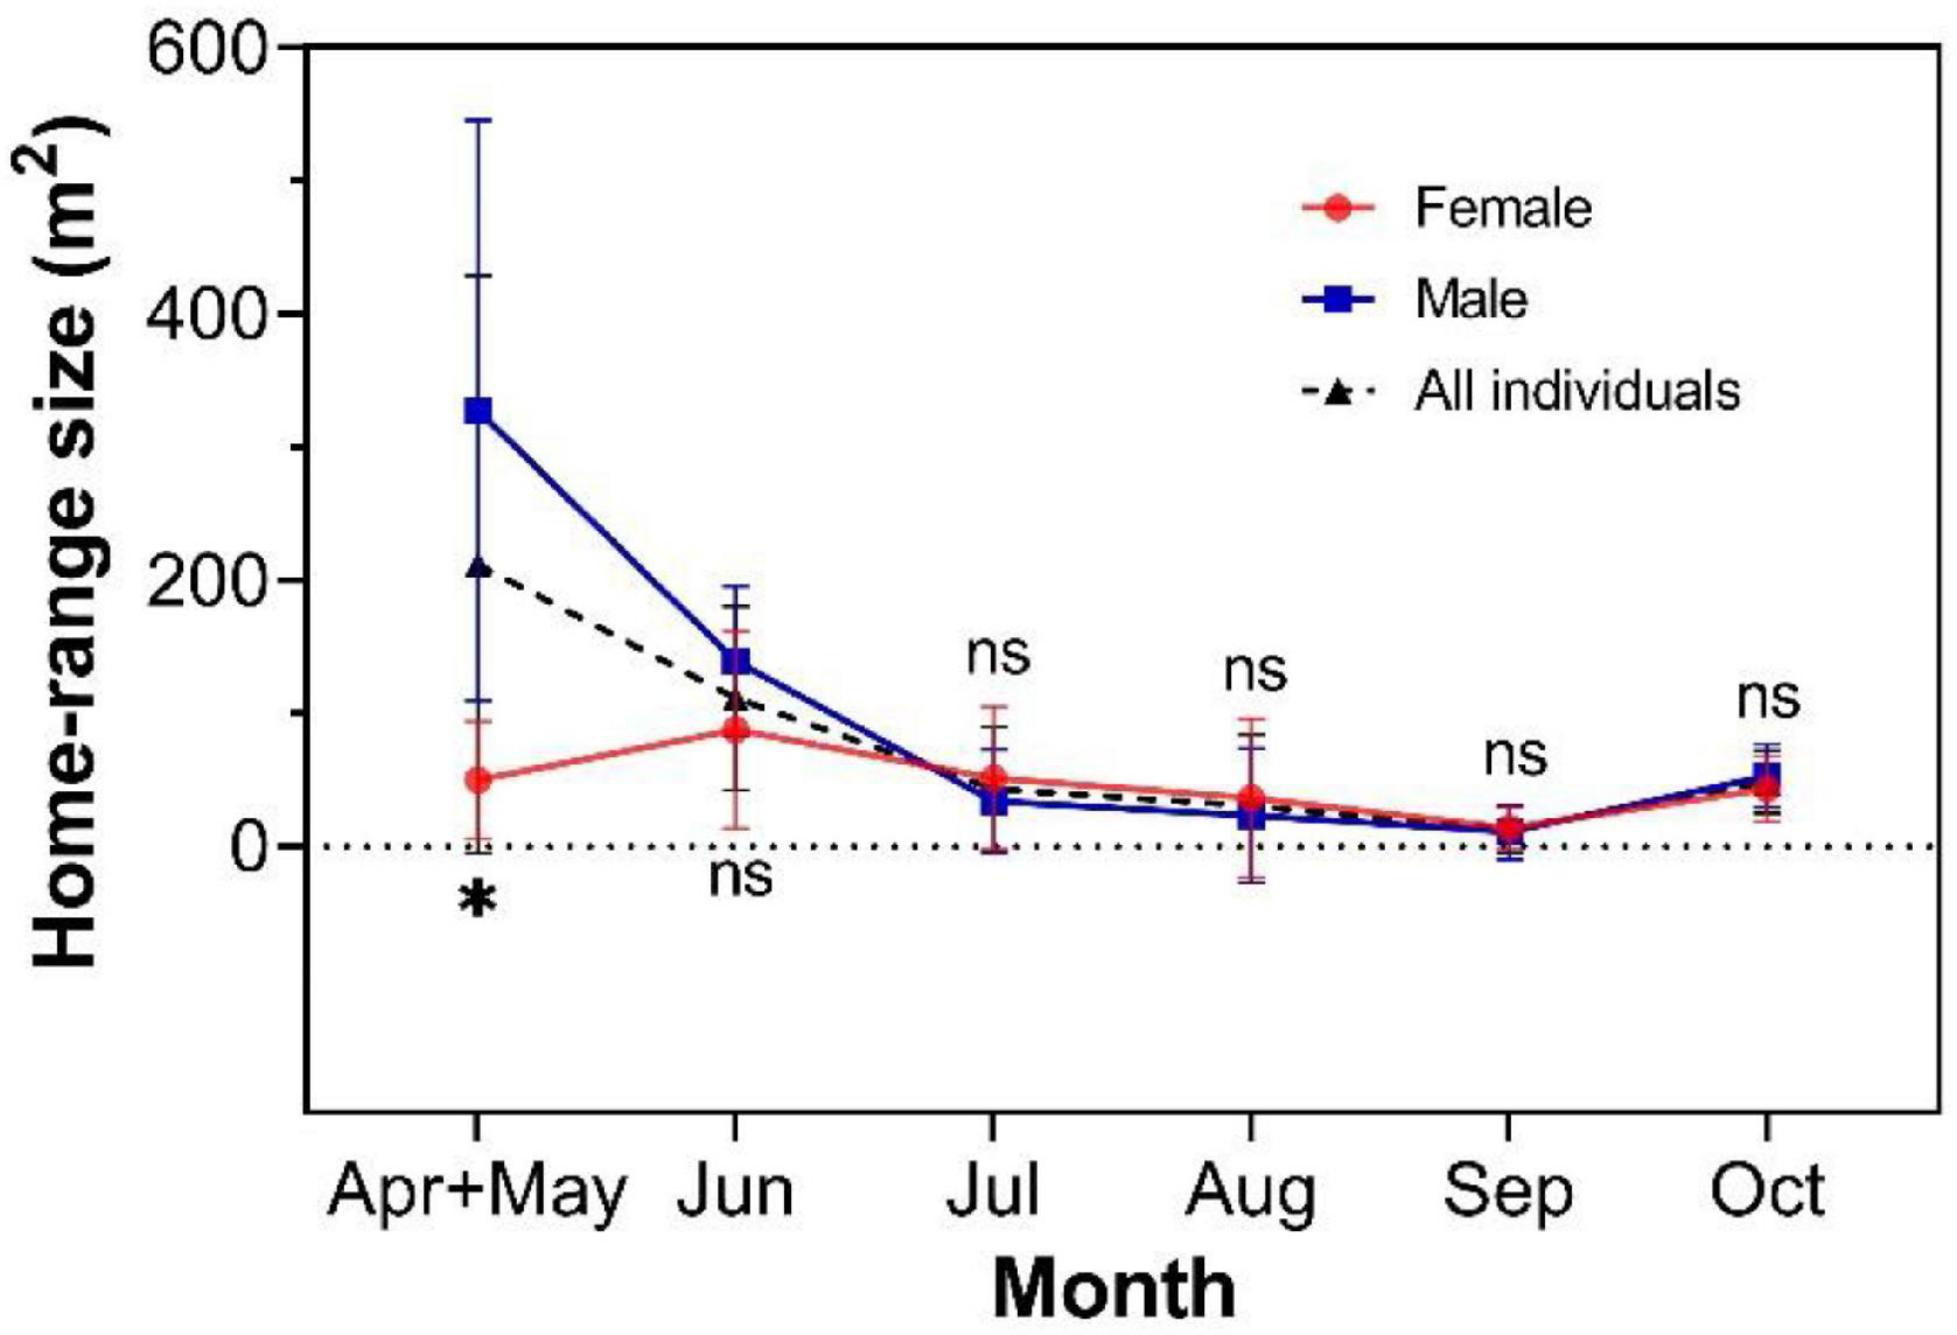
Figure 2. Comparison of the sizes of the home range of males and females in different months. The average sizes of the home range of all individuals are represented by the black dotted line. The asterisk indicates a significant difference, and ns means no significant difference in the home ranges of males and females. The results are presented as mean ± SD values.
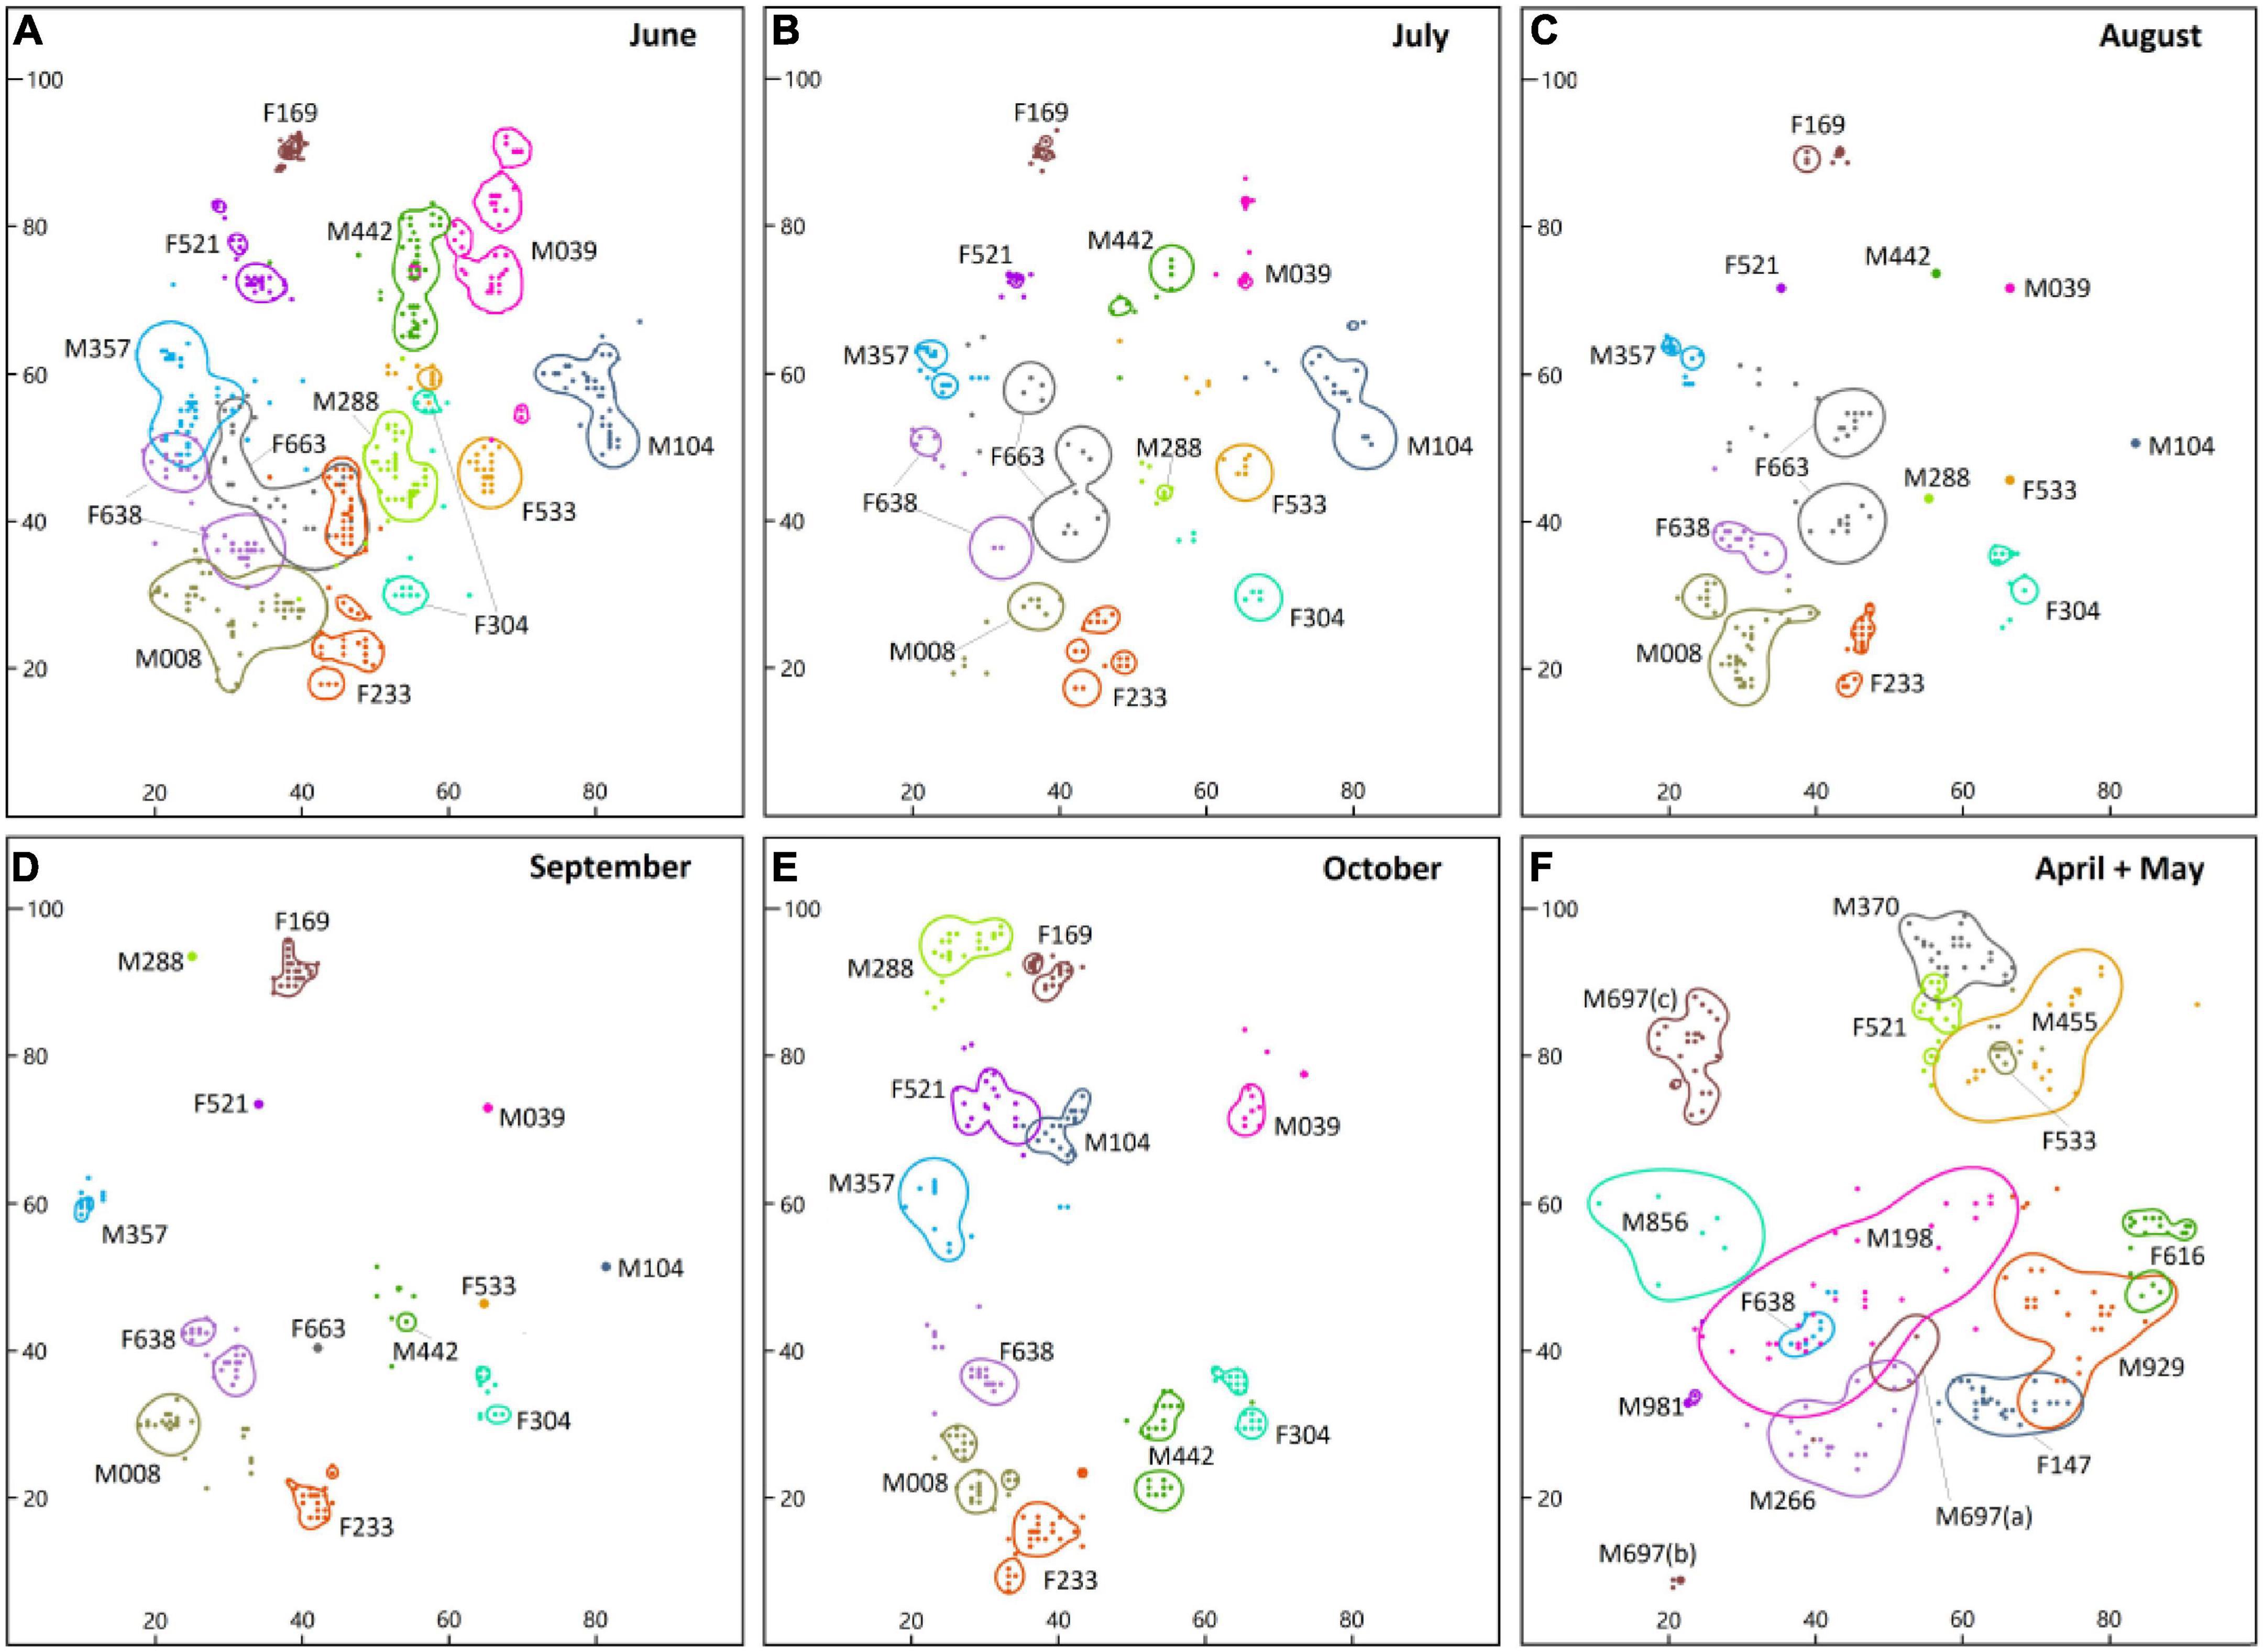
Figure 3. Representation of the size of the home range of radio-tracked Myospalax baileyi in an alpine meadow in eastern Qilian Mountain estimated by 95% KDE methods. Maps (A–E) show the continuous home ranges in 2016 (n = 13), whereas map (F) represents the home ranges of recaptured individuals in 2017 (n = 13). The area of the same color in a single month represents the home-range of one zokor. Coordinate axis units are meters.
We observed the individual M697 travel above-ground from the position (a) of capture to position (b) after 72 h of radio-tracking and then, after staying at position (c) for two days, it traveled above-ground to position (d) and built a new home range. There was no overlap between the home ranges of other adult males (Figure 3F).
In June, the home ranges of females overlapped those of males by 3.04 ± 4.75% (n = 7, female-male pairs), and the home ranges of males overlapped those of females by 4.48 ± 6.36% (n = 6, male-female pairs; Figure 3F). The home ranges of two pairs (F663-F233 and F638-F663) of the seven radio-tracked females overlapped by mean of 52.45 m2 and 7.95 m2 (Figure 3A), whereas only one pair in the six radio-tracked males overlapped by a mean of 2.4 m2. There was no overlap between the home ranges of males, females, or female and male from July to September. In October, only one pair (M104–F521) had small overlaps (overlapped area: 2.78 m2). The mean percentage of overlap of the home range of a single zokor with other individuals was 9.97 ± 15.13% in April and May and 32.55 ± 34.88% in June (Table 1); this difference in the proportion of overlap was significant (Mann–Whitney U-test = 30, P = 0.007). The average area of overlap of the home range of single individuals (16.56 ± 23.33 m2) in June was smaller than the area of overlap in April and May (29.00 ± 22.45 m2). Difference was found in these two months (t = 55, d.f. = 23, P = 0.041). In June, no individual nest was occupied by other individuals, and no two individuals were wirelessly traced to the same coordinate point at the same time in the overlap region. No overlap was found between the home ranges of all individuals in July (Figure 3B and Table 1).
The average sizes of the home ranges of males and females were small during the non-breeding season (Unpaired t-test: August, t11 = 0.421, P = 0.682; September, t9 = 0.321, P = 0.754; October, t9 = 0.663, P = 0.524; Figure 2). No overlap was found between the home ranges of males and females in August or September (Figures 3C,D). In October, only one pair (M104–F521) of the 11 individuals showed overlap (Figure 3E). The overlap area of the home ranges of M104 and F521 was only 2.78 m2 (Table 1), accounting for 7.21 and 3.64% of their respective home ranges. However, the overlap area of the home ranges of M442 and F304 reached 14.2 m2, accounting for 8 and 31.2% of their home ranges, respectively (Table 1). All the radio-tracked individuals stayed in their own nests from November 2016 to March 2017 and the size of the home range of all the individuals was <1 m2.
The building of new mounds shows that the plateau zokors are expanding their existing tunnels or establishing a new tunnel system. The plateau zokors mainly built new mounds during the breeding season and in October during the non-breeding season (Table 2). The males built significantly more new surface mounds (average 10.1 ± 3.3) than the females (average 4.0 ± 1.9; t = 3.736, d.f. = 10, P = 0.004) during the courtship and mating stages in 2017. However, we found no significant difference between the number of new mounds built by males (9.5 ± 3.5) and females (8.6 ± 6.1) during the period of pregnancy and lactation in June (t = 0.328, d.f. = 11, P = 0. 749). The number of new mounds built by females (average 7.0 ± 4.0) was significantly higher than the number of new mounds built by males in July (average 3.0 ± 1.1; t = 2.385, d.f. = 11, P = 0.036).
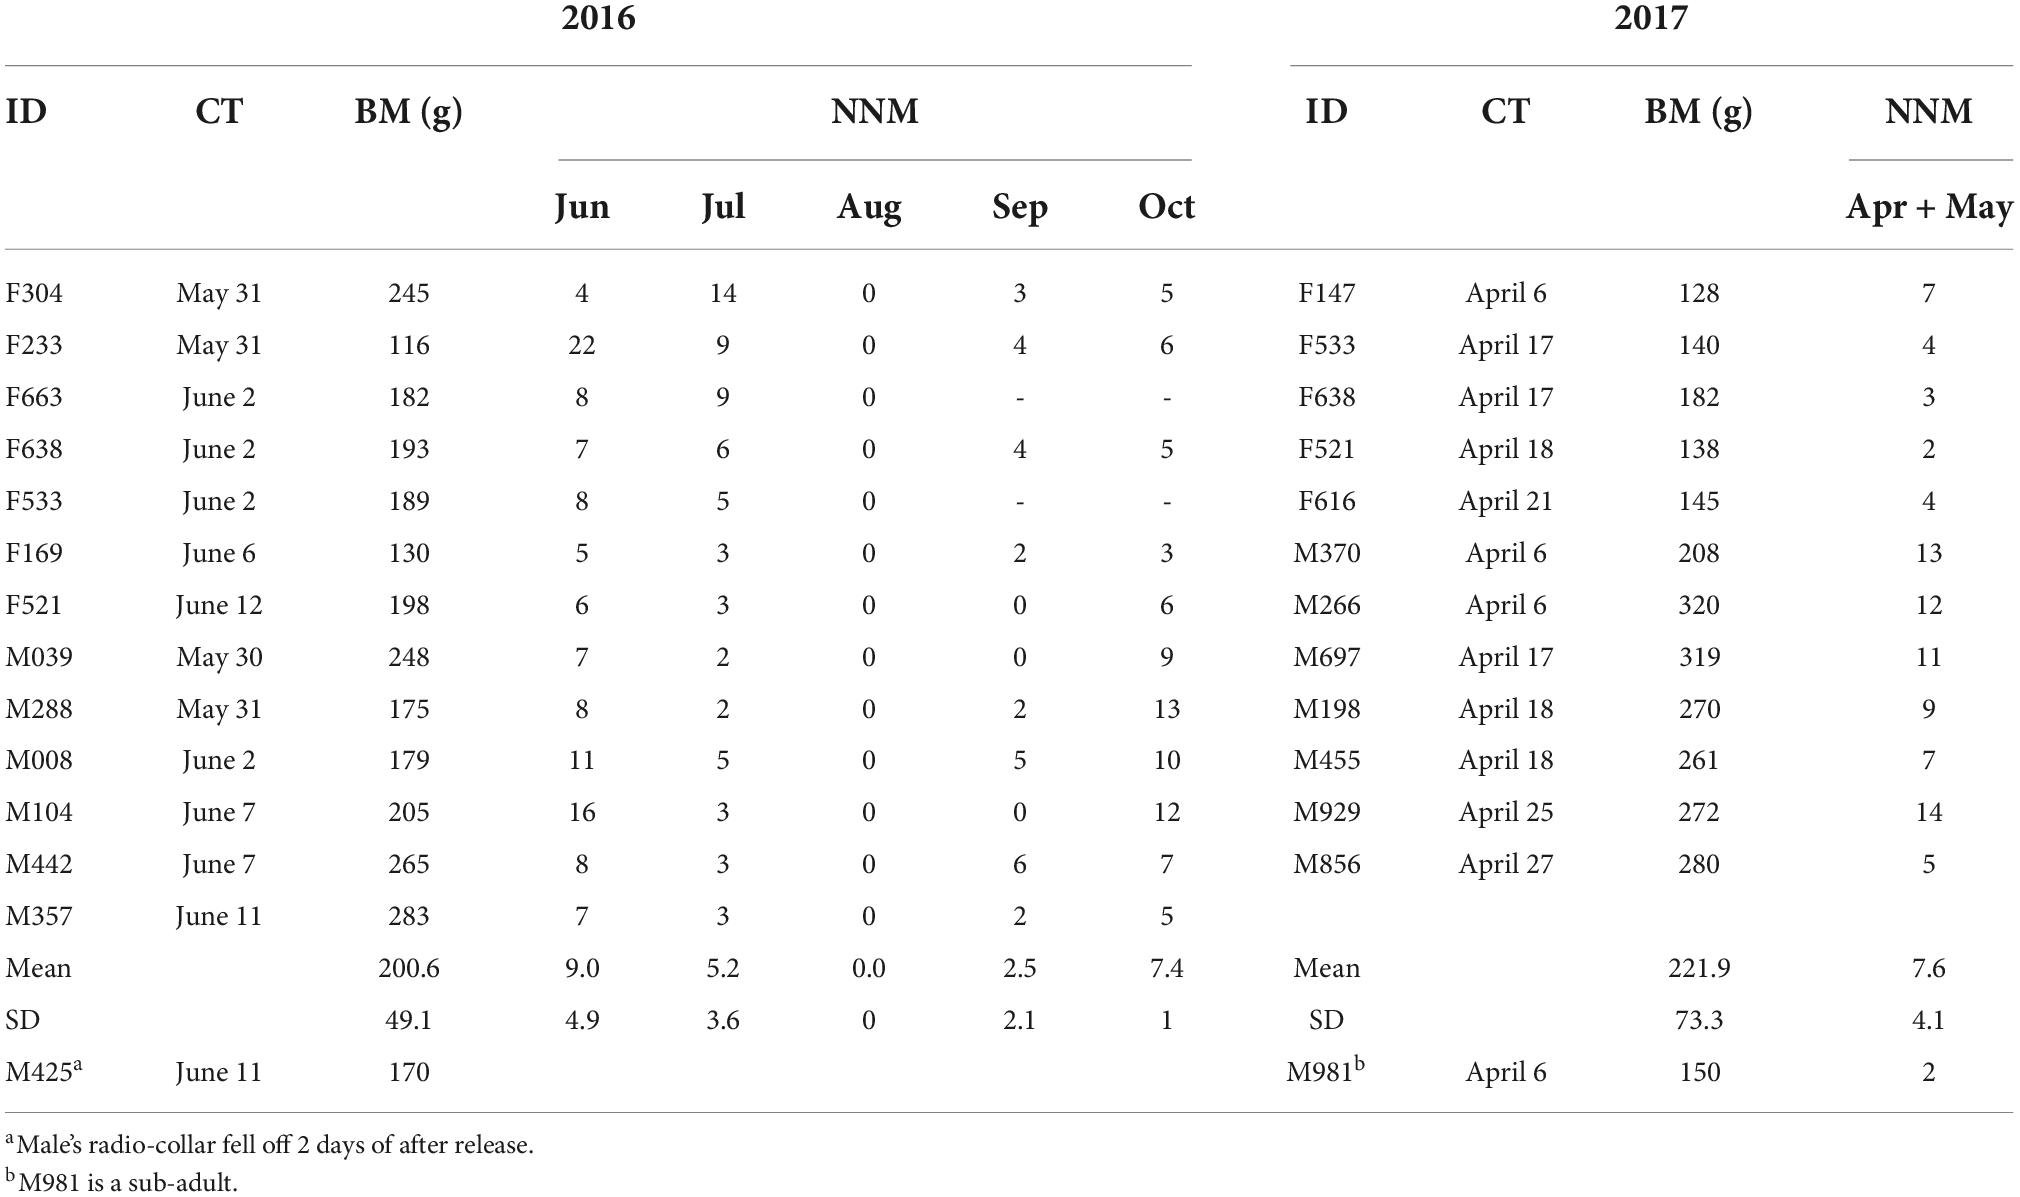
Table 2. Individual ID (sex + transmitter), capture time (CT), body mass (BM) and number of new mounds (NNM) in different months.
No new mound was visible above ground during the non-breeding season in August and only a few new mounds were seen in September (average: females (n = 5) 2.6 ± 1.7, males (n = 6) 2.5 ± 2.5; t = 0.075, d.f. = 9, P = 0.941). Some individuals did not even leave their own nests in August and September (Figures 3C,D). In October, the number of new surface mounds built by males averaged 9.3 ± 3.0 compared with 5.0 ± 1.2 new mounds built by females; this difference was significant (t = 2.996, d.f. = 9, P = 0.015). No new surface mound was built from November 2016 to March 2017 because the ground was frozen to 15 cm depth (Figure 1). The females captured in our study had a lower body mass than the males (average: females 146.6 ± 20.7g, males 257.7 ± 38.1g; t = 6.831, d.f. = 10, P < 0.0001) and no significant difference (average: females 179.0 ± 43.6g, males 225.8 ± 45.8g; t = 1.892, d.f. = 11, P = 0.085) was observed in 2016 (Table 2).
Except for F304, the home ranges of other individuals in June had overlapped with their home ranges in July. The average overlaps accounted for 31.61 ± 25.72% (females 23.73 ± 29.40% and males 39.50 ± 21.03%) of the home ranges in June, but 87.86 ± 17.00% (females 93.72 ± 9.86% and males 82.01 ± 21.37%) of the home ranges in July (Figure 3). The home ranges of four males (M008, M357, M288 and M039) and two females (F533 and F521) in July were completely contained within their home ranges in June (Figure 4). There was no change in the position of the home range of all individuals at this stage.
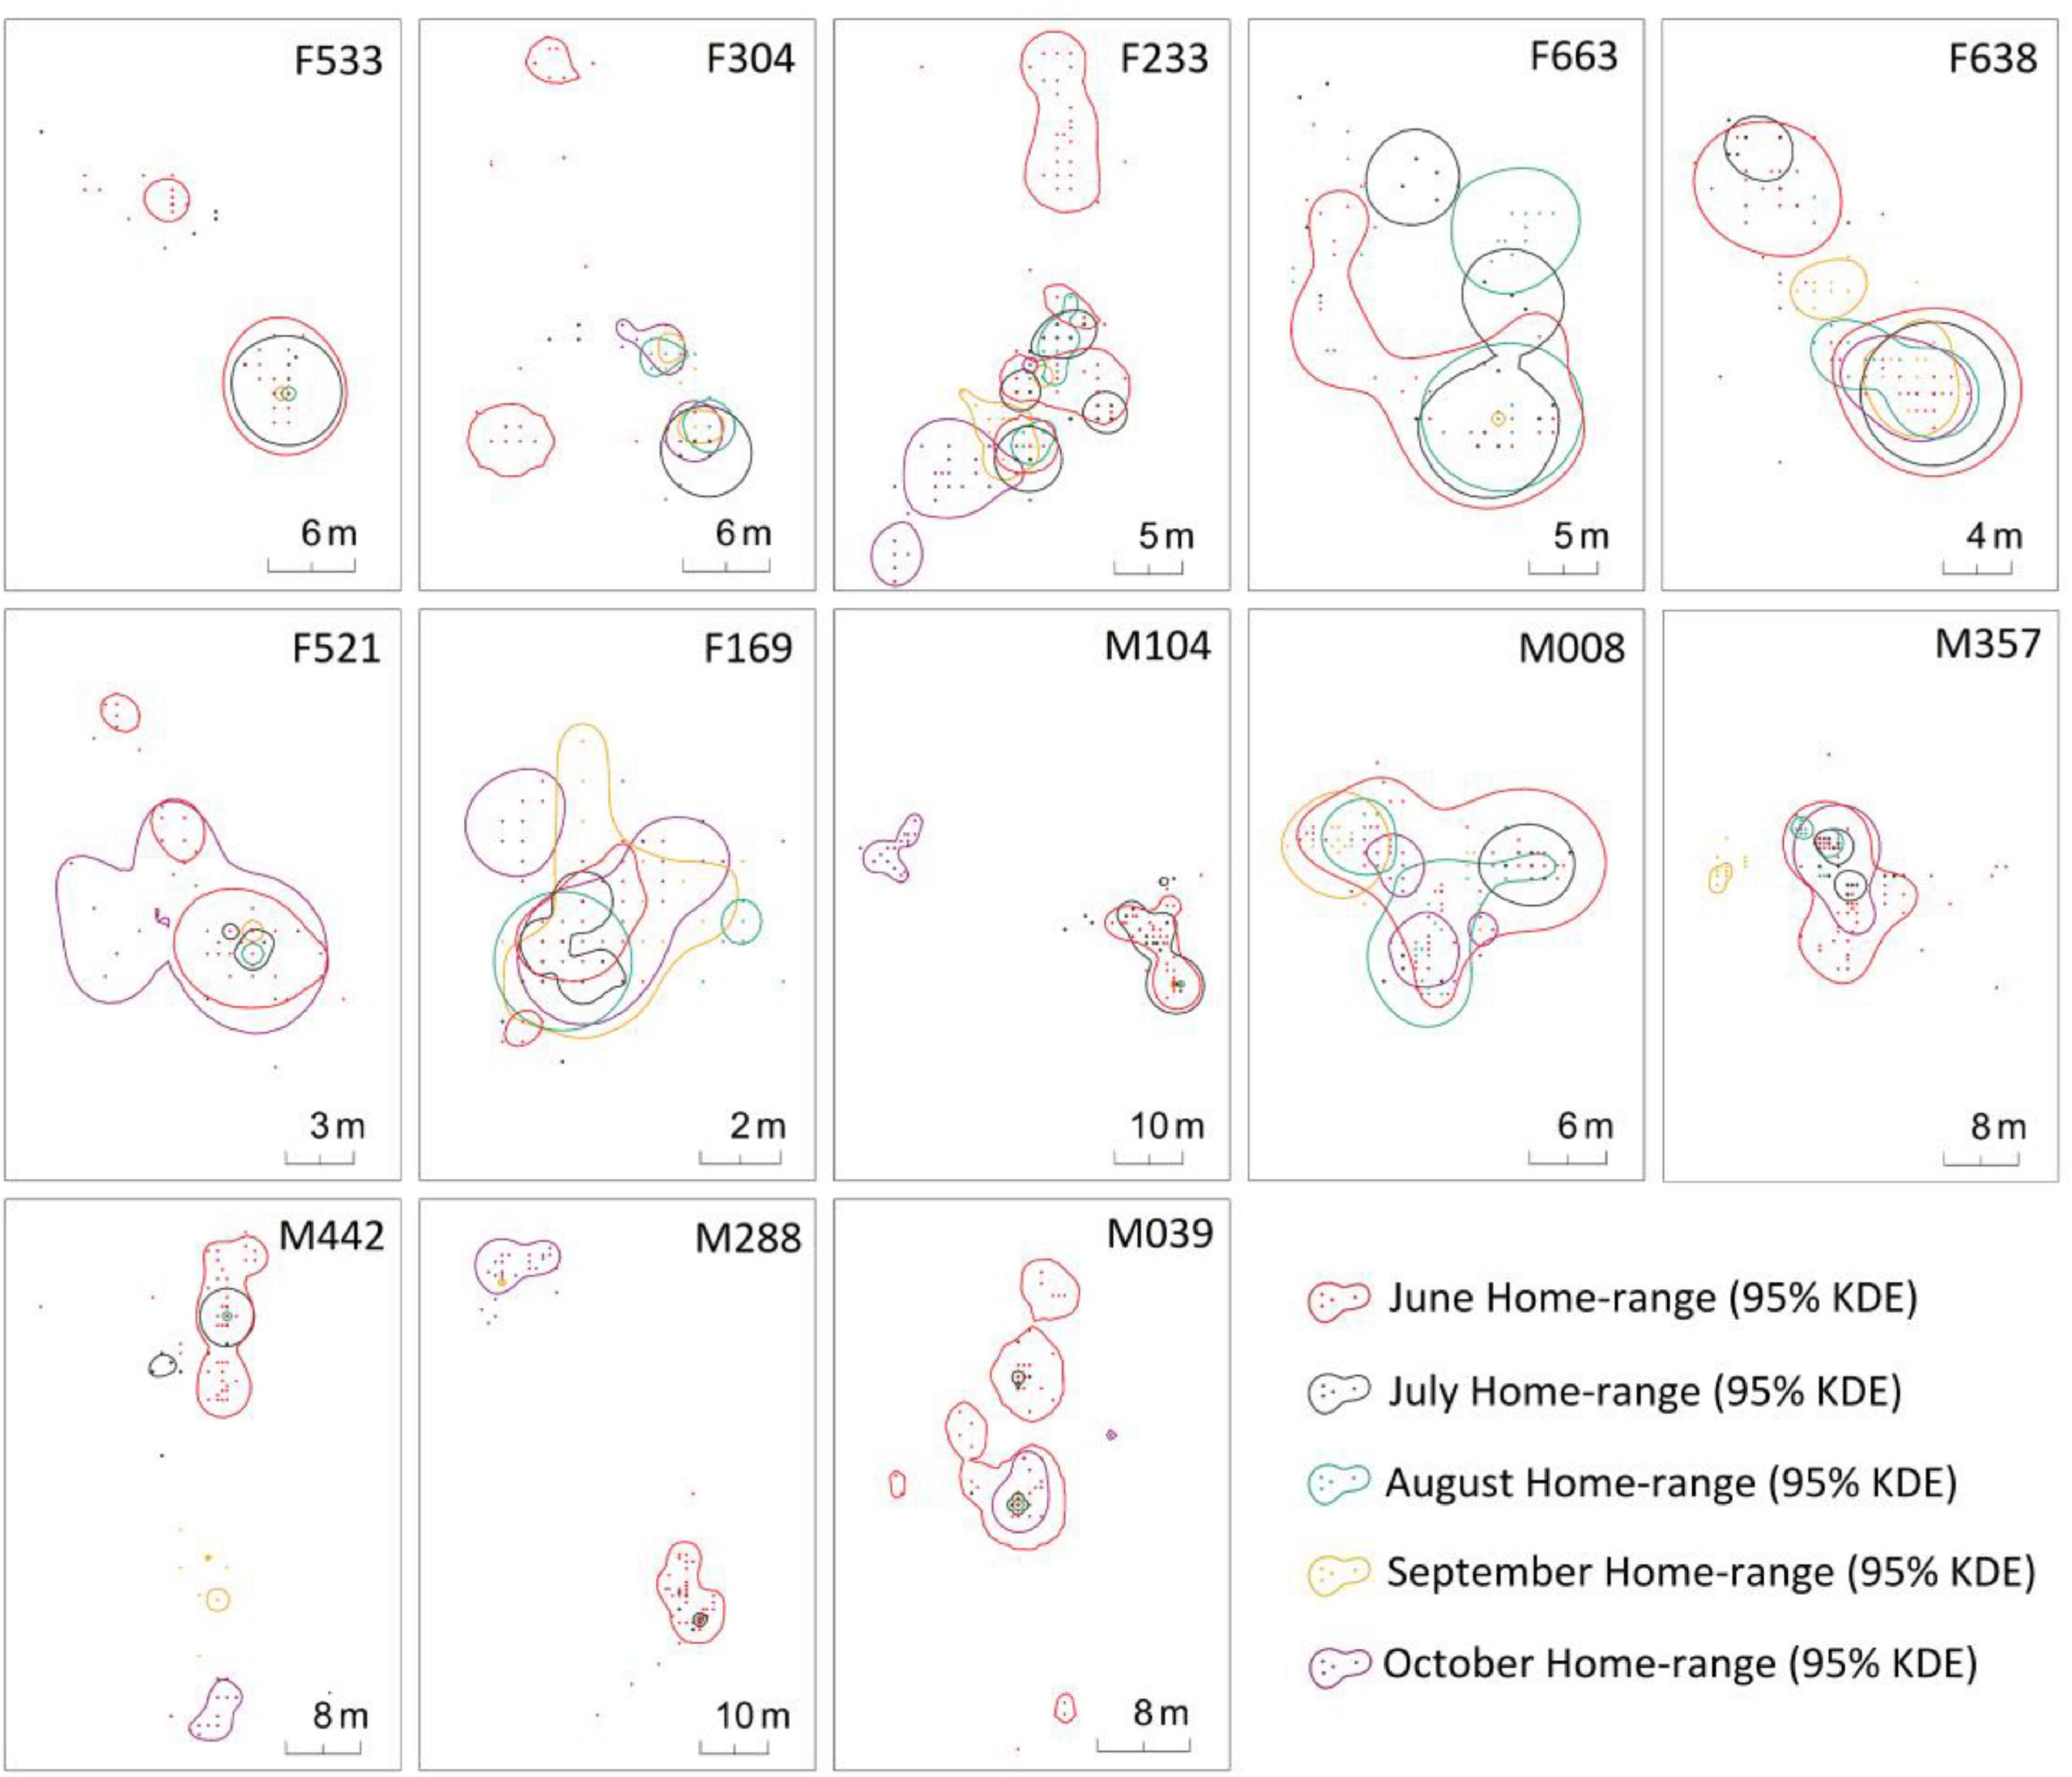
Figure 4. Monthly dynamics of each individual home range of M. baileyi from June to October 2016.
Four of the seven females, except for the two individuals (F533 and F663) who shed their radio-collars, had overlapped ranges in June and October (Figure 4). The average overlap area of their home ranges was 18.83 ± 16.16 m2 (range 2.86–34.93 m2). The proportion of overlap area in the size of the home range in June was 50.80 ± 21.93% and 43.97 ± 20.17% in October (Table 3). The movements in the home range of four females (F233, F638, F521 and F169) from June to October was around their respectively original nest. F304 appeared to be building a new nest from July and almost gave up its June home range after October.
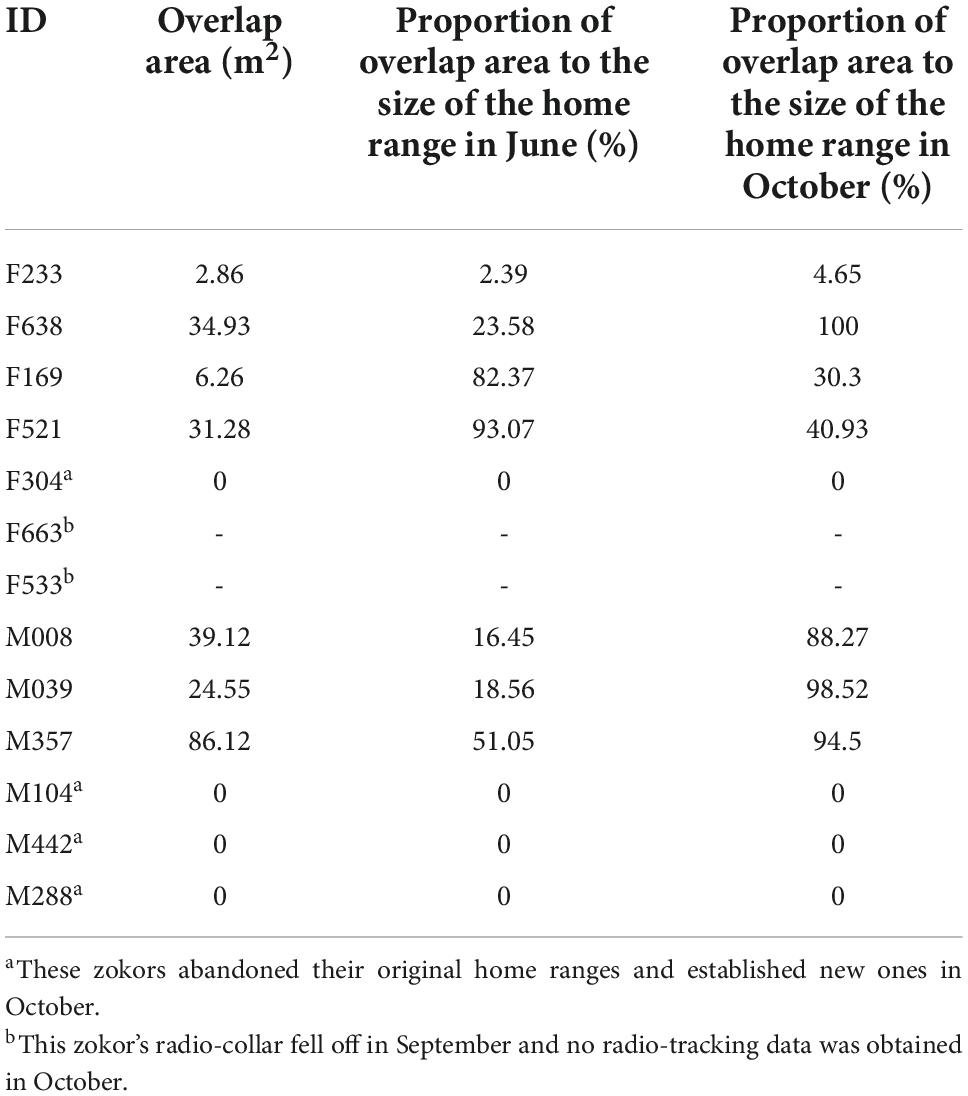
Table 3. Overlap area of the same individual’s home range between June and October and the percentage of the overlap ratio in each month of 2016.
The home ranges of only three individual males (M008, M357, and M039) in October overlapped with those of June and the position of their respective nest did not change (Figure 4). The average area of overlap was 43.93 ± 32.18 m2.
The average proportion of overlapping areas in a home range was 28.69 ± 19.39% and 93.76 ± 5.16% in June and October, respectively (Table 3). Three male zokors (M104, M442, and M288) completely opened up new home ranges, and established new nests in October and the closest distance from the old nest of their home ranges from October to June were 47.9 m, 53.0 m and 58.2 m, respectively 0.53
There was a significant difference between months on mean soil compaction (χ2 = 18.65, d.f. = 6, P = 0.002; Figure 5B) and there were statistically significant differences of the above- and below-ground plant biomass (Kruskal-Wallis statistic: above-ground plant biomass, χ2 = 46.41, d.f. = 6, P < 0.001; underground plant biomass, χ2 = 43.00, d.f. = 6, P < 0.001; Figure 5A).
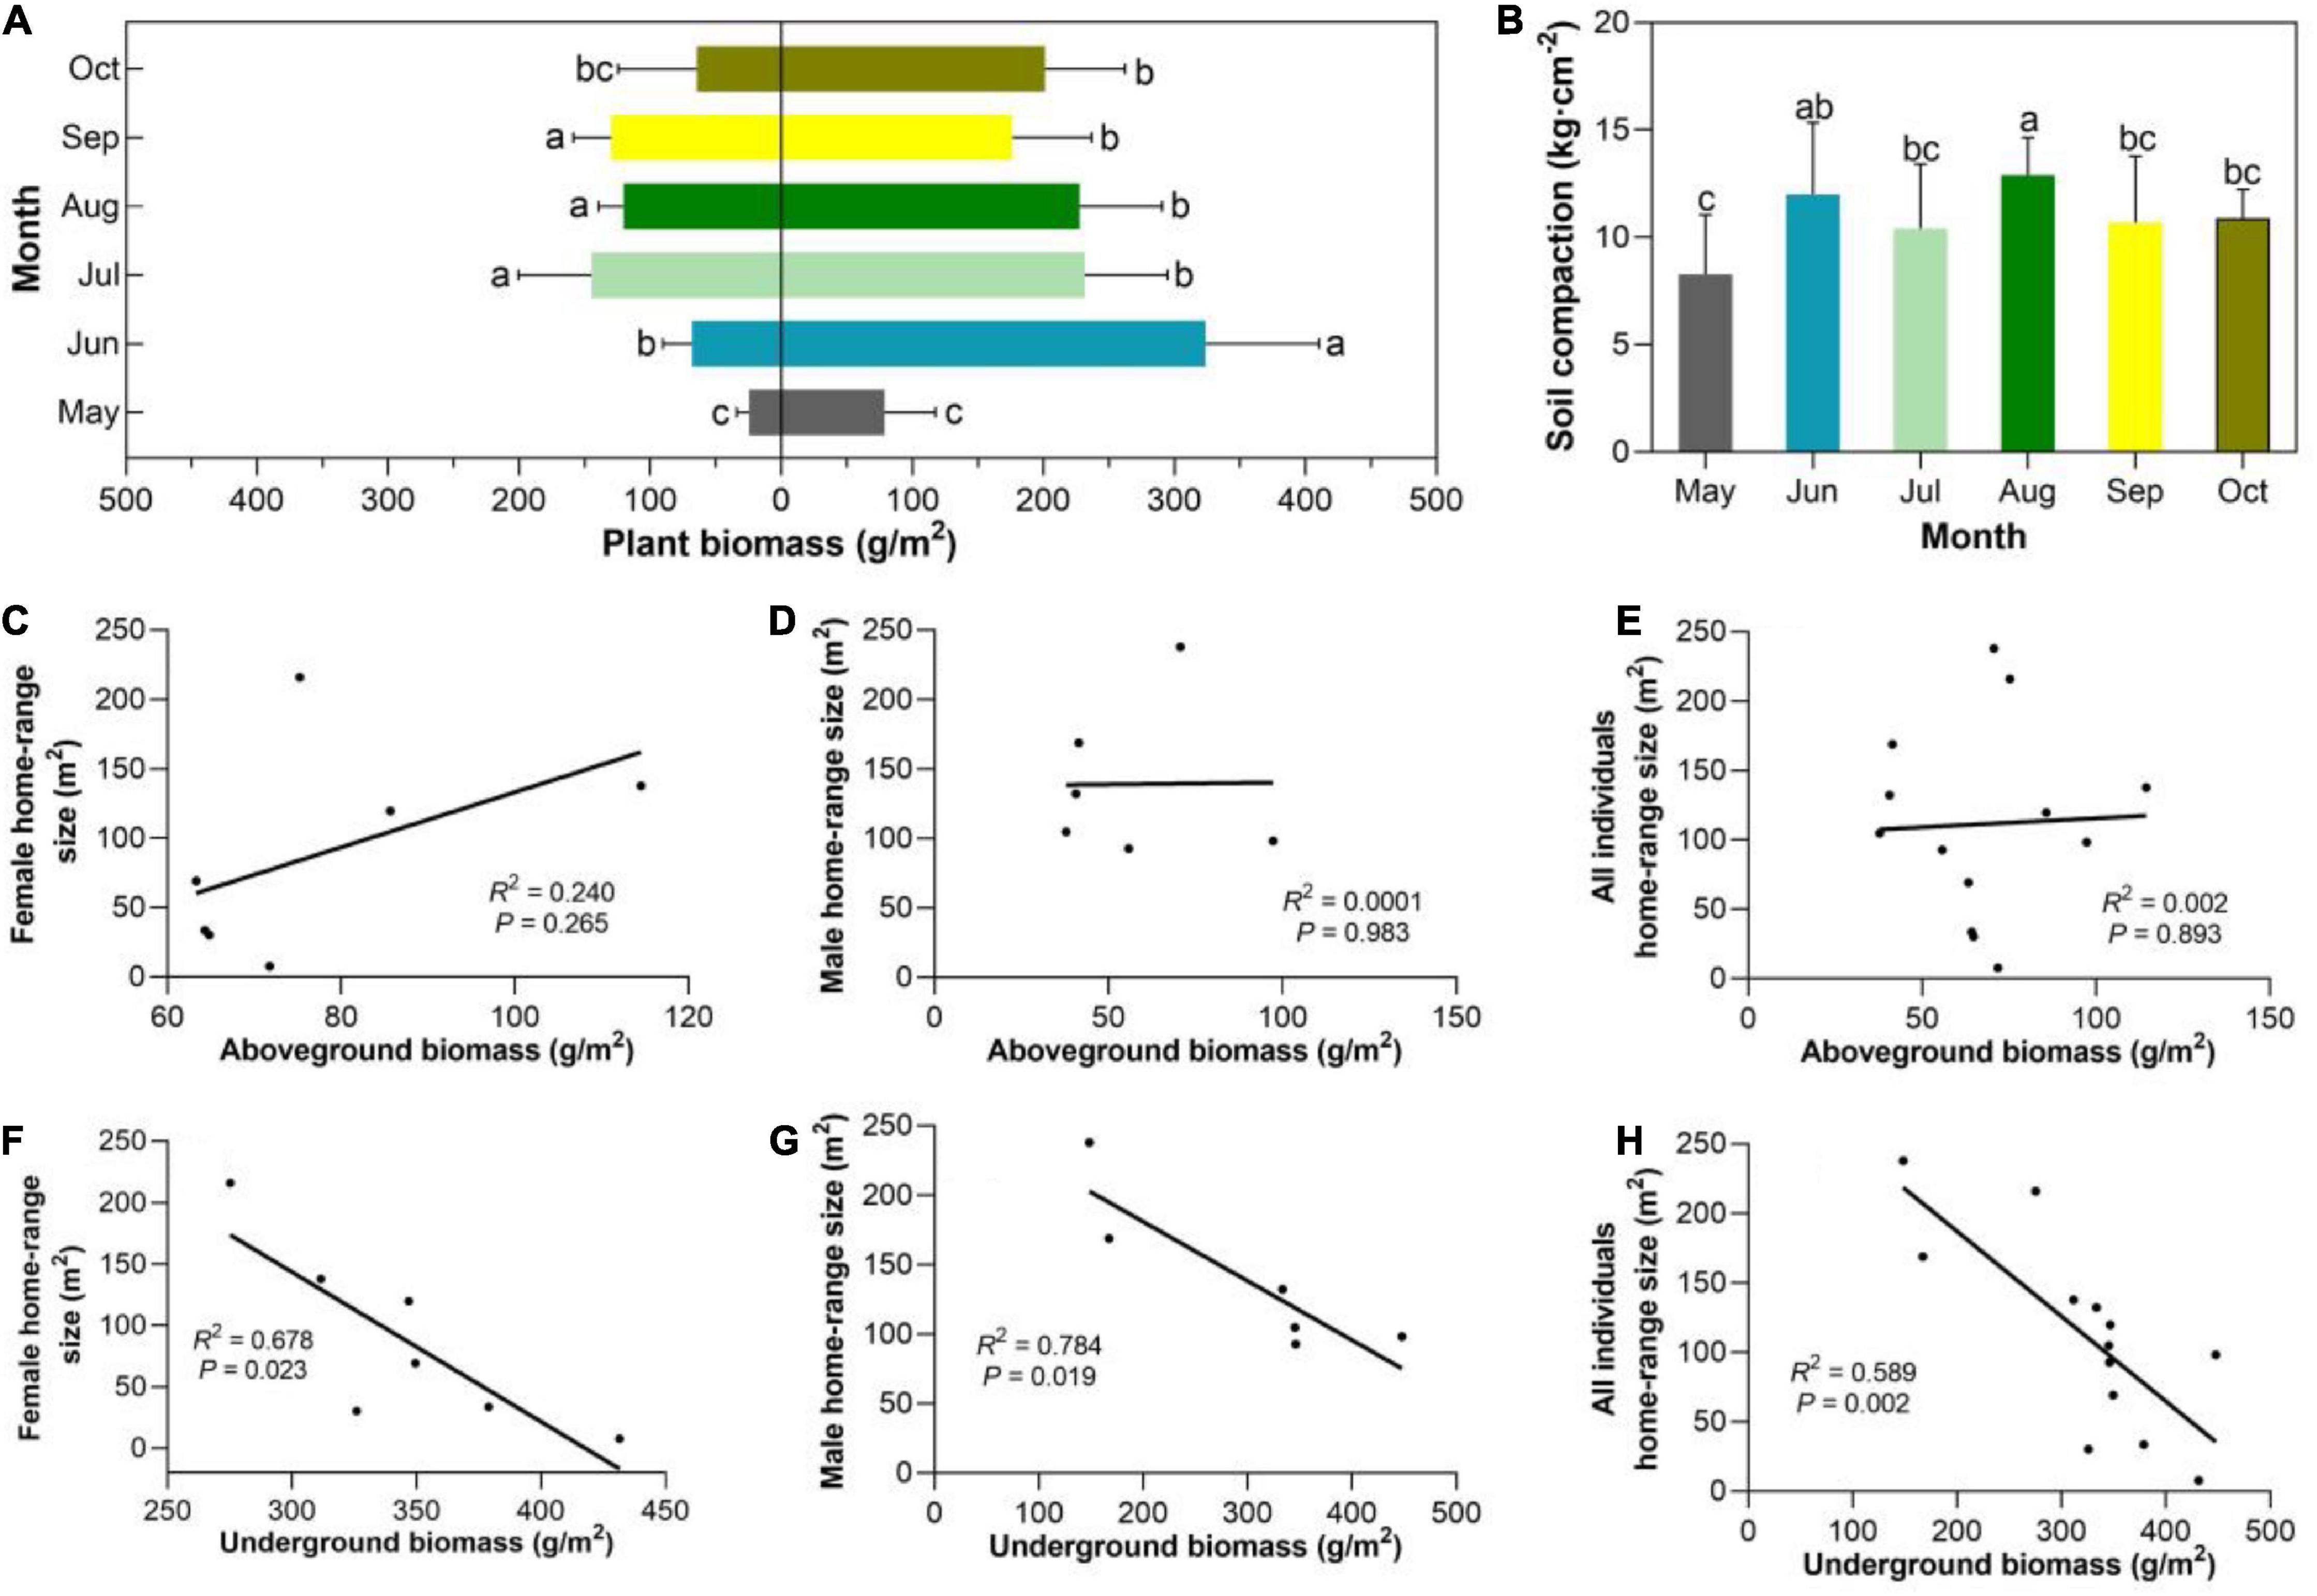
Figure 5. (A) Aboveground and underground plant biomass. The lowercase letters represent the differences between months. (B) Changes in soil compaction. Relationships between the aboveground (or underground) biomass with the average size of the home range of female (C,F), male (D,G), and all individuals (E,H) in June, 2016.
The size of the home range in June for females, males and all individuals did not show a significant correlation with the above-ground plant biomass (R2 = 0.0001–0.2398, P = 0.265–0.983, Figures 5C,D,E), respectively. And there was no significant relationship between the size of the serial home ranges and soil compaction (R2 = 0.057–0.607, P = 0.004–0.567). By contrast, the size of the home range of females, males and all individuals did show a significantly negative correlation with the underground plant biomass regardless of the mating period (R2 = 0.589–0.784, P = 0.002–0.023; Figures 5F,G,H).
Our analysis of the variation in the size and overlap of the home range of plateaus zokors throughout the year suggests that physical contact and environmental characteristics influence the utilization of space by M. baileyi. Their home ranges showed dynamic changes in each month and constantly shifted in space. During the mating period, the home ranges of males were 6.5 times larger than the home ranges of females, although both females and males occupied similar sized home ranges at other times. The home ranges of females increased significantly in size in June after mating as the females extended their ranges to 1.8 times larger than these during the mating period to overlap with the home ranges of neighboring individuals. During the non-breeding season, the home ranges of most of the zokors remained within an optimum size and there was little overlap between individuals.
Although we did not excavate the burrow systems of the radio-tracked zokors, the size of their home range in the breeding season was 139.10 ± 56.01 m2, not significantly different from the average size of the home range (122.7 ± 53.75 m2) found by Zhou and Dou (1990) using radio-tracking. Studying the secretive habits of subterranean rodents in their natural state is often challenging and has previously been achieved by excavating entire burrow systems (Reichman et al., 1982; Davies and Jarvis, 1986). However, this method only provides snapshots of the tunnel system geometries of individuals or colonies that are then used to estimate the size of their home range (Cutrera et al., 2006). This method cannot perform long-term tracking of the nest domain. Longer studies of the utilization of space by subterranean rodents relies on registering new surface mounds and capture sites, but this method may be not appropriate for M. baileyi because two females (F663 and F169) expanded their home range in August (Figure 3C), although none of the individuals produced new mounds in this month.
Plateau zokors show dynamic changes in the size and overlap of their home ranges between intraspecific individuals in their natural habitat. A number of factors may explain the larger home ranges of male M. baileyi during the mating period. Many solitary subterranean rodents have a polygynous mating system (Cooper and Randall, 2007). Males try to gain access to multiple potential estrus females by expanding their burrow systems (Schoen and Kirchhoff, 1985), suggesting that females are a finite resource that probably affects the home ranges of males. Although the mating system of plateau zokor is still controversial (Zhang, 2007), we found that a male zokor (M929) entered the nest of different two females (F147 and F616) (Figure 3F), suggesting that M. baileyi may be a polygynous mating system. Intersexual differences in sizes of the home ranges of M. baileyi during the mating season also have been reported by Zhang et al. (1993). Our findings suggest that the home ranges of males remain relatively independent, which avoids competition during the mating period. Similar findings have been reported by Zhou and Dou (1990).
Solitary subterranean males may also search for a mate by traveling above ground; an earlier study of silvery mole rats reported that the long distances between the home ranges of mating partners ruled out an underground search for mates (Patzenhauerová et al., 2010) and showed that males probably look for estrus females by traveling above ground. In our study, a male zokor (M697) traveled above ground to two new locations and eventually established a new home range (with an area of 104 m2) within 32 days (Figure 3F). The capture–mark–recapture rates of male plateau zokors recapture lower than males over three years during the mating seasons (Zhang et al., 1993) and zokor skulls were found in vomit from many raptors (Cui et al., 2003), which shows that male zokors may be traveling above ground in search of females even though they are at high risk of predation. This may be another factor in the changes in their home ranges.
The home ranges of females often overlapped multiple home ranges of neighbors one month after the mating period, which is unusual among solitary and aggressive subterranean rodents (Tassino et al., 2011). M. baileyi seems to show a high tolerance for close neighbors. At this stage, the average size of a female’s home range was 1.8 times larger than during mating, which may be related to the large amount of food required during pregnancy and lactation; the size of the home range of males did not significantly change compared with the mating period. However, we estimated the core area of plateau zokors using the 50% KDE method and found that most individuals had no overlap, with only F233 and F663 overlapping by 3.66 m2; their core areas remained relatively independent and exclusive. Because the core areas are the location of cache and food storage (Zhou and Dou, 1990; Zhang, 2007), the defense of the cache and food resource may be a major factor in the preference of the subterranean rodents for solitude.
The home ranges of the plateau zokor were significantly reduced at the end of the period of reproduction and in the non-breeding season and there was no overlap between the home ranges of most individuals. The home range at this time can even be synonymized to the territory (Nevo, 1999; Winner et al., 2018). This may be because maintaining and defending a large territory could have large costs (e.g., predation risk and energy expenditure). In addition, about half of the individuals did not expand into new spaces in August and September during the non-breeding season, when their activities were mainly concentrated on their own nests, similar to the observations of Zhou and Dou (1990). A decreased intensity of activity of plateau zokor during this period was also reported (Ji et al., 2018). The space utilization patterns of subterranean rodents may reflect an adaptation to the ambient temperature of the tunnels11 to avoid overheating during the warm season (Rado et al., 1993).
Further evidence of the dynamic home ranges of the plateau zokor is a relatively low overlap between a single individual’s successive home ranges within a five-month period in 2016 (Figure 4). Females usually have a fixed nest, with new tunnels expanding from the nest. In addition to rearing their young, the changes in the home range may also reflect a balance between foraging strategy and the costs of traveling (Fisher and Owens, 2012). As proposed by Bandoli (1981), Zuri and Terkel (1996) and Smallwood and Morrison (1999), the burrow systems of solitary subterranean rodents are constantly shifted by extending new tunnels while backfilling or abandoning older tunnels. Refilling tunnels and abandoning older burrows makes a significant contribution to the dynamics of the home range of subterranean rodents. For example, Thorne and Andersen (1990) tracked the development of a single burrow system of a pocket gopher (Geomys bursarius) for five months. The pocket gopher excavated at least 110 m of tunnel on top of the initial burrow system during that time, while 77 m of the burrow was backfilled and 32 m of an air tunnel were abandoned. Silvery mole rats, strictly solitary subterranean rodents from East Africa, have been reported to continuously rebuild their burrow systems and backfill 64% of older tunnels on average during an 80-day monitoring period (2000). Zhou and Dou (1990) described M. baileyi refilling their burrows with excavated soil, although this was not quantified.
Our radio-telemetry data and observations of new surface mounds suggest that male plateau zokors have a more efficient rate of digging. Unlike the home ranges of females, the home ranges of males are unstable in the long term and shift in space, especially during the non-breeding season. Three males in our study built completely new burrows in October (non-breeding season) (Figure 4). The mean distance between the new home ranges of these three males and their old nests was 53.03 ± 5.15 m and there was no sign of surface movement and no opening left in the older home ranges. This changes the location of the home range from that during the mating period. For example, M697 left an open cave at two abandoned sites during the mating season, traveling > 88 m above ground. Our results contradict the hypothesis of Nevo (1999) that the home ranges of all subterranean mammals, once established and used for a breeding season, are essentially permanent for life. Shifting home ranges have been reported for some solitary subterranean rodents, such as blind (Zuri and Terkel, 1996) and silvery mole rats (Lesage et al., 2000). Shifts in the home ranges of males may occur to avoid inbreeding or to reduce the competition for food resources and the space caused by future increases in the population (Zhang, 2007). We did not simultaneously capture two zokors in the same burrow systems of females, suggesting that individuals born in the previous breeding season had built their own nests. The migration of the home ranges of solitary subterranean rodents may be a self-regulation strategy for controlling the population density (Galiano et al., 2014), although Šklíba et al. (2009) thought that changes in the home ranges are more likely to reflect a defensive strategy.
Most subterranean rodents, including plateau zokors, inhabit seasonal environments (Begall et al., 2007). The seasonal availability of food probably influences the use of space by subterranean rodents (Busch et al., 2000). Although the underground storage organs of plants are the main source of food for subterranean rodents, plateau zokor are known to consume the aerial parts of vegetation in addition to subterranean plant organs and even feed on the stems and leaves of grass and sedge which may affect their utilization of space (Wang et al., 2003). The burrowing and foraging activities of M. baileyi have a great influence on the soil properties and plant community (Zhang et al., 2014) and there is evidence of overgrazing in the alpine meadows of the Qinghai–Tibetan Plateau, leading to increased degradation of the grasslands (Zhang and Liu, 2003). We found that there was a significant positive correlation between the size of the home range of plateau zokors in different months and the underground biomass.
Soil compaction is also considered to be an ecological constraint in extending the burrows of subterranean rodents (Galiano et al., 2016; Kubiak et al., 2018). Although we found no significant difference, there was such a constraint between the two peaks (June and October) in the activity on the plateau and the average size of the home ranges was significantly larger in June than in October (Mann–Whitney U-test = 30, P = 0.015). This may be due to the abundance of underground biomass in June, whereas in October the zokors need to gather a lot of food from underground for the long winter because the above-ground parts of plants are almost inedible. M. baileyi did not expand its home range to obtain more food when there was less underground biomass. It is suggested that they may dig more branching tunnels for foraging, but this was not been proved in our study because we did not open the tunnels for long-term monitoring. Exploration of the surroundings of permanent primary tunnels by excavating short, branched foraging tunnels is a typical behavior in many subterranean rodents (Davies and Jarvis, 1986; Šklíba et al., 2009, Tassino et al., 2011). Additional studies, such as the impact of intraspecific seismic communication on the size of the home range, are required to further understand the use of space by M. baileyi and other solitary subterranean rodents.
Our monitoring data provide information on the size of the home range of M. baileyi in relation to mating behavior and food resources. We have shown that the home ranges of M. baileyi are dynamic and that males can change the location of their home range within one breeding cycle. Understanding the use of space by subterranean rodents and their dispersal are crucial to their conservation and management. More comprehensive information on burrows should be combined with subsequent excavation and mapping of burrow systems.
The original contributions presented in this study are included in the article/Supplementary material, further inquiries can be directed to the corresponding author.
Institutional guidelines for the use of animals were followed and the Animal Ethics Committee of Gansu Agricultural University approved the experimental procedure (approval no. GSC-IACUC-2018-0011), and local authorities’ approval was also obtained.
LH and JZ designed the research project and conceived the manuscript. JZ and CJ wrote the first draft. JZ, KD, and BC collected the data. JZ and LW analyzed the data. JZ, CJ, KD, BC, LW, and LH reviewed and edited the manuscript. All authors contributed to the article and approved the submitted version.
This work was supported by the Industrial Technology Research and Development Funds, Bureau of Education, Gansu, China (2021CYZC-05); the National Natural Science Foundation of China (32160338); the National Natural Science Foundation of China (32001385 and 32172434); the National Science and Technology Basic Resources Investigation Project (2019fy100300) and Basic scientific research business expenses of CAAS (1610332022012).
The authors declare that the research was conducted in the absence of any commercial or financial relationships that could be construed as a potential conflict of interest.
All claims expressed in this article are solely those of the authors and do not necessarily represent those of their affiliated organizations, or those of the publisher, the editors and the reviewers. Any product that may be evaluated in this article, or claim that may be made by its manufacturer, is not guaranteed or endorsed by the publisher.
The Supplementary Material for this article can be found online at: https://www.frontiersin.org/articles/10.3389/fevo.2022.1041322/full#supplementary-material
Bandoli, J. H. (1981). Factors influencing seasonal burrowing activity in the pocket gopher, Thomomys bottae. J. Mammal. 62, 293–303. doi: 10.2307/1380706
Begall, S., Burda, H., and Schleich, C. E. (2007). Subterranean rodents: News from underground. Berlin: Springer. doi: 10.1007/978-3-540-69276-8
Boutin, S. A. (1979). Spacing behavior of snowshoe hares in relation to their population dynamics. Vancouver, BC: University of British Columbia Library. Available online at: https://open.library.ubc.ca/collections/ubctheses/831/items/1.0095063
Burt, W. H. (1943). Territoriality and home range concepts as applied to mammals. J. Mammal. 24, 346–352. doi: 10.2307/1374834
Busch, C., Antenucci, C. D., Del Valle, J. C., Kittlein, M. J., Malizia, A. I., Vassallo, A. I., et al. (2000). “Population ecology of subterranean rodents,” in Life underground: The biology of subterranean rodents, eds E. A. Lacey, J. L. Patton, and G. N. Cameron (Chicago, IL: University of Chicago Press), 183–226.
Cooper, L. D., and Randall, J. A. (2007). Seasonal changes in home ranges of the giant kangaroo rat (Dipodomys ingens): A study of flexible social structure. J. Mammal. 88, 1000–1008. doi: 10.1644/06-MAMM-A-197R1.1
Cooper, W. E. (1978). Home range criteria based on temporal stability of areal occupation. J. Theor. Biol. 73, 687–695. doi: 10.1016/0022-5193(78)90130-3
Cui, Q., Lian, X., Zhang, T., and Su, J. (2003). Food habits comparison between Buteo hemilasius and Bubo bubo. Chin. J. Zool. 38, 57–63.
Cutrera, A. P., Antinuchi, C. D., Mora, M. S., and Vassallo, A. I. (2006). Home-range and activity patterns of the South American subterranean rodent Ctenomys talarum. J. Mammal. 87, 1183–1191. doi: 10.1644/05-MAMM-A-386R1.1
Cutrera, A. P., Mora, M. S., Antenucci, C. D., and Vassallo, A. I. (2010). Intra-and interspecific variation in home-range size in sympatric tuco-tucos, Ctenomys australis and C. talarum. J. Mammal. 91, 1425–1434. doi: 10.1644/10-MAMM-A-057.1
Davies, K. C., and Jarvis, J. U. (1986). The burrow systems and burrowing dynamics of the mole-rats Bathyergus suillus and Cryptomys hottentotus in the Fynbos of the south-western Cape, South Africa. J. Zool. 209, 125–147. doi: 10.1111/j.1469-7998.1986.tb03570.x
Fisher, D. O., and Owens, I. P. (2012). Female home range size and the evolution of social organization in macropod marsupials. J. Anim. Ecol. 69, 1083–1098. doi: 10.1111/j.1365-2656.2000.00450.x
Fleming, C. H., Fagan, W. F., Mueller, T., Olson, K. A., Leimgruber, P., and Calabrese, J. M. (2015). Rigorous home range estimation with movement data: A new autocorrelated kernel density estimator. Ecology 96, 1182–1188. doi: 10.1890/14-2010.1
Galiano, D., Kubiak, B. B., Menezes, L. S., Overbeck, G. E., and de Freitas, T. R. (2016). Wet soils affect habitat selection of a solitary subterranean rodent (Ctenomys minutus) in a Neotropical region. J. Mammal. 97, 1095–1101. doi: 10.1093/jmammal/gyw062
Galiano, D., Kubiak, B. B., Overbeck, G. E., and de Freitas, T. R. (2014). Effects of rodents on plant cover, soil hardness, and soil nutrient content: A case study on tuco-tucos (Ctenomys minutus). Acta Theriol. 59, 583–587. doi: 10.1007/s13364-014-0193-x
Hinsch, M., and Komdeur, J. (2017). What do territory owners defend against? Proc. R. Soc. B Biol. Sci. 284:20162356. doi: 10.1098/rspb.2016.2356
Hua, L., Ji, W., Zhou, J., and Zuo, S. (2015). A live trap and trapping technique for subterranean zokors (Rodentia). Mammalia 79, 487–490. doi: 10.1515/mammalia-2014-0042
Ji, C., Zhou, J., Chu, B., Zhou, R., Wang, Z., Wang, T., et al. (2018). Activity pattern of plateau zokor (Eospalax baileyi) and its influences in eastern Qilian Mountain region. Acta Theriol. Sin. 38, 201–210.
Kenward, R. E., Clarke, R. T., Hodder, K. H., and Walls, S. S. (2001). Density and linkage estimators of home range: Nearest-neighbor clustering defines multinuclear cores. Ecology 82, 1905–1920. doi: 10.1890/0012-9658(2001)082[1905:DALEOH]2.0.CO;2
Kubiak, B. B., Galiano, D., and de Freitas, T. R. (2017). Can the environment influence species home-range size? A case study on Ctenomys minutus (Rodentia, Ctenomyidae). J. Zool. 302, 171–177. doi: 10.1111/jzo.12444
Kubiak, B. B., Maestri, R., de Almeida, T. S., Borges, L. R., Galiano, D. D., Fornel, R., et al. (2018). Evolution in action: Soil hardness influences morphology in a subterranean rodent (Rodentia: Ctenomyidae). Biol. J. Linn. Soc. 125, 766–776. doi: 10.1093/biolinnean/bly144
Lesage, L., Crête, M., Huot, J., Dumont, A., and Ouellet, J. P. (2000). Seasonal home range size and philopatry in two northern white-tailed deer populations. Can. J. Zool. 78, 1930–1940.
Lessa, E. P. (2000). “The evolution of subterranean rodents: A synthesis,” in Life underground: The biology of subterranean rodents, eds E. A. Lacey, J. L. Patton, and G. N. Cameron (Chicago, IL: University of Chicago Press), 389–420.
Li, Y., Zhao, X., Cao, G., Zhao, L., and Wang, Q. (2004). Analyses on climates and vegetation productivity background at Haibei alpine meadow ecosystem research station. Plateau Meteorol. 23, 558–567.
Lovari, S., Sforzi, A., and Mori, E. (2013). Habitat richness affects home range size in a monogamous large rodent. Behav. Process. 99, 42–46. doi: 10.1016/j.beproc.2013.06.005
Lövy, M., Šklíba, J., Hrouzková, E., Dvořáková, V., Nevo, E., and Šumbera, R. (2015). Habitat and burrow system characteristics of the blind mole rat Spalax galili in an area of supposed sympatric speciation. PLoS One 10:e0133157. doi: 10.1371/journal.pone.0133157
Narins, P. M., Reichman, O. J., Jarvis, J. U., and Lewis, E. R. (1992). Seismic signal transmission between burrows of the Cape mole-rat, Georychus capensis. J. Comp. Physiol. A 170, 13–21. doi: 10.1007/BF00190397
Nevo, E. (1999). Mosaic evolution of subterranean mammals: Regression, progression, and global convergence. Oxford: Oxford University Press.
Patzenhauerová, H., Bryja, J., and Šumbera, R. (2010). Kinship structure and mating system in a solitary subterranean rodent, the silvery mole-rat. Behav. Ecol. Sociobiol. 64, 757–767. doi: 10.1007/s00265-009-0893-4
Powell, R. A., and Boitani, L. (2012). “Movements, home ranges, activity, and dispersal,” in Carnivore ecology and conservation: A handbook of techniques, eds L. Boitani and R. A. Powell (London: Oxford University Press), 188–217. doi: 10.1093/acprof:oso/9780199558520.003.0009
Powell, R. A., and Mitchell, M. S. (2012). What is a home range? J. Mammal. 93, 948–958. doi: 10.1644/11-MAMM-S-177.1
Rado, R., Shanas, U., Zuri, I., and Terkel, J. (1993). Seasonal activity in the blind mole rat (Spalax ehrenbergi). Can. J. Zool. 71, 1733–1737. doi: 10.1139/z93-245
Rado, R., and Terkel, J. (1989). A radio-tracking system for subterranean rodents. J. Wildl. Manag. 53, 946–949. doi: 10.2307/3809593
Reichman, O. J., Whitham, T. G., and Ruffner, G. A. (1982). Adaptive geometry of burrow spacing in two pocket gopher populations. Ecology 63, 687–695. doi: 10.2307/1936789
Schoen, J. W., and Kirchhoff, M. D. (1985). Seasonal distribution and home-range patterns of Sitka black-tailed deer on Admiralty Island, southeast Alaska. J. Wildl. Manag. 49, 96–103. doi: 10.2307/3801852
Shao, Y., Li, J., Ge, R., Zhong, L., Irwin, D. M., and Murphy, R. W. (2015). Genetic adaptations of the plateau zokor in high-elevation burrows. Sci. Rep. 5:17262.
Šklíba, J., Lövy, M., Koeppen, S. C. W., Pleštilová, L., Vitámvás, M., Nevo, E., et al. (2016). Activity of free-living subterranean blind mole rats Spalax galili (Rodentia: Spalacidae) in an area of supposed sympatric speciation. Biol. J. Linn. Soc. 118, 280–291.
Šklíba, J., Šumbera, R., Chitaukali, W. N., and Burda, H. (2009). Home-range dynamics in a solitary subterranean rodent. Ethology 115, 217–226. doi: 10.1111/bij.12741
Smallwood, K. S., and Morrison, M. L. (1999). Estimating burrow volume and excavation rate of pocket gophers (Geomyidae). Southwest. Nat. 44, 173–183.
Šumbera, R., Šklíba, J., Elichová, M., Chitaukali, W. N., and Burda, H. (2008). Natural history and burrow system architecture of the silvery mole-rat from Brachystegia woodland. J. Zool. 274, 77–84. doi: 10.1111/j.1469-7998.2007.00359.x
Tassino, B., Estevan, I., Garbero, R. P., Altesor, P., and Lacey, E. A. (2011). Space use by Río Negro tuco-tucos (Ctenomys rionegrensis): Excursions and spatial overlap. Mamm. Biol. 76, 143–147. doi: 10.1016/j.mambio.2010.06.002
Thorne, D. H., and Andersen, D. C. (1990). Long-term soil-disturbance pattern by a pocket gopher, Geomys bursarius. J. Mammal. 71, 84–89. doi: 10.2307/1381322
Turchin, P. (1998). Quantitative analysis of movement: measuring and modeling population redistribution of plants and animals. Sunderland, MA: Sinauer Associates.
Wada, K., and Ichiki, Y. (1980). Seasonal home range use by Japanese monkeys in the snowy Shiga Heights. Primates 21, 468–483.
Wang, Q., Zhang, Y., Wei, W., and Bian, J. (2003). Food habit of the plateau zokor. Acta Theriol. Sin. 20, 193–199.
Winner, K., Noonan, M. J., Fleming, C. H., Olson, K. A., Mueller, T., Sheldon, D., et al. (2018). Statistical inference for home range overlap. Methods Ecol. Evol. 9, 1679–1691. doi: 10.1111/2041-210X.13027
Zhang, W., Liu, C., Zheng, X., Fu, Y., Hu, X., Cao, G., et al. (2014). The increasing distribution area of zokor mounds weaken greenhouse gas uptakes by alpine meadows in the Qinghai–Tibetan Plateau. Soil Biol. Biochem. 71, 105–112.
Zhang, Y. (2007). “The biology and ecology of plateau zokors (Eospalax fontanierii),” in Subterranean rodents, eds S. Begall, H. Burda, and C. E. Schleich (Berlin: Springer), 237–249.
Zhang, Y., Fan, N., and Zhou, W. (1993). Study on the population ecology of the plateau zokors. Chin. J. Vector Biol. Control 4, 359–361.
Zhang, Y., and Liu, J. (2003). Effects of plateau zokors (Myospalax fontanierii) on plant community and soil in an alpine meadow. J. Mammal. 84, 644–651.
Zheng, S. (1980). Studies on the reproduction in the mole rat (Myospalax fontanieri). Acta Zool. Sin. 1, 465–477.
Zhou, J., Hua, L., Zuo, S., and Ji, W. (2013). Field evaluation of three types of radio transmitters in ecological study on plateau zokor Myospalax baileyi. Chin. J. Vector Biol. Control 24, 486–490.
Zhou, W., and Dou, F. (1990). Studies on activity and home range of plateau zokor. Acta Theriol. Sin. 10, 31–39.
Keywords: subterranean rodents, home range, dynamics, overlap, radio-telemetry
Citation: Zhou J, Ji C, Dong K, Chu B, Wang L and Hua L (2022) Dynamic changes in the home range of the subterranean rodent Myospalax baileyi. Front. Ecol. Evol. 10:1041322. doi: 10.3389/fevo.2022.1041322
Received: 10 September 2022; Accepted: 04 November 2022;
Published: 02 December 2022.
Edited by:
Wei Wanrong, China West Normal University, ChinaReviewed by:
Peng Pu, Lanzhou Jiaotong University, ChinaCopyright © 2022 Zhou, Ji, Dong, Chu, Wang and Hua. This is an open-access article distributed under the terms of the Creative Commons Attribution License (CC BY). The use, distribution or reproduction in other forums is permitted, provided the original author(s) and the copyright owner(s) are credited and that the original publication in this journal is cited, in accordance with accepted academic practice. No use, distribution or reproduction is permitted which does not comply with these terms.
*Correspondence: Limin Hua, aHVhbG1AZ3NhdS5lZHUuY24=
Disclaimer: All claims expressed in this article are solely those of the authors and do not necessarily represent those of their affiliated organizations, or those of the publisher, the editors and the reviewers. Any product that may be evaluated in this article or claim that may be made by its manufacturer is not guaranteed or endorsed by the publisher.
Research integrity at Frontiers
Learn more about the work of our research integrity team to safeguard the quality of each article we publish.