 Kurtis Edward Sobkowich
 Olaf Berke
 Theresa M. Bernardo
 David L. Pearl
 Paul Kozak2
- 1Department of Population Medicine, Ontario Veterinary College, University of Guelph, Guelph, ON, Canada
- 2Ministry of Agriculture, Food and Rural Affairs, Guelph, ON, Canada
Elevated colony losses have continued to be an issue for Canadian beekeepers for more than a decade. Numerous studies have identified unmanaged Apis mellifera colony infestation by the Varroa destructor mite as a main cause of the problem. V. destructor spread externally of the hive through a phoretic stage in their life cycle. Consequently, their movement outside the hive is influenced by honey bee flight behaviours, which can range to multiple kilometers from the originating hive in any direction. V. destructor are therefore of regional concern as neighboring colonies and yards share nearby forage which can serve as fomites. Additionally, mites can be transmitted through bee behaviours such as robbing and drifting, thus impacting surrounding colonies. Understanding the distribution of mites across a population is key for surveillance and equitable allocation of resources. Spatial patterns of V. destructor infestations in Southern Ontario, Canada, were investigated using a combination of cluster analysis, scan statistics, and geostatistical modelling, using 5 years of provincial apiary inspection data, from 2015 to 2019. A collection of disease clusters of V. destructor infestations was identified and found to be stable over multiple years with several other individual clusters occurring sporadically throughout Southern Ontario during the same study period. Universal kriging was applied to the V. destructor data in combination with regional colony density, and land use data as covariates, producing an isopleth map of the prevalence risk for V. destructor infestation. No substantial link between V. destructor infestation and environmental factors was found. This study highlights the need for more data and investigation to determine the cause of the identified clusters and areas of elevated risk. These results are hypothesis-generating but simultaneously provide information for government agencies, industry organizations, and beekeepers into the spatial distribution of V. destructor at a macro scale.
Introduction
Between 2015 and 2019, Ontario beekeepers reported an average overwinter colony loss of 30.5% (Canadian Association of Professional Apiculturalists, n.d.). Other Canadian provinces reported similarly high losses, with an average of 25.7% overwinter colony loss in 2019 across all 10 provinces. This amount of loss is beyond the accepted level of 5–15% (Vidal-Naquet, 2018). Elevated levels of colony loss have been experienced consistently since the Canadian Association of Professional Apiculturists (CAPA) began reporting on the issue of “colony collapse disorder” in 2007 (Canadian Association of Professional Apiculturalists, n.d.). Despite the high percentage of colony loss, beekeepers in Canada have managed to maintain a consistent population of colonies in the past 5 years (Agriculture and Agri-Food Canada, 2019). This paradox demonstrates the effectiveness of modern advancements in beekeeping, allowing for beekeepers to compensate continuing large losses through techniques such as colony splitting, and commercialization of queen and nucleus colonies, but the issue of long-term colony health still remains.
First reported in Canada in 1989 (McElheran, 1990), the parasitic mite, Varroa destructor, has continued to be one of the greatest threats to beekeeping in Canada and has spread to most beekeeping regions across the country (Currie et al., 2015). V. destructor (commonly, and henceforth, referred to as Varroa or Varroa mites) is a phoretic mite, which feeds on adult honey bees for survival, and acts as a parasite to honey bee larva during developmental stages (Rosenkranz et al., 2010). Varroa mites also serve as a vector for several viruses, including deformed wing virus, and black queen cell virus (Tentcheva et al., 2004). Clinically, the infestation of a honey bee colony by Varroa mites, and the associated symptoms, is referred to as varroosis. Varroosis has been found to be most detrimental when co-prevalent with other parasites and abiotic stressors (Roberts et al., 2017), but left untreated, is capable of decimating entire honey bee colonies. Varroa mites have been considered by numerous researchers as the greatest contributor to weakened colonies and overwinter colony losses (Guzmán-Novoa et al., 2010; Van Der Zee et al., 2015; Barroso-Arévalo, et al., 2019).
Varroa mites are an endemic and treatable issue in beekeeping in Canada and around the majority of the world. Therefore, the effects of an infestation can usually be mitigated when detected early. However, the presence of Varroa may go undetected due to sampling error or an absence of testing. If detected, chemical and non-chemical treatment options are available. Some chemical treatment regimens for Varroa may be detrimental to the colony’s health if administered incorrectly, though not all have been shown to have negative effects (Giovenazzo and Dubreuil, 2011). Varroa mites have also demonstrated resistance to various chemical treatment options due to improper administration or rotation (Rawn et al., 2019). Non-chemical treatment options against Varroa infestations exist but have been shown to be less effective at reducing Varroa load (Haber et al., 2019). Flaws in both Varroa detection and Varroa treatment could influence the regional Varroa abundance, as neighboring yards may contract Varroa as a result of bees robbing from a weakened colony possessing a high Varroa load (Peck and Seeley, 2019), or other means of transmission. Because no treatment is 100% effective, and the eradication of mites is not possible, integrated pest management (IPM) strategies are important to keep mite levels below critical thresholds. Adequate knowledge on the pest of interest and their distributions across the population is key for effective surveillance and IPM.
The phoretic nature of Varroa mites and the flight behaviour of honey bees, implies that the presence of Varroa is a landscape-wide issue and is not localized to single bee yard outbreaks unless geographically isolated. Increased Varroa load in a single yard may result in subsequent transmission to nearby colonies as Varroa is transmitted by means of robbing, drifting (if colonies within yards are not adequately spaced), or through fomites in the environment (Peck et al., 2016; Peck and Seeley, 2019). Therefore, regional population levels of Varroa should be considered when making management decisions. Insufficient Varroa detection and treatment suggest a need to switch from reactive to proactive population medicine for Varroa management, for which enhanced surveillance is necessary.
Geospatial epidemiological studies can address all aspects of the epidemiologic triad: agent, host, and environmental risk factors of disease (Berke, 2005). Clustering tendencies can indicate if the disease agent’s prevalence is spatially related, while the detection of clusters can give an indication of whether the host’s susceptibility and behaviours are influencing the distribution of disease. Furthermore, spatial regression and trend analysis can help identify which environmental risk factors may be contributing to the prevalence of the disease. This approach can therefore provide insight into all major aspects of Varroa distribution and spread mechanics at a population level. To date, few spatial epidemiological studies have investigated the prevalence of Varroa, and none have been identified in the literature for Ontario or Canada. In one geospatial study of varroosis in New Zealand, Stevenson et al. (2005) identified clusters of Varroa infestations, as well as a spatial dependence structure that decays over distance from an infected yard. Similar patterns may exist in Ontario and should be investigated.
Previous studies have explored the impacts of surrounding landscape on the health of managed honey bees, but found no association with Varroa (Dolezal et al., 2016). However, this study by Dolezal et al. (2016) investigated only two landscape categories: high cultivation and low/no cultivation. Further investigation into more landscape classifications is therefore warranted to confirm that this choice of binary classification is not suppressing a true association. Surrounding land-use may influence mite loads due to variations in diversity and quantity of available forage, as well as potential for mite transfer from feral bee colonies in natural landscapes or managed bees in higher colony density areas. The diet of honey bees has previously been linked to health issues such as immunocompetence (Alaux et al., 2010) and surrounding land-use type has been shown to impact the quantity and quality of forage and food accumulation, and bee health in general (Sponsler and Johnson, 2015; Dolezal et al., 2016). Landscapes with higher colony densities, could possess greater mite prevalence because of the increase in density of susceptible colonies for mite transfer to occur, a theory accepted in human epidemiology where population density is related to disease transmission (Tarwater and Martin, 2001), but not yet accepted in bee research.
Honey bee colonies surrounded by natural landscapes are more likely to forage on a more diverse diet and have access to ample food sources but simultaneously may interact more with feral colonies, potentially spreading and contracting mites more frequently. Bees located in heavily cultivated landscapes are less likely to interact with untreated feral colonies but have access to a less diverse diet and may spread mites between other managed colonies because of the increased density observed in areas of farmland in Ontario (Sobkowich et al., 2021). Various environmental stressors (e.g., pesticides found in areas of cultivated land) may also play a role in the susceptibility of a colony towards Varroa mites (Morfin et al., 2019). In locations where colonies exist beside a large body of water, the immediate foraging landscape is effectively reduced and may lead to less available forage resulting in a greater competition for nectar sources, which may contribute to mite spread due to shared forage or increased robbing (Peck et al., 2016; Peck and Seeley, 2019). In contrast, bees in an urban setting may experience similar issues of reduced forage quantity but may face less competition because of decreased colony density (Sobkowich et al., 2021). These scenarios are the justification for a five-category landscape classification system to be evaluated for an association with Varroa prevalence. These five landscape categories are: natural land, primary agricultural forage, secondary agricultural forage, urban/developed land, and water bodies (Table 1).

Table 1. Definitions and examples of the five land-usage categories considered.
Geostatistical kriging allows for spatial prediction of prevalence even in locations or areas where the sample size is otherwise too small. Kriging can be used to predict the prevalence over the entire study area which can inform policy decisions, aid in the efficient allocation of resources, and provide a basis for a risk-based sampling model for future inspections (Carrat and Valleron, 1992; Berke, 2004). Universal kriging is based on a spatial general linear model (GLM) to study the impact of potential risk factors, such as land-use types derived from satellite imagery (as applied in this study) in the presence of spatial dependence.
The goal of this study is to explore the spatial distribution of Varroa infestations in managed honey bee colonies of Southern Ontario, using a population-level epidemiologic approach, over a 5-year study period. This study has three main objectives to achieve this goal: (1) explore the spatial distribution of Varroa and the tendency for spatial clustering of varroosis cases; (2) locate high-risk clusters of varroosis; and (3) use geostatistical modelling to determine the effects of the five various land-use types on Varroa infestation to estimate and map the prevalence-risk.
Materials and methods
Data on Varroa destructor were received from the Ontario Ministry of Agriculture, Food and Rural Affairs (OMAFRA). The data were collected by trained inspectors. Inspections occur mainly for three reasons: regulatory inspections, confirmation of Varroa status of commercialized queens or nucleus colonies, or to address beekeeper concern of poor colony health. Varroa inspection data are based on the standard alcohol wash method (Dietemann et al., 2013) and reported as a total count per 300 bees. These counts were converted to a value of mites per 100 bees, referred to subsequently as the “Varroa rate.” Inspected colonies were recorded with their GPS location, date of inspection, and the observed Varroa rate. Geographic coordinates of yard locations were truncated down to two decimal places (approximately 1.11 km spatial resolution) to maintain the privacy of exact yard locations. The cleaned dataset contained 3,786 colony-level observations in Southern Ontario between 2015 and 2019. Regional colony density values were derived from OMAFRA registry data from the 2018 beekeeping season, aggregated by census consolidated subdivision (CCS; Statistics Canada, 2018) to maintain beekeeper privacy. The 2018 registry dataset was the most recent and complete at the time of analysis. Each inspection location was assigned a colony density value based on the CCS region that the inspection occurred within.
Land usage data were acquired from the Government of Canada, and the Agriculture and Agri-Food division, through their Annual Crop Inventory program (Government of Canada, 2020). The data were in raster file format, produced by optical and radar-based satellites. The raster file contained land use information at a spatial resolution of 30 m with a reported accuracy of 85%. Seventy-two distinct land-use types were used to define the provincial landscape of Ontario using optical and radar-based satellite imagery. These 72 categories were then aggregated into the 5 categories of interest for this study: natural land, developed land, primary agricultural forage, secondary agricultural forage, and water. Agricultural land was deemed as primary forage if included in the Pollinator Partnership Canada Guide for Planting Forage for Honeybees (Pollinator Partnership Canada, 2017). All other cultivated land types were deemed as secondary agricultural forage. A more detailed definition for each of the 5 land-use categories is presented in Table 1.
Spatial distribution of Varroa in Southern Ontario and determination of Varroa mite clustering
A sampled Varroa rate of greater than or equal to 3 mites per 100 bees was considered a case colony, as outlined by the OMAFRA treatment threshold guidelines (Kozak et al., 2021). Further reference to cases in this study is with respect to a colony found to have a Varroa rate at or above the threshold of 3 mites per 100 bees. Locations of cases and controls were plotted to a map of the province for data exploration.
As proposed by Diggle and Chetwynd (1991), the D-function was applied to assess spatial clustering of cases. Estimation of the D-function further provides an approximation for the spatial range at which clustering may be occurring. A confidence band derived from the standard errors was used to determine the presence of spatial clustering.
Detection of high-risk clusters of Varroa mite prevalence
Clusters of Varroa case locations were detected using the spatial scan statistic implemented in the SaTScan software (Kulldorff and Information Managemnet Services Inc., 2009). The scan statistic was applied for each of the 5 study years individually, and the results were then overlayed onto a map to check for temporal stability of Varroa case clusters across beekeeping seasons. The spatial scan analysis used the Bernoulli model (Kulldorff, 1997), with a purely spatial method to detect regions of high rates. A circular scanning window was used, with a maximum cluster size of 20% of the population at risk. A maximum of 20% was used in place of the standard 50% maximum to uphold biological relevance, owing to the scale of the study area (the distribution of colonies) in relation to the typical movement and flight ranges of bees. This reduced maximum cluster size has been used previously by researchers looking to account for low levels of data, spatial discontinuity or to look specifically for smaller clusters (Ma et al., 2016). The standard Monte-Carlo method, with 999 replications, was used as a means to estimate the value of p for detected clusters. All non-overlapping clusters identified at a 5% significance level were highlighted on a map of Southern Ontario. The 95% confidence intervals of the standardized morbidity ratios were estimated using the Vandenbroucke method (Vandenbroucke, 1982).
Spatial regression modelling of Varroa prevalence using environmental covariates
For spatial regression modelling, the Ontario land use data were merged with the Varroa rate data using a buffer analysis in QGIS software (QGIS Development Team, 2020). A Lambert azimuthal equal-area projection was applied to preserve the study’s area size and minimize distance distortions. The locations of bee yards inspected for Varroa from all five study years were used as centroids for a buffer analysis. Buffers with a 3 km radius approximating the average foraging range of honey bees around their hives (Visscher and Seeley, 1982; Pollinator Partnership Canada, 2017) were used to link the land-use raster data to the inspection data. A summary of the percentage of each of the five land use categories within each buffer was calculated and merged with the Varroa inspection data. The five land use categories and regional colony density values were considered as covariates in the model building process. For spatial modelling, counts of the number of mites for each inspection were used (mites per 100 bees sampled). Repeat inspection observations at the same geographical location were addressed by averaging the counts.
The generalized linear model component of regression-kriging was fit by comparing the results of regression models for each covariate. A Gaussian family GLM model was used to model the continuous Varroa rate, and an iteratively reweighted least squares approach was used to fit the GLM model. The Akaike information criterium (AIC) from each regression model was used as an indication of greatest model fit. Simple and multiple regression models were considered using the land-use types, and colony density as covariates. The covariate(s) with the lowest AIC value was selected. This model would then be put forward in the regression-kriging model building process. Because this study is hypothesis generating, p-values were considered as exploratory metrics only (Matthews et al., 2017). Estimated regression coefficients (β) for the simple regression models with their 95% Wald confidence intervals were presented in a forest plot to visualize the magnitude and direction of their potential effect on Varroa prevalence.
Universal (regression) kriging is a two-part process which combines a generalized regression model of the dependent variable with kriging interpolation of the residuals over a geographic area. The regression model, to estimate the influence of an independent variable(s), is fit first using ordinary least squares, then the covariance function of the residuals is used to derive generalized least squares coefficients from which the residuals can be re-estimated iteratively (Hengl et al., 2007). The variogram is then modelled for the residuals and kriging is performed to predict the regression model residuals over the study area. The predicted residuals are then combined with the regression output, using a spatially continuous raster of the independent variable(s), to produce a continuous prediction of the Varroa rate. Residuals from the final selected GLM model were obtained and the corresponding variogram of residuals was estimated through weighted least squares estimation (WLSE) using initial nugget, sill, and range parameters from visual inspection of the empirical variogram. A spherical variogram model was used to represent the GLM residual variogram. Following the fit of the regression model, and variogram model, universal kriging was applied to predict the prevalence of Varroa mites onto a grid covering the entire study area for mapping.
All analyses, unless otherwise stated, were performed using the open-source software R (R Core Team, 2020). The package “gstat: Spatial and Spatio-Temporal Geostatistical Modelling, Prediction and Simulation” was used to perform kriging (Pebesma, 2004; Gräler and Pebesma, 2016).
Results
A total of 3,786 observations were collected over the 5-year study period from 2015 to 2019 at 1,082 unique locations. The annual number of observations declined from 1,030 in 2015, to a total of 939, 757, 551, and 509 inspections conducted in 2016 to 2019, respectively. The observed annual prevalence of V. destructor cases (≥ 3 mites per 100 bees) varied during the 5-year study period around an average of 13.6% of colonies sampled. From 2015 to 2019, the prevalence estimates of Varroa cases in Ontario were 21.1% (95% CI [18.6, 23.7%]), 8.9% (95% CI [7.2, 11.0%]), 16.3% (95% CI [13.7, 19.1%]), 4.2% (95% CI [2.7, 6.2%]) and 15.2% (95% CI [12.1, 18.5%]) respectively. 95% confidence intervals were derived using Z-scores and the observed mean and standard deviation. Complete descriptive statistics of the dependent and independent variables used in regression modelling is presented in Table 2.

Table 2. Descriptive statistics of the dependent and independent variables used.
Spatial distribution of Varroa in Southern Ontario and determination of Varroa mite clustering
Producing a point map of the locations of cases (colonies infected by ≥3 mites per 100 bees) and controls illustrates that the locations of inspections in Southern Ontario during the study period are geographically diverse. Furthermore, sample sites are representative of the provincial colony density, with a greater apparent number of inspections in the Niagara Peninsula and fewer observations in the northeast. Cases appear to be present across the entire study area (Figure 1).
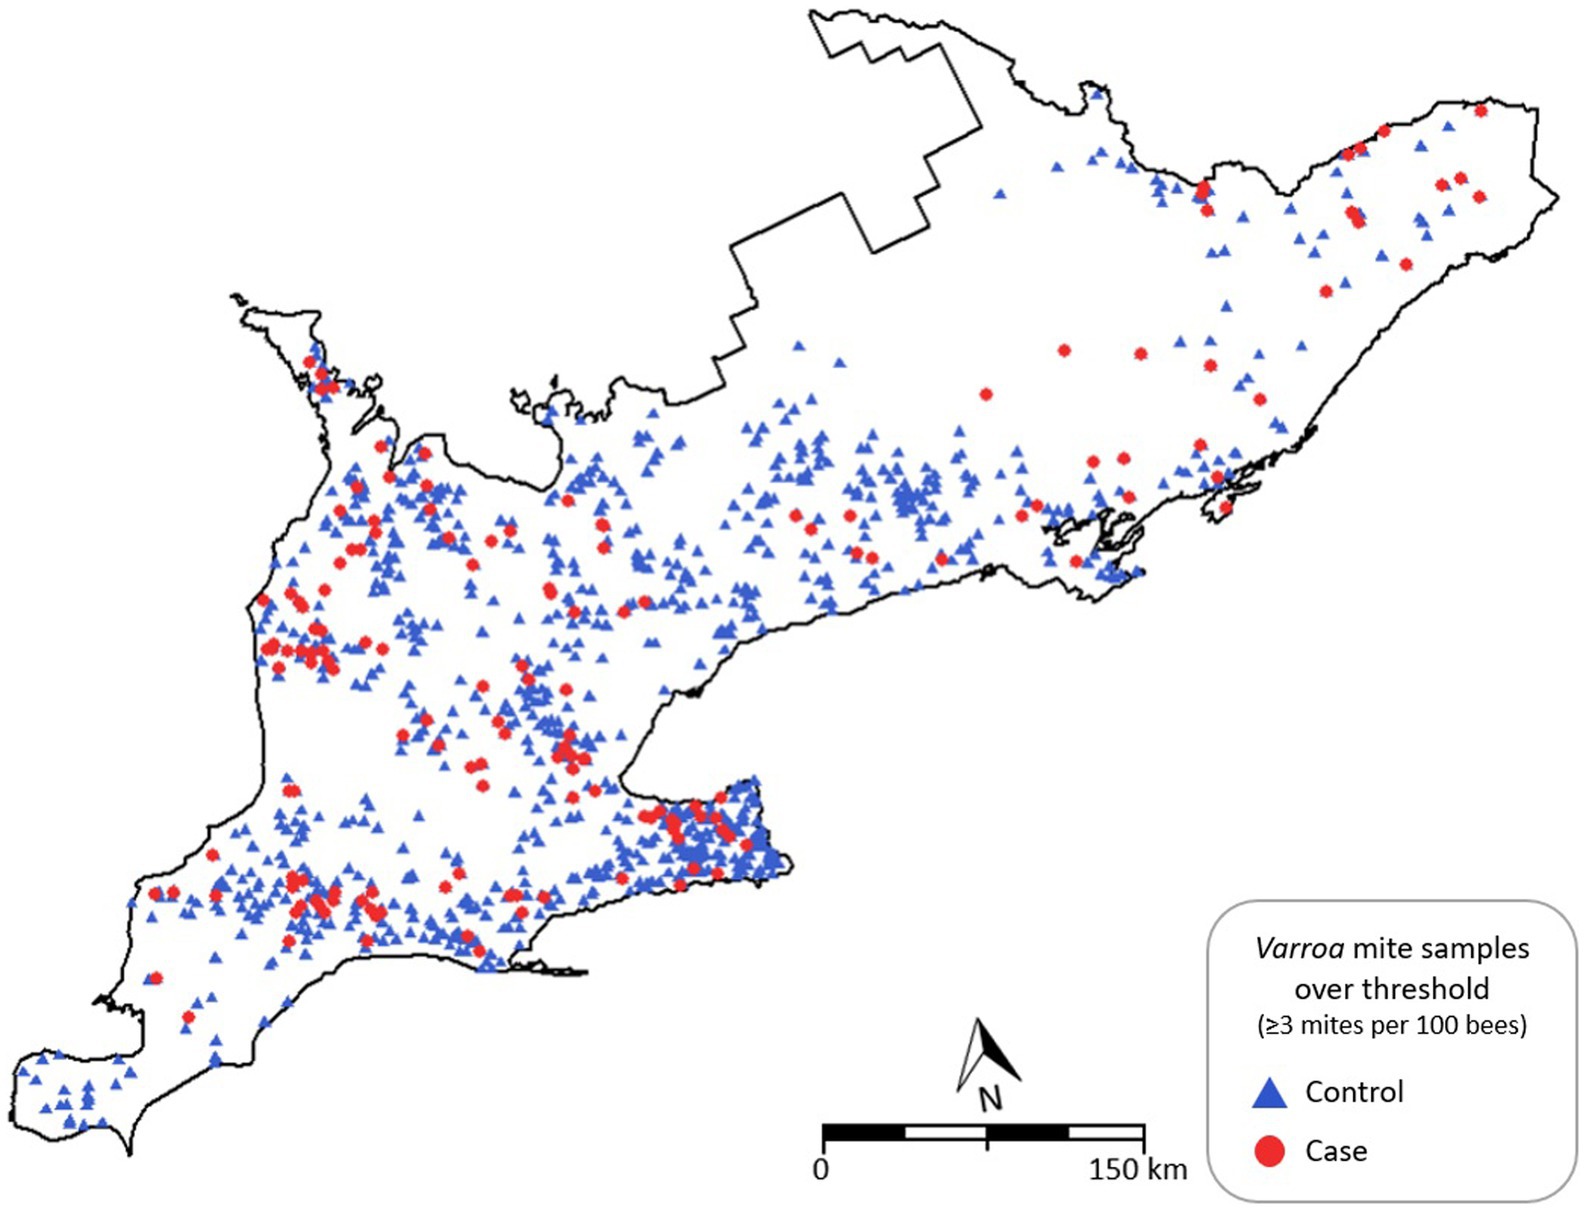
Figure 1. Point map of Southern Ontario indicating Varroa destructor counts above threshold (≥3 mites per 100 bees) as cases in red circles and controls in blue triangles, 2015–2019.
Plots of the D-function for each of the study years, and the entire study period combined, indicate the presence of spatial clustering of cases, as illustrated by crossing the 95% confidence limit (Figure 2). The distance at which spatial clustering was detected is not consistent over the study period, with 2015 demonstrating the largest range of clustering at approximately 100 km. Subsequent years to 2015 demonstrated noticeably lesser degrees of spatial clustering with 2018 indicating negligible amounts of clustering present. The 2016, 2017, and 2019 years of data all showed relatively equal results of clustering at an approximate range of 10 km. When the data from the 5-year study period were combined, spatial clustering of Varroa cases was detected by the D-function at a range of approximately 25 km (Figure 2).
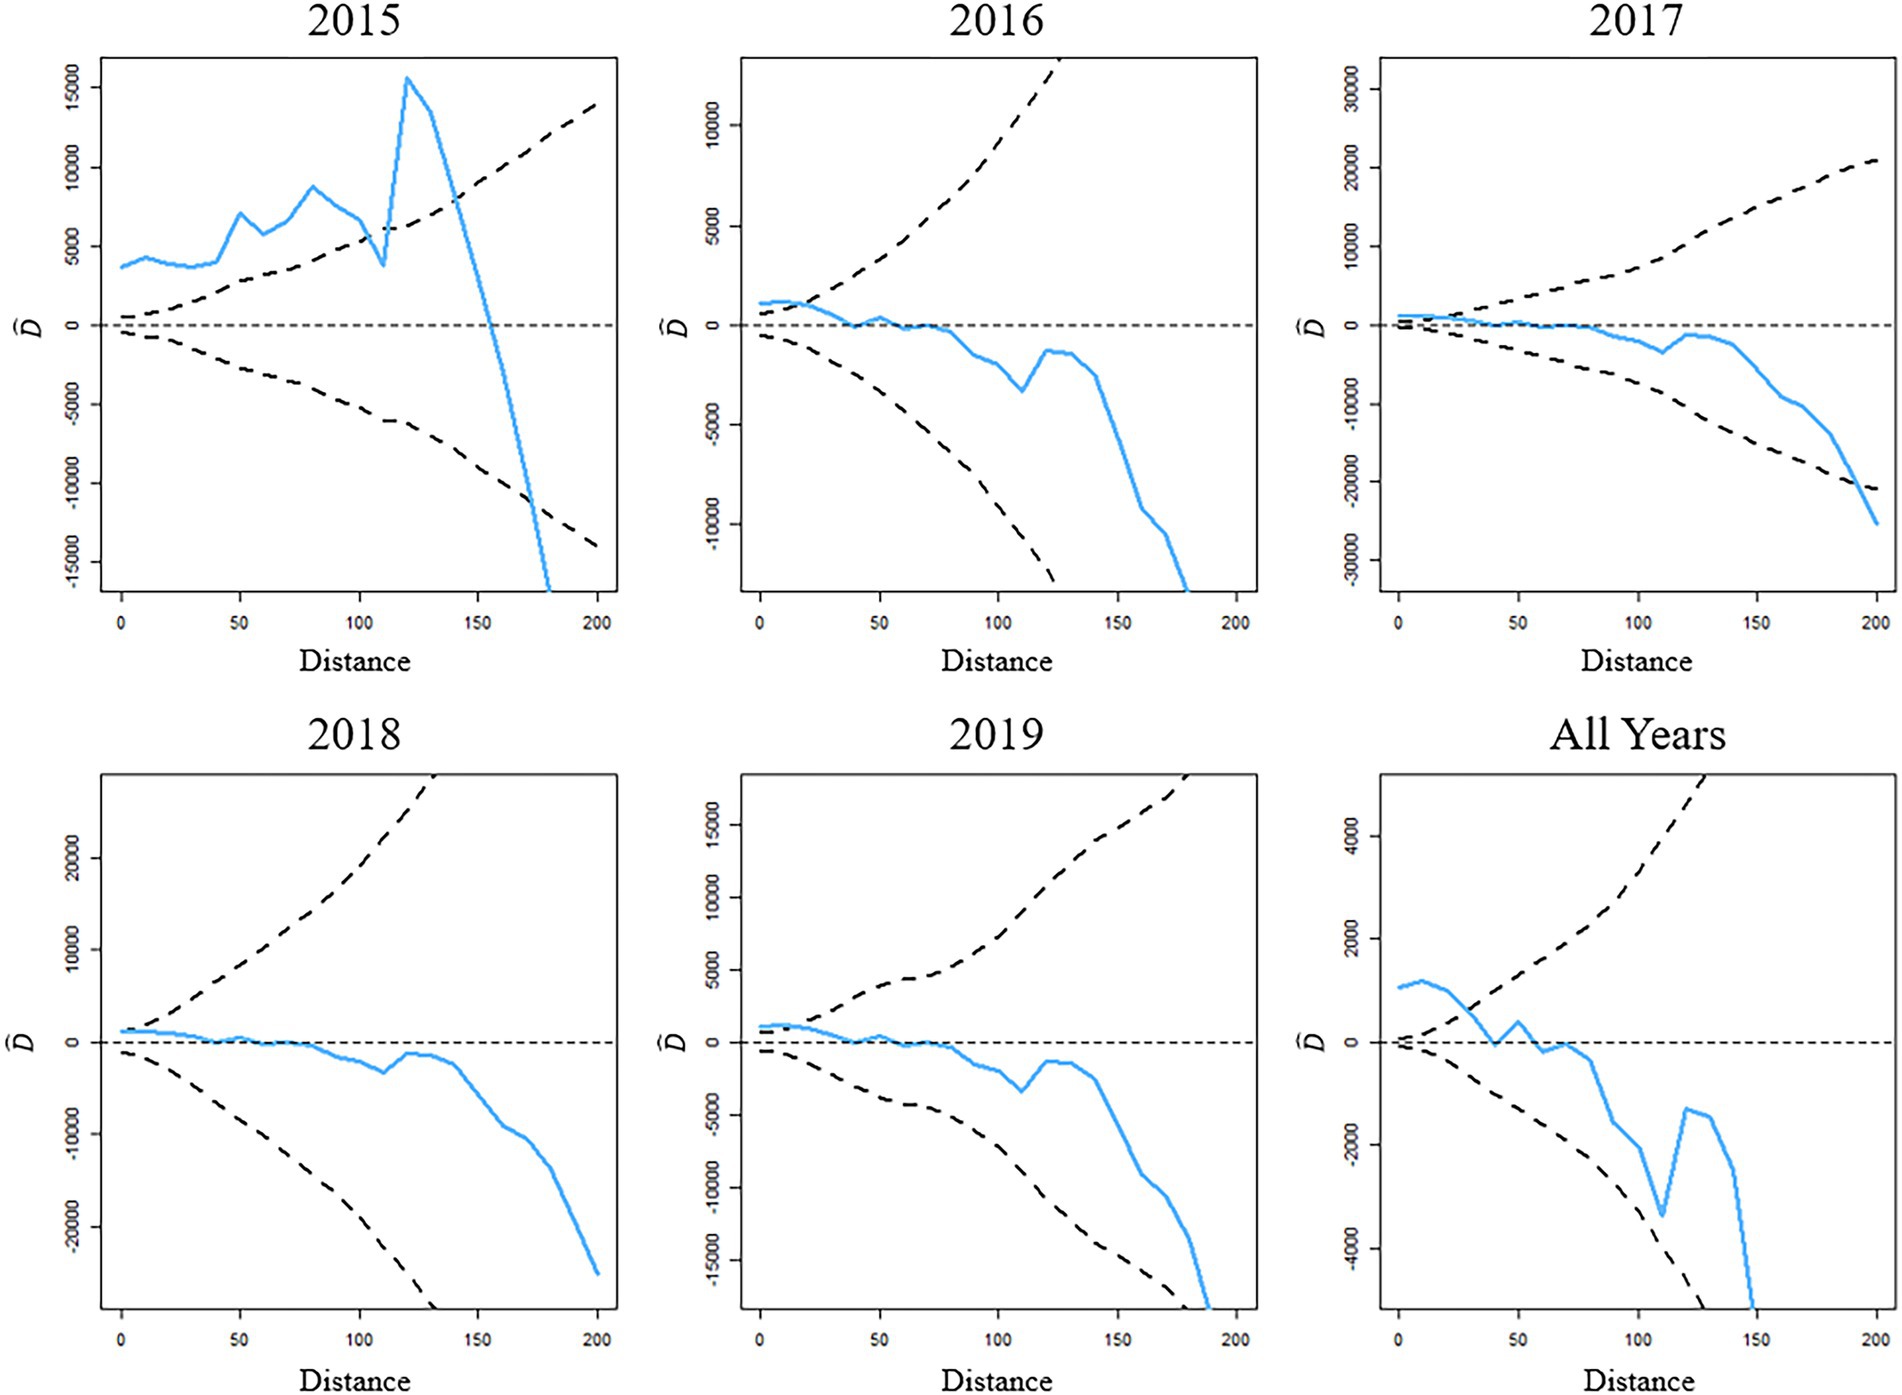
Figure 2. D-Functions for inspected colony locations in Southern Ontario with V. destructor counts equaling or exceeding 3 mites per 100 bees for each of the study years and the 5-year study period combined. Upper and lower 95% confidence limits derived from MCMC are indicated by the dotted lines.
Detection of high-risk clusters of Varroa mite prevalence
At least one and up to three spatial clusters of Varroa cases were detected for each year in the study period (Table 3).
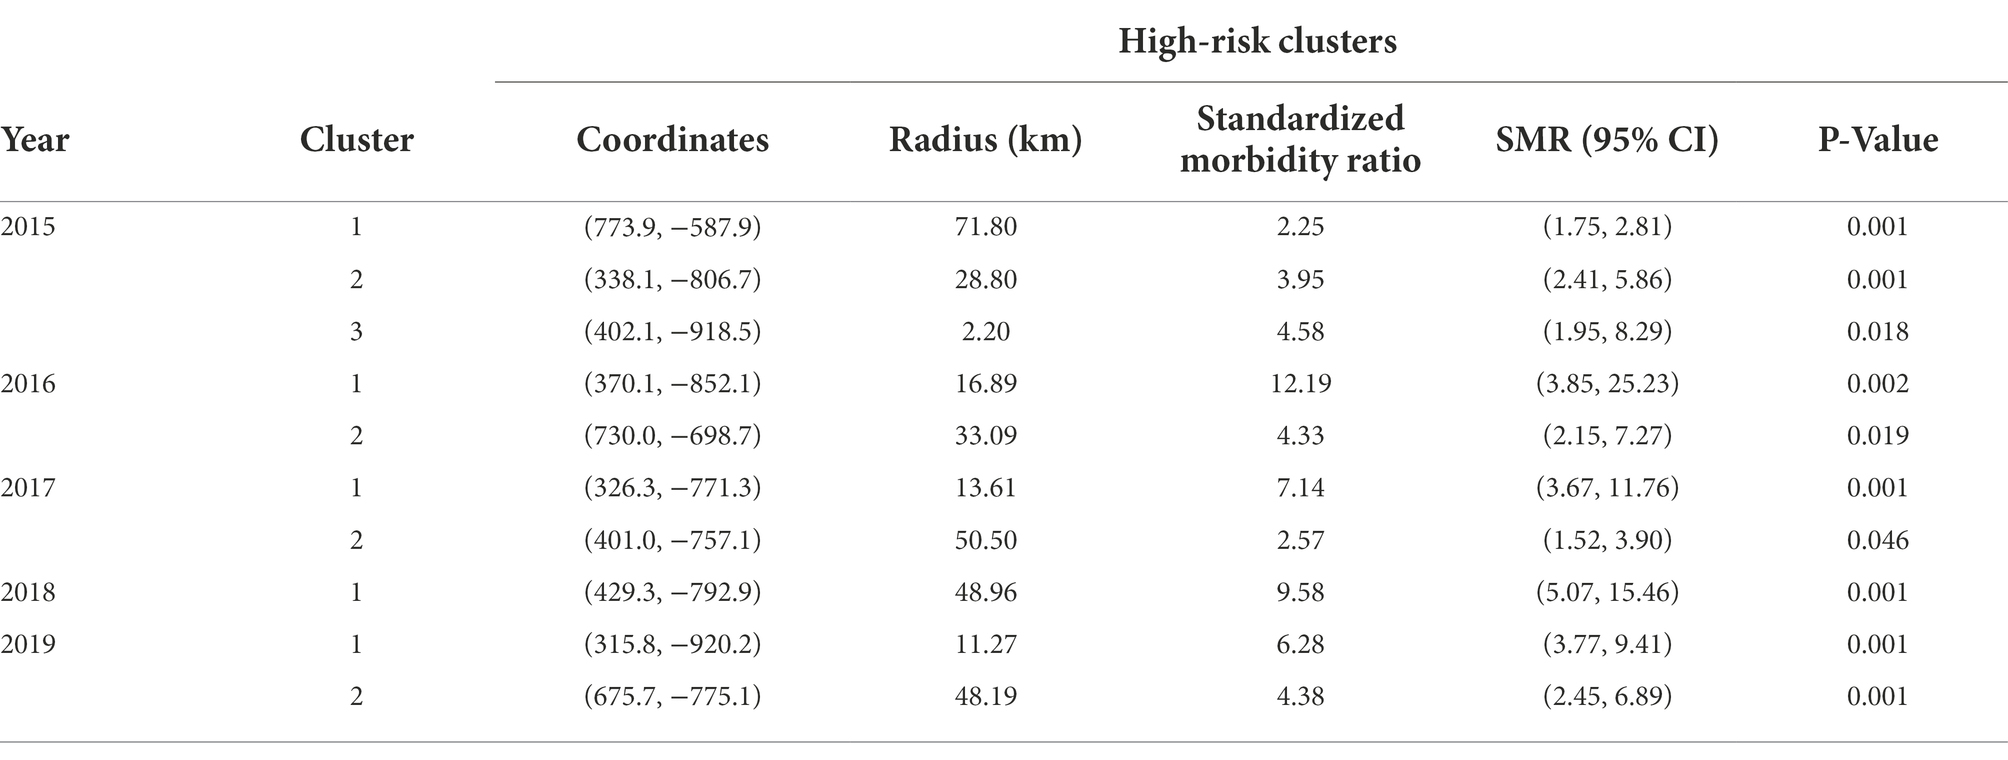
Table 3. Results from spatial scan analysis for clusters of high-risk of Varroa destructor cases in Southern Ontario (2015–2019).
Figure 3 shows the locations of high-risk clusters detected in each year of the study period combined to a single map of the province. The map gives an indication of a temporal stability of clusters in the northwestern quadrant of Southern Ontario, with some satellite clusters occurring sporadically elsewhere throughout the study area. All observed clusters presented a standardized morbidity ratio (SMR) of greater than 2 with a maximum observed SMR of 12.19 (95% CI: 3.85, 25.23; Table 3).
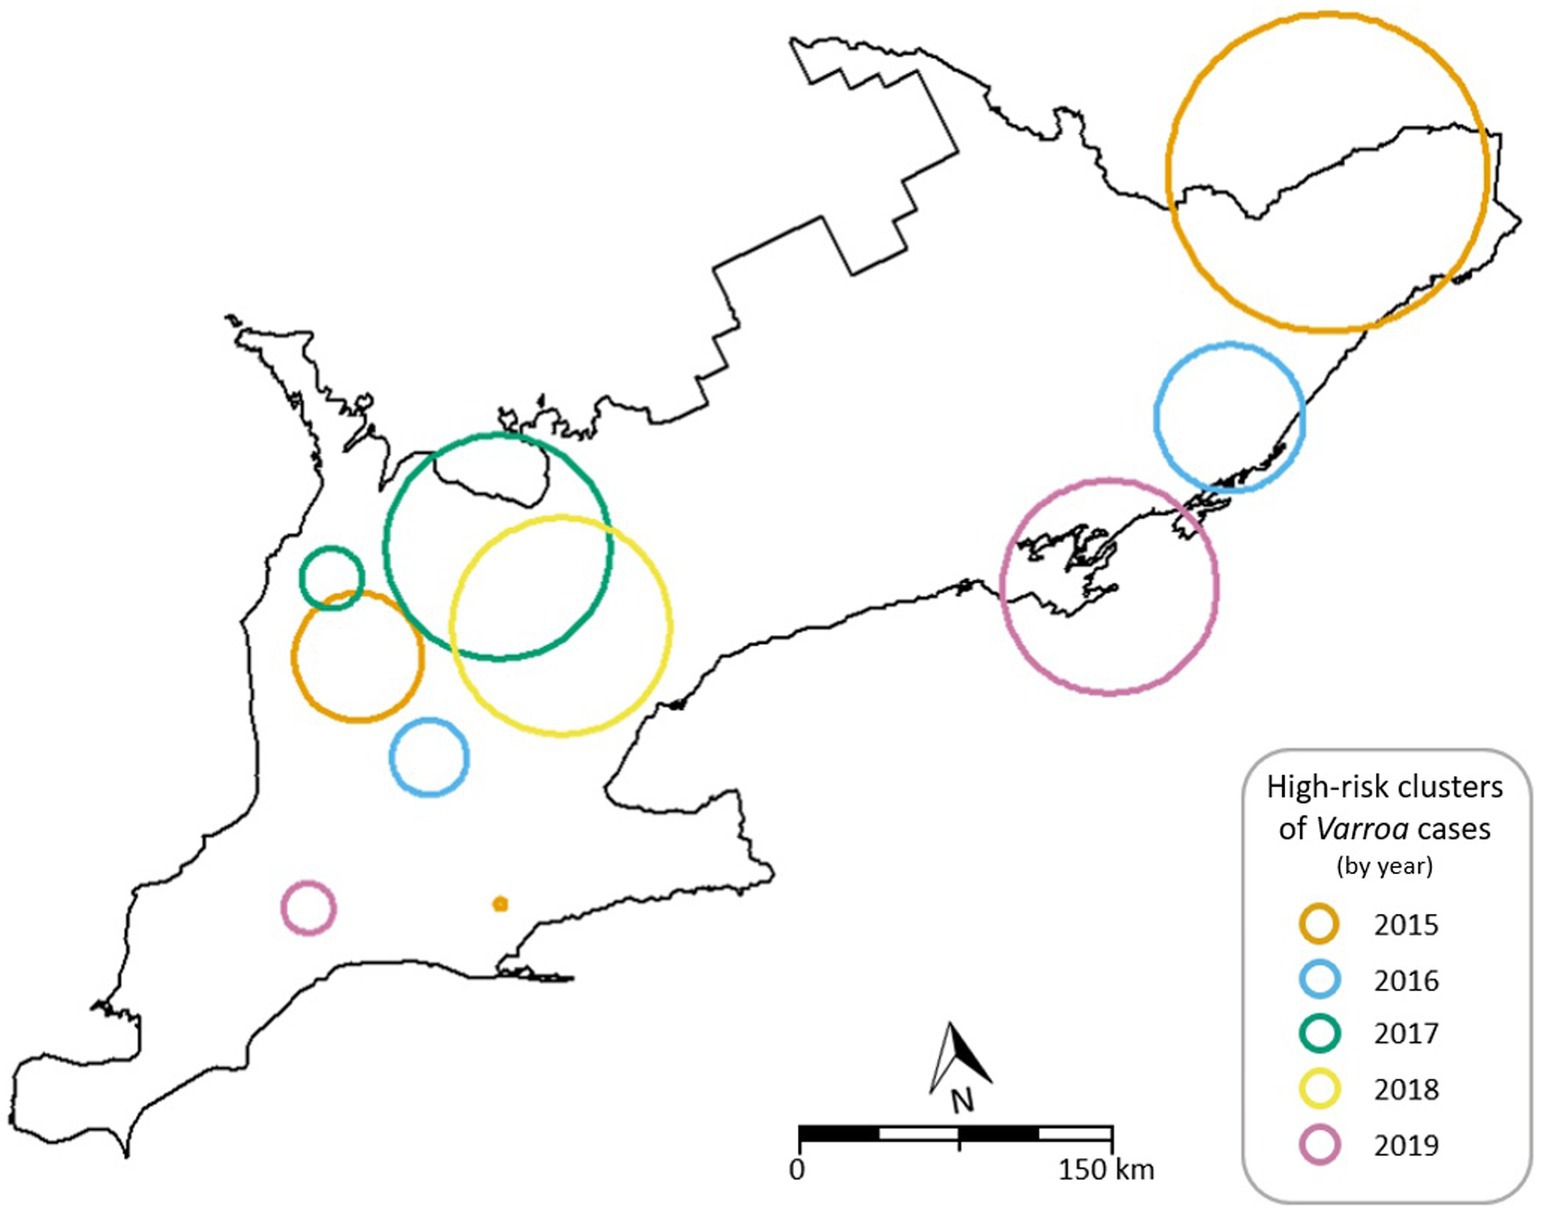
Figure 3. Map of the detected high-risk clusters of V. destructor cases by year in Southern Ontario using the spatial scan statistic.
Spatial regression modelling of Varroa prevalence using environmental covariates
For regression modelling, the annual data were aggregated over time. Preliminary simple GLMs indicated no evidence of an association between Varroa rate and any of the five land-use types. The estimated regression coefficients (β) for the 5 land-use variables all possessed large confidence intervals at the 95% level, and p-values larger than 0.5. Regional colony density provided minimal evidence for a small negative association, with an estimated regression coefficient of β = −0.05 (95% CI: −0.11, 0.01, p = 0.09), indicating a decrease in Varroa rate by 0.05 for an increase of 1 colony per square kilometer. The degree of northing also indicated some evidence for a positive association with Varroa rate [β = 1.5; 95% CI: (−0.23, 3.23); p = 0.09] but sufficient evidence of an association was not found for easting, indicating little evidence of a large-scale spatial trend across the study area. A forest plot of the results from the preliminary simple regression models is presented in Figure 4. The model with regional colony density as the sole independent covariate produced the lowest AIC and was put forward in the regression kriging process. Multiple regression modelling, by backwards model selection, did not result in a better fitting model.
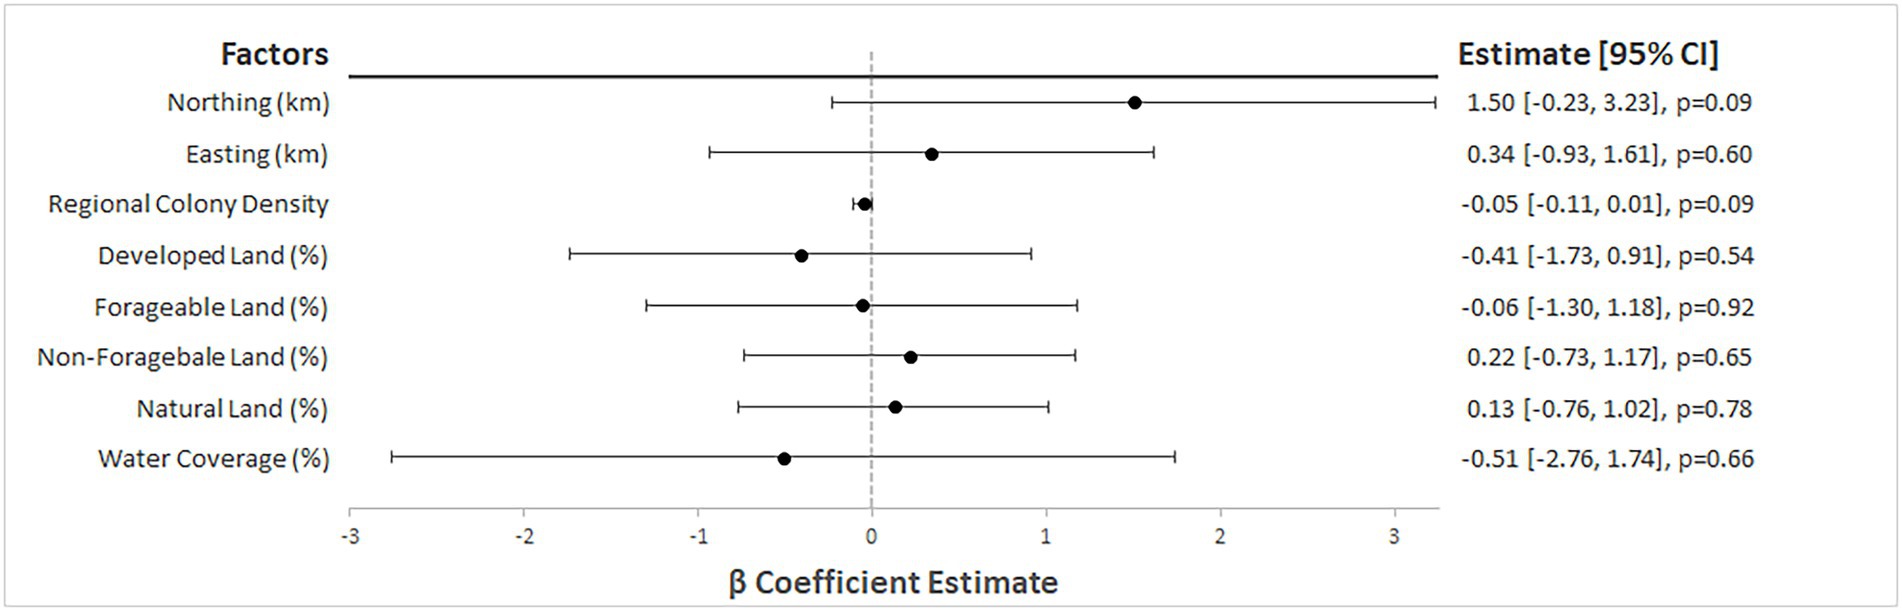
Figure 4. Forest plot of estimated beta coefficients from preliminary simple linear modelling of V. destructor rate in Southern Ontario managed honey bee colonies (2015–2019).
The variogram estimated from the final GLM model residuals is presented in Figure 5. A spherical variogram model with parameters: nugget = 2.98, partial sill = 4.17, and range = 27.58 km sufficiently represents the spatial correlation structure of the residuals of the GLM model (Figure 5).
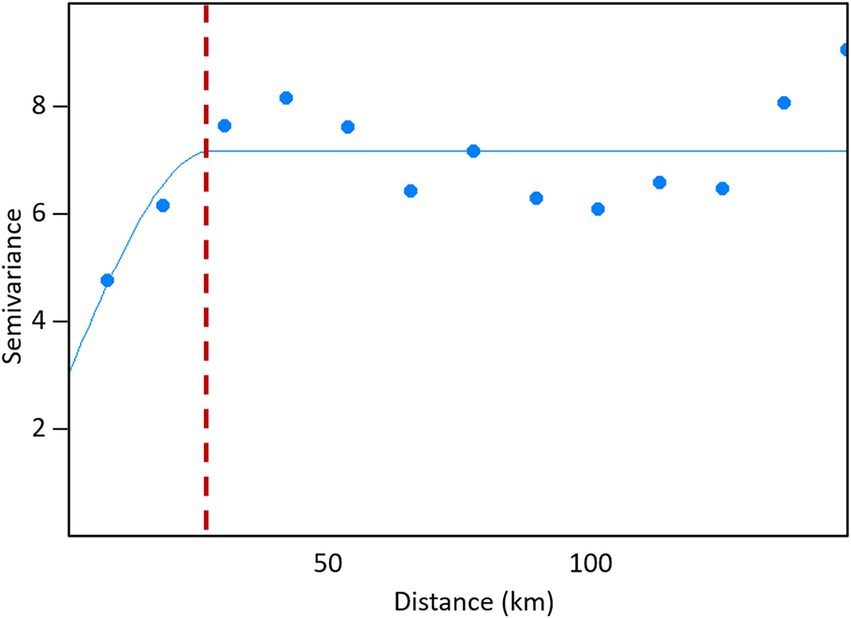
Figure 5. Variogram of generalized linear model residuals (points), with spherical variogram model (solid blue line) and spatial correlation range (red dashed line) for sampled rates of V. destructor mites in managed honey bee colonies in Southern Ontario (2015–2019).
The predicted values of the Varroa rate derived from the spatial regression model ranged from 0 to 15.9 (μ: 0.11), compared to the observed Varroa prevalence range of 0 to 51 (μ: 0.86). Model fit was assessed using leave-one-out cross-validation; no evidence for lack of fit was indicated by the histogram of residuals or map of residuals. The RMSE = 2.7 appears large compared to the Varroa prevalence but this is an effect of a few outliers (MAE = 0.007). Predicted values from the model for the whole study area are presented as an isopleth map in Figure 6. The map indicates a heterogenous spread of Varroa across the study area with several areas of increased risk. The locations with the greatest estimated risk both reside in the mid-north-east region of Southern Ontario near the municipalities of Peterborough and Bancroft. Several other areas across the study area showed high Varroa rates compared to their surroundings. Most of Southern Ontario was predicted to have an overall low rate of Varroa mites (Figure 6).
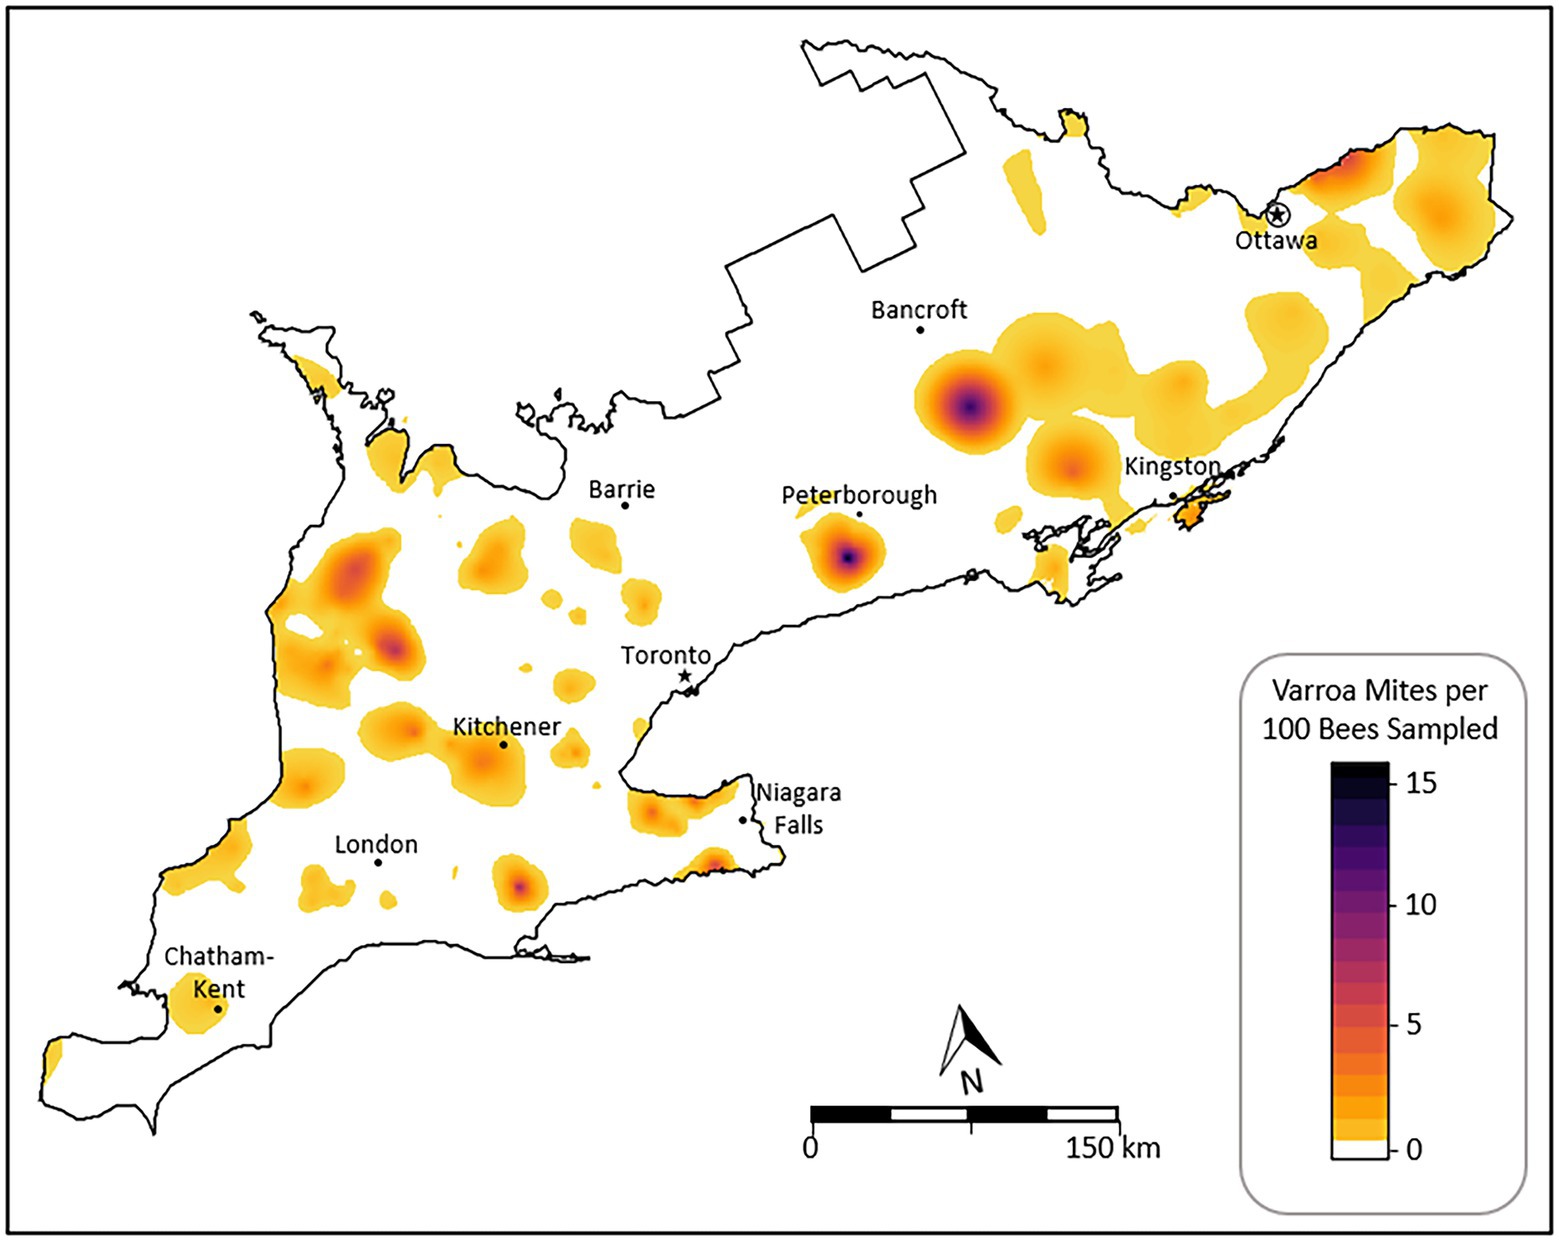
Figure 6. Isopleth map of predicted V. destructor rates for Southern Ontario derived from spatial regression modelling.
Discussion
This is the first study to comprehensively assess the spatial distribution of Varroa destructor in managed Ontario bee colonies at a population level. This study provides insight into all three aspects of the epidemiological triad: host, agent, and environmental risk factors for Varroa prevalence.
Spatial clustering of Varroa infestations were detected using the D-function (case–control data) and similarly through the estimation of the variogram (Varroa count data). Both methods presented results of clustering occurring up to a range of around 25 km. In this context, clustering is indicative of the geographic extent to which Varroa mites are communicated between colonies of bees, be it through natural contact and exchange during foraging or through the relocation of colonies throughout the season. The nature of mite exchange was not identified in this study.
The distance at which clustering was observed in individual years varied noticeably, ranging from 100 km in 2015 to 10 km in 2016, 2017, and 2019. Only in 2018 was no spatial clustering observed. This discrepancy might be attributed to small sample sizes, or low Varroa case prevalence observed in 2018 (4.2%) compared to the 5-year average case prevalence (13.6%). Without an adequate representation of both cases and controls, in terms of numbers and spatial sampling intensity, there may be a lack of power to detect spatial clustering. When all inspection data were aggregated over the five-year study, effectively increasing the sample size and spatial representation of cases and controls, the D-function provided evidence of spatial clustering upwards of 25 km (Figure 2). According to the geospatial epidemiologic triad, clustering can be thought of as a representation of agent factors, and the agent’s tendency to spread within localized areas, which is common for infectious diseases. Varroa mites are communicable between bees through the environment and within yards (Rosenkranz et al., 2010). This passing of mites between colonies is limited by the foraging range of the honey bees, and the number of contacts (with other bees, or colonies) in the vicinity of an infested colony (Rosenkranz et al., 2010), and thus spatial clustering might occur in a semi-localized range, as observed of around 25 km. While a single bee may have a limited flight radius of up to 10 km (Beekman and Ratnieks, 2000), mites may be passed along a chain of colonies to reach further distances during the year. Furthermore, colonies and equipment may be moved even further distances during the beekeeping season, extending the possible range of transmission.
This finding of spatial clustering of Varroa mite infestations offers the basis for a Varroa notification system where beekeepers could be notified if elevated mite levels are detected in the immediate vicinity of their colonies (25 km). Thus, allowing for more intensive monitoring of their colonies to detect an increase in mite load early, and allow for risks to be mitigated to prevent further spread and colony weakening.
Several high-risk clusters were identified in this study for all years studied. All but 3 of the 10 observed clusters were found to have a SMR with a lower 95% confidence limit of greater than 2, indicating at least a doubling of the rate of Varroa cases than expected. The specific locations of these clusters varied from year to year, but recurring patterns were seen as well. Most notable was the reoccurrence of clusters of cases in the northwestern quadrant of Southern Ontario for 4 of the 5 years studied (Figure 3). This grouping of observed clusters covers a large area but provides evidence to suggest that there is temporal stability of Varroa clusters in this region. This region possesses one of the higher honey bee colony densities in Ontario (Sobkowich et al., 2021) which could explain the higher-than-expected rates of Varroa, as population density has been suggested to play a role in Varroa transmission (Rosenkranz et al., 2010). An increase in regional colony density would inherently result in an increase of susceptible colonies and an increased occurrence of robbing, drifting, and other intra-colony bee interaction events which have all been suggested as viable means of mite transmission (Peck et al., 2016; Peck and Seeley, 2019; Kulhanek et al., 2021). However, conflicting to this is the lack of observed clusters in the Niagara peninsula (southeastern most region of Southern Ontario), which possesses the highest colony density in the province (Sobkowich et al., 2021).
No clusters of Varroa infested colonies were identified in the Niagara region in the 5 study years, which could provide evidence against the hypothesis linking population density to Varroa prevalence. Similarly, the regression analysis showed a mild negative correlation between Varroa rate and colony density, which is contrary to what would be expected in support of this hypothesis. However, the colony density values used are based upon self-reports from colony registration and therefore may be representative of stationary colonies or overwinter locations but not the locations in which colonies spend the majority of the season.
Potential bias might exist since a large proportion of honey bee colonies in Niagara belong to large-scale commercial operations, offering mobile pollination services to other provinces throughout the beekeeping season. Colonies are screened for Varroa before being moved for pollination services, and therefore there may be an inflation of low Varroa count observations, and a simultaneous overestimation of colony density, as commercial operations treat their colonies before the inspection to ensure a satisfactory result for travel. This is largely but not always the case. Additionally, blueberry pollination in Eastern Canada, occurring each spring is a large draw for commercial beekeepers in Ontario offering pollination services. Given the known population dynamics of Varroa mites, screening for mites in the spring is likely to produce a bias towards low counts (Fanelli and Tizzani, 2020). Many beekeepers intending to mobilize their bees in the spring may choose to operate in Niagara due to the more southern location to build colony strength earlier in the season compared to cooler climates elsewhere. Therefore, the hypothesis of a relationship between Varroa prevalence and colony density cannot be rejected considering the nature of the current data (i.e., based on registration locations rather than foraging locations of colonies).
Natural land had been hypothesized to increase the odds of varroosis due to transmission of mites from feral colonies (Peck et al., 2016), but was not found to be associated with Varroa rate in the regression analysis. Chemurot et al. (2016), in Uganda, proposed a relationship between colony placement in farmland and Varroa prevalence which was also not observed in the current study. None of the land-use covariates examined in this study showed sufficient evidence of an association with Varroa rate, suggesting that other factors have stronger effects on Varroa prevalence such as beekeeping management practices, including control measures, abiotic factors that fluctuate over time such as weather, or biotic factors such as mite and bee behaviours. Time-dependent factors, such as temperature or precipitation, were not accounted for in this analysis but may lend themselves well to time-series modelling approaches.
The isopleth map of Varroa rates (Figure 6) illustrates an overall low rate for Southern Ontario with sporadic high-rate areas throughout the province. Notably, the high-rate area south of Bancroft (Figure 6) exists in an area of low sampling as seen in Figure 1 and therefore may be an overprediction of the true rate. The North-western quadrant of the study area exhibited several clusters over the 5-year study period (Figure 2) when using varroosis case locations based on the 3-mite threshold. This pattern is similarly illustrated by the kriged map where the Varroa rate is shown to be greater overall compared to the rest of the study area (Figure 6). In the region south of Peterborough, a high rate was estimated by spatial modelling, which contrasts to the findings seen through cluster detection as no cluster of varroosis cases were observed in this area. This contradiction is likely the result of a repeat of high Varroa count samples each year, but not multiple high Varroa count samples in a single given season. Furthermore, the difference in the data structure used in this study (i.e., binary case and control data used for cluster detection and Varroa rates for spatial modelling) could have led to differences in data analysis results. This problem has been termed the modifiable areal unit problem and is a common source of bias in geostatistical studies such as the present work (Waller and Gotway, 2004).
Studies such as this are reliant on large sample sizes, accurately recorded, and serving as a representative sample for the target population. Inspections are not truly random samples and may be biased in some cases towards beekeepers with higher Varroa loads or beekeepers better skilled at treating for pests and diseases (i.e., commercial operations). In cases where an inspection is requested by the beekeeper to address recent issues with their colonies, there is a greater likelihood that Varroa may be present, as Varroa is recognized as a common pest and is responsible for colony weakening and reduced hive activity (Barroso-Arévalo et al., 2019). On the other hand, in cases that an inspection was requested for the purpose of verifying the disease-free status of colonies to be sold as queens and nuclei, there may be a bias towards lower levels of Varroa. Routine apiary inspections also occur and are expected to be more representative of the true population but are still prone to sampling and measurement bias. The reason for colony inspection was not explored in the present work but should be explored in future studies.
A limitation of this study is inconsistent sampling locations from year to year. In order to sample Ontario beekeepers representatively, inspections cannot be guaranteed to occur in the same geographical locations every year. For this reason, one region may be over-sampled one year and under-sampled in the next as inspectors may choose to group inspections by proximity. This limitation was the primary reason for the decision to treat the annual data as a whole during geospatial modelling rather than 5 distinct years. This also suggests that there may be years where a high-risk cluster exists but is not detected, since sufficient repeat sampling did not occur in that region over the year. This could explain the absence of clusters in the Peterborough region despite a high predicted risk through modelling. The supposed grouping of inspections may also explain some of the clusters observed in this study, but the consistency and significance of clusters observed over 5 years suggest that a true effect may be in place. Further studies could address this limitation through the use of a continuous cohort of colonies spread across the study area, rather than the repeated cross-sectional sampling approach used in this study. Furthermore, there are various predispositions and factors related to mite infestations that were not able to be assessed, including: biological controls (e.g., brood removal to limit opportunities for mite reproduction), cultural controls (e.g., beekeeper selection towards hygienic queens and stocks), and chemical controls (e.g., administration of Varroa control treatments). Data regarding these various factors was not available for this study but all would be expected to influence mite counts (Harbo and Harris, 2009; Rosenkranz et al., 2010; Vidal-Naquet, 2018). However, this study focused on population level and environmental factors and therefore the omission of these factors is deemed acceptable, under the assumption that they are spatially independent. Future studies may want to consider these factors if collecting primary data.
With advancements in communications and the low cost and absence of necessary technical tools to sample bees for Varroa mites, the collection of these data lends itself well to a citizen science approach (Thomas-Bachli et al., 2020; Khayli et al., 2021). With the implementation of citizen science and self-reported Varroa mite counts by beekeepers, agencies can achieve a greater number of observations per year, and cover a greater spatial area, without the need to increase inspector resources. Furthermore, this approach frees up inspectors to allow for more strategic sampling and respond to inspection requests from operations experiencing difficulties. Skepticism exists around the quality of self-reported data, but evidence exists to suggest that citizen science approaches can produce data that are equal to or greater than the quality obtained by professionals (dependent on the difficulty of data collection, upon other factors; Kosmala et al., 2016).
This study provides evidence for temporally stable clusters of varroosis throughout Southern Ontario, which were not explained sufficiently by the environmental factors considered in this study but suggest that there are environmental (i.e., meteorological) and management influences at play. A spatial clustering effect was also observed, suggestive of the transmission patterns of Varroa mites and the influence that neighbouring yards have on each other’s mite counts. The results of this study provide a launch point to further assess the spatial patterns of Varroa identified. Intervention efforts should focus on areas of Southern Ontario exhibiting clusters of excess Varroa, and especially the regions in the northwest, where clusters appear over multiple years. The predicted risk map identifies areas where Varroa is likely to exist at elevated levels and therefore highlights the need for more data and investigation to identify the cause of these increased Varroa rates. It is recommended that inspections and intervention programs focus their efforts on these areas, while citizen science efforts could provide data elsewhere in the province, resulting in an enhanced province wide Varroa surveillance system.
Data availability statement
The data analyzed in this study is subject to the following licenses/restrictions: Data sharing agreement does not permit the sharing of these data. Requests to access these datasets should be directed to PK, cGF1bC5rb3pha0BvbnRhcmlvLmNh.
Author contributions
KS and OB: study conception and design, analysis and interpretation of results. PK: data collection. KS, OB, TB, DP, and PK: draft manuscript preparation. All authors reviewed the results, contributed to the article, and approved the submitted version.
Conflict of interest
The authors declare that the research was conducted in the absence of any commercial or financial relationships that could be construed as a potential conflict of interest.
Publisher’s note
All claims expressed in this article are solely those of the authors and do not necessarily represent those of their affiliated organizations, or those of the publisher, the editors and the reviewers. Any product that may be evaluated in this article, or claim that may be made by its manufacturer, is not guaranteed or endorsed by the publisher.
References
Agriculture and Agri-Food Canada (2019). Statistical overview of the Canadian honey and bee industry, 2019. (Government of Canada).
Alaux, C., Ducloz, F., Crauser, D., and Le Conte, Y. (2010). Diet effects on honeybee immunocompetence. Biol. Lett. 6, 562–565. doi: 10.1098/rsbl.2009.0986
Barroso-Arévalo, S., Fernández-Carrión, E., Goyache, J., Molero, F. P., and Sánchez-Vizcaíno, J. M. (2019). High load of deformed wing virus and Varroa destructor infestation are related to weakness of honey bee colonies in southern Spain. Front. Microbiol. 10, 1–8. doi: 10.3389/fmicb.2019.01331
Beekman, M., and Ratnieks, F. L. W. (2000). Long-range foraging by the honey-bee. Apis mellifera L. Functional Ecology 14, 490–496. doi: 10.1046/j.1365-2435.2000.00443.x
Berke, O. (2004). Exploratory disease mapping: kriging the spatial risk function from regional count data. Int. J. Health Geogr. 3, 1–11. doi: 10.1186/1476-072X-3-18
Berke, O. (2005). Exploratory spatial relative risk mapping. Prev. Vet. Med. 71, 173–182. doi: 10.1016/j.prevetmed.2005.07.003
Canadian Association of Professional Apiculturalists. (n.d.). Annual colony loss reports. Retrieved December 4, 2007–2021. from https://capabees.com/capa-statement-on-honey-bees/
Carrat, F., and Valleron, A. J. (1992). Epidemiologic mapping using the “kriging” method: application to an influenza-like epidemic in France. Am. J. Epidemiol. 135, 1293–1300. doi: 10.1093/oxfordjournals.aje.a116236
Chemurot, M., Akol, A. M., Masembe, C., de Smet, L., Descamps, T., and de Graaf, D. C. (2016). Factors influencing the prevalence and infestation levels of Varroa destructor in honeybee colonies in two highland agro-ecological zones of Uganda. Exp. Appl. Acarol. 68, 497–508. doi: 10.1007/s10493-016-0013-x
Currie, R. W., Pernal, S. F., and Guzmán-Novoa, E. (2015). Honey bee colony losses in Canada. J. Apic. Res. 49, 104–106. doi: 10.3896/IBRA.1.49.1.18
Dietemann, V., Nazzi, F., Martin, S. J., Anderson, D. L., Locke, B., Delaplane, K. S., et al. (2013). Standard methods for Varroa research. J. Apic. Res. 52, 1–54. doi: 10.3896/IBRA.1.52.1.09
Diggle, P. J., and Chetwynd, A. G. (1991). Second-order analysis of spatial clustering for inhomogeneous populations. Biometrics 47, 1155–1163. doi: 10.2307/2532668
Dolezal, A. G., Carrillo-Tripp, J., Miller, W. A., Bonning, B. C., and Toth, A. L. (2016). Intensively cultivated landscape and Varroa mite infestation are associated with reduced honey bee nutritional state. PLoS One 11:e0153531. doi: 10.1371/journal.pone.0153531
Fanelli, A., and Tizzani, P. (2020). Spatial and temporal analysis of varroosis from 2005 to 2018. Res. Vet. Sci. 131, 215–221. doi: 10.1016/j.rvsc.2020.04.017
Giovenazzo, P., and Dubreuil, P. (2011). Evaluation of spring organic treatments against Varroa destructor (Acari: Varroidae) in honey bee Apis mellifera (hymenoptera: Apidae) colonies in eastern Canada. Exp. Appl. Acarol. 55, 65–76. doi: 10.1007/s10493-011-9447-3
Government of Canada. (2020). Annual crop inventory. Retrieved October 29, 2020, from https://open.canada.ca/data/en/dataset/ba2645d5-4458-414d-b196-6303ac06c1c9
Gräler, B., and Pebesma, E. J. (2016). Spatio-temporal interpolation using gstat. The R Journal 8, 204–218. doi: 10.32614/RJ-2016-014
Guzmán-Novoa, E., Eccles, L., Calvete, Y., McGowan, J., Kelly, P. G., and Correa-Benítez, A. (2010). Varroa destructor is the main culprit for the death and reduced populations of overwintered honey bee (Apis mellifera) colonies in Ontario. Canada. Apidologie 41, 443–450. doi: 10.1051/apido/2009076
Haber, A. I., Steinhauer, N. A., and VanEngelsdorp, D. (2019). Use of chemical and nonchemical methods for the control of Varroa destructor (Acari: Varroidae) and associated winter colony losses in U.S. beekeeping operations. J. Econ. Entomol. 112, 1509–1525. doi: 10.1093/jee/toz088
Harbo, J., and Harris, J. (2009). Responses to varroa by honey bees with different levels of varroa sensitive hygiene. Bee World 48, 156–161. doi: 10.3896/IBRA.1.48.3.02
Hengl, T., Heuvelink, G. B. M., and Rossiter, D. G. (2007). About regression-kriging: from equations to case studies. Comput. Geosci. 33, 1301–1315. doi: 10.1016/j.cageo.2007.05.001
Khayli, M., Lhor, Y., Bengoumi, M., Zro, K., El Harrak, M., Bakkouri, A., et al. (2021). Using geostatistics to better understand the epidemiology of animal rabies in Morocco: what is the contribution of the predictive value? Heliyon 7:e06019. doi: 10.1016/j.heliyon.2021.e06019
Kosmala, M., Wiggins, A., Swanson, A., and Simmons, B. (2016). Assessing data quality in citizen science. Front. Ecol. Environ. 14, 551–560. doi: 10.1002/fee.1436
Kozak, P., Eccles, L., Kempers, M., Rawn, D., Lacey, B., and Guzmán-Novoa, E. (2021). Ontario treatment recommendations for honey bee disease and mite control. Retrieved June 24, 2021, from http://www.omafra.gov.on.ca/english/food/inspection/bees/2017-treatment.htm#VM
Kulhanek, K., Garavito, A., and VanEngelsdorp, D. (2021). Accelerated Varroa destructor population growth in honey bee (Apis mellifera) colonies is associated with visitation from non-natal bees. Sci. Rep. 11:7092. doi: 10.1038/s41598-021-86558-8
Kulldorff, M. (1997). A spatial scan statistic. Communications in Statistics: Theory and Methods 26, 1481–1496. doi: 10.1080/03610929708831995
Kulldorff, M., Information Managemnet Services Inc. (2009). SatScan v8.0: Software for the spatial and space-time scan statistics. Retrieved from http://www.satscan.org/
Ma, Y., Yin, F., Zhang, T., Zhou, X. A., and Li, X. (2016). Selection of the maximum spatial cluster size of the spatial scan statistic by using the maximum clustering set-proportion statistic. PLoS One 11:e0147918. doi: 10.1371/journal.pone.0147918
Matthews, R., Wasserstein, R., and Spiegelhalter, D. (2017). The ASA’s p-value statement, one year on. Significance 14, 38–41. doi: 10.1111/j.1740-9713.2017.01021.x
McElheran, B. (1990). National Varroa Survey. Winnipeg, Manitoba, Canada: Canadian Association of Professional Apiculturists.
Morfin, N., Goodwin, P. H., Hunt, G. J., and Guzmán-Novoa, E. (2019). Effects of sublethal doses of clothianidin and/or V. destructor on honey bee (Apis mellifera) self-grooming behavior and associated gene expression. Sci. Rep. 9:5196. doi: 10.1038/s41598-019-41365-0
Pebesma, E. J. (2004). Multivariate geostatistics in R: the gstat package. Comput. Geosci. 30, 683–691. doi: 10.1016/j.cageo.2004.03.012
Peck, D. T., and Seeley, T. D. (2019). Mite bombs or robber lures? The roles of drifting and robbing in Varroa destructor transmission from collapsing honey bee colonies to their neighbors. PLoS One 14, e0218392–e0218314. doi: 10.1371/journal.pone.0218392
Peck, D. T., Smith, M. L., and Seeley, T. D. (2016). Varroa destructor mites can nimbly climb from flowers onto foraging honey bees. PLoS One 11:e0167798. doi: 10.1371/journal.pone.0167798
Pollinator Partnership Canada. (2017). Planting forage for honey bees in Canada: A guide for farmers, land managers, and gardeners. Retrieved from https://honeycouncil.ca/wp-content/uploads/2017/06/Planting-Guide-FINAL-ISBN-June-2017-for-Web-English.pdf
QGIS Development Team (2020). QGIS geographic information system Open Source Geospatial Foundation Project.
R Core Team. (2020). R: A language and environment for statistical computing. Vienna, Austria: R Foundation for Statistical Computing.
Rawn, D., Guzmán-Novoa, E., Chaput, J., Eccles, L., Morfin, N., Kozak, P., et al. (2019). Surveillance on resistant Varroa destructor mite population to three synthetic acaricides in Ontario. Retrieved from https://www.oahn.ca/wp-content/uploads/2019/07/OAHN-Varroa-resistance-report-19-07-16.pdf
Roberts, J. M. K., Anderson, D. L., and Durr, P. A. (2017). Absence of deformed wing virus and Varroa destructor in Australia provides unique perspectives on honeybee viral landscapes and colony losses. Sci. Rep. 7, 1–11 doi: 10.1038/s41598-017-07290-w
Rosenkranz, P., Aumeier, P., and Ziegelmann, B. (2010). Biology and control of Varroa destructor. J. Invertebr. Pathol. 103, S96–S119. doi: 10.1016/j.jip.2009.07.016
Sobkowich, K. E., Berke, O., Bernardo, T. M., Pearl, D. L., and Kozak, P. (2021). Mapping the population density of managed honey bee (Apis mellifera) colonies in Ontario, Canada: 2018. J. Apicultural Science 65, 303–314. doi: 10.2478/jas-2021-0023
Sponsler, D. B., and Johnson, R. M. (2015). Honey bee success predicted by landscape composition in Ohio, USA. PeerJ 3:e838. doi: 10.7717/peerj.838
Statistics Canada. (2018). Census consolidated subdivisions (CCS). Retrieved December 7, 2021, from https://www150.statcan.gc.ca/n1/pub/92-195-x/2011001/geo/ccs-sru/ccs-sru-eng.htm
Stevenson, M. A., Benard, H., Bolger, P., and Morris, R. S. (2005). Spatial epidemiology of the Asian honey bee mite (Varroa destructor) in the North Island of New Zealand. Prev. Vet. Med. 71, 241–252. doi: 10.1016/j.prevetmed.2005.07.007
Tarwater, P. M., and Martin, C. F. (2001). Effects of population density on the spread of disease. Complexity 6, 29–36. doi: 10.1002/cplx.10003
Tentcheva, D., Gauthier, L., Zappulla, N., Dainat, B., Cousserans, F., Colin, M. E., et al. (2004). Prevalence and seasonal variations of six bee viruses in Apis mellifera L. and Varroa destructor mite populations in France. Appl. Environ. Microbiol. 70, 7185–7191. doi: 10.1128/AEM.70.12.7185-7191.2004
Thomas-Bachli, A. L., Pearl, D. L., Parmley, E. J., and Berke, O. (2020). The influence of sociodemographic factors on the engagement of citizens in the detection of dead corvids during the emergence of West Nile virus in Ontario, Canada. Front. Veterinary Science 6:483. doi: 10.3389/fvets.2019.00483
Van Der Zee, R., Gray, A., Pisa, L., and De Rijk, T. (2015). An observational study of honey bee colony winter losses and their association with Varroa destructor, neonicotinoids and other risk factors. PLoS One 10:e0131611. doi: 10.1371/journal.pone.0131611
Vandenbroucke, J. P. (1982). A shortcut method for calculating the 95 per cent confidence interval of the standardized mortality ratio. Am. J. Epidemiol. 115, 303–304. doi: 10.1093/oxfordjournals.aje.a113306
Vidal-Naquet, N. (2018). Honeybee veterinary medicine: Apis mellifera L. Sheffield, UK: 5m Publishing.
Visscher, P. K., and Seeley, T. D. (1982). Foraging strategy of honeybee colonies in a temperate deciduous forest. Ecology 63:1790. doi: 10.2307/1940121
Keywords: Varroa destructor, spatial scan analysis, disease cluster detection, universal kriging, epidemiology, geostatistical modelling, Apis mellifera
Citation: Sobkowich KE, Berke O, Bernardo TM, Pearl DL and Kozak P (2022) Spatial analysis of Varroa destructor and the relationship with surrounding landscape types in Southern Ontario. Front. Ecol. Evol. 10:1027297. doi: 10.3389/fevo.2022.1027297
Edited by:
Geoffrey Williams, Auburn University, United StatesReviewed by:
Michael Lattorff, University of Nairobi, KenyaAlison J. Gray, University of Strathclyde, United Kingdom
Copyright © 2022 Sobkowich, Berke, Bernardo, Pearl and Kozak. This is an open-access article distributed under the terms of the Creative Commons Attribution License (CC BY). The use, distribution or reproduction in other forums is permitted, provided the original author(s) and the copyright owner(s) are credited and that the original publication in this journal is cited, in accordance with accepted academic practice. No use, distribution or reproduction is permitted which does not comply with these terms.
*Correspondence: Kurtis Edward Sobkowich, c29ia293aWtAdW9ndWVscGguY2E=