 Jie Zhang1†
 Zhiyong Zhang1†Furong Neng2
 Shuping Xiong1Yihao Wei1Rui Cao1Qiongru Wei1Xinming Ma1*
 Xiaochun Wang1,2*
- 1Collaborative Innovation Center of Henan Grain Crops, College of Agronomy, Henan Agricultural University, Zhengzhou, China
- 2Department of Biochemistry and Molecular Biology, College of Life Science, Henan Agricultural University, Zhengzhou, China
Optimizing canopy light distribution (CLD) has manifested improved light utility and yield without modifying other inputs. Nonetheless, molecular mechanisms working at cellular and organelle level remain to be elucidated. The current study aimed to assess the effect of CLD on photosynthetic performance and yield of wheat, and to investigate into the molecular mechanism underlying the photosynthetically active radiation (PAR)–use efficiency (PUE) at optimized CLD. Wheat was planted in two rows having different spacing [R1 (15 cm) and R2 (25 cm)] to simulate different CLD. Flag and penultimate leaves were subjected to chloroplast proteomics analysis. An increase in row spacing positively affects CLD. A decrease (16.64%) of PAR interception in the upper layer, an increase (19.76%) in the middle layer, improved PUE (12.08%), and increased yield (9.38%) were recorded. The abundance of proteins associated with photosynthetic electron transport, redox state, and carbon-nitrogen assimilation was differentially altered by CLD optimization. In the penultimate leaves, R2 reduced the abundance of photosystem II (PSII) light-harvesting proteins, PSII-subunits, and increased the photosystem I (PSI) light-harvesting proteins, NAD(P)H quinone oxidoreductase (NQO) and enzymes involved in carbon assimilation compared to R1. Additionally, leaf stomatal conductance increased. Altogether, these findings demonstrated that the regulation of chloroplast proteome is intimately linked to light utilization, which provide basis for genetic manipulation of crop species for better adaptation and improvement of cultivation strategies.
Introduction
As a major food crop planted globally, the high and stable yield of wheat (Triticum aestivum L.) is crucial for global food supply (Duan et al., 2018). Interestingly, water and fertilizer are no longer the key factors limiting wheat yield and growth, and the focus on increasing wheat yield has shifted to develop more capable biomass that may exhibit an improved efficiency of resource usage (Furbank et al., 2019).
In this context, light is a vital environmental factor that affects crop yield and recently sought the attention of researchers for elucidation of the molecular mechanism underlying efficient light utility by wheat. Previous studies have demonstrated that the light environment is linked to the growth and development of crops (Murchie and Burgess, 2022). Additionally, light essentially affects many plant aspects, including photosynthesis, carbon/nitrogen assimilation, the structure of chloroplast, gene expression, and protein component (Wei et al., 2021). Plant canopies, being spatially complex, are unable to cater homogeneously distributed light and, hence, produce a variable light environment for plants. Therefore, the adaptability of crops to light environment and improvement in photosynthetically active radiation (PAR)–use efficiency (PUE) are crucial to biomass accumulation and wheat yield (Townsend et al., 2018). In this perspective, reasonable row spacing can alter vertical canopy light distribution (CLD) by optimizing canopy structure for PUE and yield improvement. Traditionally, the row spacing for wheat is set at 15–20 cm (Liu et al., 2020). In order to adapt to the local sowing equipment and environmental conditions, wheat was also planted at 25 cm row spacing in some regions (Peake et al., 2020). At the same density, when the row spacing increases to 22–26 cm, PAR interception in wheat canopy decreases or remains unchanged while the yield increases with an increase in PUE (Wu and Ou-Yang, 2014).
Photosynthetically active radiation–use efficiency is not only related to CLD but also depends on the plant adaptability of carbon (C) and nitrogen (N) assimilation to light. C and N assimilation are interconnected, which occurs in leaves. The process of N assimilation requires assimilatory power and C skeleton provided by C metabolic. After inorganic N uptake from the soil, a tiny fraction is converted into amino acids within the root and transferred to the branches. Most of N assimilated is utilized for the synthesis of photosynthetic system proteins, enzymes, and chlorophyll (Li D. D. et al., 2013). Photosynthetic N ensured the synthesis of sugar, organic acid, starch, and other carbohydrates, which sustain plant growth (Nunes-Nesi et al., 2010). Hence, leaf N concentration and allocation are critical in determining the photosynthetic rate and PUE. Studies have revealed that increasing the leaf N concentrations can increase chlorophyll content, electron transport rate, and Rubisco content, causing an elevated photosynthetic rate (Meng et al., 2021), which has a significant impact on plant adaptability (Wang et al., 2015; Gu et al., 2017; Shao et al., 2019). However, no clear response mechanism of C and N assimilation to CLD changes in wheat, has been spelt out.
Chloroplast plays a central role in several functionally important physiological processes, including photosynthetic electron transport, the Calvin cycle, and redox homeostasis (de Luna-Valdez et al., 2014). C and N assimilation mainly occurs in the chloroplast. The response of plants to fluctuating light consist of short-term state shifts and long-term adaption, with the latter characterized by regulating photosynthesis-related gene expression and protein abundance to optimize light capture and conversion (Niedermaier et al., 2020), which shows the significant impact of light environment on the chloroplast proteins expression (Zhang et al., 2021). Low-light settings usually increase contents photosystem II (PSII) light-harvesting complex for limited light utilization (Li et al., 2021). With increasing light intensities in some plants, the enhanced abundance occurs in photosynthesis enzymes, cytochrome b6f, as well as ATP synthase, promoting ATP production (Miller et al., 2017). Additionally, plants have developed photoprotection mechanisms to adapt to light fluctuations, including non-photochemical quenching, PSII repair, and elevated oxidized P700 (Takagi et al., 2019).
Both qualitative and quantitative analyses of proteins found in the chloroplast are essential to investigate the molecular basis of CLD affecting wheat PUE and yield. The advent of techniques has advanced the study of proteomic analysis of chloroplast (Taylor et al., 2009). The most research adventures have focused on model plants or greenhouse/hydroponic plants (Gao et al., 2019). However, light under controlled environmental conditions greatly differs from native light; it results in significantly different plant performance and productivity compared to field milieu (Gupta and MacLeod, 1970).
The current research work aimed at evaluating the impact of CLD on photosynthetic performance, PUE and yield of wheat; it envisioned to exploring the molecular mechanism of improved PUE and yield of the wheat as a result of CLD optimization. To achieve this end, a widely grown wheat cultivar, YM49, was planted in the field with different row spacings (R1: 15 cm; R2: 25 cm) to simulate CLD. Various photosynthetic performance indicators of wheat were assessed including leaf area, chlorophyll content, photosynthetic rate, stomatal characteristics, PUE, accumulation of C and N, and yield were measured. Moreover, chloroplast proteomes of flag leaves and penultimate leaves was analyzed with isobaric tags for relative and absolute quantitation (iTRAQ). The analysis results were linked to assess the response of C and N assimilation to CLD at physiological and molecular levels. The critical mechanisms causing PUE and production variances in wheat were also identified. The findings of the study provide a basis for breeding high-PUE wheat varieties and developing efficient cultivation strategies for them.
Materials and methods
Experimental design
YM49, one widely grown wheat cultivar, was used in this study, and grown at Henan Agricultural University’s research station of Xuchang (Henan Province, China 34°08′6.69′′N, 113°48′7.87′′E) from 2018 to 2020. Supplementary Figure 1 depicted the weather status for the two wheat-growing seasons. The clay loam used in this study contained organic matter (16.53 g⋅kg–1), total N (1.30 g⋅kg–1), water-hydrolysable N (50.15 mg⋅kg–1), rapidly available phosphate (8.54 mg⋅kg–1) and rapidly available potassium (235.14 mg⋅kg–1).
The plots were arranged in a completely random design. Two row spacing treatments and three replications were rendered. The row spacing treatments were 15 cm (R1) and 25 cm (R2) at the same density (270 plants⋅m–2), with a size of 2 m × 5 m per plot. The sowing times of wheat seeds were 15 October 2018 and 15 October 2019. Similarly, the harvest times were on 31 May 2019 and 10 June 2020. N (urea), P (calcium superphosphate), and K (potassium chloride) were applied at rates of 225 kg⋅N⋅hm–2, 120 kg P2O5⋅hm–2, and 120 kg KCl⋅hm–2, respectively. All fertilizers were applied uniformly to the soil as solids before plowing/planting. The field management methods were undertaken according to the technical requirements of the local high-yield field.
Measurement and calculation for photosynthetically active radiation and light use efficiency
The PAR was measured at the center of plot at midday using an AccuPAR canopy analyzer (LP-80, METER, USA) when plants were at anthesis (FS; Zadoks scale Z61) and post-anthesis (Z71). The measure bar was placed in the upper (flag leaf), middle (penultimate leaf), and lower (base) parts of the canopy layer. The PAR interceptions at the upper (In1), middle (In2), and lower (In3) of canopy layers were computed using the equations below (Piao et al., 2016):
where PART: incident radiation 0.5 m above canopy; PAR1, PAR2, and PAR3: incident radiation at flag leaves, penultimate leaves, and 0.1–0.2 m above the soil surface, respectively.
The PAR conversion efficiency (PCE) and PUE were calculated using the light interception data at anthesis (Z61) and post-anthesis (Z71) according to the following equations:
where In: total canopy PAR interception; IPAR (MJ⋅m–2): the amount of intercepted PAR between anthesis and maturity (Z61–Z91); S (MJ⋅m–2): the actual amount of radiation, which was collected from the local weather station; ΔM (g⋅m–2): dry matter accumulation between anthesis and maturity (Z61–Z91).
Measurement of photosynthetic performance and yield
Measurements of leaf area and plant biomass
Ten plants near the center of each plot were randomly selected as study objects at the anthesis (Z61) and mature stage (Z91), respectively. At the anthesis, plants were divided into five parts; (a) flag leaves, (b) penultimate leaves, (c) other leaves, (d) stems with sheaths, and (e) spikes. The leaf area was estimated by the laser area meter (CI-203; CID Bio-Science, USA). Plants were divided into grain and others at the mature stage (Z91). The samples were heated (105°C for 30 min), then cooled to 80°C to a stable mass, followed by dry matters calculated.
Measurements of photosynthetic parameters
Field-grown wheat was measured at anthesis (Z61). Flag and penultimate leaves’ photosynthetic light-response curves (LRCs) and canopy photosynthetic rate (Acanopy) were determined utilizing the Li-6400XT detector (LI-COR, Lincoln, NE, USA). CO2 concentration was set at 400 μmol mol–1, and ten photosynthetic photon flux densities (PPFDs) were set from 2,000 to 0 μmol⋅m–2⋅s–1 (minimum: 2 min, maximum: 3 min) at each PPFD from high to low. LRCs were modeled by a non-rectangular hyperbola, with net photosynthetic rate (Pn) computed as follows (Ye et al., 2013):
where L: incident PPFD (μmol⋅m–2⋅s–1); α: quantum efficiency; Rd: dark respiration rate (μmol⋅m–2⋅s–1). The data below 120 μmol⋅m–2⋅s–1 was fitted with one straight line; the slop and intersection point of straight lines and ordinate correspond to the α value and Rd value, respectively. θ: convexity with a fixed value of 0.9.
Acanopy was determined with an outfitted 0.5 m × 0.5 m × 1 m assimilation box, and computed as follows:
where δc: CO2 concentration changes in the box, δt is the interval time; V: the box volume; S: the bottom area of the box; Pa: the mean atmospheric pressure (kPa) in the box; R: gas constant (8.3 × 10 –3 m3⋅kPa⋅mol–1⋅K–1); T: the absolute temperature (K).
Measurements of stomatal parameters
Measurements of stomatal parameters were taken between 9 a.m. and 10 a.m. at anthesis (Z61). The leaves were measured for the same plants that were previously measured for photosynthetic parameters. Five samples of flag/penultimate leaves were collected by applying dental resin (Coltene Whaledent, Switzerland) to the lower epidermis of the leaf blade in each plot (Wu et al., 2017). An impression was made through sealing the silicone imprinting by a light surface of transparent nail polish, and placed on the glass slide after drying. The imprints were observed under a light microscope using 10× and 40× objective lens, and magnified images were micrographed. Measurement of density, guard cell, and aperture area of stomata was conducted using the ImageJ software (NIH, USA).
Measurements of carbon and nitrogen metabolites
The ovendried samples were ground in a grinder. Samples of the flag and penultimate leaves were extracted with ethanol. An anthrone based colorimetric method (Yemm and Willis, 1954) was employed to measure soluble sugar content, and ninhydrin colorimetric method for total free amino acid content (Wei et al., 2018). After digestion of the residue obtained after ethanol extraction with the perchloric acid solution, the starch content was analyzed. The colorimetric method was used to detect the sugar. The coefficient was multiplied by 0.9 to convert starch content (Kang et al., 2010). Additionally, the potassium dichromate method (Li Z. M. et al., 2013) was used to determine the total C content. Tissue samples were digested and processed with a SEAL AutoAnalyzer 3 continuous flow analyzer (Bran+Luebbe GmbH company, Norderstedt, Germany) to analyze N content.
Measurements of yield
The yield was measured using the following process. The number of plants and spikes in each plot was counted at the mature stage (Z91). A total of 30 chosen spikes at random were taken from the middle within plots for estimating the grain quality of every spike. The wheat of two 1 m2 quadrats in each plot was harvested for 1,000-grain weight and yield analysis.
Chloroplast proteome
Chloroplast isolation
Fresh flag and penultimate leaves were collected at anthesis (Z61). Subsequently, three biological experiments of three distinct field plots were applied to isolate intact chloroplasts. The isolation process used was as follows.
Crude homogenate was prepared by grinding fresh wheat leaves (30 g) in 180 ml buffer solution. The solution was diluted one-fold and stored at 4°C. It was filtered through two layers of medical gauze and transferred to a 50 ml prechilled centrifuge tube, and centrifugated (4°C, 3,000 × g, 5 min), with the upper solution added with addition of 700 μL buffer solution. The precipitate was resuspended with a soft brush to obtain a chloroplast solution. The chloroplast solution was loaded onto a Percoll gradient and centrifuged at 4°C, 8,000 × g for 10 min. Following centrifugation, two different bands were obtained, with the lower band corresponding to the intact chloroplasts. Intact chloroplasts were removed, and extraction buffer (0.1 M K-Hepes, 0.66 M sorbitol, pH 8.0; the solution was diluted one-fold and stored at 4°C) was added to re-suspend the precipitates. After centrifugation, the upper solution was conducted, and this operation was repeated twice. A total of 400 μL extraction buffer was used to resuspend the precipitate, shifted into a 1.5 ml EP tube, and stored under dark conditions on the ice.
Western blot analysis was carried out for the purity evaluation of chloroplast proteins, using 50 μg chloroplast and whole cell proteins, respectively. The separated the protein by electrophoresis were on Polyvinylidene difluoride (PVDF) membranes. Based on dilutions Agrisera recommended, antibodies against light-harvesting complex II (LHCII, AS01 004), vacuolar ATPase (V-ATPase, AS07 213), cytochrome oxidase II (CoxII, AS04 053A), and chaperonin 60 (CPN60, AS12 2613) were processed separately on the blots after blocking in 3% (w/v) bovine serum albumin (BSA). Incubation with an enhanced chemiluminescent substrate allowed the signals to be detected on X-ray films (Bio-Rad Laboratories Inc., USA). Furthermore, the chlorophyll and activity of cytoplasmic enzyme (UGPase) were measured in order to ensure chloroplast purity (Lande et al., 2017).
Chloroplast proteome analysis
The intact chloroplasts were employed to analyze iTRAQ proteomic (Meng et al., 2021). We thank the Shanghai Luming Biological Technology Co., Ltd. (Shanghai, China) for their enthusiastic support of this proteomics analysis. Proteins were extracted by the phenol method. It was followed by protein digestion with filteraided sample preparation. We used iTRAQ Reagents 4-Plex kit according to the instructions the manufacturer advised (Applied Biosystems, Waltham, MA, USA) for labeling iTRAQ. Samples were labeled as follows: R1-flag leaf (R1-1), R1-penultimate leaf (R1-2), R2-flag leaf (R2-1), and R2-penultimate leaf (R2-2). AKTA Purifier (GE Healthcare, Pittsburgh, USA) was used to fractionate the labeled peptide fractions. Afterward, the liquid chromatography tandem mass spectrometry analysis was conducted with the Q Exactive UHMR spectrometer from Thermo Scientific (USA), and data was imported in Maxquant for labeling-free quantification analysis and searched against the Uniprot Poaceae database using the Proteome Discoverer Software 2.4 (Thermo Scientific, Waltham, MA, USA). The overall false discovery rate was designated as 0.01. Differentially expressed proteins (DEPs) were defined using cutoffs either >1.22 or <0.83-fold change ratios, p < 0.05. R1 was used as a control variable when comparing different treatments.
Statistical analysis
Three replications of each independent experiment were carried out. The mean values and standard deviations were calculated according to replication data. Data analyses were carried out with GraphPad Prism 7. One-way ANOVA as well as Duncan’s multiple range test was applied for comparing multiple means and significance of differences between mean values. The abundance of proteins was visualized as heatmap representation through the pheatmap package in R.1
Results
Increasing row spacing affects wheat canopy structure and light distribution
An increase in row spacing presented no significant effect on total canopy PAR interception, which remained above 91%. On the other hand, the variations of light interception in different canopy locations exhibited a significant difference (Figure 1). Compared with R1, R2 significantly increased the inclination of the flag (7.6%) and reduced the inclination of penultimate leaves (4.01%) (Figure 1A). PAR interception decreased (19.96%) in the upper layer, increased (19.76%) in the middle layer, whereas increased insignificantly in the lower layer (Figure 1B). It revealed that increasing row spacing had a positive impact on the CLD of wheat.
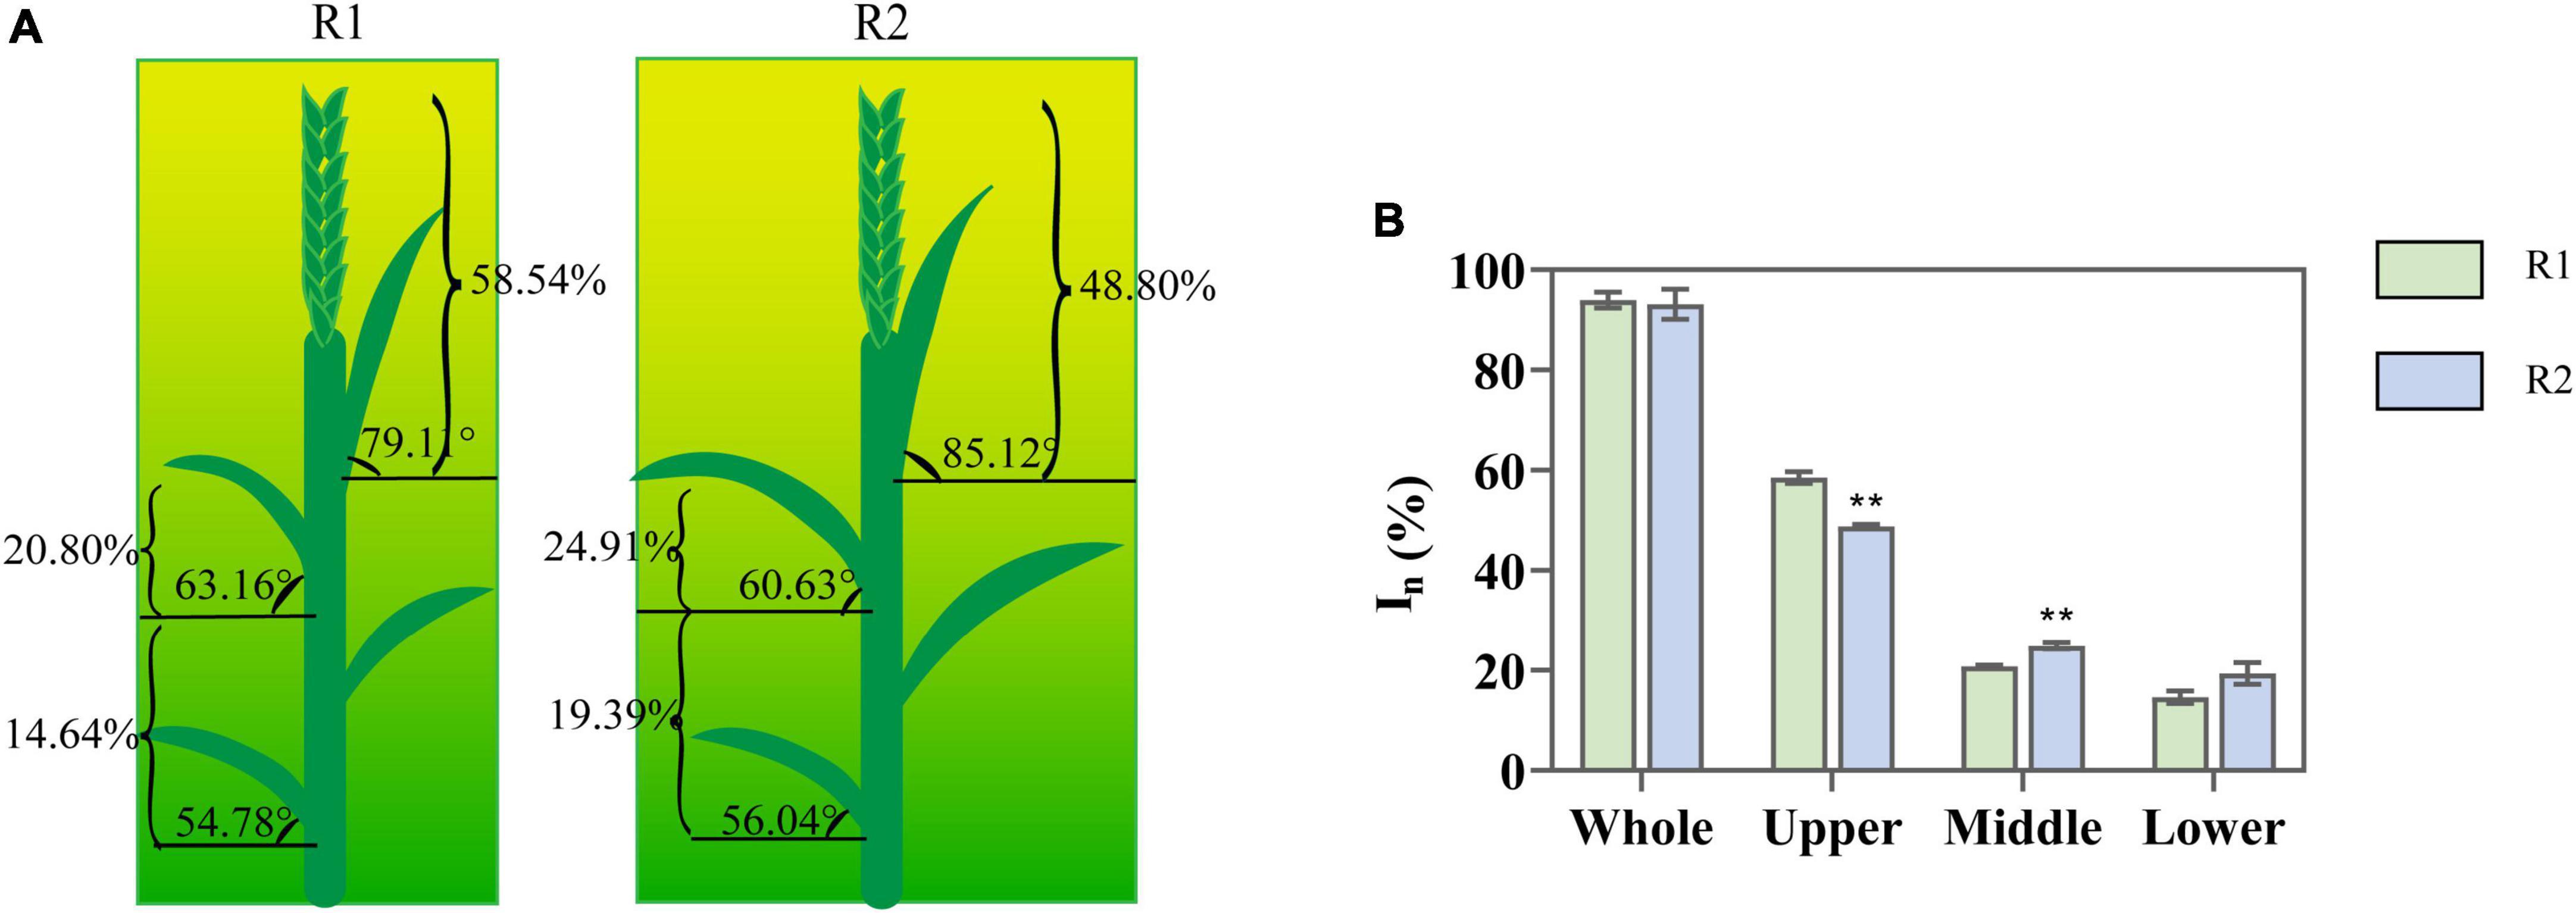
Figure 1. Change in leaf angle and the light interception at anthesis under different row spacing treatments. (A) The schematic representation: arc represents leaf angle; brace represents the values of photosynthetically active radiation (PAR) interception; (B) The PAR interception in the upper-, middle-, and lower-canopy layer. Results presented as mean ± standard deviations (SD); Error bars represent SD. Significant differences marked by asterisks (**p < 0.01).
Increasing row spacing affects light use efficiency and yield
The change in CLD significantly affected the light use efficiency and yield of wheat. Compared to R1, PCE and PUE under R2 increased by 13.35 and 12.08%, respectively (Figures 2A,B). The yield was markedly improved (9.38%), which is mainly attributed to the growth of grain number for each spike (2.09%) plus 1,000-grain weight (1.84%) (Figures 2C–F). The consistent changes of PUE and yield indicated that the improvement of photo-synthetic performance played an important role in increasing yield.
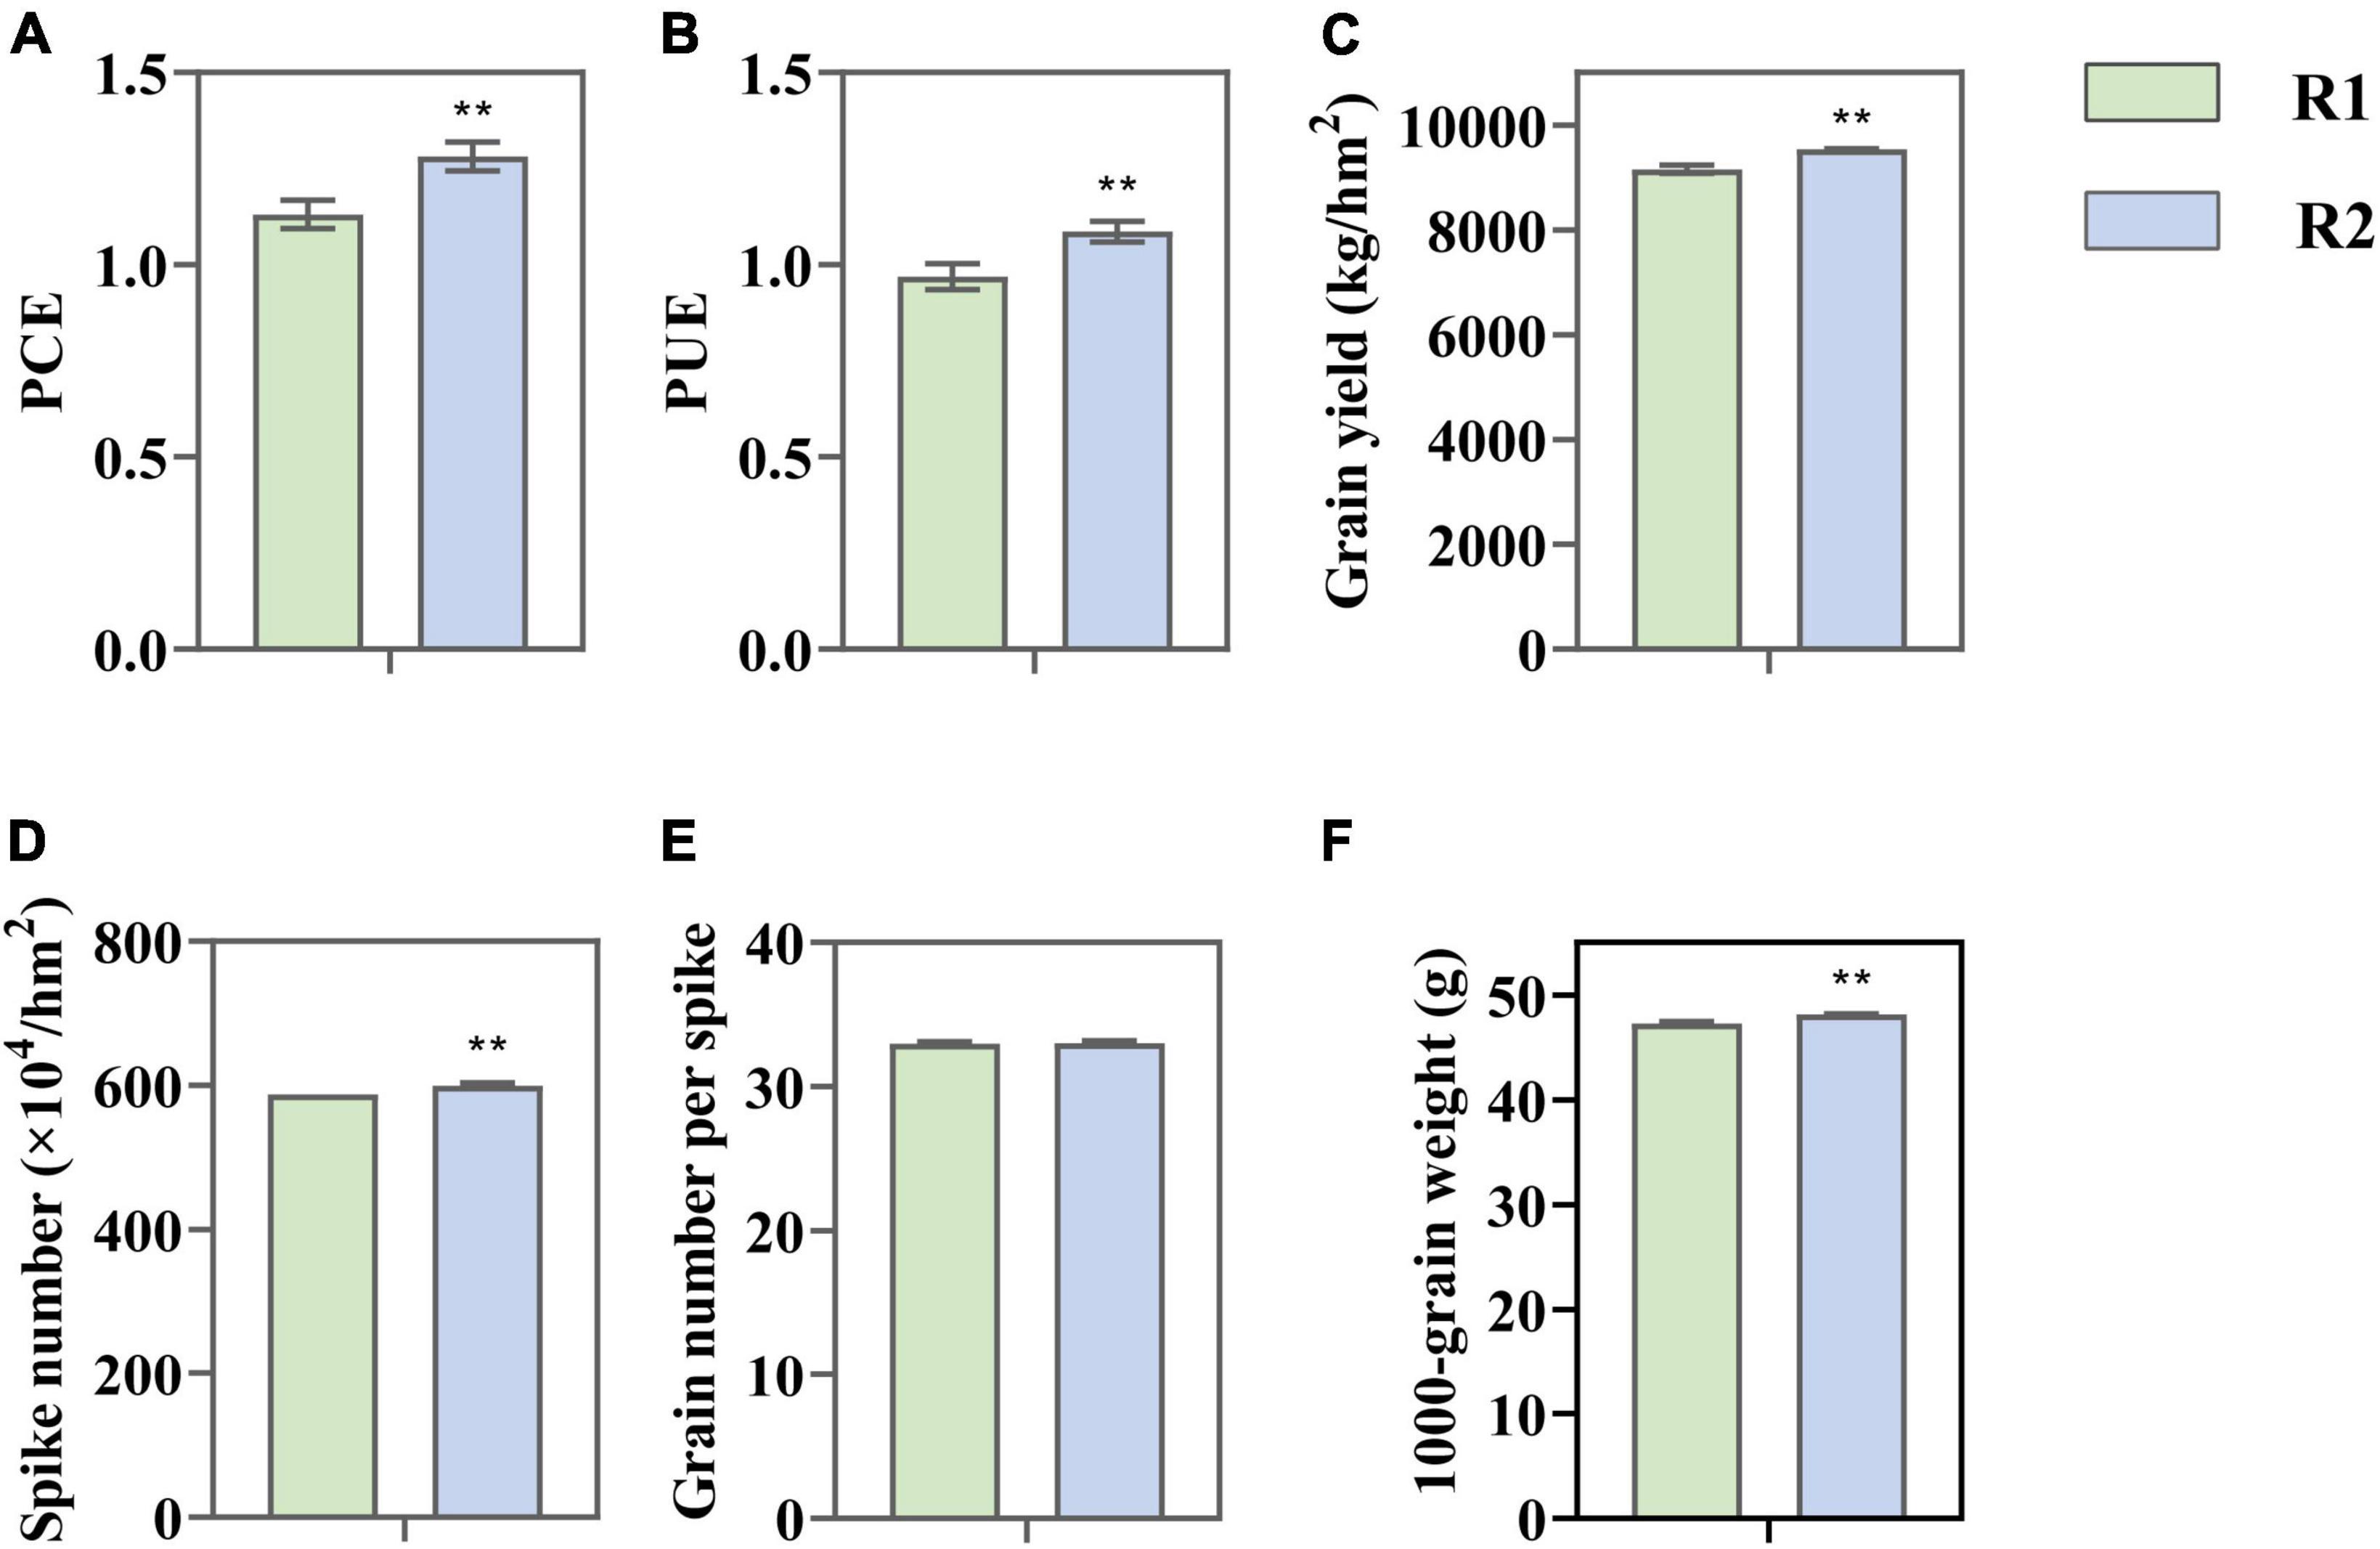
Figure 2. Change in light conversion efficiency (PCE). (A) Light use efficiency (PUE); (B) grain yield; (C) yield components; (D–F) under different row spacing treatments. Results expressed as mean ± standard deviations (SD); Error bars represent SD. Significant differences marked by asterisks (**p < 0.01).
Increasing row spacing affects leaf photosynthesis parameters
The improvement of light use efficiency is related to the photosynthetic capacity. An increase in row spacing had a positive effect on Pn and Acanopy (Figure 3). The flag and penultimate leaves area under R2 were larger than R1 by 6.71 and 38.11%, respectively (Figure 3A). Moreover, R2 displayed a higher chlorophyll content than R1 by 40.57 and 10.21% in the flag and penultimate leaves, respectively (Figure 3B). Pn in 1,000 μmol⋅m–2⋅s–1 also improved by 10.86 and 5.68% (Figure 3D), while Acanopy increased by 5.67% (Figure 3C). Dry matter accumulation from the anthesis to maturity phase significantly increased when Acanopy were enhanced (Supplementary Figure 2), which is beneficial to improve light use efficiency.

Figure 3. Change in leaf area (A), chlorophyll content (B), canopy photosynthetic rate (Acanopy) (C), light response curve (LRCs) (D) of flag and penultimate leaves at anthesis under different row spacing treatments. Results expressed as mean ± standard deviations (SD); Error bars represent SD. Significant differences marked by asterisks (*p < 0.05; **p < 0.01).
Increasing row spacing affects leaf accumulation of carbon and nitrogen metabolites
An increase in row spacing has significant effects on C and N content of leaves (Figure 4). Compared with R1, the total C in the flag under R2 fell by 11.34%, and in the penultimate leaves by 13.68%. Besides, the soluble sugar content in the flag increased by 35.86%, and in the penultimate leaves by 13.36%. The starch content in the flag leaves increased by 26.39% and reduced by 37.85% in penultimate leaves (Figures 4A,B).
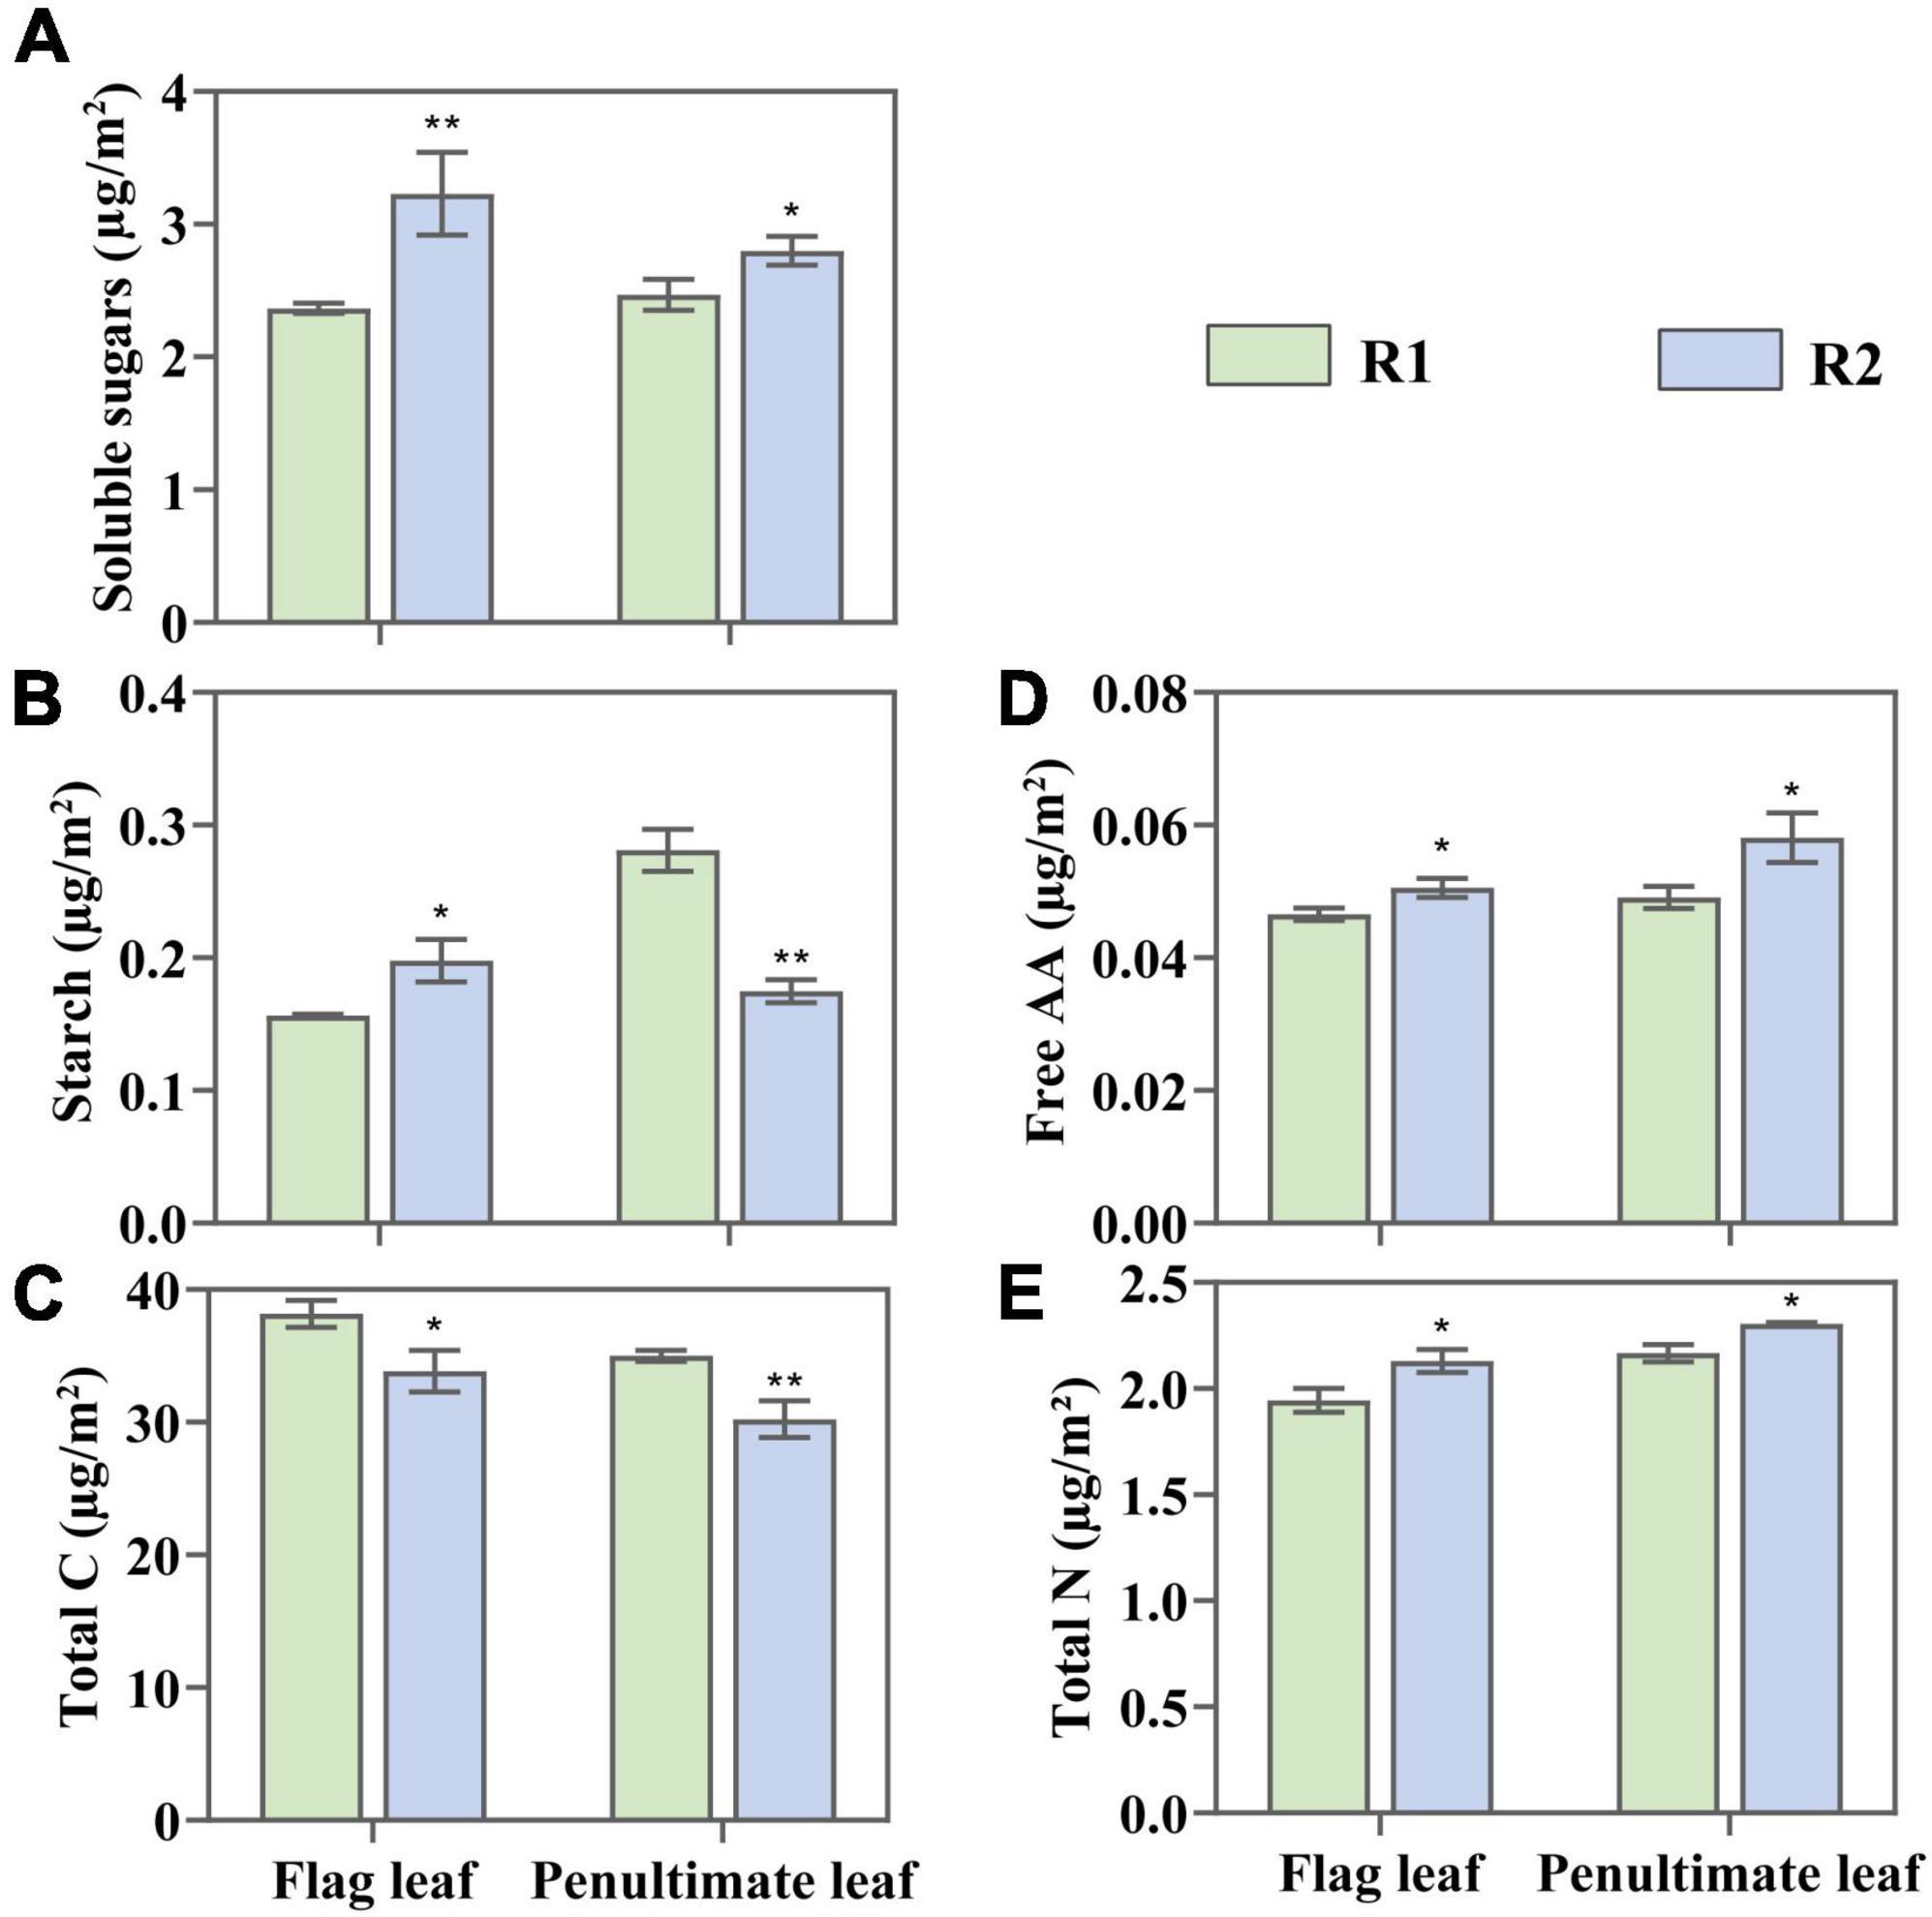
Figure 4. Change in soluble sugar (A), starch (B), total carbon (C), free amino acid (AA) (D), and total nitrogen (E) in the flag and penultimate leaves at anthesis under different row spacing treatments. Results expressed as mean ± standard deviations (SD) and the error bars represent SD. Significant differences marked by asterisks (*p < 0.05; **p < 0.01).
Compared with R1, R2 demonstrated a 9.79 and 6.45% increase of total N in the flag and penultimate leaves, and 8.6 and 18.33% increase of free amino acid (Figures 4D,E). Changes in leaf N content may affect the fractions of N allocated to photosynthetic apparatus, which maybe important for improving photosynthetic capacity.
Effects of increasing row spacing on chloroplast proteome
Proteomic profiling and clustering
Accurate organelle proteomics hinges on subcellular isolation and protein enrichment. Therefore, the purity of chloroplast samples was evaluated by western blot before proteomic evaluation. Compared with total cell extract, the protein localized in thylakoid membrane [light-harvesting complex II (LHCII) and stromal chaperonin-60 (CPN60)] were significantly enriched in the chloroplast sample. The mitochondria-specific CoxII and vacuolar protein V-ATPase were almost negligible (Supplementary Figure 3A). Additionally, chlorophyll content and UGPase activity of the total cell extract were much higher than the chloroplast sample (Supplementary Figures 3B,C). It confirmed the purity of the chloroplast sample and minimized the prospects of contamination with other organelles.
A total of 440 chloroplast proteins were identified. The cluster analysis showed that the R2-1 and R2-2 groups were clustered together and close to the R1-1 group. It indicated that the chloroplast protein composition and abundance in the flag and penultimate leaves under R2 appeared to be similar to those of flag leaves under R1. Moreover, an increase in row spacing was found dramatically affecting the expression of chloroplast proteins in the penultimate leaves (Figure 5A). Compared to R1, there were 177 DEPs in the flag leaves under R2. It included a total of 59 (23.5%) up-regulated proteins and 118 (70.3%) down-regulated proteins. In the penultimate leaves, there were 261 DEPs, which included 207 (82.2%) up-regulated proteins and 54 (32.2%) down-regulated proteins (Figures 5B,C).
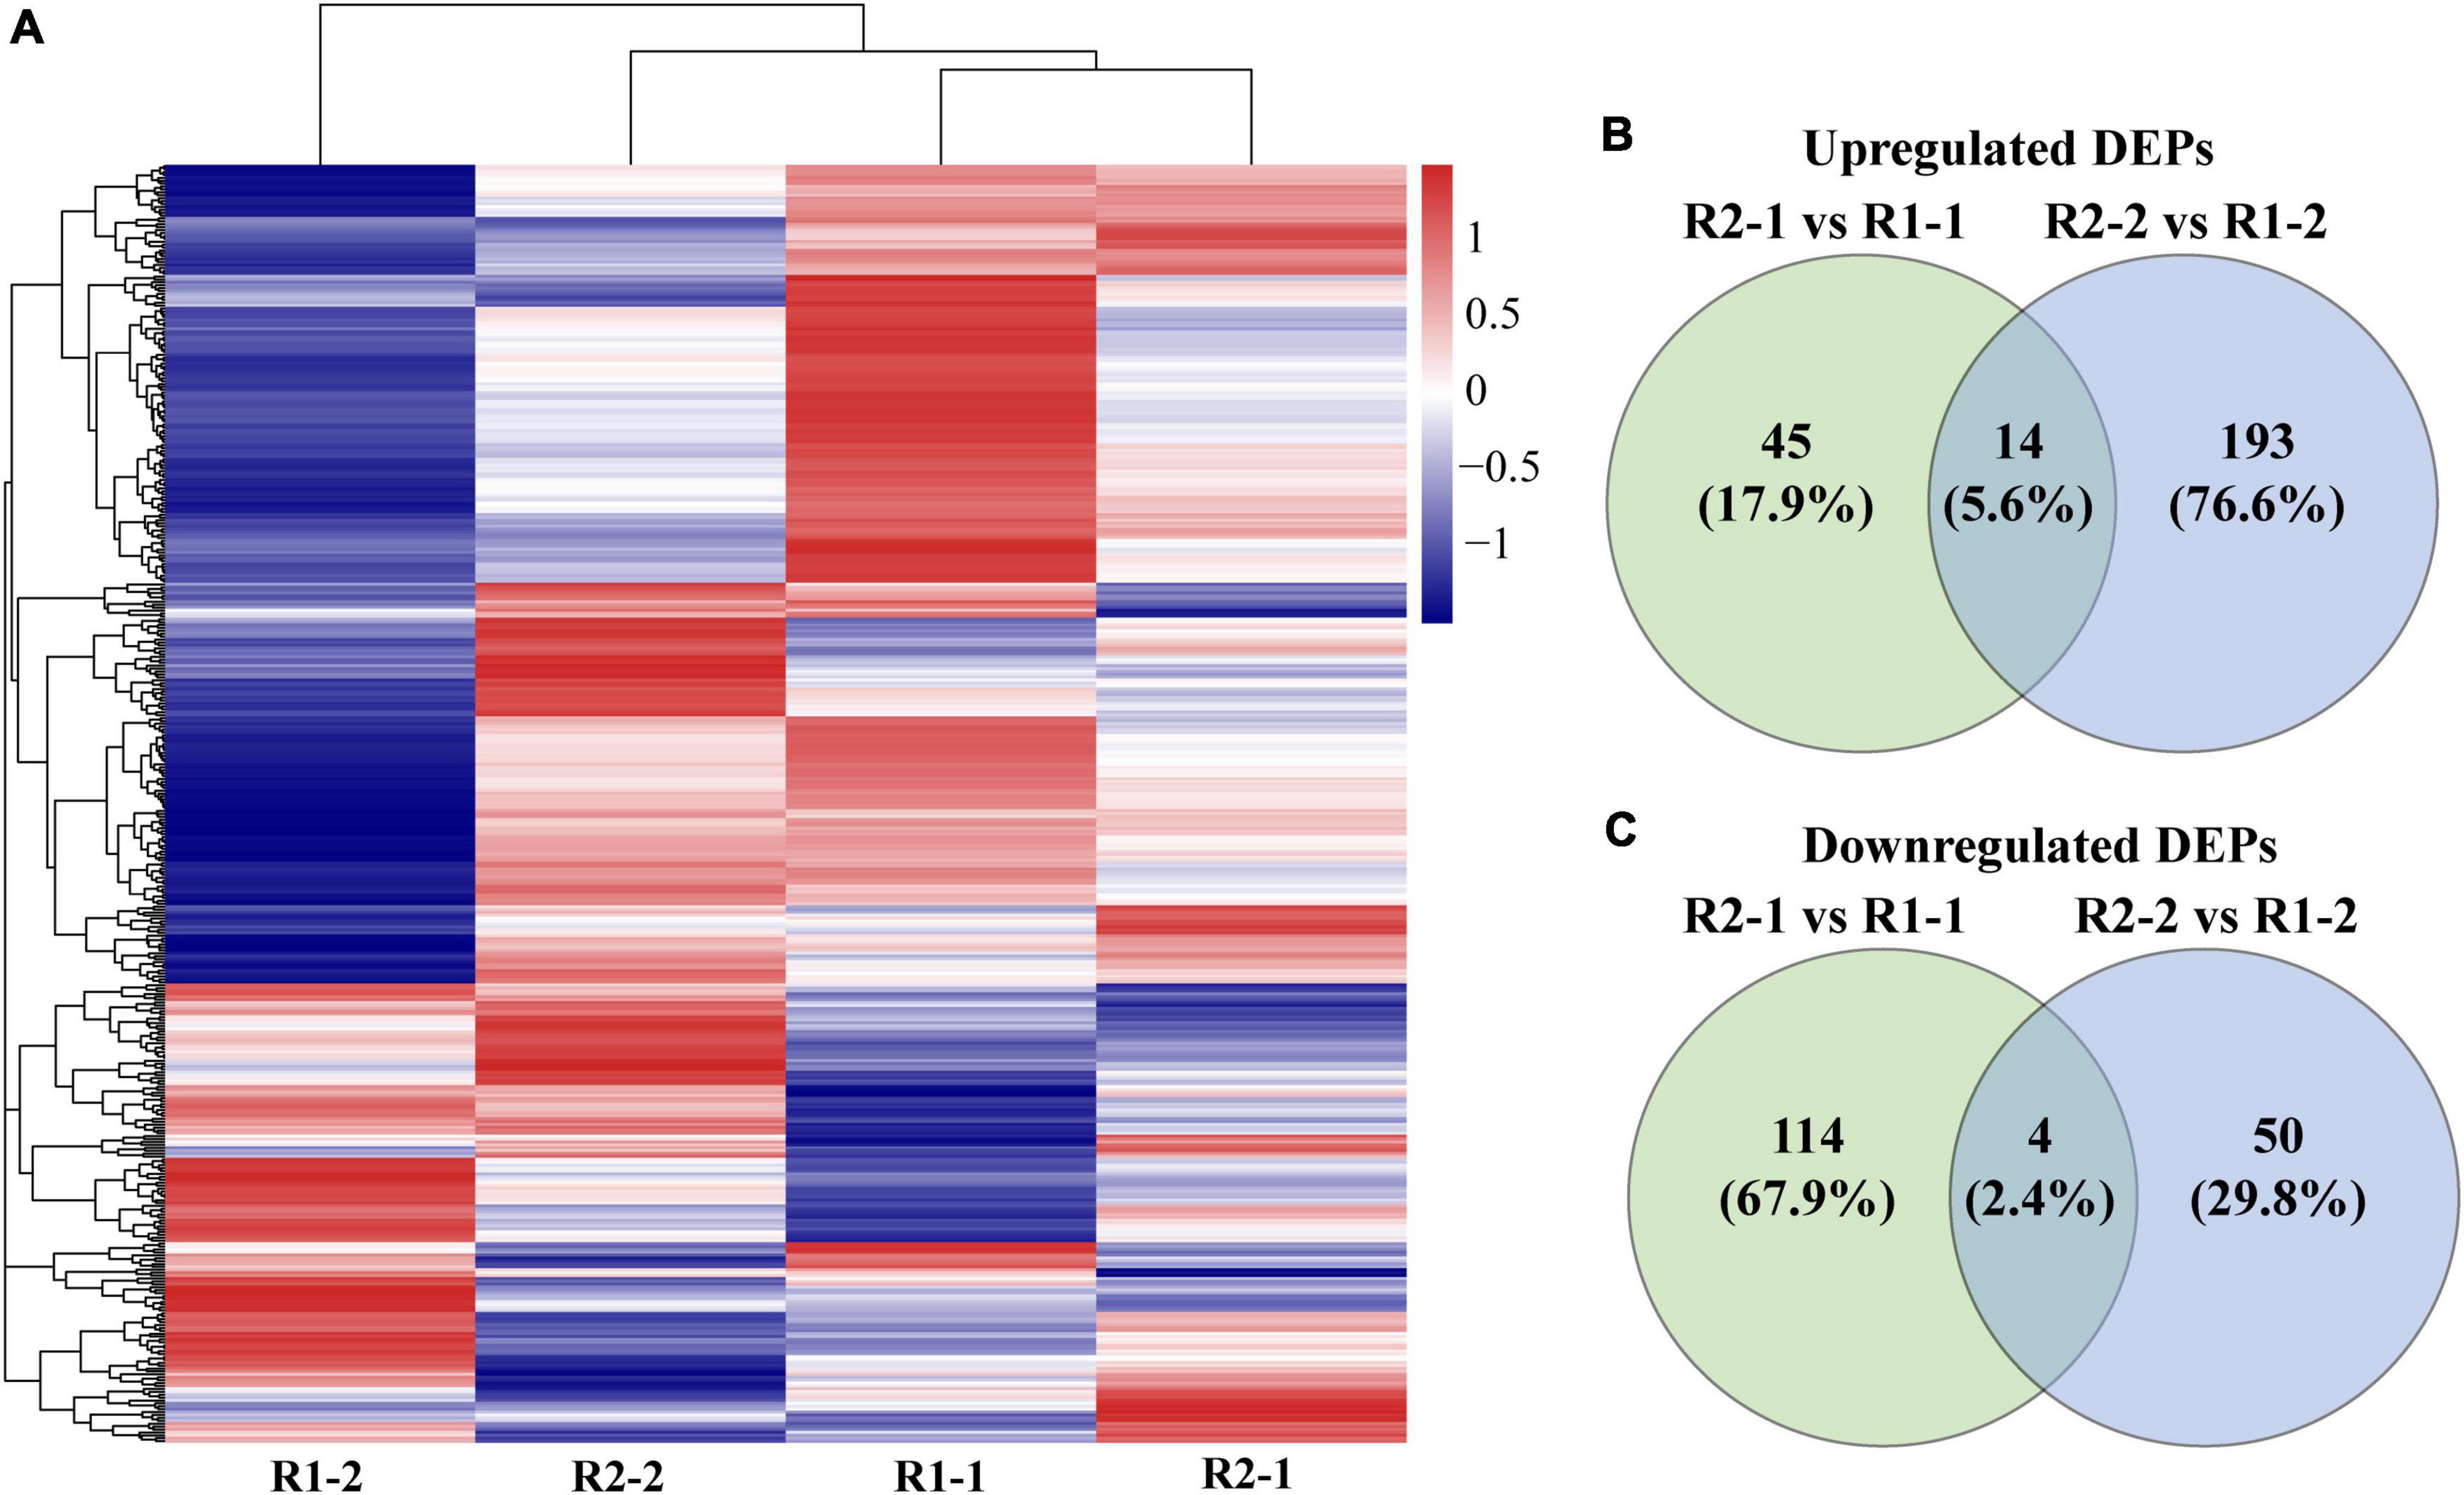
Figure 5. Clustering heatmap of 440 identified chloroplast proteins (A) and Venn diagrams of differentially expressed proteins (DEPs) in the flag and penultimate leaf (B,C) at anthesis under different row spacing treatments. Each row represents a chloroplast protein in (A) and the gradient of red to blue colors indicates high to low relative abundance.
Pathway enrichment analysis
The identified proteins were subjected to the analyses of Gene ontology (GO) and Kyoto Encyclopedia of Genes and Genomes (KEGG). DEPs responding to increased row spacing were mainly engaged in the cellular metabolic process, N metabolic processes, response to stimulus, and protein folding. The molecular functions of DEPs included binding, structural molecule activity, electron carrier activity, and antioxidant activity (Figure 6A). Additionally, the KEGG pathway analysis showed that DEPs were assigned to nine pathways of which photosynthesis, polysaccharide metabolism, glyoxylate and dicarboxylate metabolism, biosynthesis of secondary metabolites, and amino acid metabolism were observed significantly regulated with an increase in row spacing (Figure 6B).
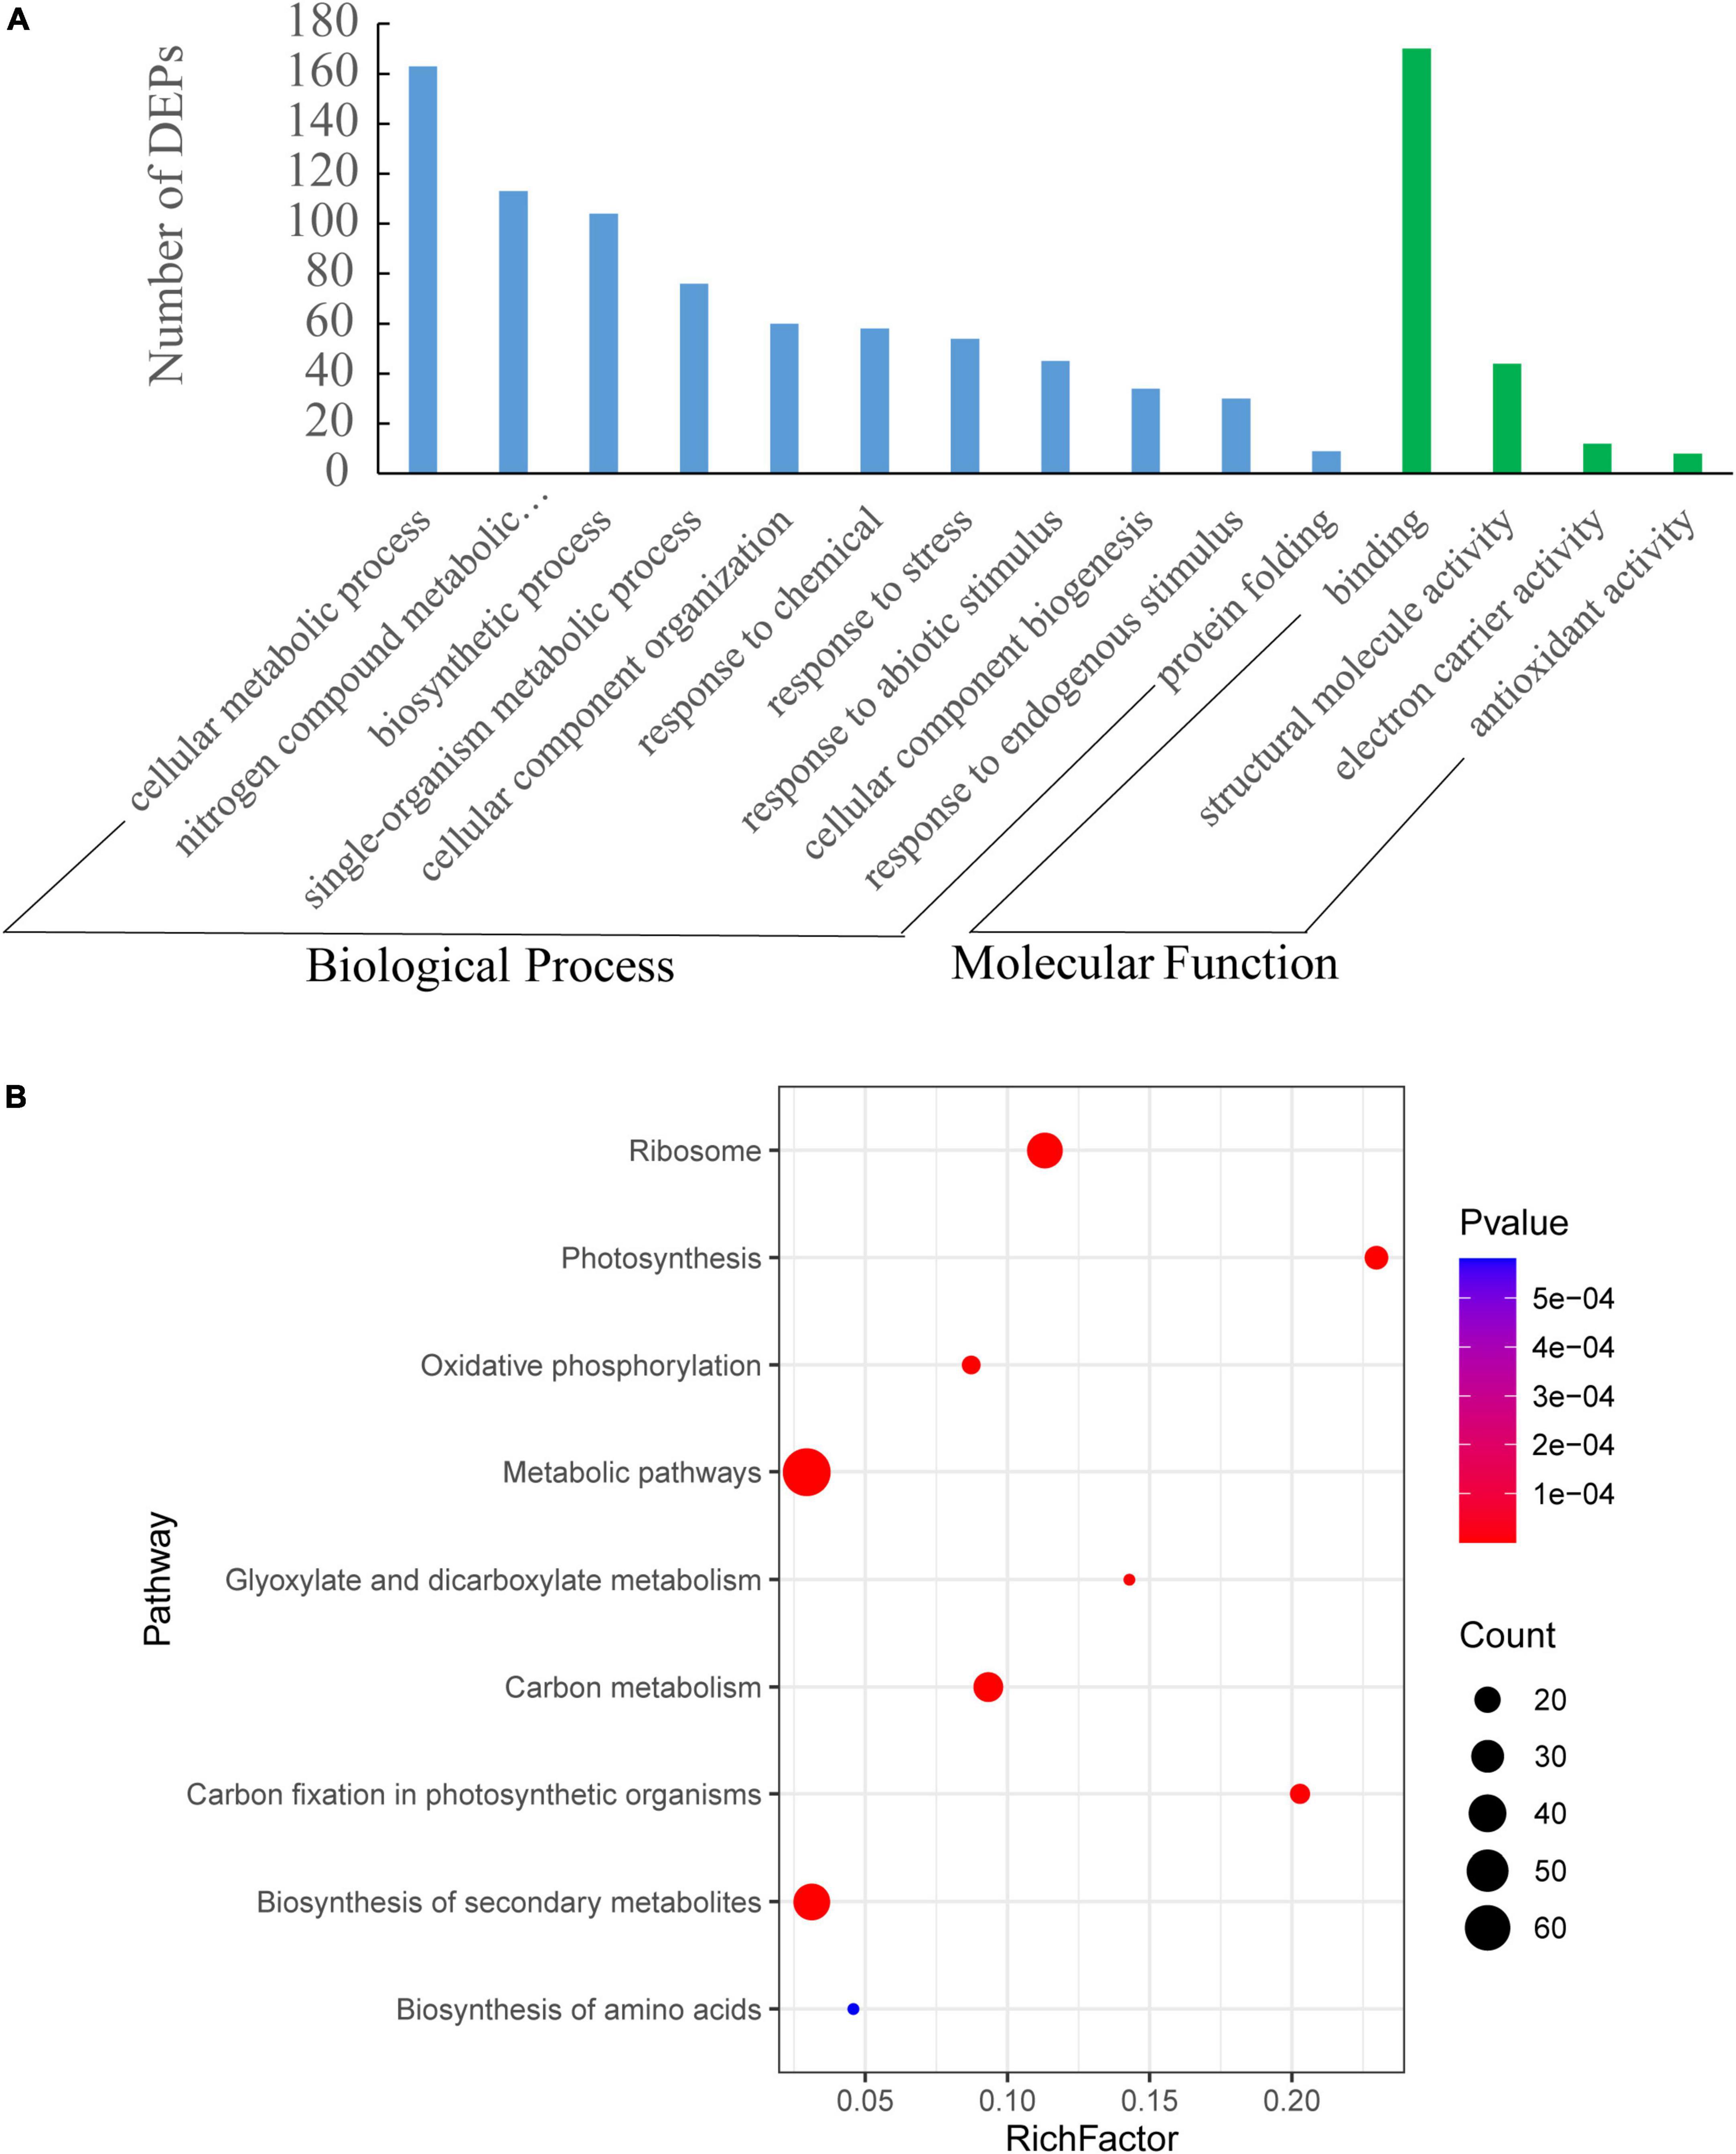
Figure 6. Gene ontology (GO) (A) and Kyoto Encyclopedia of Genes and Genomes (KEGG) (B) enrichment analyses of differentially expressed proteins (DEPs) under different row spacing treatments. (A) GO analysis includes biological processes and molecular function. (B) Y-axis indicates KEGG pathway name, and X-axis represents enrichment factor. The dot size and colors represent the numbers of DEPs in each pathway and the P-values of enrichment, respectively.
Photosynthesis-related proteins
Compared with R1, 43 photosynthesis-related proteins were identified as DEPs under R2 in the flag and penultimate leaf; 31 were related to light reaction, and 12 were associated with C assimilation. Among the light reaction-related proteins, an enhancement in the abundances of PSII reaction center proteins (PsbD, PsbE, PsbF, and PsbH), oxygen-evolving enhancer proteins (PsbO and PsbP), and PSI reaction center subunit (PsaN) was noted in the flag leaves. Among the C assimilation-related proteins, five Calvin cycle enzymes, including Rubisco subunit, phosphoglycerate kinase (PGK), sedoheptulose-1, 7-bisphosphatase (SBPase), CP12-2, and transketolase (TK), exhibited increased abundance in the flag leaves. Moreover, the abundance of glyceralde-hyde-3-phosphate dehydrogenase (GAPDH) increased in the flag leaves (Figure 7A).
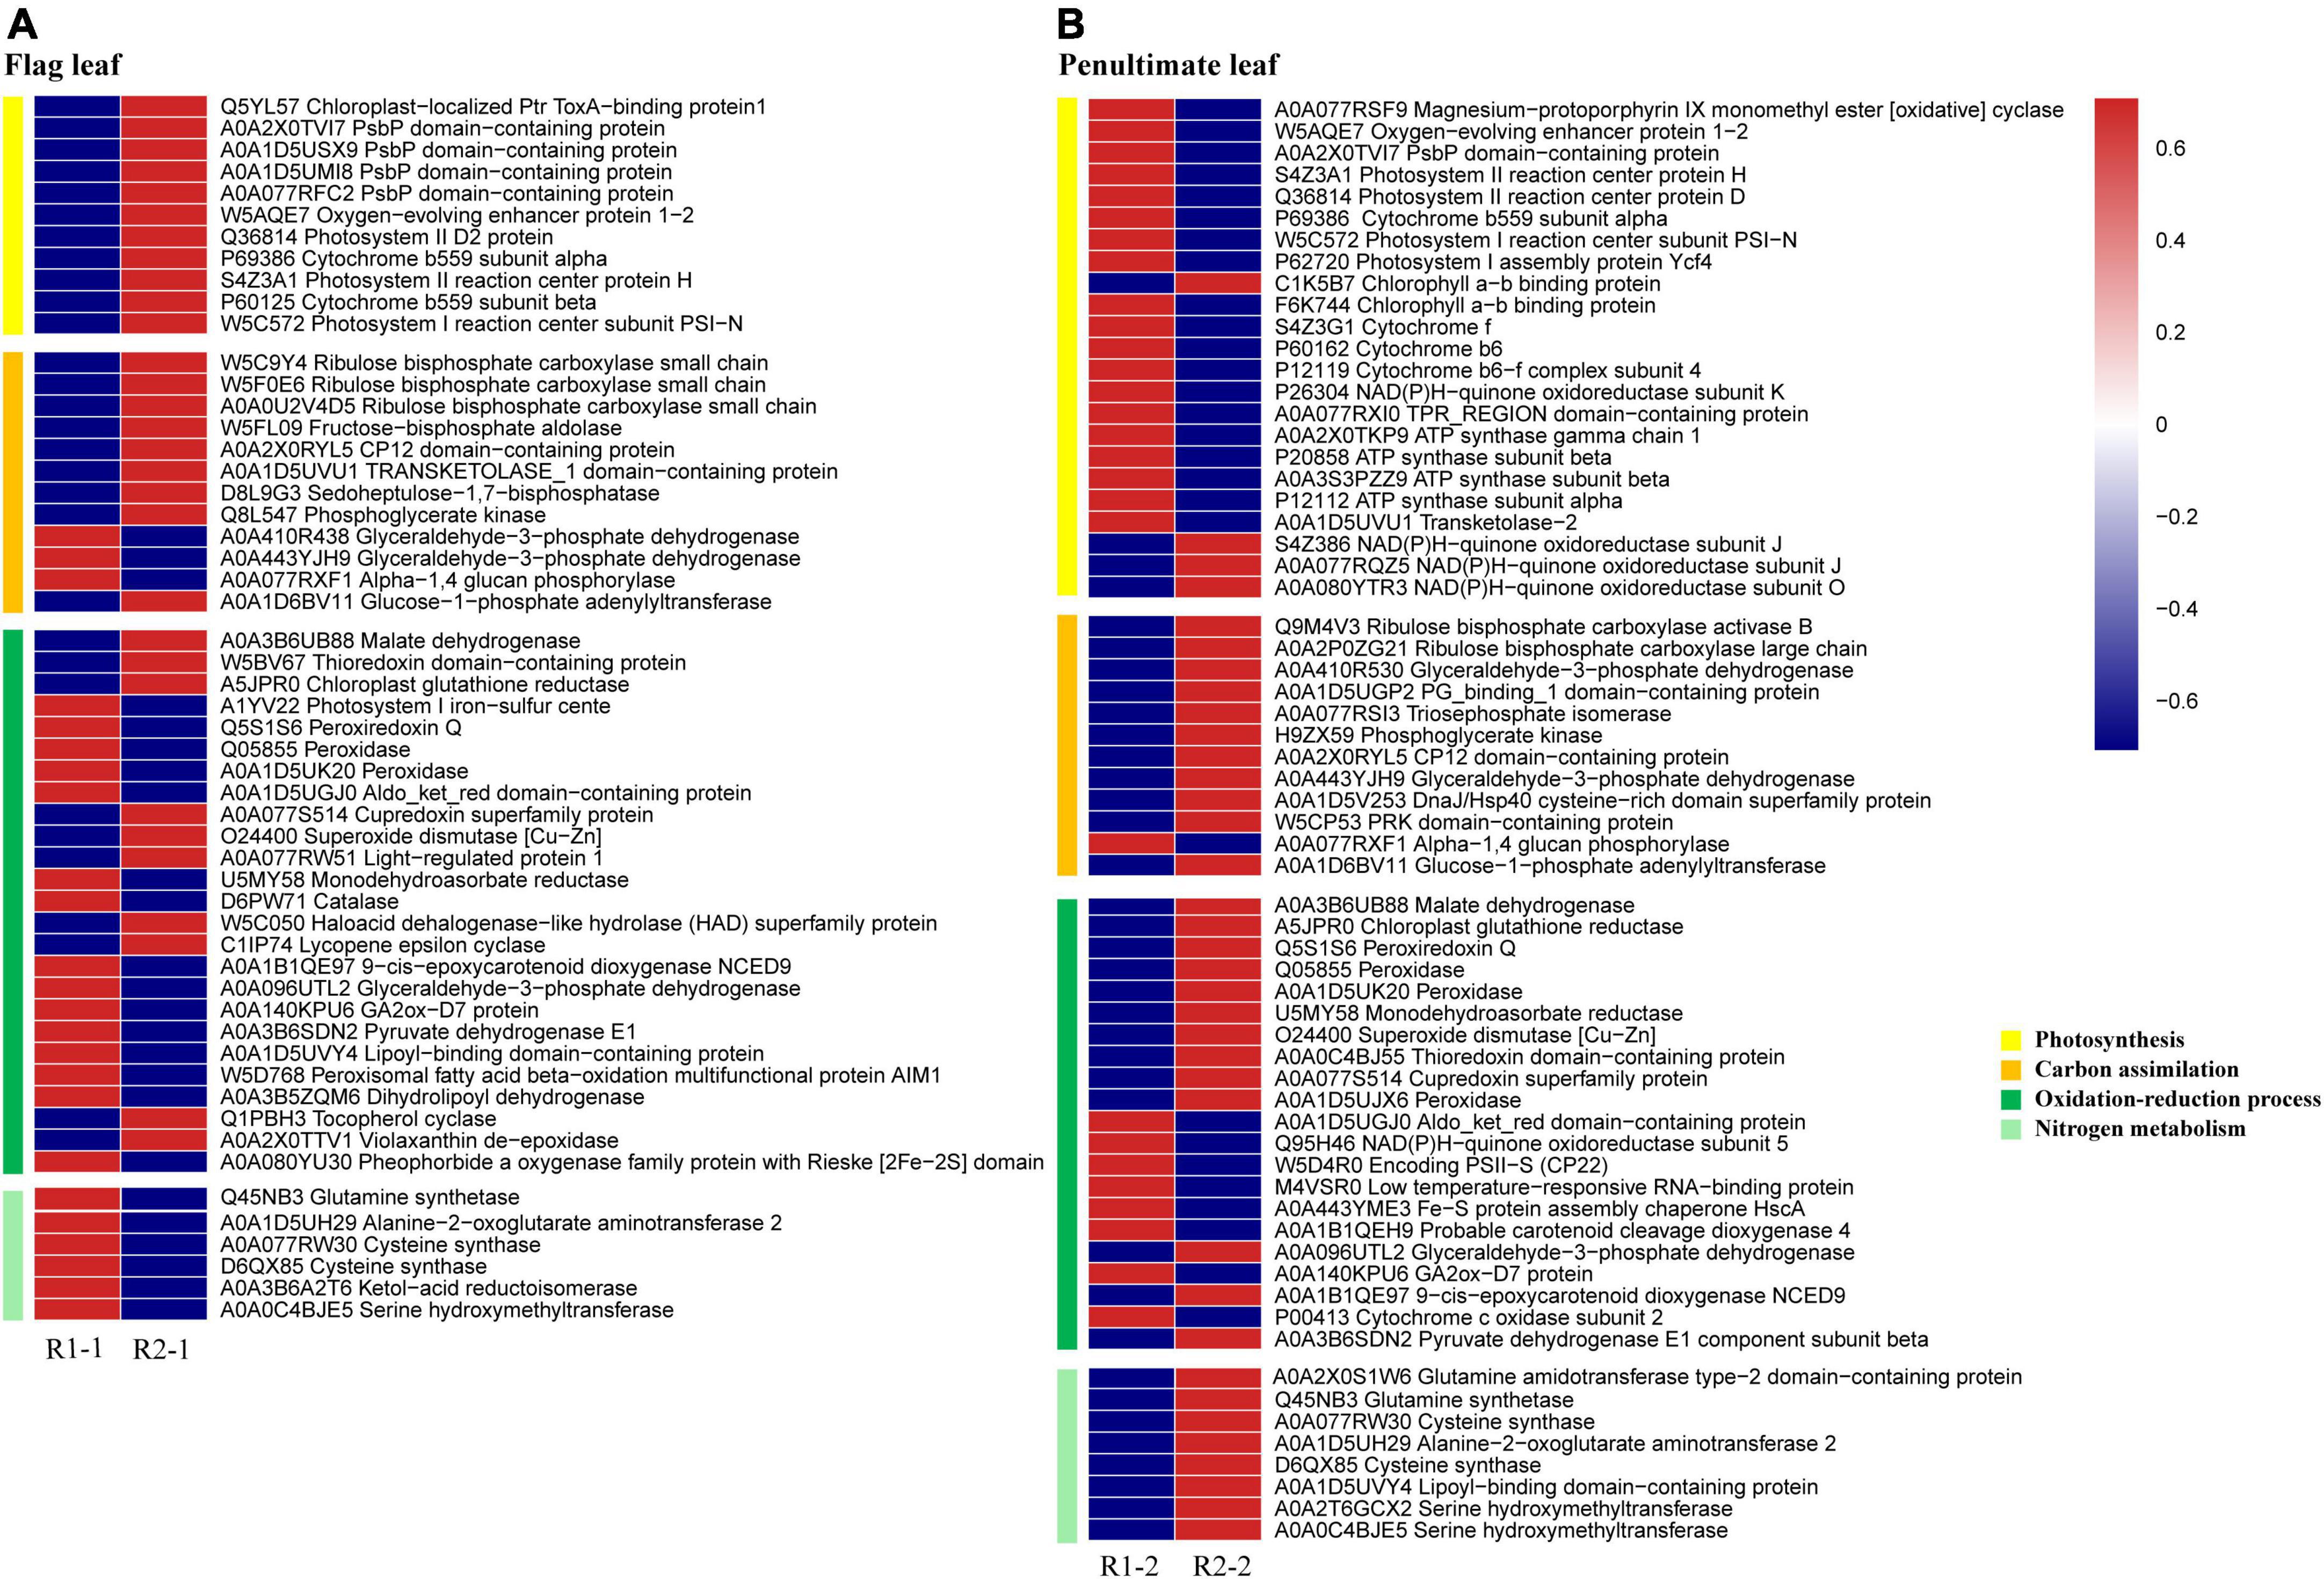
Figure 7. Heatmaps of differentially expressed proteins (DEPs) related to photosynthesis, carbon assimilation, oxidation-reduction process, and nitrogen metabolism in the flag (A) and penultimate leaves (B) under different row spacing treatments. Relative abundance presented by a color scale from red (high) to blue (low).
The penultimate leaves differed notably from in how widening row spacing affects photosynthesis-related proteins (Figure 7B). With increasing row spacing, the abundance of the magnesium protoporphyrin IX monomethyl ester cyclase (MTC; chlorophyll synthetic protein) was markedly reduced in the penultimate leaves. Among the light reaction-related proteins, PSII light-harvesting complex, PsbO, PsbP, PsbD, PsbE, PsbH, PsaN, cytochrome b6f complex and ATP synthase subunits exhibited reduced abundances, PSI light-harvesting complex, and NAD(P)H quinone oxidoreductase (NQO) exhibited in-creased abundances. Among the C assimilation-related proteins, Rubisco activase (RCA), PGK, and GAPDH exhibited increased abundances.
Proteins relevant to starch synthesis (glucose-1-phosphate adenylyl transferase small subunit, AGP1) and starch degradation (alpha-1,4 glucan phosphorylase, GP) were significantly affected by increasing row spacing. Among these proteins, the abundance of AGP1 presented an increase in the flag and penultimate leaves. It decreased for the GP, especially, in the penultimate leaves (Figures 7A,B). Increasing row spacing differed on the starch content in flag and penultimate leaves, which may be related to the changes in the abundances of AGP1 and GP.
Redox-related proteins
Compared with R1, six reactive oxygen species (ROS) scavenging-related proteins and 16 oxidoreductases proteins were identified as DEPs under R2 in the flag and penultimate leaves. Among the ROS scavenging-related proteins, three peroxidases exhibited decreased abundances in the flag leaves. However, all of them showed increased abundances in the penultimate leaves. In the flag and penultimate leaves, superoxide dismutase (SOD) exhibited increased abundance whereas chloroplast glutathione reductase (GR) exhibited increased abundance. Among the oxidoreductases, the abundance of thioredoxin increased in the flag and penultimate leaves, while 9-cis-epoxycarotenoid dioxygenase (NCED9) and pyruvate dehydrogenase E1 (PDE1) decreased in the flag leaves and increased in the penultimate leaves, respectively. In addition, lycopene ε-cyclase (LYC), tocopherol cyclase (TC), and violaxanthin de-epoxidase (VDE) exhibited increased abundance in the flag leaves (Figures 7A,B).
Nitrogen metabolism-related proteins
Proteins relevant to N assimilation and amino acid synthesis were significantly affected by increasing row spacing (Figures 7A,B). Glutamine synthetase (GS2), glutamate synthase (Fd-GOGAT), alanine-2-oxoglutarate aminotransferase (AOAT2), cysteine synthase (CS), and serine hydroxymethyl transferase (SHM) in the penultimate leaves under R2 showed higher abundances than those under R1. However, AOAT2, CS, Ketol-acid reductoisomerase (KARI), and SHM exhibited decreased abundances in the flag leaves.
Effects of increasing row spacing on leaf stomatal parameters
The change of leaf N content also affected leaf stomatal characteristics. Compared with the flag and penultimate leaves under R1, R2 demonstrated 14.64 and 6.91% increases in stomatal density, respectively (Figure 8A). The guard cell length showed an opposite trend to stomatal density, the greater stomatal density meant a shorter guard cell (Figure 8B). It was found that the stomatal aperture increased by 1.52 and 1.84% in the flag and penultimate leaves, respectively, with an increase in the row spacing (Figures 8C,F). The change in stomatal characteristics led to changes in stomatal conductance and intercellular CO2 levels, which were consistent with stomatal aperture (Figures 8D,E). It suggests that increased leaf stomatal conductance is one of the reasons for the improvement of photosynthetic rate and PUE.
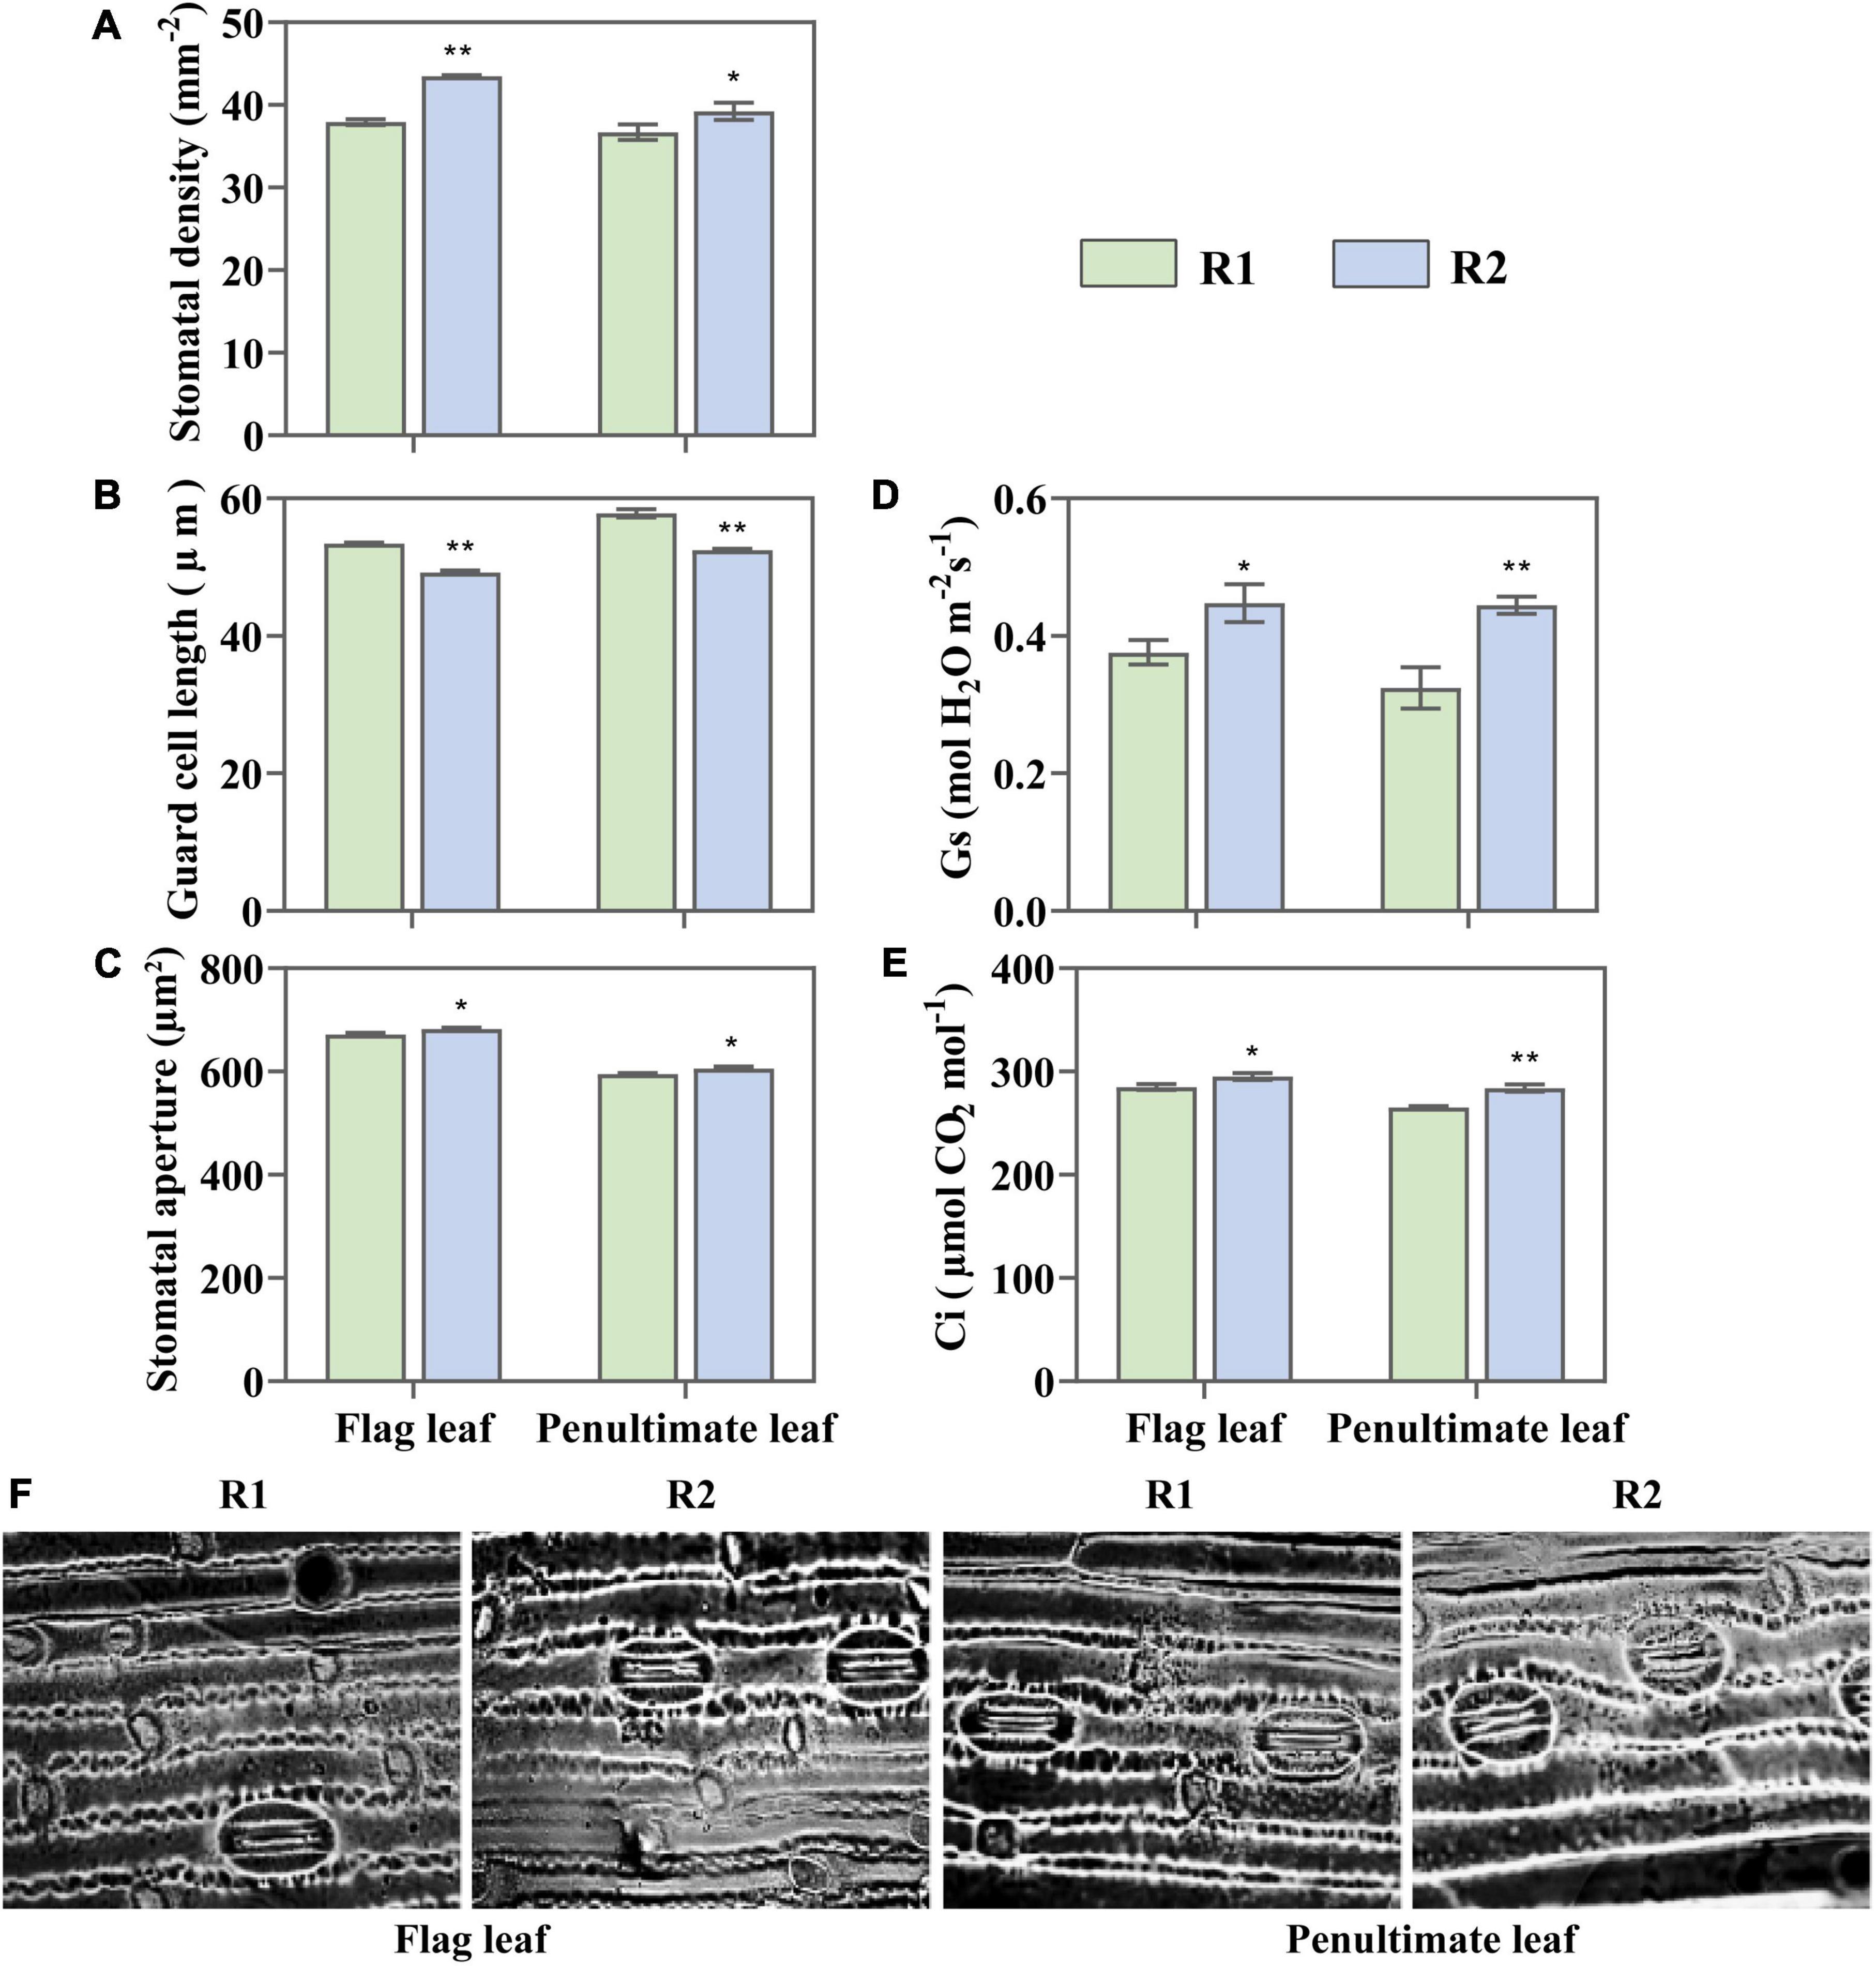
Figure 8. Change in stomatal density (A), guard cell (B), stomatal aperture (C), stomatal conductance (Gs) (D), and intercellular CO2 concentration (Ci) (E) in the flag and penultimate leaves at anthesis under different row spacing treatments. (F) Optical microscopic images of stomata under × 40 objective lens. Results expressed as mean ± standard deviations (SD); Error bars represent SD. Significant differences marked by asterisks (*p < 0.05; **p < 0.01).
Discussion
Changes in light distribution by increasing row spacing revealed favorable condition of greater photosynthetically active radiation–use efficiency
Reasonable row spacing can increase the light capture capacity of crop or/and optimize CLD. It casts an indirect impact on crop photosynthesis and improves PUE (Ding et al., 2021). Hence, adjusting row spacing turns out to be an effective measure to increase the wheat yield. Based on the wheat CLD law of “upper-strong and lower-weak” (Niinemets, 2010), a better strategy to improve crop PUE was presented by reducing the upper-layer light interception and increasing the middle- and lower-layers light interception (Zhu et al., 2010). Increasing row spacing significantly changed CLD without significant changes in total canopy light interception, and the observed changes were mainly observed in the upper and middle layers. The PAR interception reduced in the upper layer and increased in the middle layer, resulting in optimization of CLD. Leaf photosynthesis does not scale linearly with PAR interception, and is saturated for C3 crops when the sunlight reaches one-quarter of maximum sunshine (Long et al., 2006). However, a light interception in the upper layer under R1 exceeded this range. The continuous enlargement of the values would waste resources. Therefore, optimizing the CLD could mitigate the light-saturation of flag leaves and alleviate the resources waste caused by limited light for the penultimate leaves. It provides a better condition for light utilization and yield formation (Richards et al., 2019).
Canopy light distribution is closely associated with the N content of leaves and its allocation. N in the wheat leaf is mainly distributed in Rubisco, chlorophyll, thylakoid protein, and other Calvin cycle enzymes (Duan et al., 2019). In this study, the N uptake efficiency was increased with the optimization of CLD (Supplementary Figure 4), as well as elevated levels of amino acids and proteins allocated to leaves (Figure 4). Additionally, increased leaf N concentration positively affected chlorophyll content and leaf photosynthetic area thereby facilitating photosynthesis (Figure 3). The physiological processes are linked to the underlying proteomic expression, so the photosynthesis is actuated by the chloroplast proteome. CLD externally modulates the expression of chloroplast protein which in turn governs the C and N metabolism (de Luna-Valdez et al., 2014). In the current study, analysis of chloroplast proteomics reveals the molecular basis of altered light utilization of wheat. The changes of chloroplast protein components differed significantly between the flag and penultimate leaves (Figure 5A). The optimized CLD greatly influenced the abundance of chloroplast proteins in the penultimate leaves. The photo reactive components and enzymes involved in the C/N assimilation were changed to suit the light changes, which was an important reason for enhancing PUE and yield (Townsend et al., 2018).
Photosynthetically active radiation–use efficiency is improved by influencing the conversion from light energy to chemical energy with optimized canopy light distribution
The intercepted light is absorbed by photosynthetic pigments, then photosynthesis converts light into chemical energy through the electron transport chain. The adenosine triphosphate (ATP) and nicotinamide adenine dinucleotide phosphate (NADPH) it provides drives C/N assimilation and other metabolic processes (Brody and Emerson, 1959). In the flag leaves, the increased abundance of PSII subunits, and PsaN abundance favored ATP and NADPH generation, which creates conditions for C accumulation. The penultimate leaves are generally in a shaded environment. The flag and penultimate leaves have different light requirements because of their positions (Adam et al., 2000). Optimized CLD increased the light capture ability of penultimate leaves, and decreased the abundance of PSII light-harvesting complex, oxygen-evolving enhancer proteins, reaction center D2 protein, other PSII subunits, PsaN, and cytochrome b6f complex subunit. These findings suggest that the linear electron transport rate was inhibited, and the abundance of photosystem I (PSI) light-harvesting complex was increased. NQO favored the cyclic electron transport pathway and produced more ATP for assimilation, photorespiration, and other metabolic processes. Previous research indicated that PSII is much more sensitive to changed external circumstances and vulnerable to damage compared to PSI which negatively affects photosynthesis (Takahashi and Badger, 2011). Optimized light allocation of PSII and PSI through adjusting the proteins abundance could effectively alleviate or avoid light damage (Tikkanen et al., 2012). Therefore, optimized CLD could improve the light allocation between photosystems by changing their subunits, thereby, coordinating linear and cyclic electron transport to improve electron transport rate.
Moreover, the chloroplast is the major site for ROS generation, and the redox homeostasis in chloroplast could be tuned by a thiol-based redox regulation system and antioxidants (Yu et al., 2020). In this study, redox-related proteins also changed with the increase in row spacing. Additionally, observed redox-related proteins may be critical for maintaining the balance between C and N metabolism (Ancín et al., 2021). So, they could be good candidates for enriching the regulation network of light efficient utilization.
Photosynthetically active radiation–use efficiency is improved by influencing carbon/nitrogen assimilation with optimized canopy light distribution
CO2 is the foundation of C assimilation. Its amount is limited by leaf stomata (Faralli and Lawson, 2020). The flag and penultimate leaves showed an increase in stomatal density and aperture with increasing row spacing, which effectively increased the CO2 concentration at carboxylation sites (Figure 8) and provided ample substrate for C assimilation and avoided excessive light induced by the insufficient dark reaction. Adequate substrate and chemical energy favored the up-regulated expression of enzymes in C assimilation, such as Rubisco. Thus, the photosynthetic rate was markedly improved. Optimized CLD increased the concentrations of total non-structural carbohydrate (soluble sugar and starch). A significant increase in soluble sugars was noticed. These results underlie the translocation of assimilates toward grains (Supplementary Figure 2).
The integrative analysis of the flag and penultimate leaves is an important evaluation strategy
Previously, it was believed that the flag leaves were the major contributor to grain yield (Vilmus et al., 2014). The crop yield was generally positively correlated to the photosynthesis in the flag leaves in high light conditions (Fischer et al., 1998; Reynolds et al., 2000). Recent studies, however, have found that yield of crops has a weak correspondence to the photosynthetic capacity of plant flag leaves and correlated closely with the adaptive changes of leaves under the fluctuating light environment in the field (Driever et al., 2014). Changes in PUE and yield were consistent with the photosynthetic performance of flag leaves. However, the changes in protein and physiological level of the penultimate were more prominent than in the flag leaves. The response of the penultimate leaves to CLD included in the analysis may better explain the changes in PUE and crop yield. Additionally, the flag leaves alone as a research subject for yield prediction have limitations (Salter et al., 2020), and the penultimate leaves make up the second-largest contribution to the yield of grain after the flag leaves in terms of C and N supply. In the field environment, leaves will experience the fluctuation of sunshine and shade areas because of changes in cloud cover, solar altitude, shading from neighboring plants, and wind (Cui et al., 2021). The penultimate leaves, located in the middle canopy layer, exhibited the fitness advantage to changes in the light environment (Townsend et al., 2018). It was found that the CLD change induced by increasing row spacing greatly affects the PAR interception in the middle canopy layer. Chloroplast proteomic analysis also showed that the response of the penultimate leaves to different molecular mechanisms of CLD were the crucial factors in the variation of PUE. Therefore, increasing the accuracy to assess/predict PUE and yield requires the integrated analysis of the flag and penultimate leaves. It should constitute an important strategy for future studies on climate change.
Overall, the response to optimized CLD was mainly reflected in the increased N concentration of leaves and the changed chloroplast proteins abundance of penultimate leaves. Light allocation between photosystems was optimized by reducing the PSII light-harvesting protein abundance, the variety of PSII subunits and upregulating the PSI light-harvesting protein abundance, and the linear and cyclic electron transport were coordinated. These changes favor providing sufficient ATP and NADPH for C and N assimilation. Moreover, the alteration in stomatal characteristics increased the CO2 concentration in leaves. It facilitated the assimilate synthesis to attain gain in PUE and crop yield. Hence, the optimized CLD could improve PUE and yield of wheat under adequate light conditions. It can be buttressed by adaptive changes in carbon and nitrogen assimilation at several integration levels (Figure 9).

Figure 9. The proposed model for the molecular mechanism by which optimized canopy light distribution (CLD) enhances light use efficiency. Optimized CLD increases the leaf nitrogen concentration and changes the leaf nitrogen allocation. The light allocation of penultimate leaves between photosystems was optimized by decreasing the abundance of photosystem II (PS?) light-harvesting proteins and the variety of PSII subunits and increasing the abundance of photosystem I (PSI) light-harvesting proteins. Meanwhile, linear and cyclic electron transport were coordinated. Changes in stomatal characteristics increased CO2 concentration in leaves. With the up-regulated expression of carbon fixation enzymes, soluble sugar accumulation was promoted, facilitating the transport of assimilates to the developing grains and increasing photosynthetically active radiation (PAR)–use efficiency (PUE) and yield. Panel ① is the optimized direction of CLD. Panel ② is the nitrogen assimilation process. Panel ③ is the photosynthetic electron transport chain, where the blue lines are linear electron transport and the red lines are cyclic electron transport. Panel ④ is the stomatal characteristics and leaf CO2 concentration. Panel ⑤ is the carbon assimilation.
Conclusion
In summary, increasing spacing optimized the wheat CLD, which increased the leaf nitrogen content. The leaf chlorophyll content was also increased and protein components in the chloroplast changed. It improved the photosynthetic rate of leaves and increased the biomass. This mechanism led to an improved wheat light use efficiency and yield. This is the first study that reveals the mechanisms of PUE enhancement by optimized CLD using a combination with of morphology, physiology, and chloroplast proteomics. This research work lays the foundation to develop wheat varieties having high PUE and yield efficient cultivation strategies.
Data availability statement
The mass spectrometry proteomics data have been deposited to the ProteomeXchange Consortium (http://proteomecentral.proteomexchange.org) via the iProX partner repository with the dataset identifier: PXD036755.
Author contributions
XW and XM: conceptualization and methodology. JZ, RC, QW, and FN: investigation. JZ and ZZ: formal analysis and writing – original draft preparation. XW, YW, and SX: writing – review and editing. All authors have read and agreed to the published version of the manuscript.
Funding
This work was supported by the National Natural Science Foundation of China (Project No. 32071956) and the Modern Agricultural Technology System in Henan province (Project No. S2010-01-G04).
Conflict of interest
The authors declare that the research was conducted in the absence of any commercial or financial relationships that could be construed as a potential conflict of interest.
Publisher’s note
All claims expressed in this article are solely those of the authors and do not necessarily represent those of their affiliated organizations, or those of the publisher, the editors and the reviewers. Any product that may be evaluated in this article, or claim that may be made by its manufacturer, is not guaranteed or endorsed by the publisher.
Supplementary material
The Supplementary Material for this article can be found online at: https://www.frontiersin.org/articles/10.3389/fevo.2022.1023117/full#supplementary-material
Footnotes
References
Adam, N. R., Wall, G. W., Kimball, B. A., Pinter, P. J., LaMorte, R. L., Hunsaker, D. J., et al. (2000). Acclimation response of spring wheat in a free-air CO2 enrichment (FACE) atmosphere with variable soil nitrogen regimes. 1. Leaf position and phenology determine acclimation response. Photosynthesis Res. 66, 65–77. doi: 10.1023/A:1010629407970
Ancín, M., Larraya, L., Florez-Sarasa, I., Bénard, C., Fernández-San Millán, A., Veramendi, J., et al. (2021). Overexpression of thioredoxin m in chloroplasts alters carbon and nitrogen partitioning in to-bacco. J. Exp. Bot. 72, 4949–4964. doi: 10.1093/jxb/erab193
Brody, M., and Emerson, R. (1959). The effect of wavelength and intensity of light on the proportion of pigments in Porphyridium cruentum. Am. J. Bot. 46, 433–440. doi: 10.1002/j.1537-2197.1959.tb07034.x
Cui, S., Pei, X., Jiang, Y., Wang, G., Fan, X., Yang, Q., et al. (2021). Liquefaction within a bedding fault: Understanding the initiation and movement of the Daguangbao landslide triggered by the 2008 Wenchuan Earthquake (Ms = 8.0). Eng. Geol. 295:106455. doi: 10.1016/j.enggeo.2021.106455
de Luna-Valdez, L. A., Martinez-Batallar, A. G., Hernandez-Ortiz, M., Encarnacion-Guevara, S., Ramos-Vega, M., Lopez-Bucio, J. S., et al. (2014). Proteomic analysis of chloroplast biogenesis (clb) mutants uncovers novel proteins potentially involved in the development of Arabidopsis thaliana chloroplasts. J. Proteomics 111, 148–164. doi: 10.1016/j.jprot.2014.07.003
Ding, D., Wang, N., Zhang, X., Zou, Y., Zhao, Y., Xu, Z., et al. (2021). Quantifying the interaction of water and radiation use efficiency under plastic film mulch in winter wheat. Sci. Total Environ. 794:148704. doi: 10.1016/j.scitotenv.2021.148704
Driever, S. M., Lawson, T., Andralojc, P. J., Raines, C. A., and Parry, M. A. (2014). Natural variation in photosynthetic capacity, growth, and yield in 64 field-grown wheat genotypes. J. Exp. Bot. 65, 4959–4973. doi: 10.1093/jxb/eru253
Duan, J. Z., Wu, Y., Zhou, Y., Ren, X. X., Shao, Y. H., Feng, W., et al. (2018). Approach to higher wheat yield in the Huang-Huai Plain: Improving post-anthesis productivity to increase harvest index. Front. Plant Sci. 9:1457. doi: 10.3389/fpls.2018.01457
Duan, J., Shao, Y., He, L., Li, X., Hou, G., Li, S., et al. (2019). Optimizing nitrogen management to achieve high yield, high nitrogen efficiency and low nitrogen emission in winter wheat. Sci. Total Environ. 697:134088. doi: 10.1016/j.scitotenv.2019.134088
Faralli, M., and Lawson, T. (2020). Natural genetic variation in photosynthesis: An untapped resource to increase crop yield potential? Plant J. 101, 518–528. doi: 10.1111/tpj.14568
Fischer, R. A., Rees, D., Sayre, K. D., Lu, Z. M., Condon, A. G., and Saavedra, A. L. (1998). Wheat yield progress associated with higher stomatal conductance and photosynthetic rate, and cooler canopies. Crop Sci. 38, 1467–1475. doi: 10.2135/cropsci1998.0011183X003800060011x
Furbank, R. T., Jimenez-Berni, J. A., George-Jaeggli, B., Potgieter, A. B., and Deery, D. M. (2019). Field crop phenomics: Enabling breeding for radiation use efficiency and biomass in cereal crops. New Phytol. 223, 1714–1727. doi: 10.1111/nph.15817
Gao, L., Wang, X. F., Li, Y. F., and Han, R. (2019). Chloroplast proteomic analysis of Triticum aestivum L. seedlings responses to low levels of UV-B stress reveals novel molecular mechanism associated with UV-B tolerance. Environ. Sci. Pollut. Res. 26, 7143–7155. doi: 10.1007/s11356-019-04168-4
Gu, Y. Q., Li, G., Sun, Y. T., Luo, W. H., Liu, X., Zhang, W., et al. (2017). The effects of global dimming on the wheat crop grown in the Yangtze Basin of China simulated by SUCROS_LL, a process-based model. Ecol. Model. 350, 42–54. doi: 10.1016/j.ecolmodel.2017.02.009
Gupta, U. C., and MacLeod, L. B. (1970). Response to copper and optimum levels in wheat, barley and oats under greenhouse and field conditions. Can. J. Soil Sci. 50, 373–378. doi: 10.4141/cjss70-049
Kang, G. Z., Wang, Y. H., Liu, C., Shen, B. Q., Zheng, B. B., Feng, W., et al. (2010). Difference in AGPase subunits could be associated with starch accumulation in grains between two wheat cultivars. Plant Growth Regul. 61, 61–66. doi: 10.1007/s10725-010-9450-4
Lande, N. V., Subba, P., Barua, P., Gayen, D., Keshava Prasad, T. S., Chakraborty, S., et al. (2017). Dissecting the chloroplast proteome of chickpea (Cicer arietinum L.) provides new insights into classical and non-classical functions. J. Proteomics 165, 11–20. doi: 10.1016/j.jprot.2017.06.005
Li, D. D., Tian, M. Y., Cai, J., Jiang, D., Cao, W. X., and Dai, T. B. (2013). Effects of low nitrogen supply on relationships between photosynthesis and nitrogen status at different leaf position in wheat seedlings. Plant Growth Regul. 70, 257–263. doi: 10.1007/s10725-013-9797-4
Li, Y., Yang, C., Zhang, Z. S., Zhao, S., and Gao, H. (2021). Photosynthetic acclimation strategies in response to intermittent exposure to high light intensity in wheat (Triticum aestivum L.). Environ. Exp. Bot. 181:104275. doi: 10.1016/j.envexpbot.2020.104275
Li, Z. M., Song, Z. L., Parr, J. F., and Wang, H. L. (2013). Occluded C in rice phytoliths: Implications to biogeochemical carbon sequestration. Plant Soil 370, 615–623. doi: 10.1007/s11104-013-1661-9
Liu, X., Wang, W. X., Lin, X., Gu, S. B., and Wang, D. (2020). The effects of intraspecific competition and light transmission within the canopy on wheat yield in a wide-precision planting pattern. J. Integr. Agric. 19, 1577–1585. doi: 10.1016/S2095-3119(19)62724-3
Long, S. P., Zhu, X. G., Naidu, S. L., and Ort, D. R. (2006). Can improvement in photosynthesis increase crop yields? Plant Cell Environ. 29, 315–330. doi: 10.1111/j.1365-3040.2005.01493.x
Meng, X. D., Wang, X. C., Zhang, Z. Y., Xiong, S. P., Wei, Y. H., Guo, J. B., et al. (2021). Transcriptomic, proteomic, and physiological studies reveal key players in wheat nitrogen use efficiency under both high and low nitrogen supply. J. Exp. Bot. 72, 4435–4456. doi: 10.1093/jxb/erab153
Miller, M. A. E., O’Cualain, R., Selley, J., Knight, D., Karim, M. F., Hubbard, S. J., et al. (2017). Dynamic acclimation to high light in Arabidopsis thaliana involves widespread reengineering of the leaf proteome. Front. Plant Sci. 8:1239. doi: 10.3389/fpls.2017.01239
Murchie, E. H., and Burgess, A. J. (2022). Casting light on the architecture of crop yield. Crop Environ. 1, 74–85. doi: 10.1016/j.crope.2022.03.009
Niedermaier, S., Schneider, T., Bahl, M. O., Matsubara, S., and Huesgen, P. F. (2020). Photoprotective acclimation of the Arabidopsis thaliana leaf proteome to fluctuating light. Front. Genet. 11:154. doi: 10.3389/fgene.2020.00154
Niinemets, Ü (2010). A review of light interception in plant stands from leaf to canopy in different plant functional types and in species with varying shade tolerance. Ecol. Res. 25, 693–714. doi: 10.1007/s11284-010-0712-4
Nunes-Nesi, A., Fernie, A. R., and Stitt, M. (2010). Metabolic and signaling aspects underpinning the regulation of plant carbon nitrogen interactions. Mol. Plant 3, 973–996. doi: 10.1093/mp/ssq049
Peake, A. S., Bell, K. L., Fischer, R. A., Gardner, M., Das, B. T., Poole, N., et al. (2020). Cultivar × management interaction to reduce lodging and improve grain yield of irrigated spring wheat: Optimising plant growth regulator use, N application timing, row spacing and sowing date. Front. Plant Sci. 11:401. doi: 10.3389/fpls.2020.00401
Piao, L., Qi, H., Li, C. F., and Zhao, M. (2016). Optimized tillage practices and row spacing to improve grain yield and matter transport efficiency in intensive spring maize. Field Crops Res. 198, 258–268. doi: 10.1016/j.fcr.2016.08.012
Reynolds, M. P., Delgado, B. M. I., Gutiérrez-Rodrıìguez, M., and Larqué-Saavedra, A. (2000). Photosynthesis of wheat in a warm, irrigated environment: I: Genetic diversity and crop productivity. Field Crops Res. 66, 37–50. doi: 10.1016/S0378-4290(99)00077-5
Richards, R. A., Cavanagh, C. R., and Riffkin, P. (2019). Selection for erect canopy architecture can increase yield and biomass of spring wheat. Field Crops Res. 244:107649. doi: 10.1016/j.fcr.2019.107649
Salter, W. T., Merchant, A., Trethowan, R. M., Richards, R. A., and Buckley, T. N. (2020). Wide variation in the suboptimal distribution of photosynthetic capacity in relation to light across genotypes of wheat. AoB Plants 12:laa039. doi: 10.1093/aobpla/plaa039
Shao, L. P., Li, G., Zhao, Q. N., Li, Y. B., Sun, Y. T., Wang, W. N., et al. (2019). The impact of global dimming on crop yields is determined by the source–sink imbalance of carbon during grain filling. Glob. Change Biol. 26, 1697–1713. doi: 10.1111/gcb.15453
Takagi, D., Ihara, H., Takumi, S., and Miyake, C. (2019). Growth light environment changes the sensitivity of photosystem I pho-toinhibition depending on common wheat cultivars. Front. Plant Sci. 10:686. doi: 10.3389/fpls.2019.00686
Takahashi, S., and Badger, M. R. (2011). Photoprotection in plants: A new light on photosystem II damage. Trends Plant Sci. 16, 53–60. doi: 10.1016/j.tplants.2010.10.001
Taylor, N. L., Tan, Y. F., Jacoby, R. P., and Millar, A. H. (2009). Abiotic environmental stress induced changes in the Arabidopsis thaliana chloroplast, mitochondria and peroxisome proteomes. J. Proteomics 72, 367–378. doi: 10.1016/j.jprot.2008.11.006
Tikkanen, M., Grieco, M., Nurmi, M., Rantala, M., Suorsa, M., and Aro, E. M. (2012). Regulation of the photosynthetic apparatus under fluctuating growth light. Philos. Trans. R. Soc. B 367, 3486–3493. doi: 10.1104/pp.109.150250
Townsend, A. J., Retkute, R., Chinnathambi, K., Randall, J. W. P., Foulkes, J., Carmo-Silva, E., et al. (2018). Suboptimal acclimation of photosynthesis to light in wheat canopies. Plant Physiol. 176, 1233–1246. doi: 10.1104/pp.17.01213
Vilmus, I., Ecarnot, M., Verzelen, N., and Roumet, P. (2014). Monitoring nitrogen leaf resorption kinetics by near-infrared spec-troscopy during grain filling in durum wheat in different nitrogen availability conditions. Crop Sci. 54, 284–296. doi: 10.2135/cropsci2013.02.0099
Wang, L., Deng, F., and Ren, W. J. (2015). Shading tolerance in rice is related to better light harvesting and use efficiency and grain filling rate during grain filling period. Field Crops Res. 180, 54–62. doi: 10.1016/j.fcr.2015.05.010
Wei, Y. H., Shi, A. B., Jia, X. T., Zhang, Z. Y., Ma, X. M., Gu, M. X., et al. (2018). Nitrogen supply and leaf age affect the expression of TaGS1 or TaGS2 driven by a constitutive promoter in transgenic tobacco. Genes (Basel) 9, 406–424. doi: 10.3390/genes9080406
Wei, Z., Duan, F., Sun, X., Song, X., and Zhou, W. (2021). Leaf photosynthetic and anatomical insights into mechanisms of acclimation in rice in response to long-term fluctuating light. Plant Cell Environ. 44, 747–761. doi: 10.1111/pce.13954
Wu, H. C., Huang, Y. C., Liu, C. H., and Jinn, T. L. (2017). Using silicon polymer impression technique and scanning electron mi-croscopy to measure stomatal aperture, morphology, and density. Bio Protoc. 7:e2449. doi: 10.21769/BioProtoc.2449
Wu, L., and Ou-Yang, Z. (2014). Effects of row spacing and seeding rate on radiation use efficiency and grain yield of wheat. Chin. J. Eco Agric. 22, 31–36. doi: 10.3724/SP.J.1011.2014.30568
Ye, Z. P., Suggett, D. J., Robakowski, P., and Kang, H. J. (2013). A mechanistic model for the photosynthesis-light response based on the photosynthetic electron transport of photosystem II in C3 and C4 species. New Phytol. 199, 110–120. doi: 10.1111/nph.12242
Yemm, E. W., and Willis, A. J. (1954). The estimation of carbohydrates in plant extracts by anthrone. Biochem. J. 57, 508–514. doi: 10.1042/bj0570508
Yu, J., Li, Y., Qin, Z., Guo, S., Li, Y., Miao, Y., et al. (2020). Plant chloroplast stress response: Insights from thiol redox proteomics. Antioxid. Redox Signal. 33, 35–57. doi: 10.1089/ars.2019.7823
Zhang, M., Zhao, J., Li, W. Y., Wen, S. Q., Huang, H. L., Dong, J., et al. (2021). In-creased photosystem II translation efficiency as an important photoprotective mechanism in an Arabidopsis thaliana ecotype (Tibet-0) adapted to high light environments. Environ. Exp. Bot. 183:104350. doi: 10.1016/j.envexpbot.2020.104350
Keywords: chloroplast proteomic analysis, canopy light distribution, iTRAQ, photosynthetically active radiation (PAR)–use efficiency (PUE), molecular mechanism
Citation: Zhang J, Zhang Z, Neng F, Xiong S, Wei Y, Cao R, Wei Q, Ma X and Wang X (2022) Canopy light distribution effects on light use efficiency in wheat and its mechanism. Front. Ecol. Evol. 10:1023117. doi: 10.3389/fevo.2022.1023117
Received: 19 August 2022; Accepted: 15 September 2022;
Published: 06 October 2022.
Edited by:
Rajesh Singhal, Indian Grassland and Fodder Research Institute (ICAR), IndiaReviewed by:
Udit Nandan Mishra, Sri Sri University, IndiaJyoti Chauhan, Banaras Hindu University, India
Copyright © 2022 Zhang, Zhang, Neng, Xiong, Wei, Cao, Wei, Ma and Wang. This is an open-access article distributed under the terms of the Creative Commons Attribution License (CC BY). The use, distribution or reproduction in other forums is permitted, provided the original author(s) and the copyright owner(s) are credited and that the original publication in this journal is cited, in accordance with accepted academic practice. No use, distribution or reproduction is permitted which does not comply with these terms.
*Correspondence: Xiaochun Wang, eGlhb2NodW53YW5nQGhlbmF1LmVkdS5jbg==; Xinming Ma, bWF4aW5taW5nQGhlbmF1LmVkdS5jbg==
†These authors have contributed equally to this work