 Na Huang
 Yu Song
- College of Resources and Environmental Sciences, China Agricultural University, Beijing, China
Global climate change has adversely affected agricultural production. Identifying the climatic threshold is critical to judge the impact and risk of climate change and proactively adapt agriculture. However, the climatic threshold of agriculture, especially crop production, remains unclear. To bridge this gap, taking winter wheat production from 1978 to 2017 in China as an example, this study clarified the definition of the climatic threshold of crop production and calculated it based on a mechanism model considering multiple factors and their synergies. The results showed that (1) the climate presented a warmer and wetter trend from 1978 to 2017, especially after 1996. (2) Water, fertilizer, and winter wheat yields increased significantly (22.4 mm/decade, 96.4 kg/ha·decade, and 674.2 kg/ha·decade, respectively, p < 0.01). (3) The average optimal temperature and water thresholds for winter wheat were 7.3°C and 569 mm, respectively. The temperature rise was unfavorable for winter wheat production, and the water supply increase was beneficial to winter wheat production. (4) Increasing irrigation and fertilization could raise the optimal temperature threshold and adapt to climate warming in most provinces, while Shandong and Shaanxi both needed to reduce fertilization. We established a generalized method for calculating the climatic threshold of agricultural production and found that multifactor synergistic effects could influence the climatic threshold. The climatic threshold of winter wheat changed with different adaptation levels. However, considering the limitations in resource availability and environmental capacity, increasing the use efficiency of water and fertilizer is more important for adapting to climate change in the future.
Introduction
The global average surface temperature has risen by approximately 1.1°C since 1850–1900, and the average global temperature is expected to reach or exceed 1.5°C over the next 20 years (IPCC, 2021). Future changes associated with climate change and population growth will present additional challenges for food security and social stability (Hong et al., 2019; Palmer and Stevens, 2019). Weather and climate are the main drivers and the dominant factors in the overall variability of agricultural production (Selvaraju et al., 2011; Selvaraju, 2012; Benton et al., 2017), and thus the impact of climate change on agriculture has become a hot issue. A prerequisite for quantifying the impact of climate change is identifying the thresholds of climate impact on agriculture, answering the question “To what extent is climate change detrimental to agricultural production?” Although many studies using crop models and statistical methods have proven that climate change has already harmed agriculture and has reduced cereal yield (Liu et al., 2007; Asseng et al., 2015; Wang et al., 2016; Zhao et al., 2017; Tito et al., 2018), the thresholds of climate impact on agricultural production has not be clearly clarified.
The concept of “threshold” was first used in ecology in the 1970s and is an indicator that can judge how external pressure affects the receptor system (Holling, 1973; May, 1977; Walker and Meyers, 2004; Lenton et al., 2008; Fagre et al., 2009). Once a change exceeds its threshold, it is likely to signal entry into a state of large-scale risk and uncertainty (Huggett, 2005; Foley et al., 2015; van Nes et al., 2016; Dakos et al., 2019). Similar to the ecological threshold, the climatic threshold refers to the value of climatic factors at the threshold where the system changes from one state to another (Groffman et al., 2006). In climate change, the climatic threshold can link the climate state to its ecological impact (Kriegler et al., 2009; Cai et al., 2016; Lenton et al., 2019). To clarify the magnitude and extent of this impact, research on the climatic threshold has very important theoretical and practical significance. Although adaptation to climate change is urgently needed, the adaptation mechanism has not been fully clarified until now. The climatic threshold is the lower limit at which adaptation or increased adaptation may be required (Dong et al., 2019). Hence, by clarifying the climatic threshold, we can minimize damage or maximize the opportunity to achieve the purpose of adapting to climate change.
Although the term “climatic threshold” has not been used before, there are many concepts related to the climate threshold in agriculture, such as the three-basepoint temperature (i.e., the minimum temperature, the optimum temperature, and the maximum temperature), the boundary temperature for crop planting, and the growing degree days (Walck et al., 2011; Dürr et al., 2015; Wei et al., 2015). These climate-related thresholds determine the planting structure and layout of agriculture and are the theoretical basis of crop models (Peter et al., 2011). Recently, climate-related thresholds have been mentioned in assessments of the impact of climate change on crop production, and it was found that climate change has already exceeded the climatic threshold for crop production (Alley et al., 2003; Naylor et al., 2007; Greiner et al., 2010; Trubovitz et al., 2020). Some studies have found that biophysical climatic thresholds differ between crop types (Schlenker and Roberts, 2009; Lobell et al., 2011b; Dong et al., 2019), and several critical temperature thresholds exist for each crop (Haji Bungsu, 2014; Tack et al. 2015; Hsuan et al., 2019). Some further found that irrigation could alleviate the adverse effects of extremely high temperatures, especially for spring wheat and soybeans (Tack et al., 2017; Li J. et al., 2019; Vogel et al., 2019). Moreover, the threshold for climate change impacts can be raised by adaptation (Dhankher and Foyer, 2018). Knowing the climatic threshold of agriculture and its critical influencing factors, we can find ways to delay reaching the threshold or to adjust it. However, it is not clear how to calculate the climatic threshold. Therefore, more effort should be made to characterize and anticipate the critical climate thresholds through a reliable and trusted approach.
Wheat is the most widely distributed cereal globally, and its sown area is the largest (Acevedo et al., 2002). Wheat production accounts for 1/3 of global grain production, and it is one of the three major global cereal crops. China is the leading wheat-producing country, and winter wheat occupies a critical position there (Geng et al., 2019). The growth and development of winter wheat have special climatic requirements, and it is more significantly affected by climate change (Song et al., 2005; Trnka et al., 2014; Kahiluoto et al., 2019). Therefore, it is essential to the food security of China and the world that winter wheat production actively adapts to the warming climate.
Consequently, we take winter wheat production in China as a representative to explore the climatic threshold and its relationship with climate change. In detail, this paper aimed to (1) define the critical threshold for crop production based on the impact mechanism of factors on crop yield, (2) calculate the climatic threshold of winter wheat yield based on the multifactor synergy model, (3) determine the relationship between the climatic threshold of winter wheat and climate change, and (4) explore how winter wheat production can adapt to climate change. We hope to establish standardized processes and methods for calculating the climatic thresholds for different crops and provide a theoretical basis for exploring how agricultural production can actively adapt to climate change.
Data, theory, and method
Study area and data source
Study area
The main wheat-producing areas of China (Figure 1) are chosen as the study area, including Anhui Province, Hebei Province, Henan Province, Hubei Province, Jiangsu Province, Shandong Province, Shanxi Province, Shaanxi Province, and Sichuan Province. The study area is located in the temperate and subtropical zone of the Northern Hemisphere (25–41°N), influenced by the East Asian monsoon climate. The growing season of winter wheat is from October to May, we assume the growing season of winter wheat is the same in all provinces.
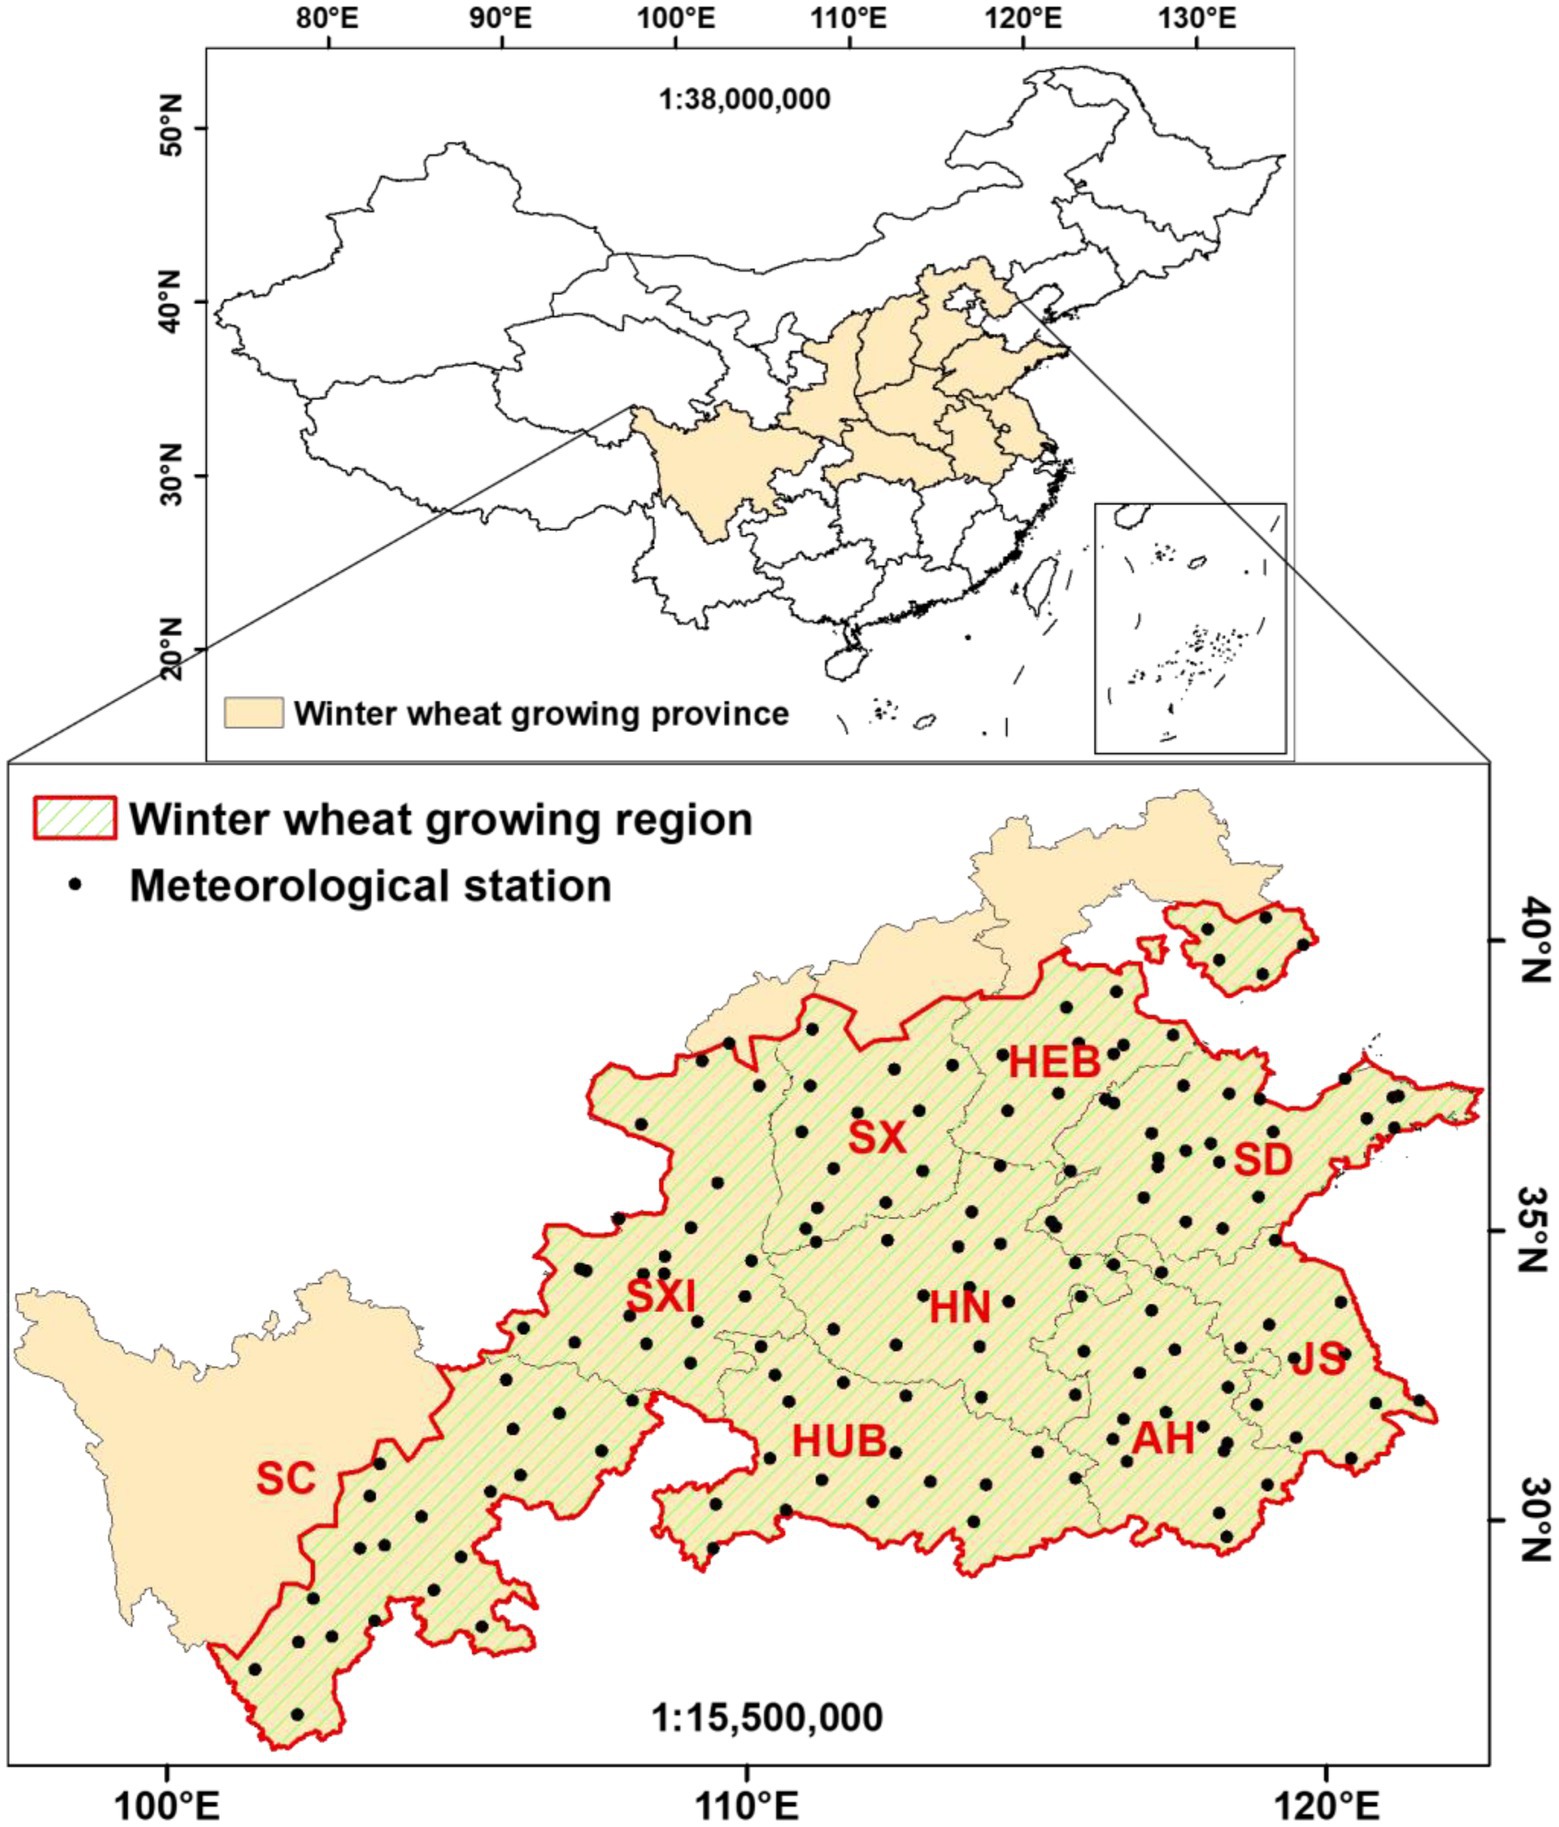
Figure 1. The study area (HEB, Hebei; SD, Shandong; SX, Shanxi; SXI, Shaanxi; HN, Henan; SC, Sichuan; HUB, Hubei; AH, Anhui; JS, Jiangsu).
Data source
This study used provincial panel data. Winter wheat yield data came from the National Bureau of Statistics of China.1 There is province-level fertilizer use rate (scalar of chemical fertilizer) for winter wheat on the Compilation of Cost and Income Data of National Agricultural Products from 2002 to 2017, we assume the trend of winter wheat fertilizer use rate is same as the total fertilizer use rate (Cao et al., 2018), and gap-fill the missing of fertilizer use rate before 2002 using Equation (1). The irrigation data were estimated by the research results focused on the irrigation water demand of on winter wheat (Cao et al., 2008; Li et al., 2020; Zhang et al., 2021). The meteorological data were from the China Meteorological Data Sharing Service Network,2 including daily temperature (°C) and precipitation (mm) data during winter wheat growing seasons from 1978 to 2017 in China. The study area includes ground climate data from 152 meteorological stations, and we use average of the stations in the region as the provincial meteorological data.
where Raw FUR refers to the raw fertilizer use rate for winter wheat that contains missing values, “Reference trend” refers to the complete total crop fertilizer use rate from which we extracted the changing trend that winter wheat fertilizer use rate can refer to, and i refers to the missing data years.
Climatic thresholds of crop production
To define the climate-related thresholds for crop production, it is necessary to accurately understand the relationship between factor inputs and crop production. Crop growth, development, and yield formation require particular factor inputs. The crop yield level is the most direct and final reflection of the interaction between crop growth and environmental conditions; the yield level is also closely related to the amount of factor input (Fischer, 2015; Wei et al., 2016; Li S. et al., 2019). The agricultural system is highly affected by human activities, and crop production is restricted by various factors (including natural and artificial factors) (Lv et al., 2013; Xiao and Tao, 2014; Liu et al., 2018). Appropriate environmental conditions can ensure crop growth and yield accumulation, while extreme conditions can damage crop tissues and organs, delay crop growth and development or hinder flowering and fruiting, resulting in reduced yields (Wei et al., 2015). In the past, a significant inverted “U”-shaped quadratic function was often used to describe the relationship between the input of each influencing factor and the crop yield level (Wei et al., 2014; Yu et al., 2021). However, the relationship between factor input and crop yield is more complicated (as shown in Figure 2).
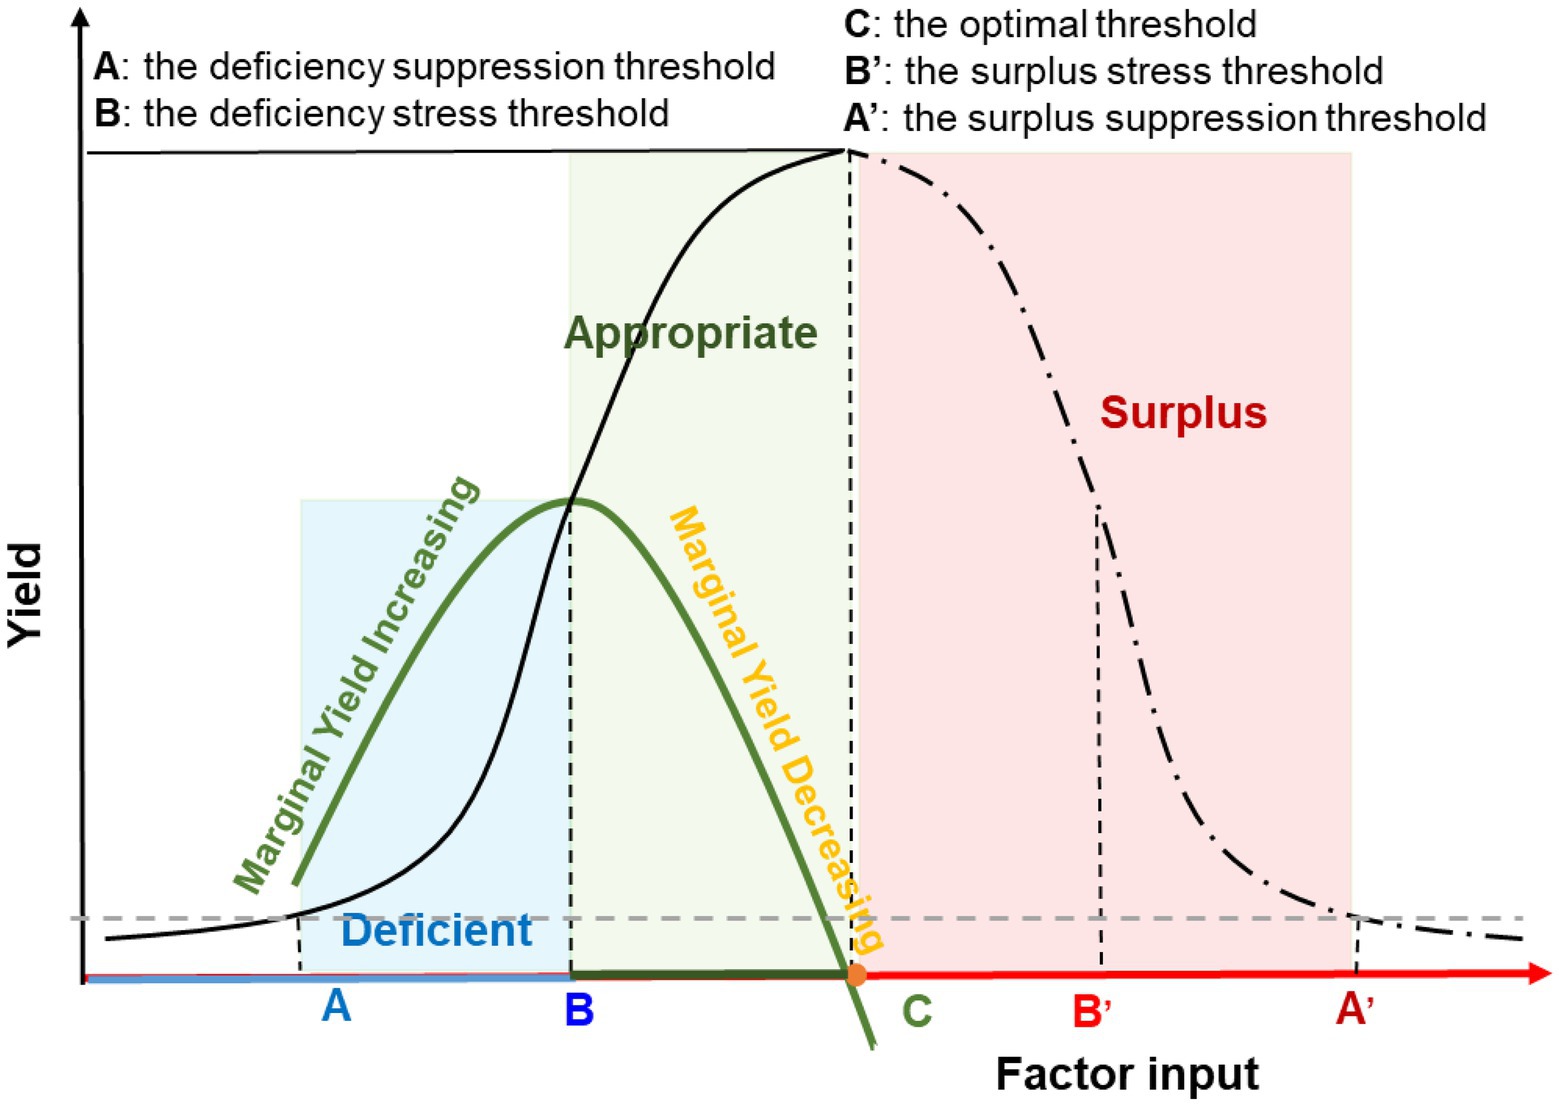
Figure 2. Schematic diagram of the climatic threshold of crop yield.
In Figure 2, the black curve represents the change in crop yield with an increase in factor inputs, and the green curve represents the change in marginal yield per unit of factor input. There are three ranges in the impact of factor inputs on crop yields. (1) The deficit range (the blue shaded section in Figure 2) is the stage where insufficient factor inputs limit the crop yield. (2) The appropriate range (the green shaded section in Figure 2) is the stage where appropriate factor inputs increase the crop yield. (3) The surplus range (the red shaded section in Figure 2) is the stage where superfluous factor inputs inhibit crop yield (Wei et al., 2015). Correspondingly, there are different climate thresholds in each range. There are symmetry points: A -- the deficiency suppression threshold, A’ -- the surplus suppression threshold, B -- the deficiency stress threshold, B′ -- the surplus stress threshold, and C -- the optimal threshold (Figure 2). Point A is the initial factor input level at which the crops obtain yield. Below A, the crop can grow but no yield is produced. Therefore, point A is the lower limit below which crop yields are suppressed due to a deficiency in factors. When the factor input exceeds point A’, too much input will mean that the crop is unable to deliver any yield; thus, point A’ is the upper limit above which crop yields are suppressed due to factor surplus. Points B and B′ are the stress thresholds below or above which the increase in crop yield and the utilization of factors begin to be stressed, respectively. Within the deficit range, the factor utilization and the marginal yield of the factor rapidly increase with the increase in the factor input, and the marginal yield of the factor is the highest when the factor input reaches point B. That is, the growth rate of crop yield is the largest at this point. Therefore, point B is the upper limit of crop yield under stress due to factor deficit. If the factor input is beyond point B, the marginal yield of the factor turns from increasing to decreasing, and crop yields and the utilization efficiency of factors slowly rise. Therefore, point B is also a lower limit of the appropriate range. When the factor input increases to point C, the marginal yield of the factor drops to 0, and the utilization of the factor and the crop yield are the highest. Then, the marginal yield becomes negative as the factor input increases, which will cause the crop yield to drop rapidly. Many studies have found that with climate change and other factor inputs, the growth rate of crop yields is declining in China (Fan et al., 2012; Ortiz-Bobea et al., 2021). To the right of point B, the climate and input levels are in the appropriate range. Theoretically, when the factor input exceeds point C, it enters the excess range. There are also two stages: when the factor input increases from C to B′, crop yields begin to slow down (there is a resilience range for changes in crop yield due to factors), and after Point B′, the increase in factors will cause crop yields to decline rapidly and will completely inhibit crop yield formation after point A’.
The process for calculating the climatic thresholds
According to the definition of the climatic threshold and referring to Dong et al. (2019) regarding the impact threshold of climate change on agriculture, five steps for calculating the climatic threshold of winter wheat yield are presented here:
Determine the climate change period
Precipitation change causes interannual fluctuations in crop yields. However, the change trend in temperature has a far more significant impact on crop yields than the change trend in precipitation (Lobell et al., 2011a). Therefore, we took temperature as the climatic factor to highlight climate change and used the M-K test to find the mutation point in the temperature from 1978 to 2017. The period before the mutation point is defined as the basic period during which fluctuations dominate the climate, while the period after the mutation point is the change period during which the climate changes with a trend.
Establish the yield equation
Based on 2.2, the crop yield results from the combined action of natural and human factors, and the various factors influence each other. Light, temperature, water, air, and nutrients are the foundations of agricultural production. The requirements for these foundations vary widely among different crops, which determined by genetics. Assuming there is sufficient light and CO2, temperature and water will limit crop yield formation and levels. More specifically, temperature determines the planting boundaries of winter wheat, and water is a crucial factor limiting winter wheat production in most of China. In addition to natural precipitation, irrigation is an important water source for winter wheat production (Hu et al., 2014; Tack et al., 2017). Chemical fertilizer is the primary source of nutrient for winter wheat, the amount of fertilizer will affect its yield and quality (Wang et al., 2012). Therefore, we established the equation fitting winter wheat yield using the data from 178 to 2017 as follows.
where, 𝑙𝑛𝑌𝑡 is the natural logarithm of the actual crop yield in year t, and ε is the residual error. T is the average temperature during the growing season (°C). F is the crop-specific fertilizer supply for winter wheat (kg/ha). a1 ~ a5 are the coefficients. W is the water supply, including precipitation and irrigation, during the growing season (mm).
Calculation of the optimal climate threshold for winter wheat production
According to the definition of the optimal threshold for agricultural production, the optimal climate threshold for winter wheat yield is the value of the climatic factor when the first derivative of Equation (2) to this climatic factor equals zero. The calculation equation is as follows:
where, W is the water supply, including irrigation and precipitation, so the optimal precipitation threshold should subtract the irrigation from W.
Calculation of the climatic stress threshold for winter wheat production
When the actual climatic conditions are lower or higher than the optimal threshold calculated in step (3), we can further determine whether the impact of climatic conditions on winter wheat yield is in the deficit or surplus range. According to points B and B′ in Figure 2 and the definition of the stress threshold, the climatic stress threshold of winter wheat yield is the climatic factor value when the second derivative of Equation (2) for this climatic factor equals zero. Therefore, the calculation equation is as follows:
Equations (5) and (6) can provide two values of T and W, respectively. Point B corresponds to the upper limit of the stress climatic threshold caused by factor deficiency. Therefore, it should be less than the optimal threshold. On the other hand, point B′ corresponds to the lower limit of the climatic stress threshold caused by the surplus of factors, and should therefore be greater than the optimal threshold. Thus, it is deficient when the actual climatic condition is less than B, it is appropriate when the actual climatic condition is more than B and less than C, and it is surplus when the actual climatic condition is more than B′.
Calculation of the climatic suppression threshold for winter wheat production
Based on its definition, the climatic suppression threshold is the climatic factor value when the third derivative of Equation (2) to this climatic element equals zero. The equation is as follow:
According to Figure 2, the deficit suppression threshold of crop yield should be lower than B, and the surplus suppression climatic threshold of crop yield should be higher than B′.
In this study, we focused on the adaptation to current and future climate change. Therefore, all calculations in this study were conducted considering how to adapt to the impact of climate change on winter wheat production by adjusting environmental conditions. It is worth noting that the climatic suppression threshold calculated based on Equations (7) and (8) is the lower and upper limits below or beyond which crops cannot normally grow and develop to provide yield. The climatic suppression threshold is already beyond the scope of adaptation. Therefore, we would not analyze the suppression threshold in this study.
Results
Climate change during the growing season of winter wheat
According to the Mann-Kendall mutation test, the mutation in the temperature trend for the winter wheat growing season from 1978 to 2017 occurred in 1996 (p < 0.05) Supply materials (Figure 1). Thus, the period from 1978 to 1995 was the base period when climate fluctuations dominated the climate, and the period from 1996 to 2017 was the change period when the climate showed a warming trend.
The average temperature was 9°C and presented a significantly increasing trend (0.39°C/decade, p < 0.01, Figure 3) during the winter wheat growing season from 1978 to 2017. The average precipitation during the winter wheat growing season from 1978 to 2017 was 303 mm and showed a statistically insignificant increasing trend (5.7 mm/decade). Overall, the climate during the winter wheat growing season showed a trend toward becoming warmer and more humid in China.
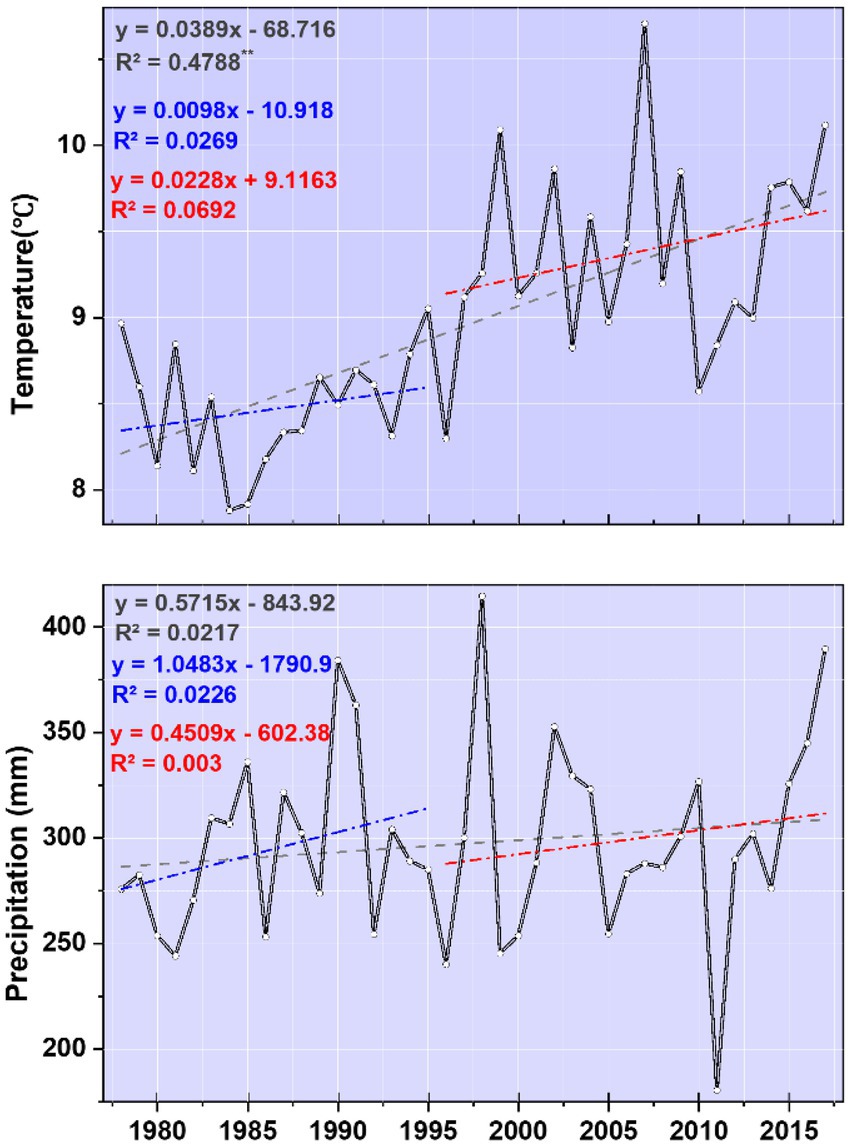
Figure 3. The climatic conditions during the winter wheat growing season in the main-producing regions in China from 1978 to 2017.
The production input change for winter wheat
The amount of irrigation for winter wheat production increased significantly from 1978 to 2017 (16.7 mm/decade, p < 0.01) (Figure 4A). The average water supply (the sum of irrigation and precipitation) was 461.6 mm and increased significantly (22.4 mm/decade, p < 0.01) (Figure 4B). The fertilization per unit area was 265.9 kg/ha and increased considerably (96.4 kg/ha·decade, p < 0.01). Fertilization reached its peak in 2012, and then the fertilization per unit area for winter wheat decreased (Figure 4C). The average winter wheat yield was 3,711 kg/ha and increased rapidly at a rate of 674.2 kg/ha·decade (p < 0.01) due to the increase in factor inputs (Figure 4D).
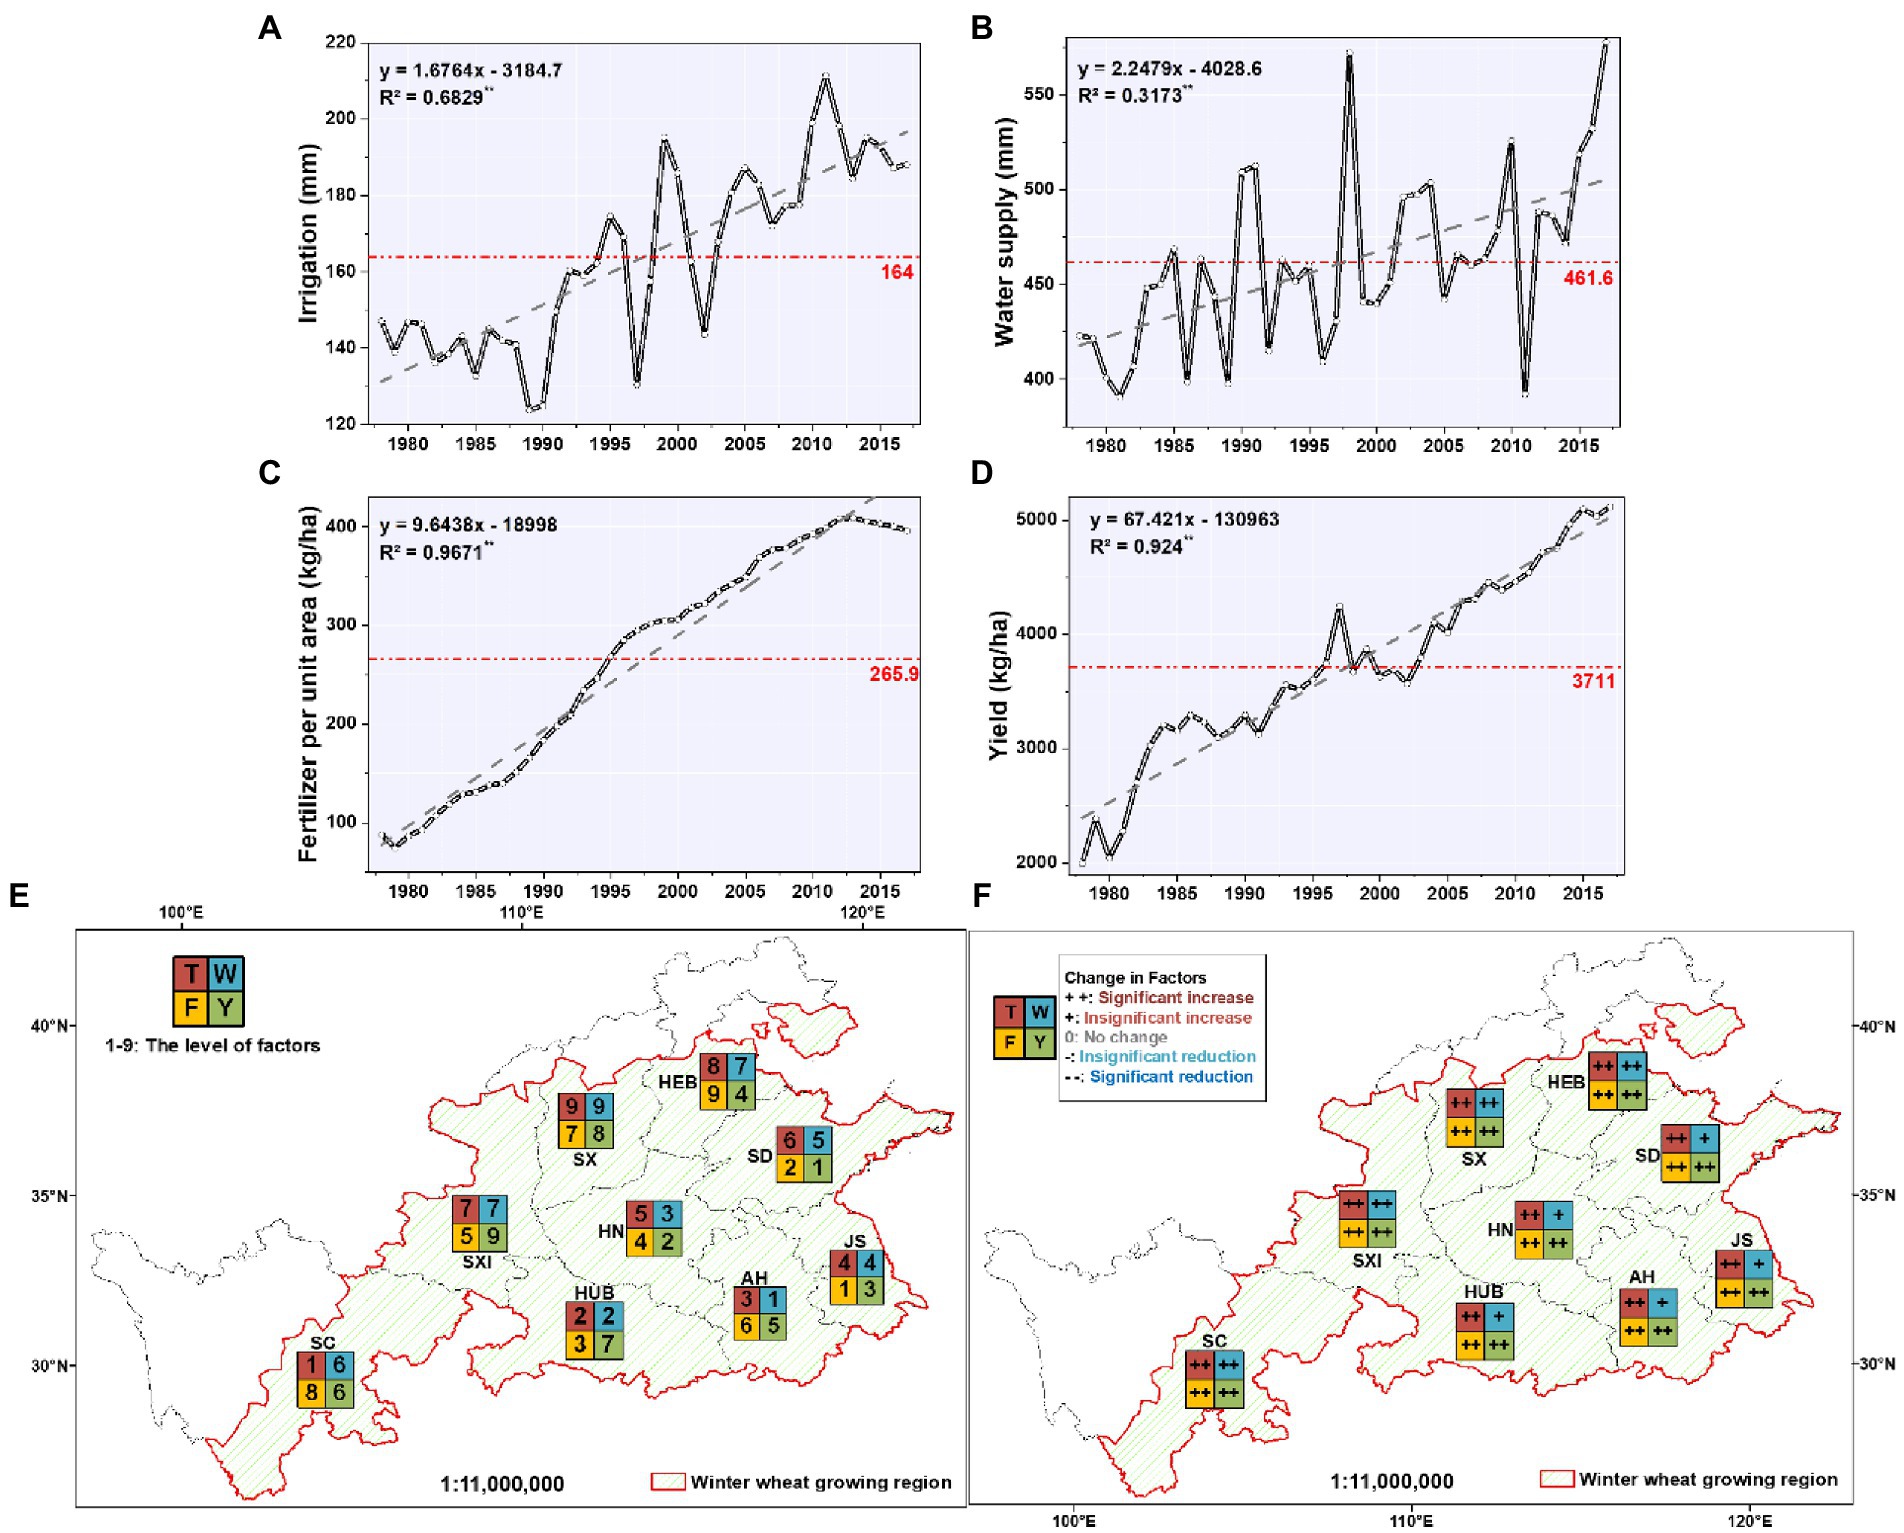
Figure 4. The production input level and its changes for winter wheat in China from 1978 to 2017. (A) Time series for irrigation. (B) Time series for water supply. (C) Time series for fertilization per unit area. (D) Time series of winter wheat yield per unit area. (E) Level of production factors by sorting each factor in nine provinces. (F) The changing trend of production factors in each region.
Regarding the spatial distribution of various factors (Figure 4E), the average water supply for winter wheat production was the highest in Anhui and the lowest in Shanxi. Jiangsu had the most fertilizer for winter wheat production, while Hebei had the least. Winter wheat yield was the highest in Shandong, followed by Henan, and Shaanxi had the lowest. The level of fertilization was the critical factor that determined the winter wheat yield. The winter wheat yield was higher in regions with high temperature, water supply, and fertilization, such as Jiangsu. In regions where the temperature and water supply were high and fertilization was lower, the winter wheat yield was relatively low, such as Hubei and Anhui. Sichuan, Shaanxi, Shanxi, and Hebei had a lower water supply level, and it increased significantly. In contrast, the water supply in other areas increased insignificantly. In all regions, the additional production factors (temperature, fertilization, and winter wheat yield) showed a significant increasing trend (Figure 4F).
The climatic threshold for winter wheat yield during the change period
We estimated the optimum temperature, moisture and fertilizer values for winter wheat based on the coefficients in the Supplementary Table 1. The average value of the optimum temperature threshold for winter wheat yield was 7.3°C in China from 1996 to 2017, but significant spatial differences existed (Figure 5A). The optimal temperature threshold for winter wheat yield decreased as latitude increased, and it was higher in high-temperature regions than in low-temperature regions. The average temperature of the winter wheat growing season in all regions exceeded its optimal temperature threshold, which was in the surplus range (the red part of Figure 2). Hence, the temperature was adverse for winter wheat production.
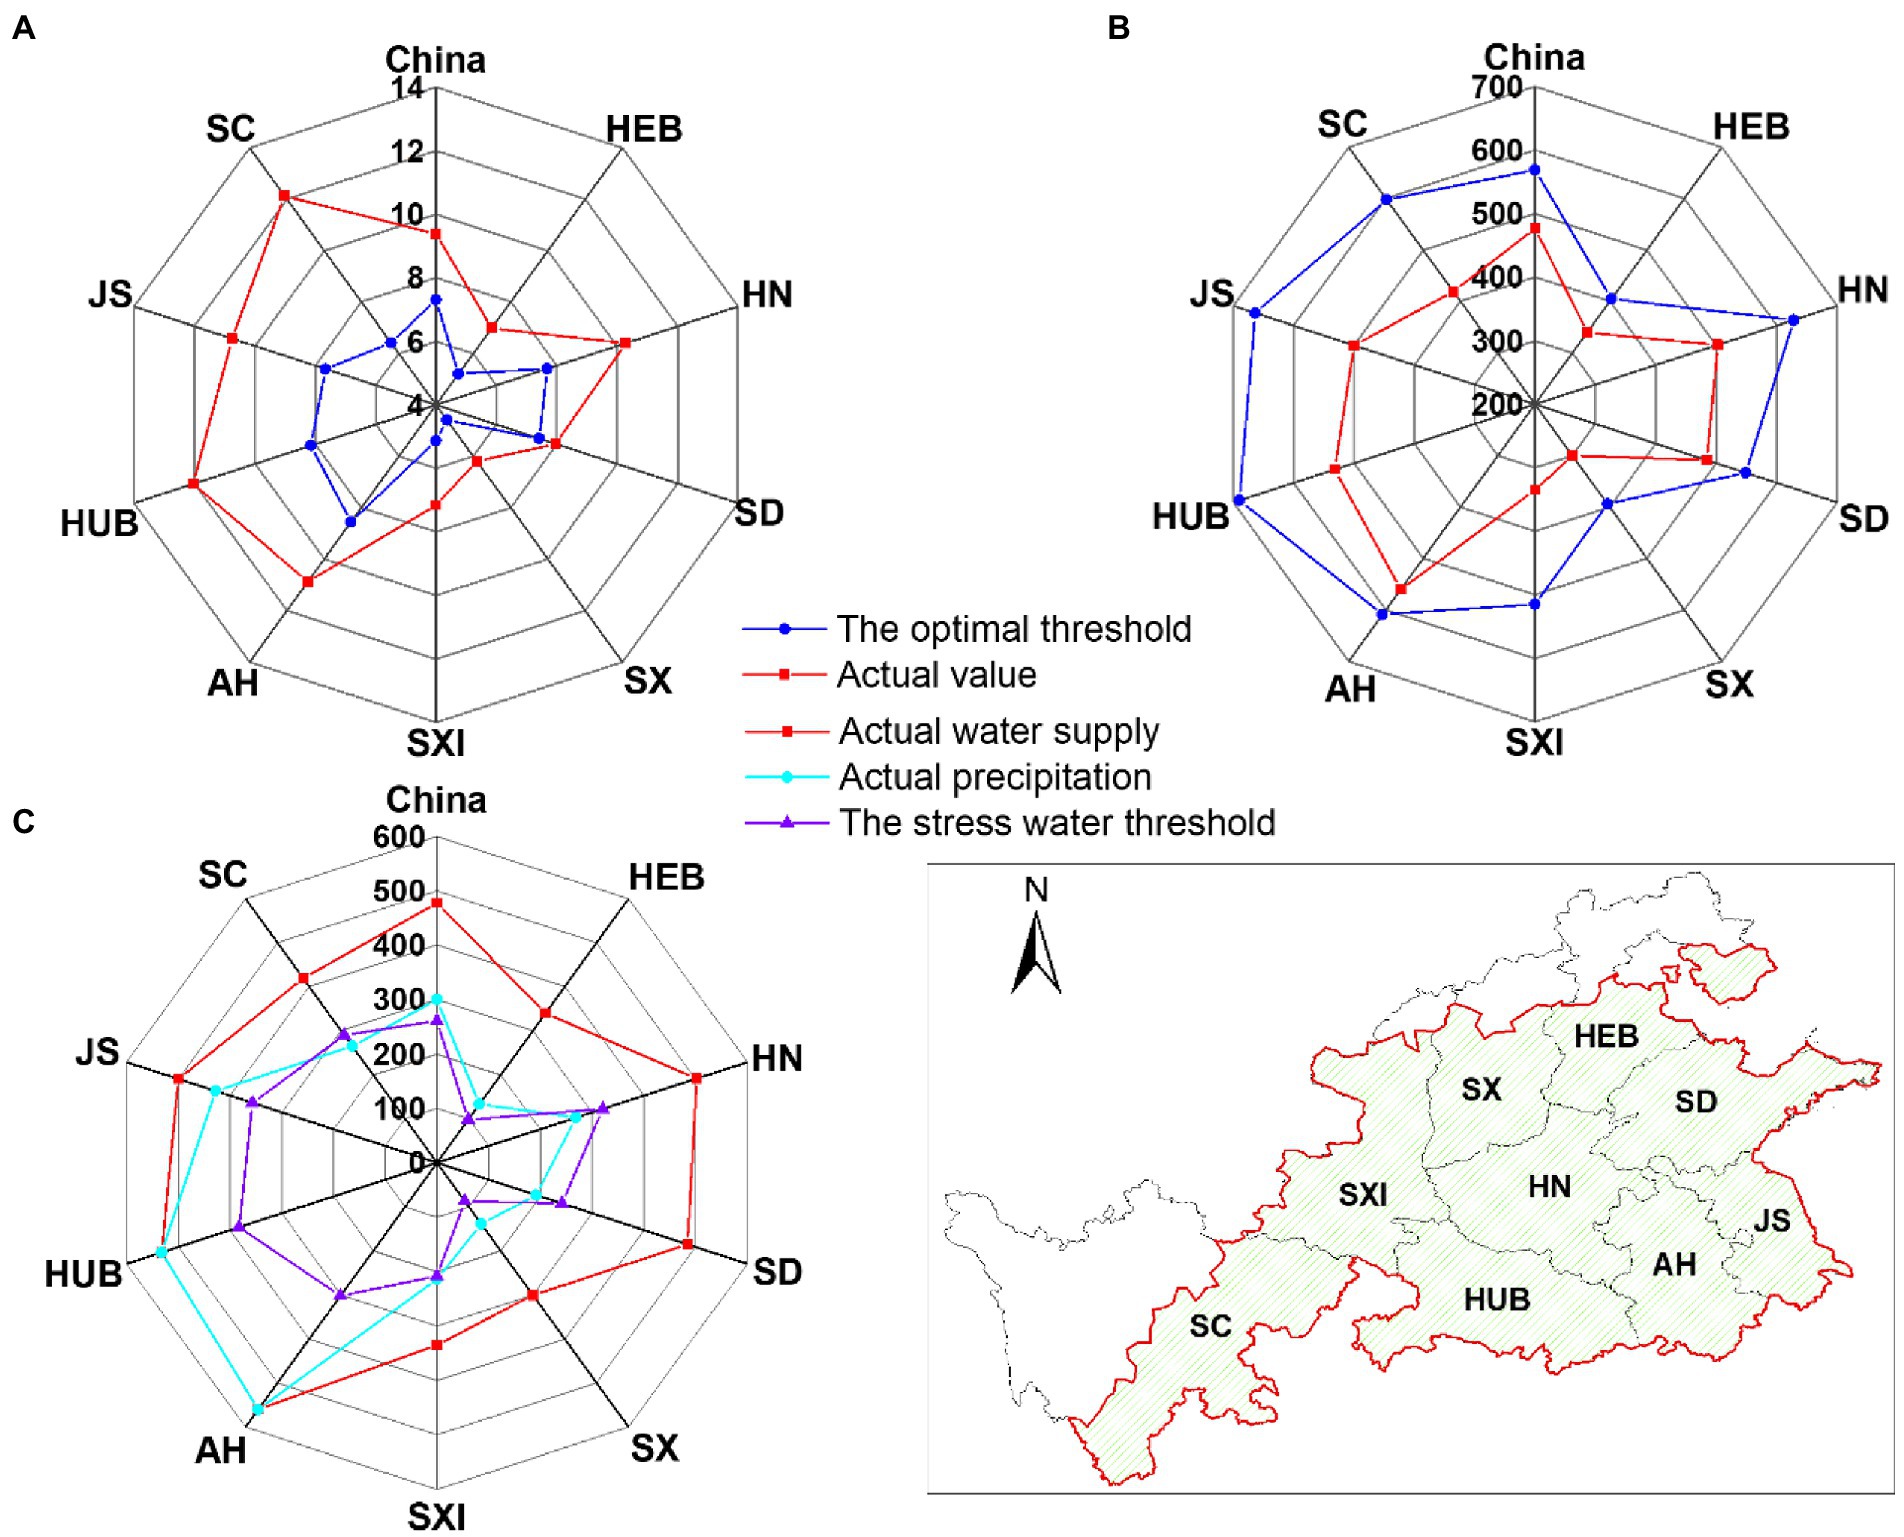
Figure 5. The optimal thresholds and actual factor values from 1996 to 2017. (A) Optimal temperature threshold for winter wheat production and its average temperature during the growing season. (B) Optimal water threshold for winter wheat production and its average water supply. (C) Water stress threshold for winter wheat production and the actual water supply and precipitation.
The average optimal water threshold for winter wheat yield was 569 mm from 1996 to 2017 (Figure 5B). In detail, it was the highest in Hubei and the lowest in Shanxi. Therefore, the water supply of winter wheat was below the optimum water threshold during the change period. Hence, the water supply was beneficial for winter wheat production from 1996 to 2017 and increasing the water supply can increase winter wheat yield. Therefore, we can further judge whether the water supply reaches the stressed point for the water threshold during the change period. When the water supply is below its stress threshold, the marginal yield of the water supply increases, and the water supply can accelerate the growth in winter wheat yield. In contrast, when the water supply exceeds its stress threshold, its marginal yield will decrease, and the water supply will slow growth in winter wheat yield.
The water supply exceeded the upper water deficit stress threshold (point B), which means that the water supply was in the appropriate range (the green part, B-C, of Figure 2) during the change period, with a diminishing marginal yield per unit of water. Therefore, the water supply could increase winter wheat yield from 1996 to 2017, but the yield growth rate weakened (Figure 5C). Eliminating the irrigated portion of the water supply (Figure 5C), the actual precipitation in each region did not meet its water demand. The increasing trend in precipitation was beneficial to winter wheat production during the change period. The actual precipitation during the winter wheat growing season was less than the water deficit stress threshold in Henan, Shandong, and Sichuan during the change period. Therefore, the marginal yield of precipitation was increasing, and more irrigation was beneficial for winter wheat production in Henan, Shandong, and Sichuan. Actual precipitation during the winter wheat growing season exceeded the water deficit stress threshold in other regions, and precipitation was suitable for the increase in winter wheat yield if there was no irrigation. Therefore, the irrigation water demand in these regions was relatively small.
Changes in the optimum climatic threshold under different adaptation levels
According to Equation (2), the optimal temperature threshold was a function of the water supply. In higher water supply regions such as Anhui and Hubei, the optimal temperature threshold was relatively higher. Because the water supply (including precipitation and irrigation) was dynamic, with inter-annual differences, the optimal temperature threshold of winter wheat yield was a variable value. The increase of water supply can alleviate the damage of high temperature to winter wheat, thereby increasing the optimal temperature threshold of winter wheat during the change period (Figure 6A). Increasing the water supply can enhance the ability of winter wheat production to cope with climate warming. There was a stronger increasing trend in the optimal temperature threshold in Shanxi and Shaanxi, which had low water supply levels that significantly increased due to the increase in irrigation during the change period. In contrast, there was a weaker increasing trend in the optimal temperature threshold in Hubei because this area had sufficient precipitation and little irrigation.
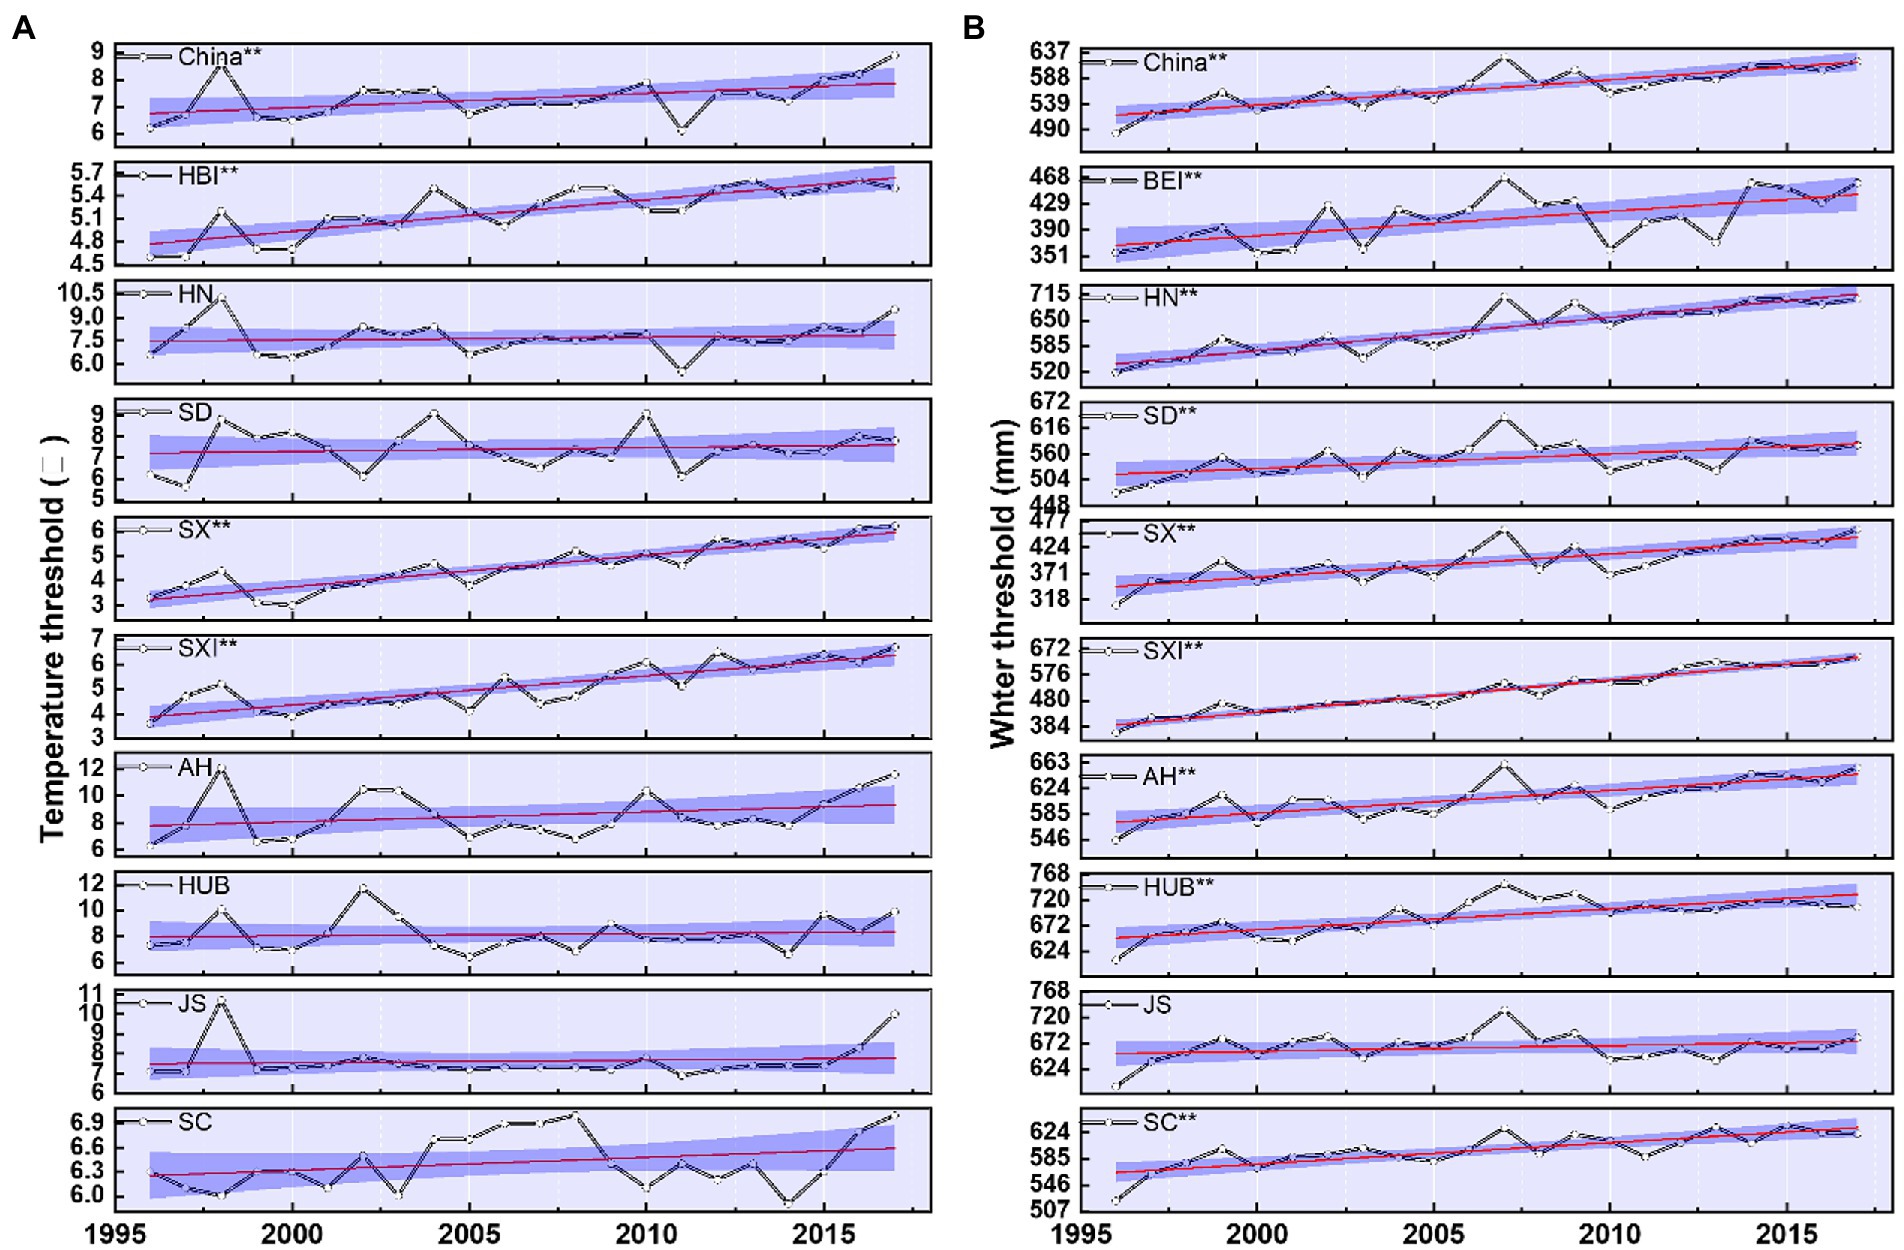
Figure 6. The optimal threshold temperature (A) and precipitation (B) trends for winter wheat from 1996 to 2017.
According to Equation 3, the optimal water threshold is a function of temperature and fertilization, and different combinations of temperature and fertilization will lead to the changed optimal water threshold for winter wheat yield (Figure 6B). Regions with higher temperatures and fertilization, such as Jiangsu and Hubei, had a higher optimal water threshold, whereas there was a lower optimal water threshold in regions with lower temperature and fertilization, such as Hebei and Shanxi. With the increase in temperature and fertilizer application, the optimal water threshold for winter wheat yield increased during the change period. The optimum water threshold for winter wheat yield increased less in Hebei and Shanxi and more in Shaanxi and Henan.
Adaptation implication on the climatic threshold of agricultural production
The winter wheat yield increased significantly according to result 3.2 even though the actual temperature exceeded the optimal temperature of winter wheat. This indicates that although climate warming was adverse for winter wheat production, it did not play a decisive role in the yield level. Furthermore, the impact of climate change on crop production can be offset by other factors. Based on the interactions between various factors, the optimal temperature threshold will rise with increasing water or fertilization. This means that adaptation input (mainly including irrigation and fertilizer input in this study) can change agricultural production’s climatic threshold and help it adapt to climate warming. The dynamic change in the climatic threshold based on the synergy of factors is a mechanism for quantitatively and dynamically adapting to climate change.
The average demand for water was 613 mm for winter wheat production when adapted to the temperature during the change period in China. Nevertheless, there were differences among regions (Figure 7A). The water supply needed to adapt to the temperature was higher during the change period in regions with higher temperatures, such as Jiangsu and Hubei. To adapt to the temperature during the change period, the water demand was the maximum in Sichuan, while it was the minimum in Shanxi, where it had a lower temperature and water supply. Irrigation is needed because the amount of precipitation cannot meet the water supply demand. On average, the irrigation demand was 313 mm for winter wheat production when adapted to the temperature during the changing period in China. The irrigation demand varied from region to region because there were differences in the water requirements for adaptation and precipitation during the winter wheat growing season. The maximum irrigation demand was in Sichuan, which had the maximum water for adaptation but lower precipitation, while it was the minimum in Anhui, which had adequate precipitation. Supposing that the climate will maintain the warm and humid trend into the future and precipitation will increase sufficiently, there will be no additional irrigation needed for winter wheat production to adapt to climate warming.
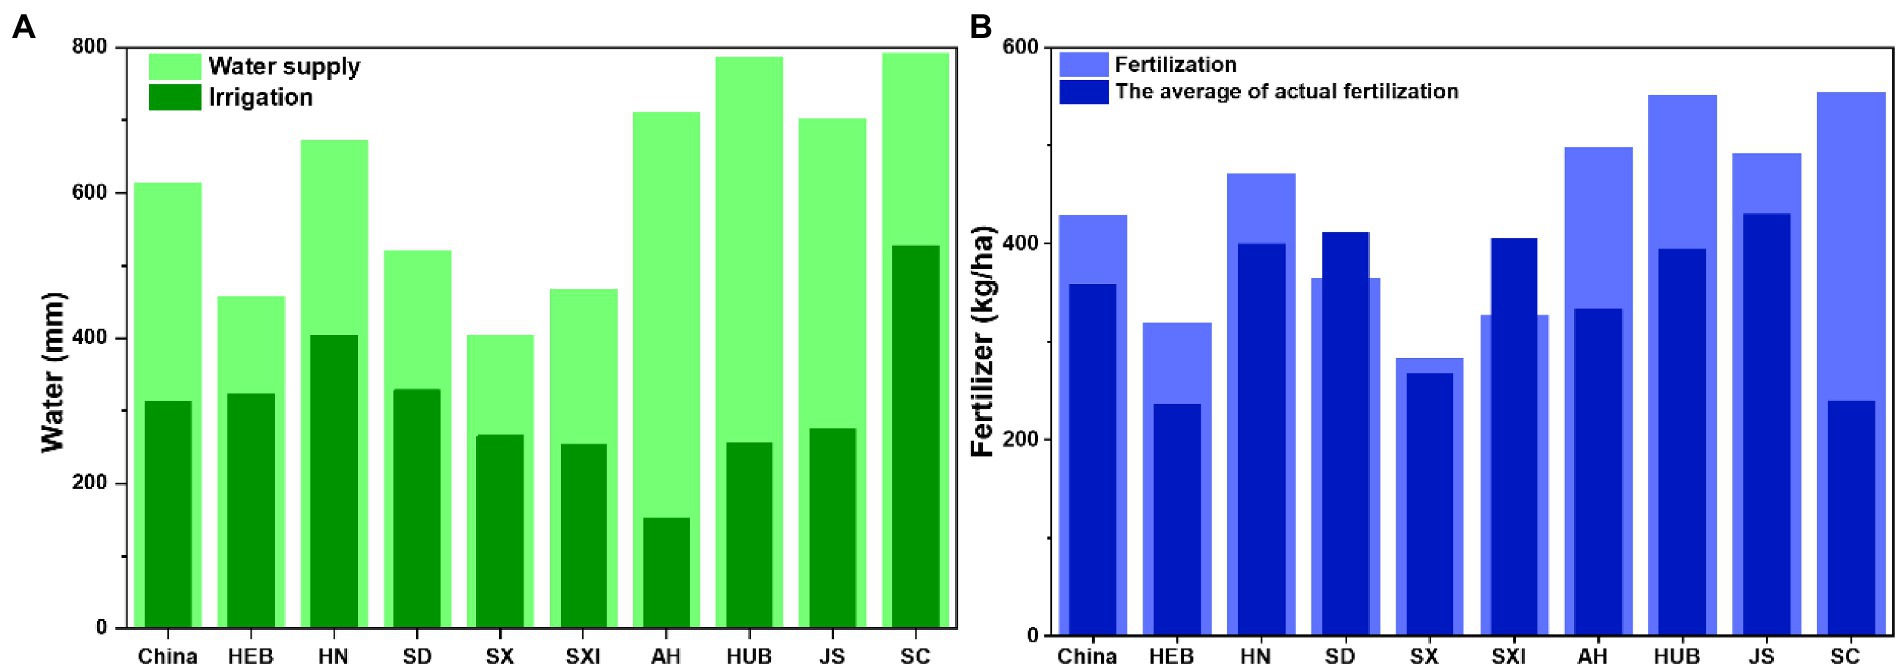
Figure 7. The adaptation of winter wheat production to temperature during 1996 to 2017. (A) Adaptation demand of water supply and irrigation. (B) Adaptation demand of fertilization and its actual fertilization.
The amount of water supply affects the utilization rate of fertilizer. Therefore, based on the water demand to adapt to the current temperature (average temperature during the change period), we analyzed the fertilization requirement for winter wheat production (Figure 7B). The average fertilization demand for winter wheat to adapt to the current temperature and water was 429 kg/ha in China. Fertilization increased because the actual average fertilization of winter wheat production was 358 kg/ha. The actual fertilization exceeded the fertilization required to adapt to the temperature in Shandong and Shaanxi, which was detrimental to winter wheat production indicating that they need to reduce their fertilization. In other regions except for Shandong and Shaanxi, fertilization could be increased to adapt to the current temperature. The maximum demand for increased fertilization was in Sichuan, while the minimum was in Shanxi.
Discussion
The importance of climate thresholds for agricultural production
Thresholds are universal in agricultural production and affect the planting structure, planting boundaries, and yield levels of crops. The climatic threshold refers to the value of climatic factors making the agricultural system change from one state to another. To assess the impact of climate change, the first step is to determine whether the current climate is good or bad for agricultural production, after which the extent of climate change’s impact on agricultural production can be calculated. In addition, clarifying the relationship between the critical climate thresholds and climate change can determine the adaptation direction of agricultural production and determine the extent to which future climate change should be controlled to provide a basis for the choice of adaptation measures. Therefore, the calculation of climatic thresholds for agriculture can link the impact of climate change with adaptation to climate change: it is not only the key to climate change impact assessment but also a precondition of climate change adaptation.
Generalizability of the calculation method of climatic threshold
Here, we first clarified the definition of different thresholds for crop yield. Then, we constructed a method to calculate the climatic thresholds based on the mechanism through which factors and their interactions influence crop yields. Only by correctly understanding the relationship between climate factors and agricultural production can we assess the impact of climate change on crop production. However, due to the complexity of field trials and the scarcity of research data in previous studies, the fundamental relationship between climate factors and agricultural production is not sufficiently accurate (Chen et al., 2013; Dong et al., 2019), limiting related research progress. In addition, different crops have different sensitivities to climatic conditions. For example, Lobell et al. (2013) observed that when the temperature exceeds 35°C, corn yields drop rapidly. Dong et al. (2019) calculated that the optimum upper and lower thresholds of temperature for spring wheat are 11.4°C, 8.2°C, and 14.6°C, respectively. Here, an exponential quadratic curve was used to express the relationship between climate factors and crop yields, determine the multifactor coupling effect, and calculate the multiple thresholds for temperature and water. The exponential quadratic curve can represent the fundamental relationship between the various crop yields and factor inputs and can be used to calculate the climatic thresholds of other crops. Compared with previous studies, this study can calculate the climatic threshold of crop yields more objectively, clarify its relationship with climate change, and then provide quantitative countermeasures to help agriculture to adapt to climate change. This study can also provide a reference method for calculating the climate threshold of other crops.
In addition, the factors affecting wheat yield are not only temperature, precipitation, irrigation, and fertilization levels, as included in this study, but also genotype (crop variety), geographical factors, soil type, crop management, and the fertilizer effect of CO2 (Tester and Langridge, 2010; Asseng et al., 2013; Burke and Emerick, 2016; Wang et al., 2020). For example, the optimal temperature threshold of winter wheat decreased as latitude increased, as shown in Result 3.3, because of differences among provinces in plant varieties, soil types, water supply, climate, and management measures, etc. Therefore, future research should increase the consideration of other impact factors to reduce uncertainty.
Dividing the base period and the change period is the first step in calculating the climate threshold and clarifying the impact of climate change. We used the Mann–Kendall mutation test method to calculate the mutation point of temperature and identified 1996 as the mutation year. This result was consistent with the climate change mutation time given by the IPCC (IPCC, 2014).
Moreover, the climatic threshold for the whole growing season of winter wheat was calculated in this study. However, the critical climate threshold will relate to a specific development phase of winter wheat, e.g., seed germination, floral initiation, dormancy, head filling, etc (Peter et al., 2011). For example, Acevedo et al. (2002) found that the germination of wheat might occur between 4°C and 37°C, and the optimal temperature is from 12°C to 25°C. Hence, future studies should distinguish the climatic threshold during different crop growth periods of winter wheat.
Climate warming implication to the wheat production
Climate warming will be further detrimental to wheat production in China. Based on Result 3.4, the climatic threshold of agricultural production changes with the coupling effects of multiple factors. Hence, there were inter-annual differences in the climatic threshold of winter wheat due to environmental changes. Although the optimal temperature threshold showed an upward trend with the increase in the water supply, the actual temperature during the winter wheat growing season was higher than its optimal temperature threshold over the change period supply (Figure 2). The actual temperature was in the range of the optimal threshold and the surplus stress threshold (the red part, C to B′, in Figure 1), which means that the rising temperature during the growing season would reduce winter wheat yield. Climate warming shows an irreversible and intensifying trend (IPCC, 2021), which means that future warming will be further detrimental to wheat production. Therefore, it is crucial to adapt to the changing climate.
Adapting to climate change and balancing the ecological environment
According to the above discussion, either the water supply or fertilization needs to be increased to adapt to climate change during the change period. However, when crop production adapts to climate change by increasing input, some problems will emerge, such as resource availability, eco-environment capacity, and the feasibility and sustainability of adaptation. The increase in the water supply is an important measure to adapt to climate warming, but it can lead to overexploitation of groundwater, which has caused a series of ecological and environmental problems (Grogan et al., 2017; Jia et al., 2019). Therefore, the ability to meet agricultural water demand is essential for agricultural production to adapt to climate change. In addition, although chemical fertilizers have led to a rapid increase in crop yields, they have also caused ecological problems such as environmental pollution (Ischinger, 1979; Sedlacek et al., 2020). Therefore, many countries have set the safe upper limit of fertilization per unit area at 225 kg/ha (Joint, 2000; Good and Beatty, 2011; Cai et al., 2018). Similarly, since pesticide and fertilizer inputs have been unreasonable in China and even exceeded environmental tolerance in some areas (Norse and Ju, 2015; Ju et al., 2016), the Chinese government has proposed a “double reduction” policy, which aimed to reasonably reduce fertilizer and pesticide use without reducing crop production and quality through scientific planting techniques, crop structure adjustment, etc. (Lu and Liu, 2017; Xiang et al., 2020). Therefore, future climate change adaptation research should focus on the availability of resources and how to improve their utilization efficiency.
Conclusion
The climatic threshold refers to the value of climatic factors pushing the agricultural system from one state to another. Determining the climate threshold of agricultural production is not only the key to climate change impact assessments but also a precondition to climate change adaptation. Here, we first identified the concepts of five climatic threshold that affect crop production, and further clarified the quantifying methods for each climatic threshold. Finally, we focused on the optimal climatic threshold of winter wheat yield and discussed how to adapt to climate change by adjusting water or fertilization to change the optimal temperature threshold of winter wheat.
The results showed that the climate during the winter wheat growing season showed a trend of increasing warmth and humidity from 1978 to 2017, especially after 1996. The optimal temperature threshold of winter wheat yield in China was 7.3°C, and the average temperature during the winter wheat growing season has exceeded its optimal temperature threshold. The optimal water threshold for winter wheat yield was 569 mm, and the water supply was below its optimal water threshold.
To adapt to the current temperature that has exceeded the optimum temperature, we should make sure of at least 613 mm (national average) water supply and 429 kg/ha (national average) fertilizer supply. For all winter wheat growing regions, increased irrigation could increase the optimum temperature threshold for winter wheat to adapt to a warming climate. However, the amount of fertilizer should be increased in most regions, except for Shandong and Shaanxi. The optimal temperature threshold of winter wheat can be adjusted to adapt to future climate warming by increasing adaption input based on multifactor synergies. It needs to be noticed that adaptation to current and future climate change by increasing water or fertilizer should consider resource availability and the security of the ecological environment. Improving the efficiency of water and fertilizer use may be more important for agricultural production to adapt to climate change in the future.
Data availability statement
Publicly available datasets were analyzed in this study. Data is available through China Meteorological Data Sharing Service Network and the statistical yearbooks and the National Bureau of Statistics of China. This data can be found at: http://data.cma.cn/data.
Author contributions
ZP initiated this work. NH performed the analysis. NH and ZP wrote the manuscript. YS and JW assisted the data analysis. ZZ, SM, and KJ assisted the data collection. All authors contributed to the discussions and interpretation of results. All authors contributed to the article and approved the submitted version.
Funding
This work was supported by the National Key R&D Program of China (No. 2018YFA0606300), Key R&D program of Inner Mongolia, China (2019GG016), and National Natural Science Foundation of China (No. 41871086).
Conflict of interest
The authors declare that the research was conducted in the absence of any commercial or financial relationships that could be construed as a potential conflict of interest.
Publisher’s note
All claims expressed in this article are solely those of the authors and do not necessarily represent those of their affiliated organizations, or those of the publisher, the editors and the reviewers. Any product that may be evaluated in this article, or claim that may be made by its manufacturer, is not guaranteed or endorsed by the publisher.
Supplementary material
The Supplementary material for this article can be found online at: https://www.frontiersin.org/articles/10.3389/fevo.2022.1019436/full#supplementary-material
Footnotes
References
Acevedo, E., Silva, P., and Silva, H. (2002). “Wheat growth and physiology,” in Bread Wheat: Improvement and Production. eds. B. C. Curtis, S. Rajaram, and H. G. ómez Macpherson (Rome: Food and Agriculture Organization of the United Nations).
Alley, R. B., Marotzke, J., Nordhaus, W. D., Overpeck, J. T., Peteet, D. M., Pielke, R. A., et al. (2003). Abrupt climate change. Science 299, 2005–2010. doi: 10.1126/science.1081056
Asseng, S., Ewert, F., Martre, P., Rötter, R. P., Lobell, D. B., Cammarano, D., et al., (2015). Rising temperatures reduce global wheat production. Nat. Clim. Chang. 5, 143–147. doi: 10.1038/nclimate2470
Asseng, S., Ewert, F., Rosenzweig, C., Jones, J. W., Hatfield, J. L., Ruane, A. C., et al. (2013). Uncertainty in simulating wheat yields under climate change. Nat. Clim. Chang. 3, 827–832. doi: 10.1038/nclimate1916
Benton, T., Fairweather, D., Graves, A., Harris, J., Jones, A., Lenton, T., et al. (2017). Environmental Tipping Points and Food System Dynamics: Main Report. eds. C. Rodrigo, K. Vikas, S. Tatsuya, and V. Tomer. The Global Food Security program, UK. Available at: http://www.foodsecurity.ac.uk/assets/pdfs/environmental-tipping-points-report.pdf
Burke, M., and Emerick, K. (2016). Adaptation to climate change: Evidence from US agriculture. Am. Econ. J. Econ. Pol. 8, 106–140. doi: 10.1257/pol.20130025
Cao, H., Li, X., Kang, S., and Wang, Z. (2008). Effect of Climate Change on Main Crop Water Requirements in Guanzhong Region. Journal of. Irrigation and Drainage, 2008 27, 6–9.
Cao, P., Lu, C., and Yu, Z. (2018). Historical nitrogen fertilizer use in agricultural ecosystems of the contiguous United States during 1850–2015: application rate, timing, and fertilizer types. Earth System Science Data 10, 969–984.
Cai, Y., Lenton, T. M., and Lontzek, T. S. (2016). Risk of multiple interacting tipping points should encourage rapid CO2 emission reduction. Nat. Clim. Chang. 6, 520–525. doi: 10.1038/nclimate2964
Cai, J., Xia, X., Chen, H., Wang, T., and Zhang, H. (2018). Decomposition of fertilizer use intensity and its environmental risk in China’s grain production process. Sustainability. 10:498. doi: 10.3390/su10020498
Chen, C., Baethgen, W. E., and Robertson, A. (2013). Contributions of individual variation in temperature, solar radiation and precipitation to crop yield in the North China plain, 1961–2003. Clim. Chang. 116, 767–788. doi: 10.1007/s10584-012-0509-2
Dakos, V., Matthews, B., Hendry, A. P., Levine, J., Loeuille, N., Norberg, J., et al. (2019). Ecosystem tipping points in an evolving world. Nature ecology & evolution 3, 355–362. doi: 10.1038/s41559-019-0797-2
Dhankher, O. P., and Foyer, C. H. (2018). Climate resilient crops for improving global food security and safety. Plant Cell Environ. 41, 877–884. doi: 10.1111/pce.13207
Dong, Z., Pan, Z., An, P., Wang, J., Zhang, J., Zhang, J., et al. (2019). A quantitative method for determining the impact threshold of climate change for agriculture. Theor. Appl. Climatol. 135, 425–431. doi: 10.1007/s00704-018-2397-5
Dürr, C., Dickie, J. B., Yang, X. Y., and Pritchard, H. W. (2015). Ranges of critical temperature and water potential values for the germination of species worldwide: contribution to a seed trait database. Agric. For. Meteorol. 200, 222–232. doi: 10.1016/j.agrformet.2014.09.024
Fagre, D. B., and Charles, C. W.. (2009). “Thresholds of climate change in ecosystems.” http://downloads.climatescience.gov/sap/sap4-2/sap4-2-final-report-all.pdf
Fan, M., Shen, J., Yuan, L., Jiang, R., Chen, X., Davies, W. J., et al. (2012). Improving crop productivity and resource use efficiency to ensure food security and environmental quality in China. Journal of experimental botany 63, 13–24. doi: 10.1093/jxb/err248
Fischer, R. A. (2015). Definitions and determination of crop yield, yield gaps, and of rates of change. Field Crop Res. 182, 9–18. doi: 10.1016/j.fcr.2014.12.006
Foley, M. M., Martone, R. G., Fox, M. D., Kappel, C. V., Mease, L. A., Erickson, A. L., et al. (2015). Using ecological thresholds to inform resource management: current options and future possibilities. Front. Mar. Sci. 2:95. doi: 10.3389/fmars.2015.00095
Geng, X., Wang, F., Ren, W., and Hao, Z. (2019). Climate change impacts on winter wheat yield in northern China. Adv. Meteorol. 2019, 1–12. doi: 10.1155/2019/2767018
Good, A. G., and Beatty, P. H. (2011). Fertilizing nature: a tragedy of excess in the commons. PLoS Biol. 9:e1001124. doi: 10.1371/journal.pbio.1001124
Greiner, A., Grüne, L., and Semmler, W. (2010). “Growth and climate change: threshold and multiple equilibria,” in Dynamic Systems, Economic Growth, and the Environment. eds. S. Willi and M. Stefan (Berlin, Heidelberg: Springer), 63–78. doi: 10.1007/978-3-642-02132-9_4
Groffman, P. M., Baron, J. S., Blett, T., Gold, A. J., Goodman, I., Gunderson, L. H., et al. (2006). Ecological thresholds: the key to successful environmental management or an important concept with no practical application?. Ecosystems 9, 1–13. doi: 10.1007/s10021-003-0142-z
Grogan, D. S., Wisser, D., Prusevich, A., Lammers, R. B., and Frolking, S. (2017). The use and re-use of unsustainable groundwater for irrigation: a global budget. Environ. Res. Lett. 12:034017. doi: 10.1088/1748-9326/aa5fb2
Haji Bungsu, H. J. (2014). Investigating threshold concepts in the learning of agriculture: gearing towards quality and relevant curriculum innovation. Newcast. Univ. Available at: http://theses.ncl.ac.uk/jspui/handle/10443/2761
Hong, H., Li, F. W., and Xu, J. (2019). Climate risks and market efficiency. Journal of econometrics 208, 265–281. doi: 10.1016/j.jeconom.2018.09.015
Holling, C. S. (1973). Resilience and stability of ecological systems. Annu. Rev. Ecol. Syst. 4, 1–23. doi: 10.1146/annurev.es.04.110173.000245
Hu, W., Yan, C. R., Li, Y. C., and Liu, Q. (2014). Impacts of climate change on winter wheat growing period and irrigation water requirements in the north China plain. Acta Ecologica Sinica 34, 2367–2377. doi: 10.5846/stxb201308052022
Hsuan, T. P., Jhuang, P. R., Wu, W. C., and Lur, H. S. (2019). Thermotolerance evaluation of Taiwan Japonica type rice cultivars at the seedling stage. Botanical Studies 60, 1–18.
Huggett, A. J. (2005). The concept and utility of ecological thresholds in biodiversity conservation. Biol. Conserv. 124, 301–310. doi: 10.1016/j.biocon.2005.01.037
IPCC. (2014). “Climate change 2014” in Impacts, Adaptation, and Vulnerability (Part A: Global and Sectoral Aspects. Contribution of Working Group II to the Fifth Assessment Report of the Intergovernmental Panel on Climate Change). eds. C. B. Field, V. R. Barros, and D. J. Dokken (Cambridge: Cambridge University Press).
IPCC (2021). Climate change 2021: The physical science basis. Contribution of working group I to the sixth assessment report of the intergovernmental panel on climate change, V. Masson-Delmotte, P. Zhai, A. Pirani, S. L. Connors, C. Péan, and S. Berger, et al. (Eds.). Cambridge University Press. https://www.ipcc.ch/report/sixth-assessment-report-working-group-i/
Ischinger, L. S. (1979). Nonpoint source pollution. Fisheries 4, 50–52. https://fisheries.org/policy-media/policy-statements/afs-policy-statement-3/
Jia, X., O'Connor, D., Hou, D., Jin, Y., Li, G., Zheng, C., et al. (2019). Groundwater depletion and contamination: spatial distribution of groundwater resources sustainability in China. Sci. Total Environ. 672, 551–562. doi: 10.1016/j.scitotenv.2019.03.457
Joint, F. (2000). “Optimizing nitrogen fertilizer application to irrigated wheat: Results of a co-ordinated research project 1994–1998” in Joint FAO/IAEA Division of Nuclear Techniques in Food and Agriculture https://www-pub.iaea.org/MTCD/publications/PDF/te_1164_prn.pdf
Ju, X., Gu, B., Wu, Y., and Galloway, J. N. (2016). Reducing China’s fertilizer use by increasing farm size. Glob. Environ. Chang. 41, 26–32. doi: 10.1016/j.gloenvcha.2016.08.005
Kahiluoto, H., Kaseva, J., Balek, J., Olesen, J. E., Ruiz-Ramos, M., and Gobin, A., & Trnka, M. (2019). Decline in climate resilience of European wheat. Proc. Natl. Acad. Sci. 116, 123–128. doi: 10.1073/pnas.1804387115
Kriegler, E., Hall, J. W., Held, H., Dawson, R., and Schellnhuber, H. J. (2009). Imprecise probability assessment of tipping points in the climate system. Proc. Natl. Acad. Sci. 106, 5041–5046. doi: 10.1073/pnas.0809117106
Lenton, T. M., Held, H., Kriegler, E., Hall, J. W., Lucht, W., Rahmstorf, S., et al. (2008). Tipping elements in the Earth's climate system. Proc. Natl. Acad. Sci. 105, 1786–1793. doi: 10.1073/pnas.0705414105
Lenton, T. M., Rockström, J., Gaffney, O., Rahmstorf, S., Richardson, K., Steffen, W., et al. (2019). Climate tipping points—too risky to bet against. Nat. Publ. Group 575, 592–595. doi: 10.1038/d41586-019-03595-0
Li, J., Dong, W., Oenema, O., Chen, T., Hu, C., Yuan, H., et al. (2019). Irrigation reduces the negative effect of global warming on winter wheat yield and greenhouse gas intensity. Sci. Total Environ. 646, 290–299. doi: 10.1016/j.scitotenv.2018.07.296
Li, S., Lei, Y., Zhang, Y., Liu, J., Shi, X., Jia, H., et al.(2019). Rational trade-offs between yield increase and fertilizer inputs are essential for sustainable intensification: a case study in wheat–maize cropping systems in China. Sci. Total Environ. 679, 328–336. doi: 10.1016/j.scitotenv.2019.05.085
Li, Z., Zhao, W., Zhao, M., Zhang, J., Meng, Y., and Li, Y. (2020). Crop water requirement and irrigation water demand for winter wheat under different hydrologic years in north of Jiangsu Province [J]. Journal of Irrigation and Drainage S01:4.
Liu, Y., Chen, Q., Ge, Q., Dai, J., Qin, Y., Dai, L., et al. (2018). Modelling the impacts of climate change and crop management on phenological trends of spring and winter wheat in China. Agric. For. Meteorol. 248, 518–526. doi: 10.1016/j.agrformet.2017.09.008
Liu, J., Wiberg, D., Zehnder, A. J., and Yang, H. (2007). Modeling the role of irrigation in winter wheat yield, crop water productivity, and production in China. Irrig. Sci. 26, 21–33. doi: 10.1007/s00271-007-0069-9
Lobell, D. B., Bänziger, M., Magorokosho, C., and Vivek, B. (2011a). Nonlinear heat effects on African maize as evidenced by historical yield trials. Nat. Clim. Chang. 1, 42–45. doi: 10.1038/nclimate1043
Lobell, D., Hammer, G., McLean, G., Messina, C., Roberts, M., and Schlenker, W. (2013). The critical role of extreme heat for maize production in the United States. Nature Climate Change 3, 497–501. doi: 10.1038/nclimate1832
Lobell, D. B., Schlenker, W., and Costa-Roberts, J. (2011b). Climate trends and global crop production since 1980. Science 333, 616–620. doi: 10.1126/science.1204531
Lu, W., and Liu, C. (2017). The “environmental punishment” effect of fertilizer pollution in grain crop production. China Environ. Sci. 37, 1988–1994. doi: 10.3969/j.issn.1000-6923.2017.05.048, (in Chinese)
Lv, Z., Liu, X., Cao, W., and Zhu, Y. (2013). Climate change impacts on regional winter wheat production in main wheat production regions of China. Agric. For. Meteorol. 171-172, 234–248. doi: 10.1016/j.agrformet.2012.12.008
May, R. M. (1977). Thresholds and breakpoints in ecosystems with a multiplicity of stable states. Nature 269, 471–477. doi: 10.1038/269471a0
Naylor, R. L., Battisti, D. S., Vimont, D. J., Falcon, W. P., and Burke, M. B. (2007). Assessing risks of climate variability and climate change for Indonesian rice agriculture. Proc. Natl. Acad. Sci. 104, 7752–7757. doi: 10.1073/pnas.0701825104
Norse, D., and Ju, X. (2015). Environmental costs of China’s food security. Agric. Ecosyst. Environ. 209, 5–14. doi: 10.1016/j.agee.2015.02.014
Ortiz-Bobea, A., Ault, T. R., Carrillo, C. M., Chambers, R. G., and Lobell, D. B. (2021). Anthropogenic climate change has slowed global agricultural productivity growth. Nature Climate Change 11, 306–312. doi: 10.1038/s41558-021-01000-1
Palmer, T., and Stevens, B. (2019). The scientific challenge of understanding and estimating climate change. Proceedings of the National Academy of Sciences 116, 24390–24395.
Peter, D., Neil, W., David, P., Mackenzie, R., and Jane, M. (2011). Critical (temperature) thresholds and climate change impacts/adaptation in horticulture. Queensland: Department of Employment Economic Development and Innovation (DEEDI). 10–18. Available at: https://www.melonsaustralia.org.au/wp-content/uploads/2018/12/Critical-Temperature-Thresholds-in-Horticulture.pdf
Schlenker, W., and Roberts, M. J. (2009). Nonlinear temperature effects indicate severe damages to U.S. crop yields under climate change. Proc. Natl. Acad. Sci. 106, 15594–15598. doi: 10.1073/pnas.0906865106
Sedlacek, C. J., Giguere, A. T., and Pjevac, P. (2020). Is too much fertilizer a problem? Front. Young Minds 8, 1–5. doi: 10.3389/frym.2020.00063
Selvaraju, R. (2012). Climate risk assessment and management in agriculture. Build. Resil. Adap. Clim. Change Agricult. Sec. 23:71.
Selvaraju, R., Gommes, R., and Bernardi, M. (2011). Climate science in support of sustainable agriculture and food security. Clim. Res. 47, 95–110. doi: 10.3354/cr00954
Song, Y., Simelton, E., Chen, D., and Wenjie, D. O. N. G. (2005). Influence of climate change on winter wheat growth in North China during 1950–2000. Acta. Meteor. Sin. 19, 501–510.
Tack, J., Barkley, A., and Hendricks, N. (2017). Irrigation offsets wheat yield reductions from warming temperatures. Environ. Res. Lett. 12:114027. doi: 10.1088/1748-9326/aa8d27
Tack, J., Barkley, A., and Nalley, L. L. (2015). Effect of warming temperatures on US wheat yields. Proceedings of the National Academy of Sciences 112, 6931–6936.
Tester, M., and Langridge, P. (2010). Breeding technologies to increase crop production in a changing world. Science 327, 818–822. doi: 10.1126/science.1183700
Tito, R., Vasconcelos, H. L., and Feeley, K. J. (2018). Global climate change increases risk of crop yield losses and food insecurity in the tropical Andes. Glob. Chang. Biol. 24, e592–e602. doi: 10.1111/gcb.13959
Trnka, M., Rötter, R. P., Ruiz-Ramos, M., Kersebaum, K. C., Olesen, J. E., Žalud, Z., et al. (2014). Adverse weather conditions for European wheat production will become more frequent with climate change. Nat. Clim. Chang. 4, 637–643. doi: 10.1038/NCLIMATE2242
Trubovitz, S., Lazarus, D., Renaudie, J., and Noble, P. J. (2020). Marine plankton show threshold extinction response to Neogene climate change. Nat. Commun. 11, 5069–5010. doi: 10.1038/s41467-020-18879-7
van Nes, E. H., Arani, B. M., Staal, A., van der Bolt, B., Flores, B. M., Bathiany, S., et al. (2016). What do you mean, ‘tipping point’? Trends Ecol. Evol. 31, 902–904. doi: 10.1016/j.tree.2016.09.011
Vogel, E., Donat, M. G., Alexander, L. V., Meinshausen, M., Ray, D. K., Karoly, D., et al. (2019). The effects of climate extremes on global agricultural yields. Environ. Res. Lett. 14:054010. doi: 10.1088/1748-9326/ab154b
Walck, J. L., Hidayati, S. N., Dixon, K. W., Thompson, K. E. N., and Poschlod, P. (2011). Climate change and plant regeneration from seed. Glob. Chang. Biol. 17, 2145–2161. doi: 10.1111/j.1365-2486.2010.02368.x
Walker, B., and Meyers, J. A. (2004). Thresholds in ecological and social–ecological systems: a developing database. Ecol. Soc. 9. doi: 10.5751/ES-00664-090203
Wang, R., Bowling, L. C., and Cherkauer, K. A. (2016). Estimation of the effects of climate variability on crop yield in the Midwest USA. Agric. For. Meteorol. 216, 141–156. doi: 10.1016/j.agrformet.2015.10.001
Wang, L., Pan, Z., Gao, X., Chen, D., Zhang, L., Cheng, L., et al. (2012). Influence of different fertility levels water use efficiency of the potato in the dry land [J]. Journal of China Agricultural University. 17, 54–58.
Wang, X., Zhao, C., Müller, C., Wang, C., Ciais, P., Janssens, I., et al. (2020). Emergent constraint on crop yield response to warmer temperature from field experiments. Nat. Sustain. 3, 908–916. doi: 10.1038/s41893-020-0569-7
Wei, T., Cherry, T. L., Glomrød, S., and Zhang, T. (2014). Climate change impacts on crop yield: evidence from China. Sci. Total Environ. 499, 133–140. doi: 10.1016/j.scitotenv.2014.08.035
Wei, X., Wang, P., Zhang, Z., Chen, Y., Song, X., Shuai, J., et al. (2015). Assessing the impact of climate change on crop yield based on three-interval temperature theory: a case study of maize in Heilongjiang Province (1960–2009). J. Nat. Resour. 225, 86–92. doi: 10.1016/j.agee.2016.04.004
Wei, W., Yan, Y., Cao, J., Christie, P., Zhang, F., and Fan, M. (2016). Effects of combined application of organic amendments and fertilizers on crop yield and soil organic matter: An integrated analysis of long-term experiments. Agric. Ecosyst. Environ. 225, 86–92. doi: 10.1016/j.agee.2016.04.004
Xiang, Z., Pan, Z., and Wang, Z. (2020). Reduction or not?—An empirical study on farmers’ behavior of fertilizer and pesticide reduction in perspective of ambivalent attitude. J. Agrotech. Econ. 2.
Xiao, D., and Tao, F. (2014). Contributions of cultivars, management and climate change to winter wheat yield in the North China plain in the past three decades. Eur. J. Agron. 52, 112–122. doi: 10.1016/j.eja.2013.09.020
Yu, C., Miao, R., and Khanna, M. (2021). Maladaptation of US corn and soybeans to a changing climate. Sci. Rep. 11, 1–12. doi: 10.1038/s41598-021-91192-5
Zhang, Y., Qiu, X., Yin, T., Liao, Z., Liu, B., and Liu, L. (2021). The Impact of Global Warming on the Winter Wheat Production of China. Agronomy 11:1845. doi: 10.3390/agronomy11091845
Keywords: climate change, winter wheat, yield, dynamic of climatic threshold, China
Citation: Huang N, Song Y, Wang J, Zhang Z, Ma S, Jiang K and Pan Z (2022) Climatic threshold of crop production and climate change adaptation: A case of winter wheat production in China. Front. Ecol. Evol. 10:1019436. doi: 10.3389/fevo.2022.1019436
Edited by:
Didier G. Leibovici, The University of Sheffield, United KingdomReviewed by:
Sotirios Archontoulis, Iowa State University, United StatesBrown Gwambene, University of Iringa, Tanzania
Copyright © 2022 Huang, Song, Wang, Zhang, Ma, Jiang and Pan. This is an open-access article distributed under the terms of the Creative Commons Attribution License (CC BY). The use, distribution or reproduction in other forums is permitted, provided the original author(s) and the copyright owner(s) are credited and that the original publication in this journal is cited, in accordance with accepted academic practice. No use, distribution or reproduction is permitted which does not comply with these terms.
*Correspondence: Zhihua Pan, cGFuemhpaHVhQGNhdS5lZHUuY24=