 Patti J. Wohner
 Paul D. Scheerer
 Michael H. Meeuwig2
 James T. Peterson
- 1Oregon Cooperative Fish and Wildlife Research Unit, Department of Fisheries, Wildlife, and Conservation Sciences, Oregon State University, Corvallis, OR, United States
- 2Oregon Department of Fish and Wildlife, Corvallis, OR, United States
- 3U.S. Geological Survey, Oregon Cooperative Fish and Wildlife Research Unit, Department of Fisheries, Wildlife, and Conservation Sciences, Oregon State University, Corvallis, OR, United States
A major challenge in ecology is disentangling interactions of non-native, potentially invasive species on native species. Conditional two-species occupancy models examine the effects of dominant species (e.g., non-native) on subordinate species (e.g., native) while considering the possibility that occupancy of one species may affect occupancy and/ or detection of the other. Although conditional two-species models are useful for evaluating the influence of one species on presence of another, it is possible that species interactions are density dependent. Therefore, we developed a novel two-species occupancy model that incorporates multiple abundance states (i.e., absent, present, abundant) of the native species. We showcase the utility of this model with a case study that incorporates random effects and covariates on both occupancy and detection to help disentangle species interactions given varying occupancy and detection in different abundance states. We use snorkel survey data from the Umpqua basin, Oregon, where it is hypothesized that smallmouth bass Micropterus dolomieu, a non-native piscivore, exclude Umpqua chub Oregonichthys kalawatseti, a small endemic minnow. From our two-species multi-state (2SMS) model, we concluded that average occupancy was low for both fishes, and that when non-native bass were present, overall native chub occupancy in the present (0.18 ± 0.05 SD) and abundant (0.19 ± 0.03) states was higher than when non-natives were absent (0.14 ± 0.02/ 0.08 ± 0.02), indicating the non-native was not excluding the native species. By incorporating a species interaction factor, we found a positive association (6.75 ± 5.54 SD) between native chub and non-native bass. The covariates strongly related to occupancy were elevation, algae, and land cover type (urban and shrub). Detection probability for both species (0.21–0.82) was most strongly related to the covariates day of year, water temperature, gravel substrate, and stream order/ magnitude. Incorporation of detection probability and covariates enabled interpretation of interactions between the two species that may have been missed without their inclusion in the modeling process. Our new 2SMS occupancy model can be used by scientists and managers with a broad range of survey and covariate data to disentangle species interactions problems to help them inform management decisions.
Introduction
Non-native species are particularly adept at exploiting their new ranges and can have profound negative effects on native species that have not adapted to the new pressure (Sanderson et al., 2009). Non-native species have created major problems in many systems making conservation difficult (Sanderson et al., 2009). Billions of dollars are spent on attempts to eradicate non-native species, yet it is often unknown how substantial the effects of the introduced species are on their new system (Sanderson et al., 2009). A major challenge in ecology is thus disentangling interactions of non-native, potentially invasive species, on sensitive native species to ensure management actions targeted at non-natives are warranted.
Conditional two-species occupancy models were developed to examine the effects of dominant species on subordinate species (Richmond et al., 2010) because a species occupancy is often influenced by the presence or absence of interacting species. For example, habitat selection by prey species can be influenced by the presence of predators (Coleman and Hill, 2014), competitive exclusion may prevent inferior competitors from occupying habitat (Wang et al., 2015), or habitat use can be facilitated by the presence of another species (Veblen, 2012). Failure to account for interspecific interactions may lead to biased inference (Rota et al., 2016) and bad management decisions. When examining two species interactions, it is also worth knowing whether occupancy of a dominant species (e.g., non-native) affects the detection probability of the subordinate (e.g., if native species are harder to detect in the presence of a predator; Rota et al., 2016; Weber and Brown, 2019). Correcting for imperfect detection bias is accomplished using repeated surveys (Nichols et al., 2007).
Occupancy of a native species can also be density dependent, where the native and non-native can co-exist at low abundance of the native but at high abundances of the native, the native species is negatively affected, for example if non-native predators are more effective when a native prey population increases (Ingeman, 2016) or competition limits resources (Hasegawa and Nakashima, 2018). Multi-state occupancy models are extensions of occupancy models that incorporate multiple states (e.g., absent, present, abundant; MacKenzie et al., 2009). Current methods for assessing both multiple states and species vary from assessing species independently (e.g., Gould et al., 2019), assessing states separately (e.g., Crockett et al., 2021), or examining multi-species interactions by using the species occurrences as states, e.g., unoccupied by both species A and B, occupied by A only, occupied by B only, or occupied by both species A and B (Rogosch and Olden, 2021). The desired approach may instead be to allow the two species interactions to vary by abundance states in the same conditional model. We are unaware of such a model in the literature; thus, we introduce a two-species multi-state occupancy (2SMS) model that incorporates random effects, detection probability, and covariates. The ability to successfully incorporate habitat covariates is necessary when examining potential negative species interactions because habitat is a major factor determining individual species distributions and could generate co-occurrence patterns that may incorrectly be interpreted as a product of interspecific competitive exclusion (Morrison et al., 2006; Richmond et al., 2010).
Here, we showcase the 2SMS occupancy model using a case study from the Umpqua basin, Oregon where survey data were collected on a non-native piscivore and its potential prey. Smallmouth bass (Micropterus dolomieu) are a non-native species known to reduce abundance, alter habitat use, and extirpate small prey fishes (MacRae and Jackson, 2001). Smallmouth bass are known to feed with increased efficiency in warmer water on a variety of taxa including insects, crayfish, and small fish (Schultz et al., 2017; Franklin et al., 2018). Smallmouth bass are a hypothesized novel predator of Umpqua chub (Oregonichthys kalawatseti), a small warm water minnow endemic to the Umpqua basin (Simon and Markle, 1999) that became a state and federal sensitive species (U.S. Fish and Wildlife Service [USFWS], 2020; Oregon Department of Fish and Wildlife [ODFW], 2021). Smallmouth bass were first introduced into the South Umpqua River in the early 1970s and by the late 1970s had expanded into the mainstem Umpqua River (Simon and Markle, 1999). Concurrently, survey counts of Umpqua chub seemed to decline (Simon and Markle, 1999), while anthropogenic land use increased in the Umpqua basin with greater urbanization and agriculture especially in lower elevations (Geyer, 2003).
Comparisons of survey data between 1987 and 1998 resulted in the hypothesis that the expansion of non-native smallmouth bass throughout the Umpqua basin may be negatively affecting Umpqua chub populations (Simon and Markle, 1999) and that this novel predator was restricting Umpqua chub to lower order, higher elevation tributaries (Simon and Markle, 1999). However, the historical fish surveys of the time had sampling designs that did not account for imperfect detection. Multiple sampling techniques (e.g., seines, minnow traps, electrofishing, and snorkeling) were used without repeated sampling designs that could have resulted in biased conclusions (Peterson and Paukert, 2009). Standardized survey methodology was recently implemented with a repeated sampling design that allows for incorporating imperfect detection bias into the analysis (Peterson and Paukert, 2009). In addition, covariate data were collected which allows testing hypotheses about effects of survey scale (e.g., water temperature, algae, streambed gravel substrate), environmental (e.g., elevation, slope, stream order), and land cover factors on species detection, occupancy, and interactions.
Thus, our objectives were to illustrate how to use our new conditional 2SMS occupancy model that incorporates imperfect detection, survey, environmental, and land cover covariates, and random effects to evaluate the occupancy and potential interactions of a native and non-native. We use standardized repeated snorkel survey data from Umpqua chub and smallmouth bass collected from the previous three decades in the Umpqua Basin as a case study.
Materials and methods
Occupancy model description
We developed our conditional 2SMS occupancy model based on conditional probabilities from two-species models (Richmond et al., 2010) and multi-state models (MacKenzie et al., 2018). We use the Richmond et al. (2010) conditional model parameterization where the occupancy probability for the dominant species is unconditional and the occupancy probability for the subordinate species is conditional on either the presence or absence of the dominant species.
We provide the ability to include both random effects and covariates on detection and occupancy sub models. We use a linear logistic model to model covariates on occupancy and detection probabilities:
where η is the log odds, α is the intercept and β is the slope of the covariate Xi…n.
We account for imperfect detection of species and the potential for non-native presence to affect our ability to detect the native species. We use a conditional binomial version of the combined two-species multi-state occupancy models (Richmond et al., 2010; MacKenzie et al., 2018) to estimate the following parameters:
occupancy probability for non-native regardless of native presence;
occupancy probability for native regardless of abundance, given non-native absent;
occupancy probability that native abundant, given presence and non-native absent;
occupancy probability for native present regardless of abundance, given non-native present;
occupancy probability that native abundant, given presence and non-native present;
detection probability for non-native regardless of native presence;
detection probability for native, given non-native absent;
detection probability of native given non-native present;
detection probability for native, given abundant and non-native absent;
detection probability for native, given abundant and non-native present;
probability evidence of the native abundant state is collected, given non-native absent; and,
probability evidence of the native abundant state is collected, given both species present.
Given the conditional nature of the probabilities, the probability that a site contains a large number of the native species (i.e., the abundant state) is ∗ and ∗ when the non-native species are absent and present, respectively. Similarly, the probability of detecting the abundant state is ∗ and ∗ when the non-native is absent and present, respectively (Table 1). We classified the native species as abundant if the number of individuals counted among non-zero samples was ≥ to the upper 80th percentile (Peterson and Barajas, 2018). This cutoff rule results in the lowest misclassification error (Peterson and Barajas, 2018).
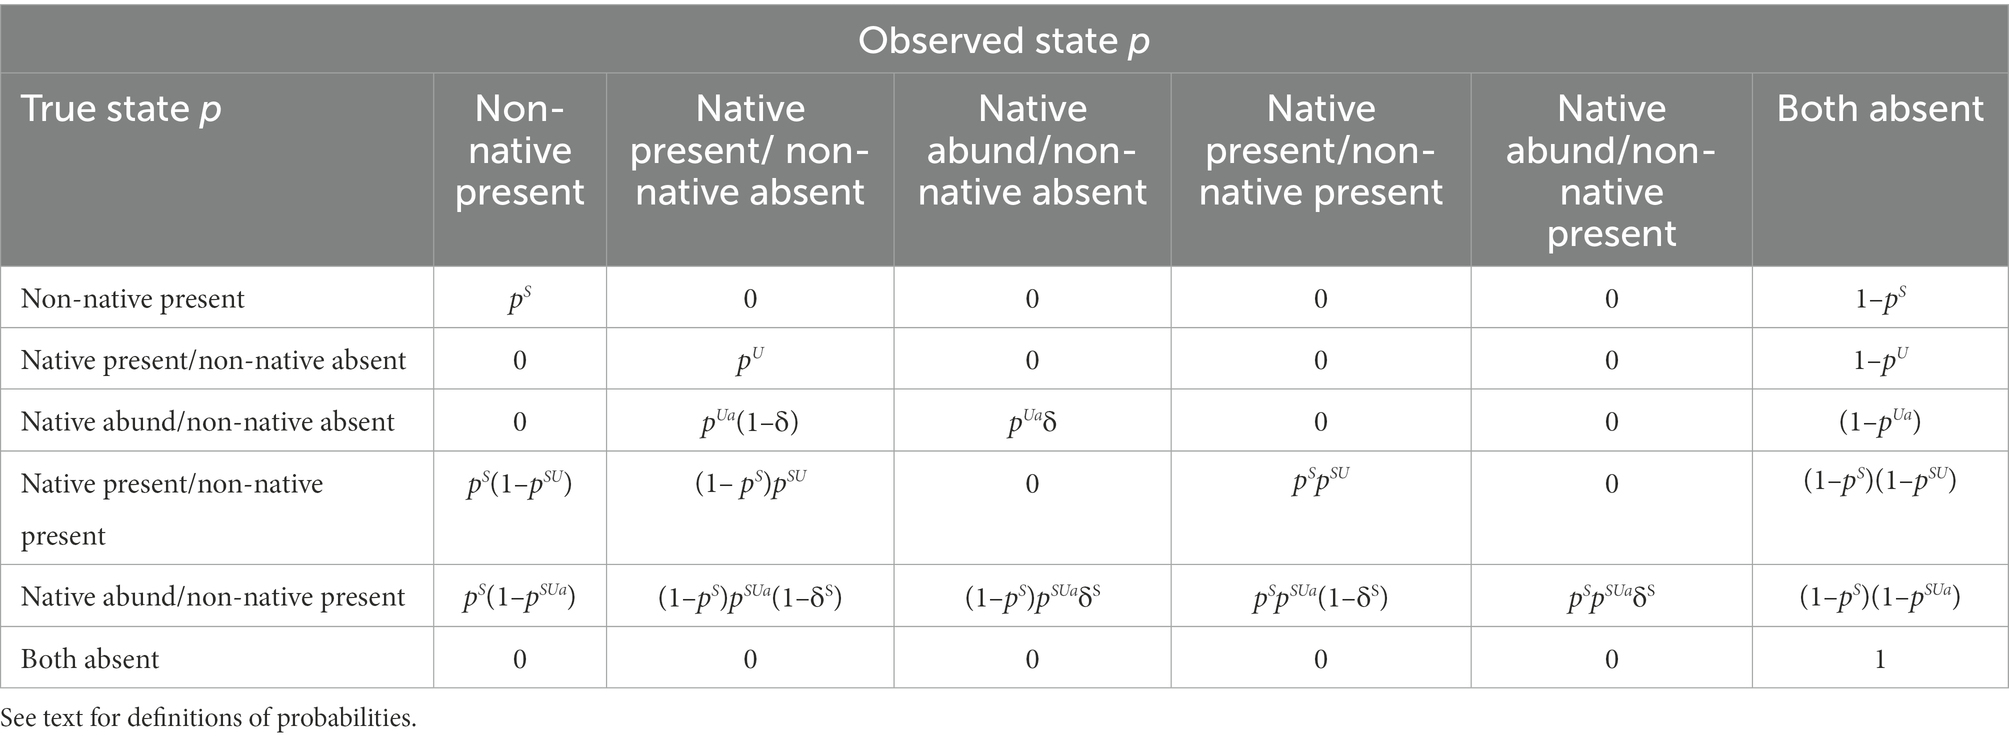
Table 1. Conditional detection probability matrix for the true state given (/) the observed state for the 2SMS occupancy model.
We illustrate how to test for potential species interactions by comparing occupancy and detection probabilities for the native species alone to when they co-occurred with the non-native. That is, if the native is being excluded by the non-native, we would expect and/ or < and/ or , otherwise we would expect the same chub occupancy probability regardless of whether bass were present or not. Alternatively, the native may not completely avoid sites used by the non-native, but exhibit anti-predation behaviors such as seeking cover, resulting in a lower detection probability of natives at sites used by non-natives (i.e., and/ or < and/ or ).
We also calculated a species interaction factor (SIF) to quantify the relationship between conditional occupancy probability of the native species present given the non-native species is present compared to the unconditional occupancy probability of the native and the non-native species (Richmond et al., 2010). The unconditional probability of occupancy for the native species , i.e., regardless of whether the non-native is present or absent, can be calculated using parameters in the model as (Richmond et al., 2010):
The 2SMS model indirectly estimates the SIF that is simply a ratio of how likely the native species is to occur conditional on the non-native being present compared to what would be expected under a hypothesis of independence, i.e., the unconditional occupancy of the two species (Richmond et al., 2010):
Thus, the SIF is the ratio of the conditional probability of both species occurring together over the unconditional probability of bass occurring alone and the unconditional probability of chub occurring alone. An SIF close to one indicates that the two species occur independently, a value less than one indicates that the native species is less likely to occur in the presence of the non-native, and a value greater than one indicates that the native is more likely to co-occur with the non-native (MacKenzie et al., 2018). Both conditional and unconditional parameterizations of the species interaction factor have been used extensively and recently to examine co-occurrence patterns, e.g., species interactions, of salamanders (MacKenzie et al., 2004), vipers (Luiselli, 2006), owls (Bailey et al., 2009), rails (Richmond et al., 2010), jaguars and pumas (Gutiérrez-González and López-González, 2017), tigers and leopards (Kafley et al., 2019), bears (Ngoprasert et al., 2022) turkeys and pigs (Walters and Osborne, 2022), and mesocarnivores (Hernandez-Puentes et al., 2022) to cite a few of many.
Case study
Study species
The Umpqua chub is a small minnow endemic to the Umpqua basin, Oregon (Markle et al., 1991). The species is typically associated with high daytime water temperature (x̄ = 21.5°C, range 17–26°C), aquatic vegetation, and overhanging riparian vegetation, usually grasses and shrubs in slow water and behind grassy hummocks in faster moving water (Pearsons, 1989; Markle et al., 1991). Umpqua chub are associated with both erosional and depositional substrates, bedrock, and green algae that is attached to rocks or trees submerged in shallow streams (Pearsons, 1989). Females spawn in spring and early summer and use bare rocks for nest sites (Markle et al., 1991). Infaunal chironomids make up most of the diet by numbers of prey consumed (89%) and sand grains were in 70% of stomachs (Pearsons, 1989; Markle et al., 1991) suggesting an association with, or selection for benthic habitat.
Smallmouth bass were introduced into Oregon in the mid-1920s (Lampman, 1946) and into the South Umpqua River sometime after 1964 (Simon and Markle, 1999). Smallmouth bass use diverse habitats across river systems that vary in physical characteristics (i.e., land use type, stream size, water temperature, slope, drainage class, climate, and hydrology; Brewer et al., 2007; Dauwalter et al., 2007; Brewer, 2011; Schall et al., 2019). Smallmouth bass are typically associated with rocky substrates, larger stream segments, coarse substrates, reduced current, and higher water temperatures (Brewer et al., 2007). Smallmouth bass can move large distances (≥30 km) into and out of the Umpqua Basin when water temperature increases in the summer and then decreases in the fall (Lawrence et al., 2012; Rubenson and Olden, 2017). Smallmouth bass can be affected by urban and agricultural practices and soils with high runoff potential (Brewer et al., 2007).
Study system and sampling
There are six currently known populations of Umpqua chub that are genetically distinct (O’Malley et al., 2013) and distributed among eight watersheds in the Umpqua River basin; Smith River, Elk Creek, Calapooya Creek, mainstem Umpqua River, North Umpqua River, Olalla Creek, Cow Creek, and South Umpqua River (Figure 1). The basin drains an area of 12,100 km2 and has a mean annual discharge of 208 m3s−1 near Elkton (Jones et al., 2020). There is large streamflow variability in the basin, e.g., most tributaries of South Umpqua have large seasonal variation in flow with lowest in summer and lack or have narrow floodplains while the North Umpqua has little seasonal variation in flow (Markle et al., 1991). The higher elevations are mostly public and private forest lands, whereas the lower elevations and floodplains are mostly agricultural, residential, and industrial lands (Jones et al., 2020). The lowest elevations are found in Smith River (0–80 m), Elk Creek (20–150 m) and the Mainstem Umpqua River (0–190 m) in the northwest closest to the mouth of the Pacific Ocean, while the highest elevations are in Cow Creek (200–550 m) and South Umpqua River (200–550 m), with Calapooya Creek (100–250 m), North Umpqua River (110–250 m), and Olalla Creek (150–450 m) having an intermediate span of elevations.
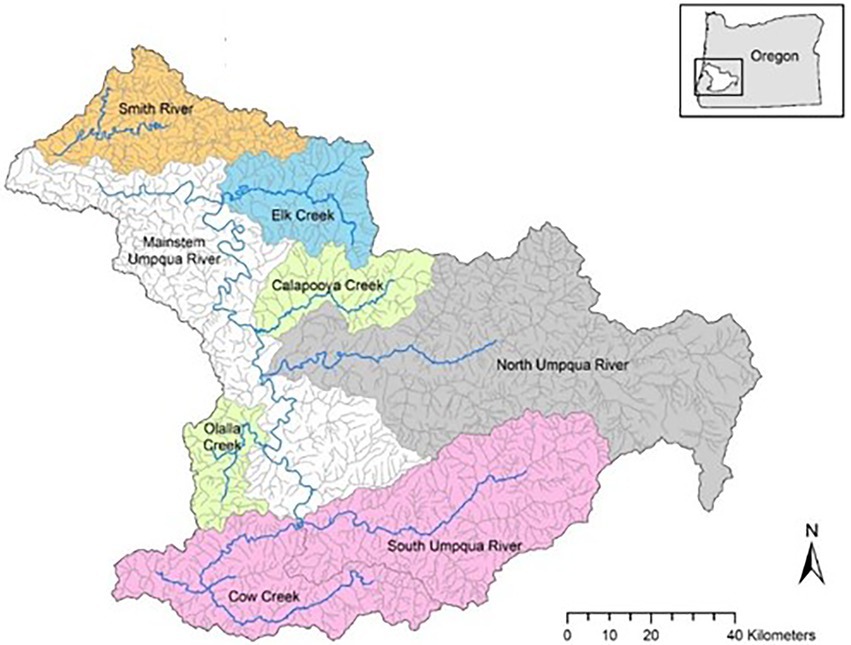
Figure 1. The eight watersheds (labeled) in the Umpqua basin where native Umpqua chub and non-native smallmouth bass were snorkel surveyed from 2006 to 2021 with location in Oregon, United States (box). Colors represent distinct evolutionary populations of Umpqua chub (O’Malley et al., 2013). Map reproduced with permission from ODFW (2021).
The sensitive status of the Umpqua chub led to standardized snorkel surveys that had similar methodology and occurred at random survey sites from July through September 2006–2007, 2015–2017, 2019, and 2021. Most sites were surveyed by one or two snorkelers per stream (Oregon Department of Fish and Wildlife [ODFW], 2021). The survey crew started at the downstream site boundary, sampled in an upstream direction, and each person counted all Umpqua chub and smallmouth bass observed within about 2-m from the stream bank (Oregon Department of Fish and Wildlife [ODFW], 2021). Additional surveyors were added to the survey crew to count fish along the middle portion of the stream channel at some of the larger more complex sample sites (Oregon Department of Fish and Wildlife [ODFW], 2021). Crews counted all Umpqua chub and smallmouth bass encountered. Sites sampled in 2006 and 2007 were surveyed once but were repeated on consecutive days in the remaining years (i.e., 2015, 2016, 2017, 2019, 2021). Given the relatively short time between surveys (1 day), we believe we met the assumption that populations were closed (MacKenzie et al., 2018).
Covariates
Based on previous research (Markle et al., 1991; Brewer et al., 2007; Oregon Department of Fish and Wildlife [ODFW], 2021) on Umpqua chub and smallmouth bass, we developed survey scale covariates from habitat measurements that included percent of the streambed covered with aquatic vegetation, overhanging vegetation, wood, algae, and streambed substrate for silt and sand (particle size <2 mm), gravel (2–65 mm), cobble (65–256 mm), boulder (>256 mm), and bedrock which were visually assessed based on the areal coverage relative to the wetted surface area (Table 2). We calculated average water temperature from measurements recorded immediately prior to each sampling occasion (Oregon Department of Fish and Wildlife [ODFW], 2021), wetted surface area (m2; survey length multiplied by average wetted width), day of year (the sequential day number starting with day 1 on January 1), and survey effort (the total duration in minutes of the survey). We interpolated any missing covariate records (12–25% missing/ covariate) with R package mice which imputes missing values with plausible values drawn from a distribution specifically designed for each missing datapoint (van Buuren and Groothuis-Oudshoorn, 2011). We used digital elevation maps (U.S. Geological Survey [USGS], 2013) to calculate environmental covariates including mean elevation, slope, stream order and magnitude (Shreve, 1969) from the start and end points of each unique snorkel survey (Table 2).
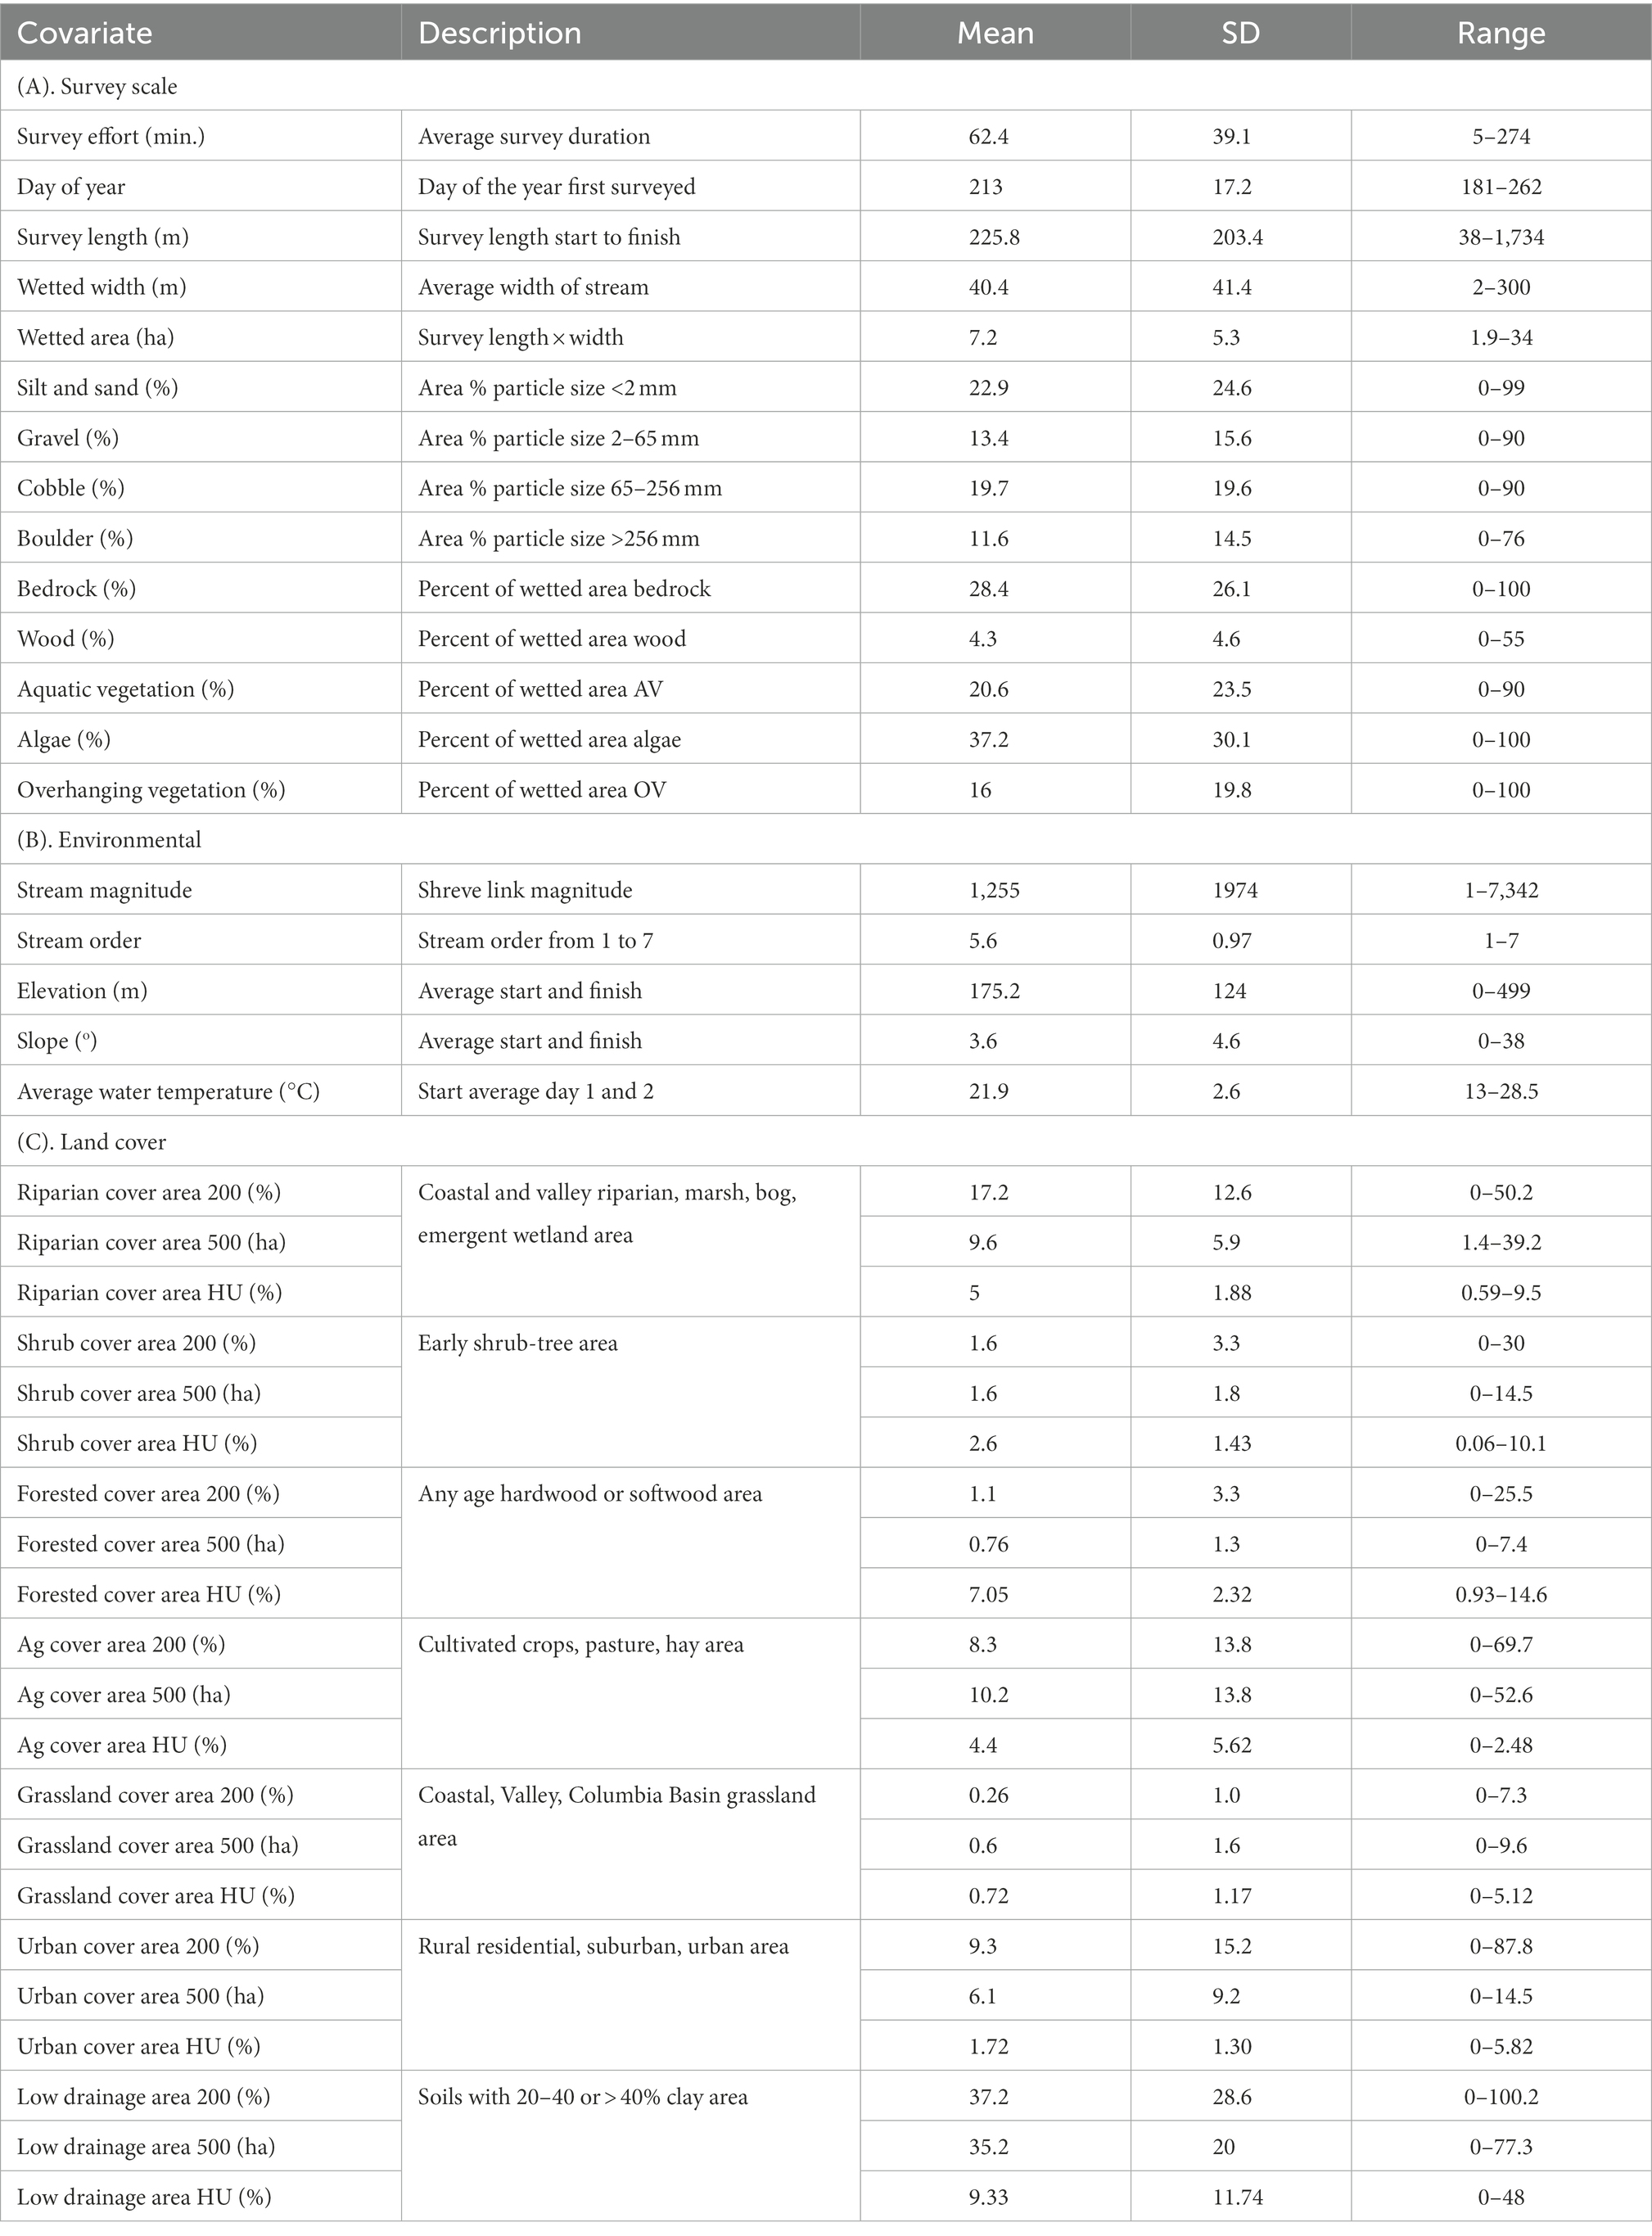
Table 2. Descriptions and summaries of (A) survey scale, (B) environmental, and (C) land cover covariates extracted from three buffer sizes; (1) 200 m width, variable area, (2) 500 m radius circular 78.5 ha, and (3) hydrological unit (HU12) watersheds for 304 snorkel surveys during 2006–2021 within the Umpqua basin, Oregon, United States.
We also developed scale-dependent land cover covariates based on characteristics known to influence chub and bass presence (e.g., land cover type, drainage class; Markle et al., 1991; Brewer et al., 2007; Dauwalter et al., 2007; Schall et al., 2019) using ARCGIS 10.8.1 for each unique survey (Table 2). During 2006, two 100 m surveys were conducted either adjacent to each other or located with a short gap (15–150 m) between the start and end points so we randomly chose one survey to include in the analysis. We extracted land cover covariates to represent three spatial scales: (1) the small-scale survey, (2) the mid-scale stream, and (3) and the watershed. At the smallest scale, i.e., survey, we derived covariates using variable-area (i.e., 1.58–68.93 ha) rectangular buffers with a width of 200 m around straight-line variable-length transects between the start and end points of each survey. At the mid-scale stream, we generated 500 m radius buffers (78.5 ha) around the straight-line midpoint of each survey. At the watershed scale, we derived variables from 2021 USGS watershed boundary dataset Hydrologic Unit 12 (HU12) shapefiles. We aggregated habitat categories from the Oregon Spatial Data Library Oregon Statewide Habitat Map which is based on 2018 imagery to develop the land cover covariates (Table 2). We also used the USDA soil survey geographic database soil hydrology shapefile to develop a covariate for low drainage (i.e., soil types C and D with 20–40% clays and > 40% clays respectively; Table 2). We then calculated the percentage of the 200 m buffers in a land cover category, e.g., percent riparian land cover area in a 200 m wide buffer, the area in hectares for 500 m radius circular buffers, and the percent of the HU12 buffer. All continuous covariates were standardized with a mean of zero and standard deviation of one. To evaluate differences among time periods, we created binary indicator variables (0.1) for period one, 2006–2007; period two, 2015–2017; and period three, 2019–2021.
Bayesian implementation and model selection
We aimed to estimate occupancy and detection of Umpqua chub and smallmouth bass. We classified the native species Umpqua chub by the states absent, present, and abundant (≥80th percentile; Peterson and Barajas, 2018) and the non-native Smallmouth bass as absent and present. We first determined the best approximating variance structure for the random effects, i.e., stream, watershed, or survey site to account for unexplained variation in multiple surveys that may be dependent (Royle and Dorazio, 2008). We chose the combination of random effects that resulted in the lowest deviance (>2; Peterson and Barajas, 2018) for both detection and occupancy sub models on the global model. We evaluated survey scale and environmental covariates in detection and occupancy sub models and added scale-dependent land cover covariates in occupancy sub models (Table 2). Due to computing times associated with the total number of covariates in the global model, we analyzed covariates in groups of like, uncorrelated variables according to subheadings and spatial scales in Table 2. We included only covariates that were not strongly correlated (r < |0.7|) that had the best potential to explain relationships in each sub model (Moore and McCabe, 1993).
We identified covariates to include in our final, reduced model using model selection with indicator variables by multiplying the coefficient for each covariate occurring in the group global model by a latent, binary indicator variable (Kuo and Mallick, 1998; Hooten and Hobbs, 2015). To evaluate variable importance, we then examined the posterior probabilities of the indicator variables where each unique sequence of indicator variables is a candidate model (Kuo and Mallick, 1998). We then used the indicator variable process on the combined uncorrelated covariates in the top models from each grouping in each sub model. We base our inferences on covariates in the reduced models with the greatest support within 15% of the top model. We summarize posterior distributions of the estimated parameters (i.e., for p, Ѱ) in the final reduced models (i.e., covariates from the model with highest posterior probability) and covariates with their mean and 90% credible interval. We calculated odds ratios for parameters in the best model to aid in the interpretation of effect sizes (Hosmer et al., 2013) and only included covariates if the 90% credible intervals did not contain one.
We used Markov Chain Monte Carlo (MCMC) in JAGS (Plummer, 2012) implemented in R statistical software (R Development Core Team, 2021). All candidate models were fitted with three chains running 120,000 iterations, 10,000 adaptation samples and burn-in samples, and minimally informative priors on log-scaled parameters (Gelman et al., 2008). Convergence of each model was assessed by the potential scale reduction factor ( ; Brooks and Gelman, 1998) and was assumed when < 1.05.
Results
Case study results
Survey crews counted a total of 13,114 Umpqua chub (range 0–1,062) and 16,249 smallmouth bass (range 0–440) during non-repeated (n = 158; 2006–2007) or repeated single pass snorkel surveys (n = 195; 2015–2021; Table 3A). Both species were found in all eight watersheds (Tables 3A–C). The majority of chub included in the 2SMS occupancy analysis were counted in South Umpqua River (9,233; 70%) and Cow Creek (1,993; 15%) where the majority of surveys (26 and 20% respectively) occurred (Tables 3A–C). We counted the fewest chub in the Mainstem Umpqua River (8; <1% in 16% of surveys) and Olalla Creek (29; <1% in 2% of surveys; Table 3A). The majority of smallmouth bass were counted in the Mainstem Umpqua River (9,240; 56% in 16% of surveys) and South Umpqua River (5,284; 33% in 70% of surveys) with the fewest counted in Olalla Creek (13; <1% in 2% of surveys) and North Umpqua River (47; <1% in 5% of surveys; Table 3A). The 80th percentile of the number of native Umpqua chub counted was 67, which we used to define the lower threshold for the chub abundant state. Umpqua chub were present (not abundant) during 34% and were abundant during 8.3% of surveys. The two species were detected overlapping during 21% of snorkel surveys.
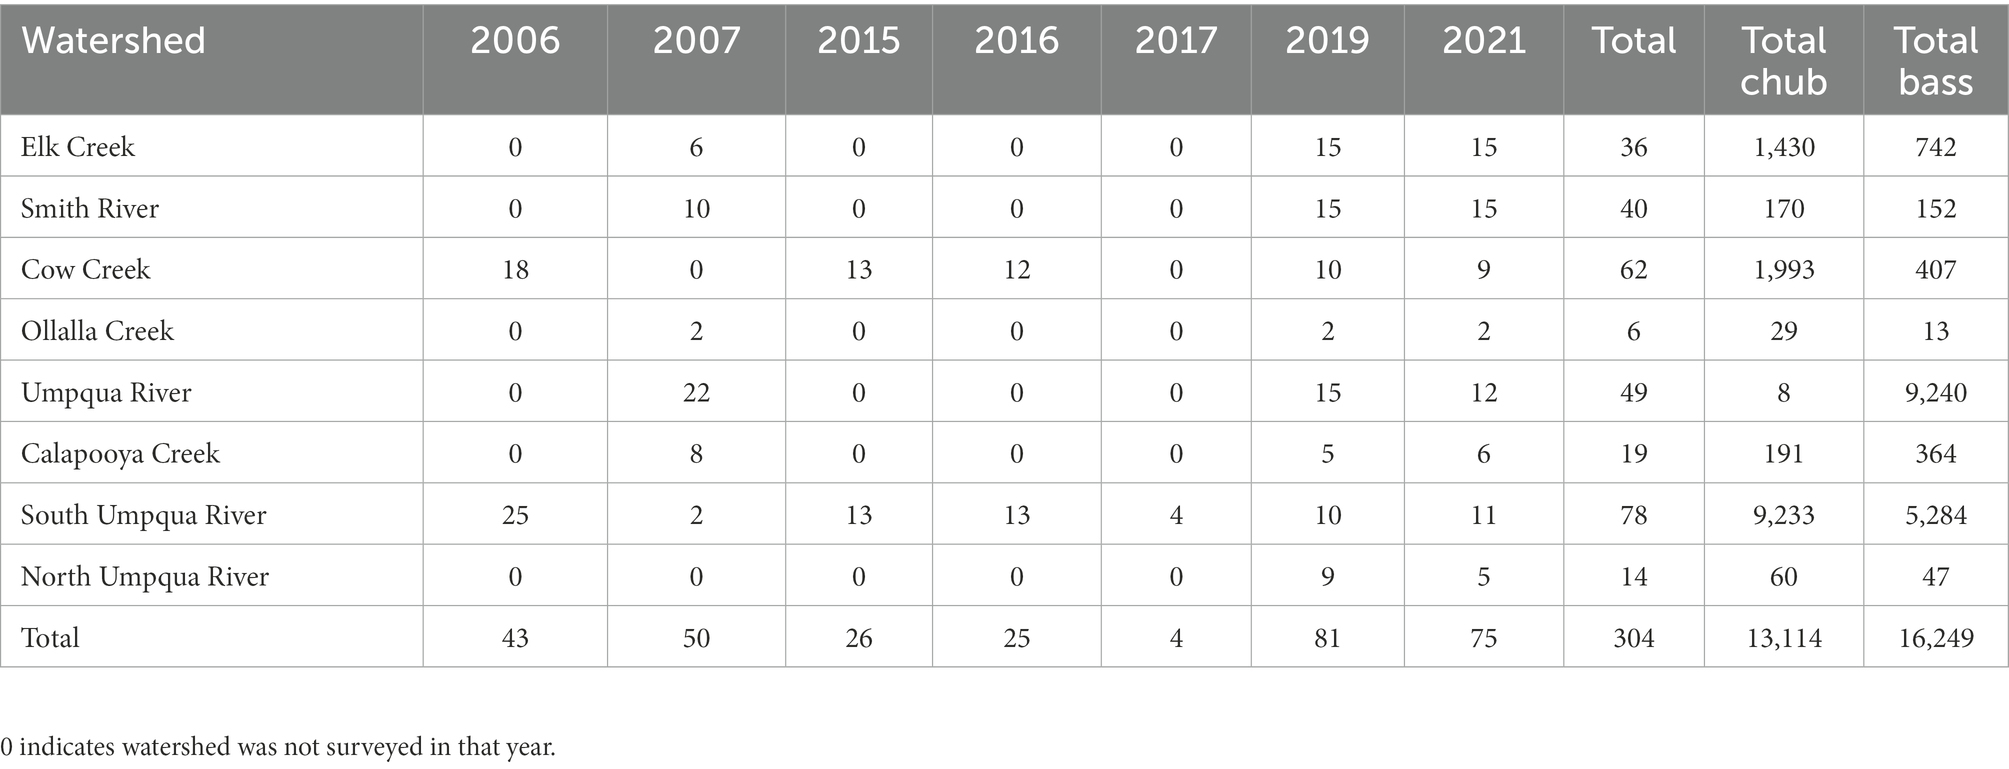
Table 3A. The number of sites snorkel surveyed in two-species multi-state models, by watershed and year (2006–2021) and the total number of native chub and non-native bass counted within the Umpqua basin, Oregon, United States (2006–2007 surveys only surveyed once).
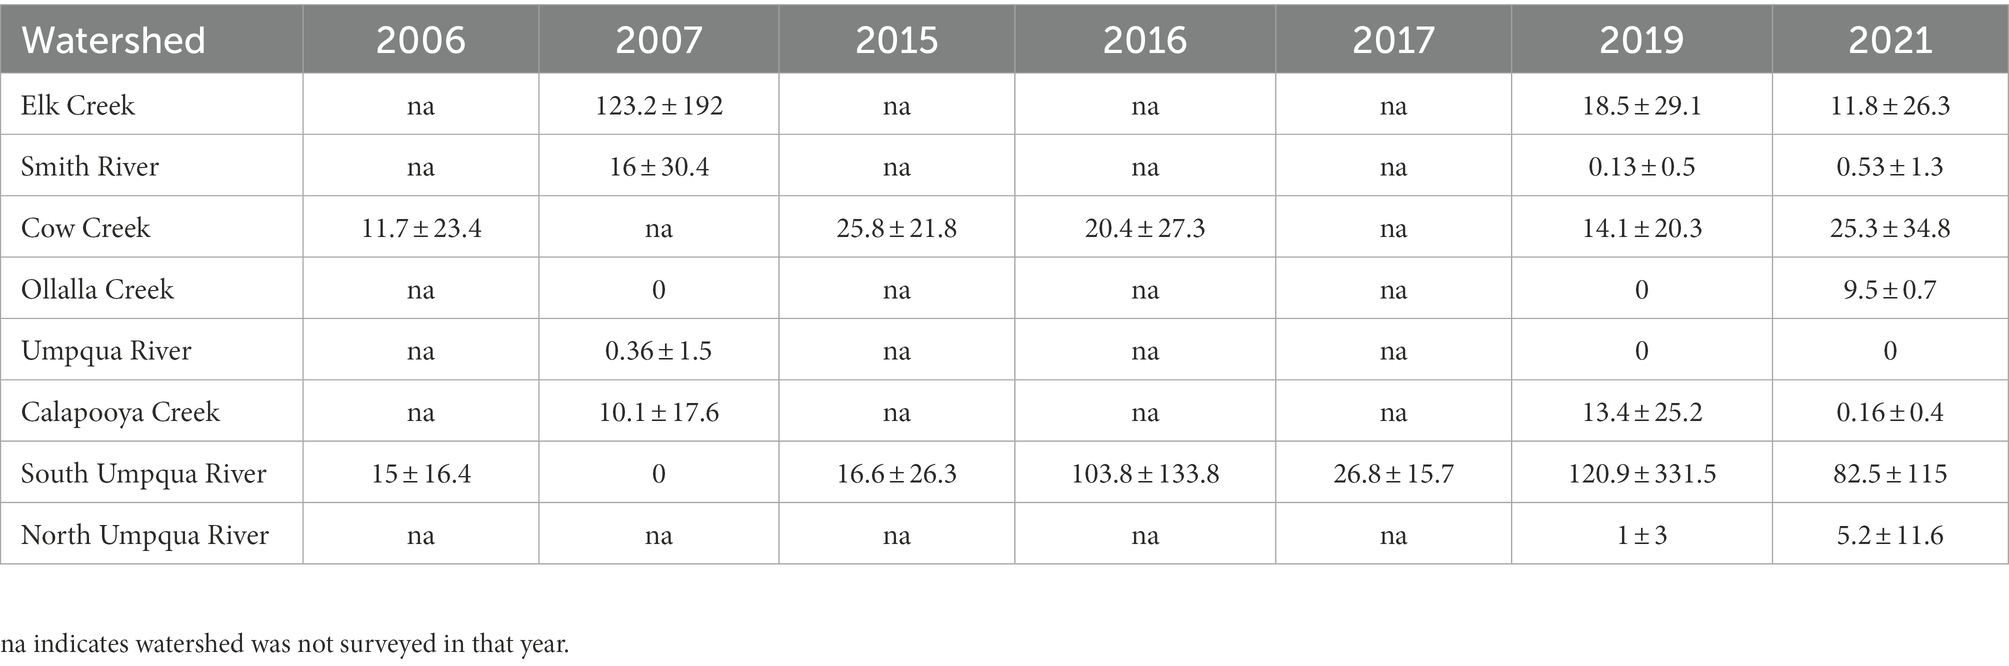
Table 3B. The mean standard deviation of the maximum number (between repeated surveys) of Umpqua chub in two-species multi-state models, by watershed and year (2006–2021) counted within the Umpqua basin, Oregon, United States (2006–2007 surveys only surveyed once).
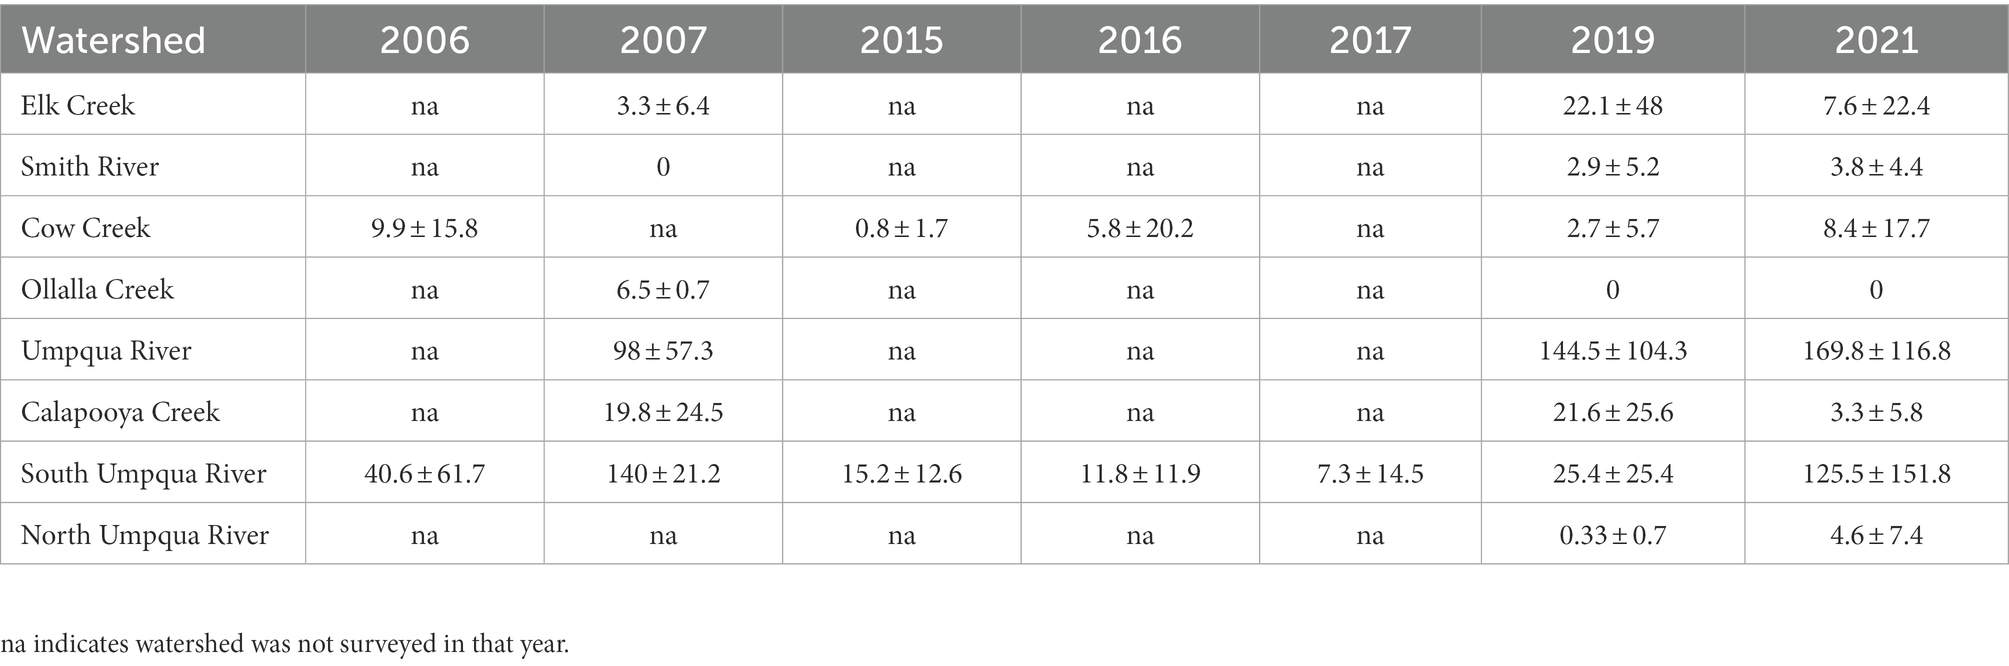
Table 3C. The mean ± standard deviation of the maximum number (between repeated surveys) of smallmouth bass in two-species multi-state models, by watershed and year (2006–2021) counted within the Umpqua basin, Oregon, United States (2006–2007 surveys only surveyed once).
Species interactions
Occupancy and detection probability comparisons indicate little biological effect of the non-native smallmouth bass excluding the native Umpqua chub in either the present or abundant states and there may even be a propensity for co-occurrence. We can conclude this because overall native chub occupancy was higher in the present state when the non-native bass was present (0.18 ± 0.05) versus absent (0.14 ± 0.02; Table 4). In addition, the native chub had higher occupancy in the abundant state when the non-native bass was present (0.19 ± 0.03) versus absent (0.08 ± 0.02). However, detection probabilities for the native chub in the present state were higher when the non-native bass was absent (0.82 ± 0.050) compared to when present (0.34 ± 0.12) but were similar when native chub were in the abundant state regardless of whether the non-native bass was present (0.21 ± 0.11) or absent (0.24 ± 0.15; Table 4). This indicates native chub are more difficult to detect in lower numbers when non-native bass are present. The SIF was well above 1.00 at 6.75 ± 5.54 SD indicating the native species Umpqua chub was strongly associated with, and not being excluded by the non-native species smallmouth bass (Table 4).
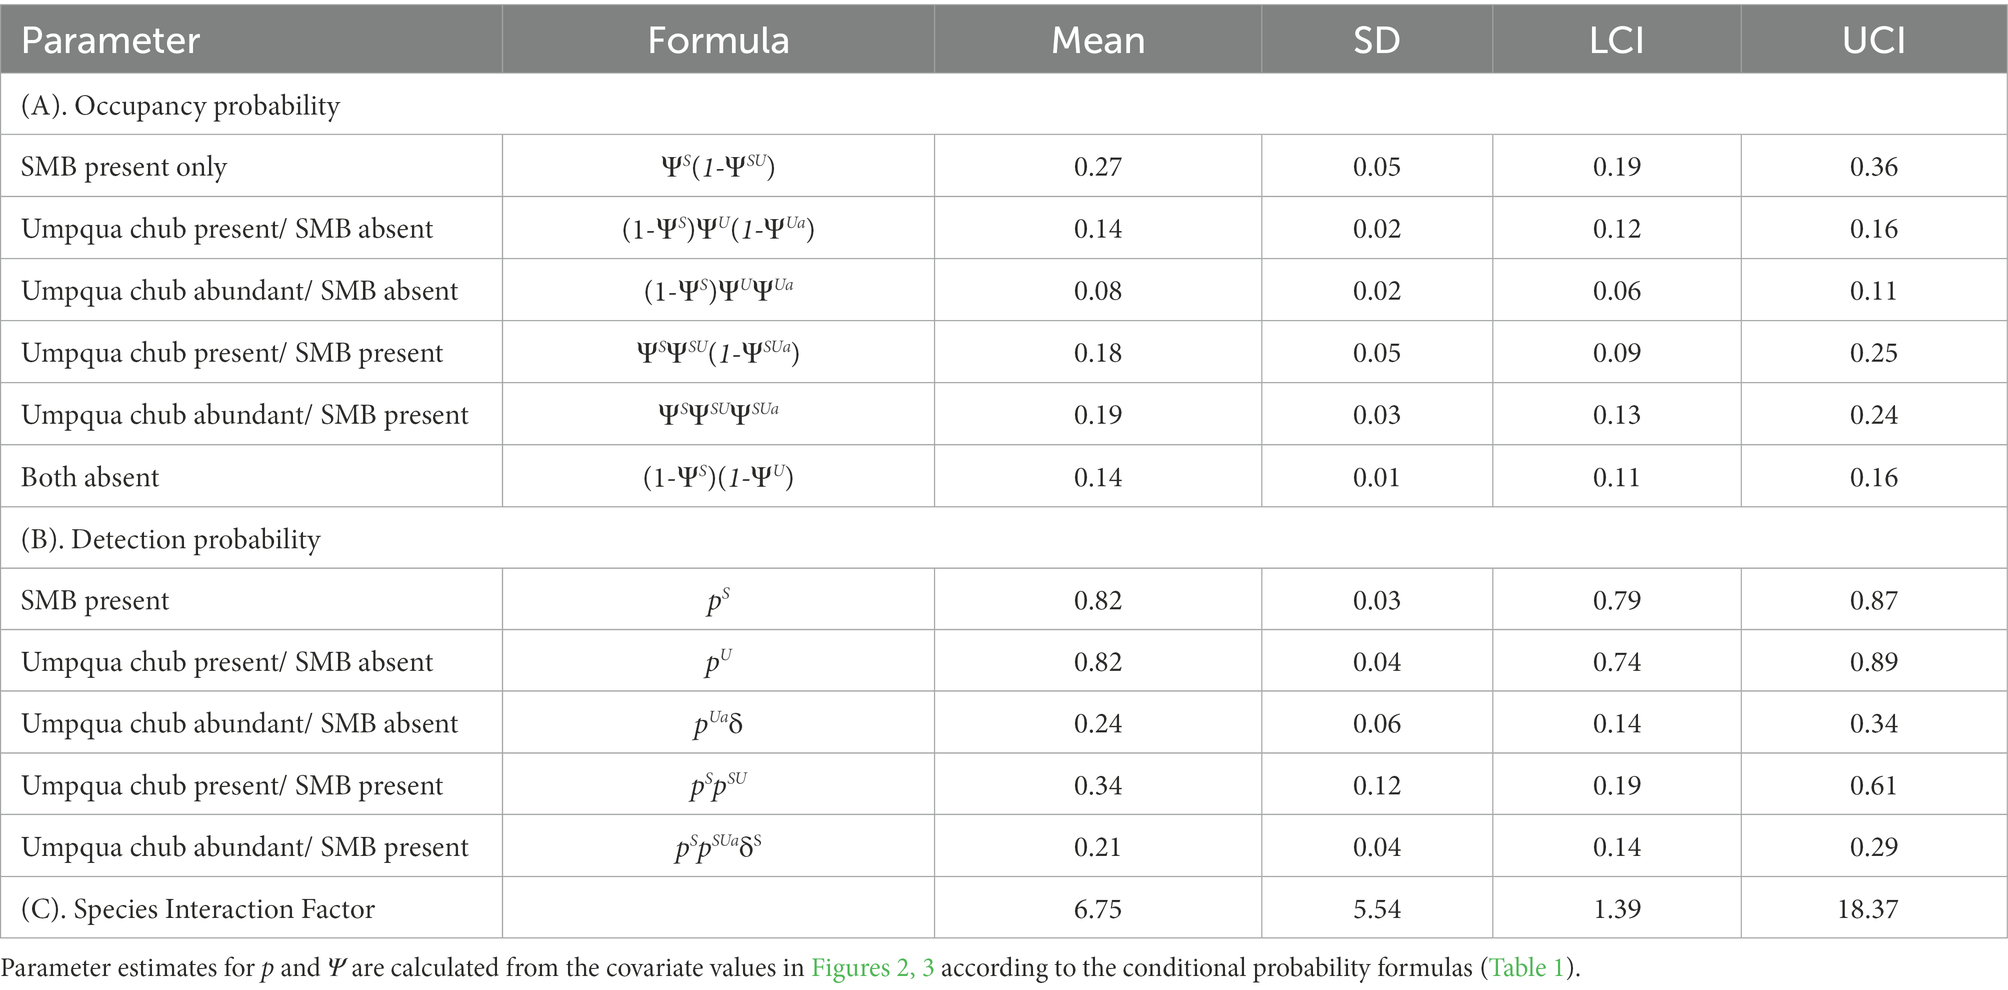
Table 4. Parameter estimates for (A) mean occupancy probability for each state, (B) probability of detecting the true state, and (C) species interaction factor with standard deviation (SD), and lower (LCI) and upper (UCI) 95% credible intervals from best approximating Umpqua chub/ smallmouth bass (SMB) 2SMS model from the Umpqua basin, Oregon, United States.
Umpqua chub had the highest occupancy in sites in the South Umpqua River watershed in both the present and abundant states when smallmouth bass were also present (Figure 2). Chub had close to no probability of being present or abundant when bass were absent in this watershed (Figure 2). Outside of the South Umpqua River watershed, bass had variable interactions with chub (Figure 2). Umpqua chub had higher probability of being present and abundant in the mainstem Umpqua River when bass were present, more abundant when bass were present in Cow Creek and Olalla Creek and higher probability of being present with bass in Calapooya Creek (Figure 2). In Olalla Creek and Cow Creek, the occupancy probability of Umpqua chub was higher when bass were absent (Figure 2). In summary, there were no clear occupancy trends of the non-native excluding the native evident among watersheds in the Umpqua basin when all years are summarized together.
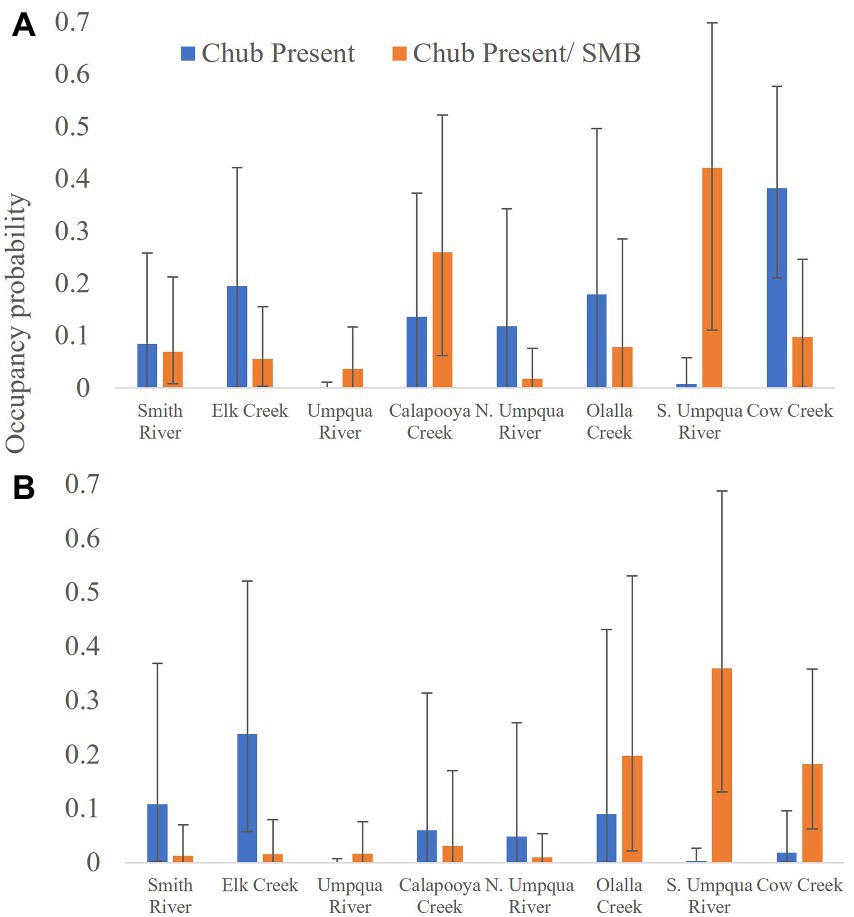
Figure 2. Estimated occupancy probability by watershed for (A) Umpqua chub given smallmouth bass (SMB) are present (orange bars) and absent (blue bars) and (B) Umpqua chub abundant given smallmouth bass are present or absent with 95% credible intervals. Numbers indicate total number of snorkel surveys conducted per watershed in the Umpqua Basin, Oregon, United States, 2006–2021.
Covariates and random effects on occupancy and detection
The best combination of random effects included watershed for the occupancy process and no random effects for the detection process. We did not find an effect of period on occupancy from 2006 to 2021. Many covariates were in the detection and occupancy sub models (Figures 3, 4 and Supplementary Table 1) and we further consider only covariates with confidence intervals that do not overlap zero because the direction of the relationship cannot be determined. We explore several with the largest effect sizes to illustrate how covariates can help with interpretation of species interactions. Elevation had the largest effect sizes and was in the most occupancy sub models (Figures 3A, 4B–D). The non-native species smallmouth bass were 13.7 times more likely to occupy a site for every one-meter decrease in elevation with much higher probability of occurrence at lower elevations within a watershed (Figure 5A). The large watershed random effect for non-native bass shows differences in occupancy at varying elevations within watersheds, e.g., 100% occupancy at 0 m to 0% occupancy at 300 m versus 100% occupancy at 300 m and 5% occupancy at 500 m elevation (Figure 5A). The two species were 6.2 times more likely to co-occur with every one-meter increase in elevation with much higher probability of co-occurrence >350 ≤ 499 m (Figure 5B). The native species chub in the abundant state with the non-native bass absent was 12.7 times more likely with every one-meter decrease in elevation with much higher probability of occurrence <200 m with >80% occurrence ~0 m elevation all watersheds (Figure 5C). However, if the non-native was present, native occupancy in the abundant state was 15.2 times more likely for every one-meter increase in elevation with much higher probability of occurrence >350 m ≤ 499 m, similar to chub co-occurrence with bass in the present state (Figure 5D).
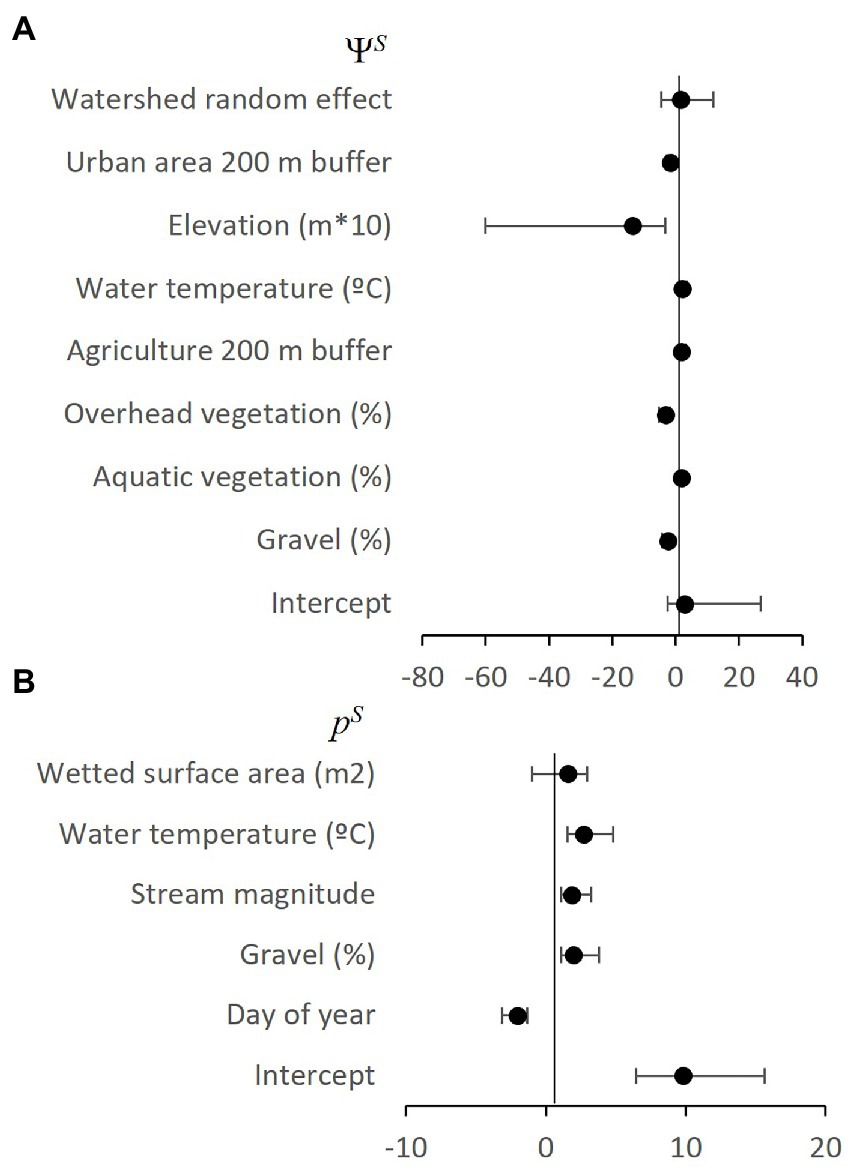
Figure 3. Non-native smallmouth bass occupancy (A: ΨS) and detection (B: pS) parameter estimates, with upper (UCI) and lower (LCI) 90% credible intervals estimated from best approximating 2SMS model from the Umpqua basin, Oregon, United States. Note, negative estimates were converted to positive odds ratios to aid interpretation.
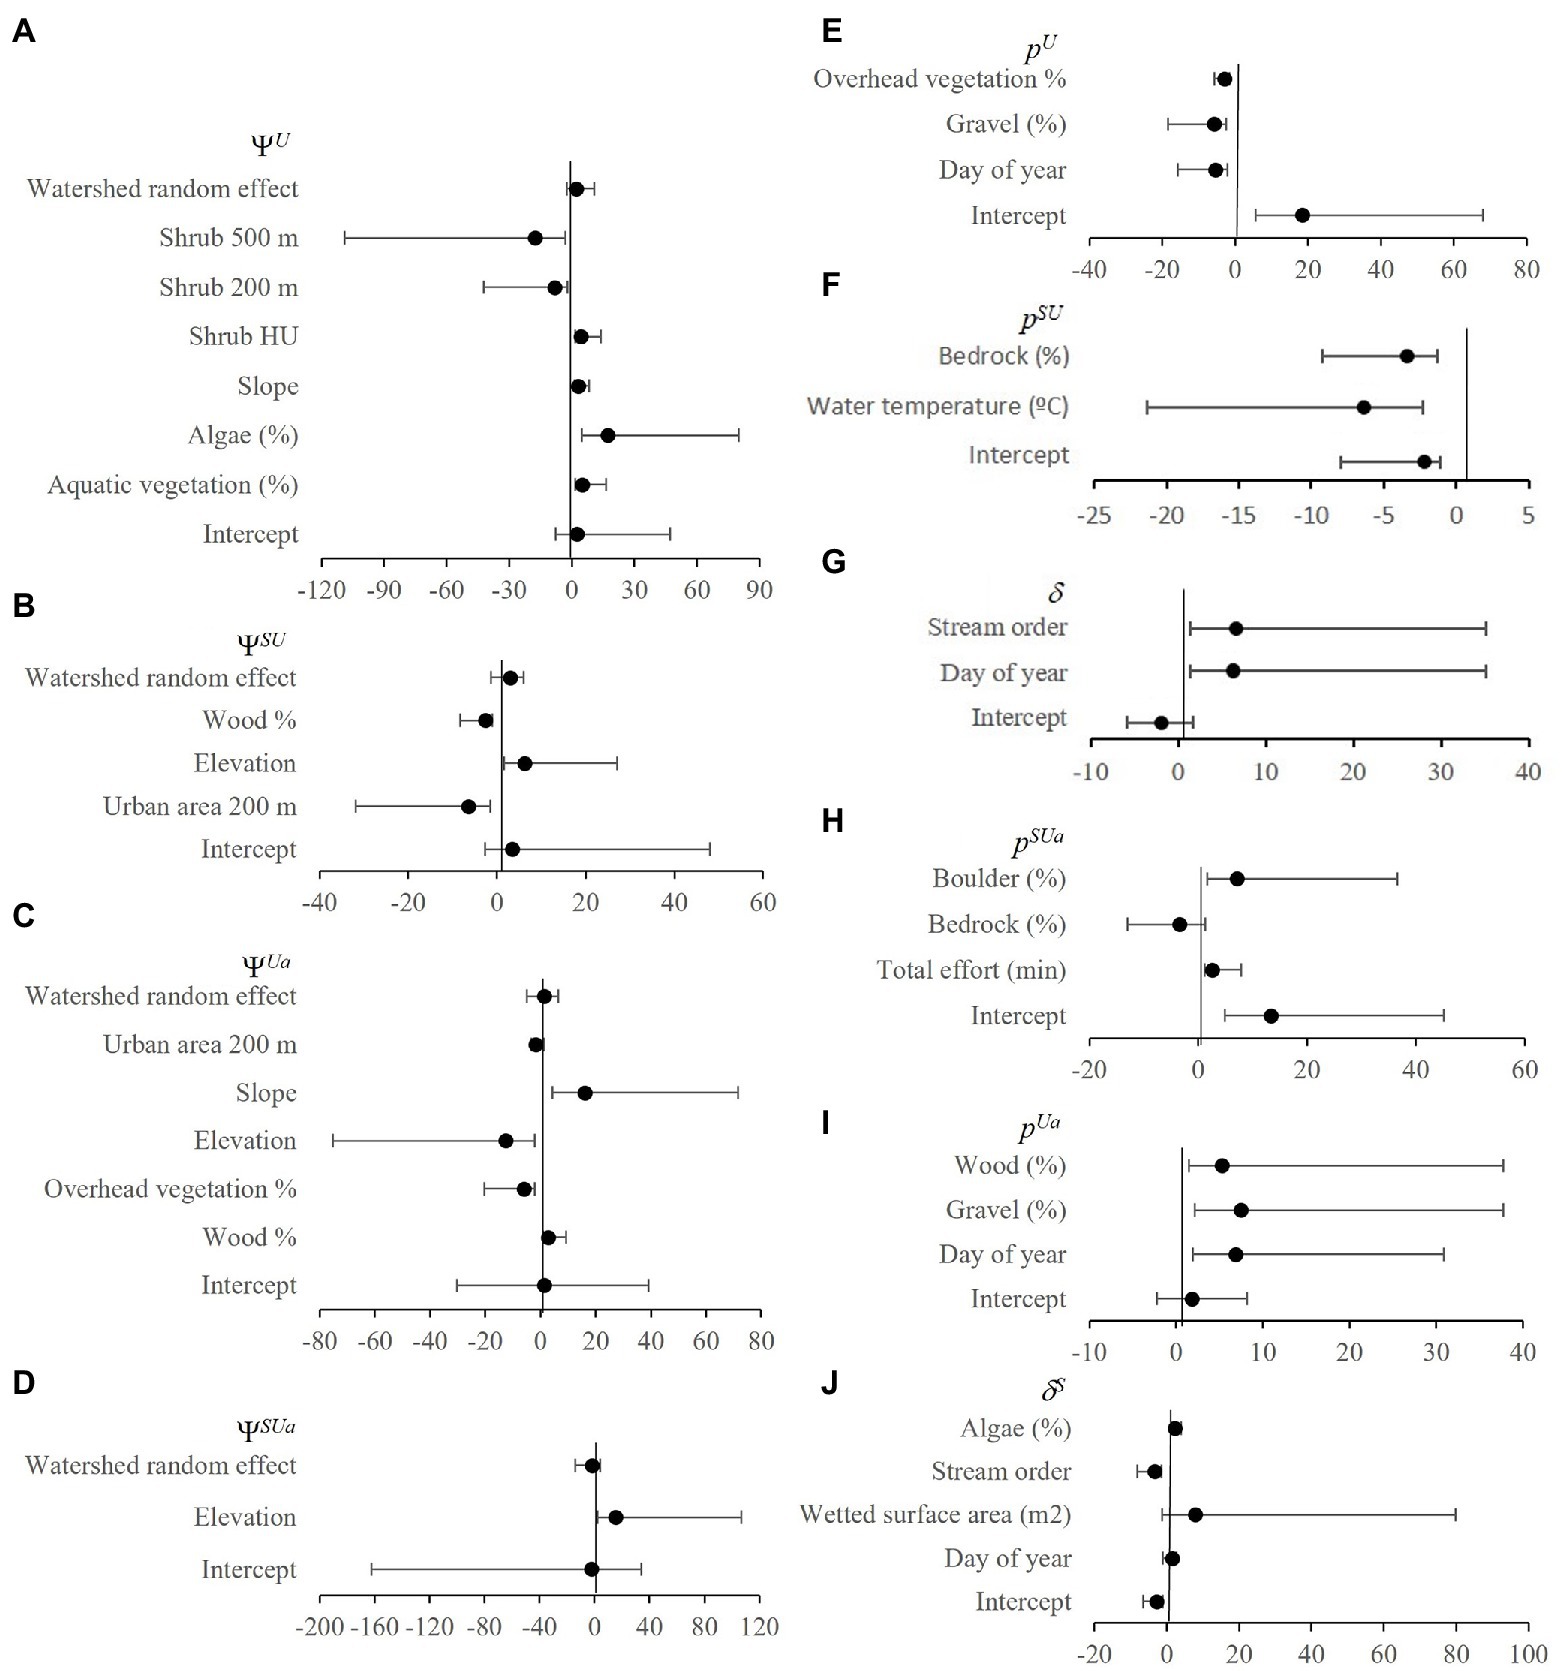
Figure 4. Occupancy (Ψ; A–D) and detection (p; E–J) odds ratios with upper (UCI) and lower (LCI) 90% credible intervals from best approximating native (Umpqua chub)/ non-native (smallmouth bass) 2SMS models from the Umpqua basin, Oregon, United States. Note, negative estimates were converted to positive odds ratios to aid interpretation.
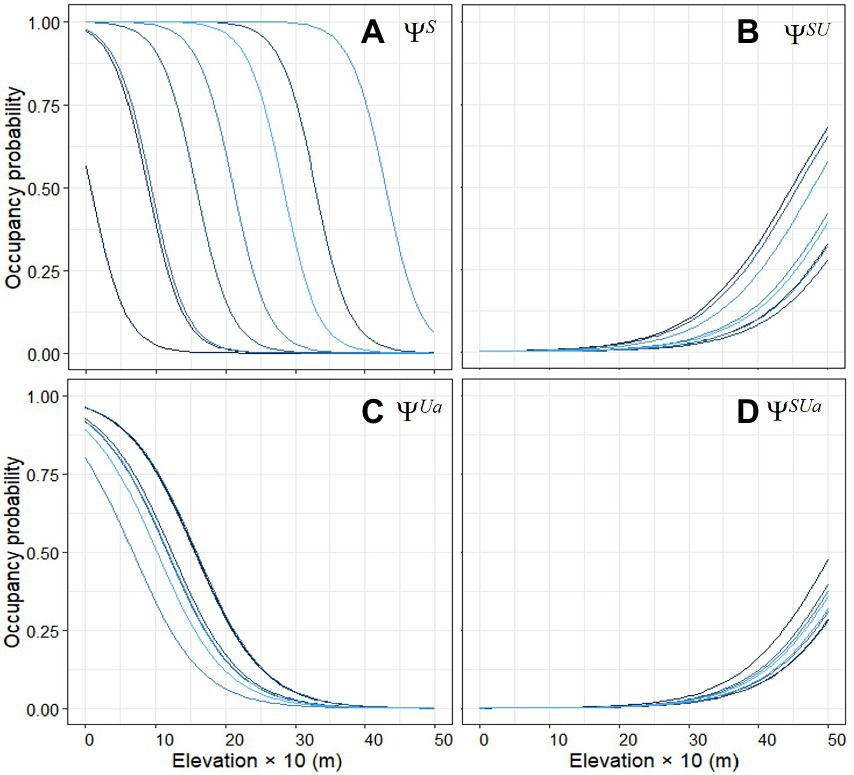
Figure 5. Empirical Bayes plots of the marginal occupancy probability of (A) non-native smallmouth bass present, (B) native Umpqua chub present/ bass present, (C) native Umpqua chub abundant/ non-native bass not present, and (D) native Umpqua chub abundant/ non-native bass present, with elevation during 2006–2021 snorkel surveys. Each colored line represents a different watershed in the Umpqua basin, Oregon, United States.
Chub occupancy probability was 17.3 times more likely with each 1% increase in algae cover reaching almost 100% occupancy with 100% algae cover (Figure 6A). Algae cover was not related to bass occupancy. The area of urban land cover in a 200 m wide buffer had similar negative effects on non-native bass occupancy (Figure 3A) and native chub occupancy (Figures 4B,C). Similarly, chub occupancy was 8.3 and 17.6 times more likely with every 1% decrease in the percent of shrub area in a 200 and 500 m buffer, respectively, (Figures 6B,C).
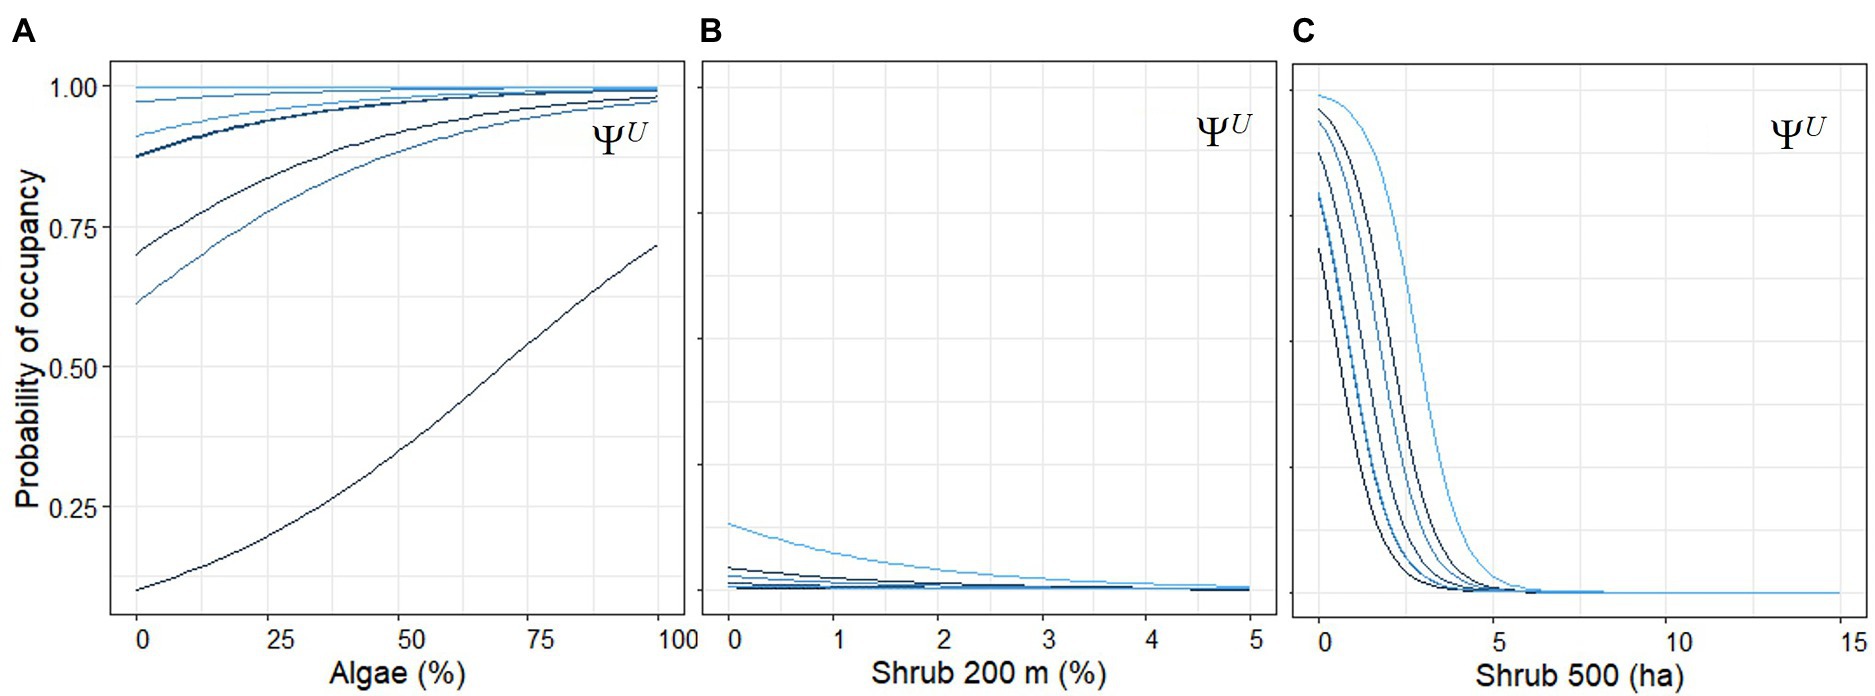
Figure 6. Empirical Bayes plots of the marginal occupancy probability of Umpqua chub present given no bass with (A) percent algae, (B) the percent of shrub in a 200 m width, variable area buffer, and (C) area of shrub cover in a 500 m radius buffer assuming averages for the other covariates in the model from 2006 to 2021 snorkel surveys. Each blue colored line represents a watershed in the Umpqua Basin, Oregon, United States.
The largest effect sizes for detection probability were for day of year sub models (Figures 3B, 4E–J). There was lower probability of detecting non-native bass or native chub later in the season (Figures 7A,B), but for native chub in the abundant state, detection was 6.9 times more likely for every day later in the season (Figure 7C). There was a higher probability of collecting evidence of native chub in the abundant state given non-native bass were either present or absent later in the season (Figures 7D,E).
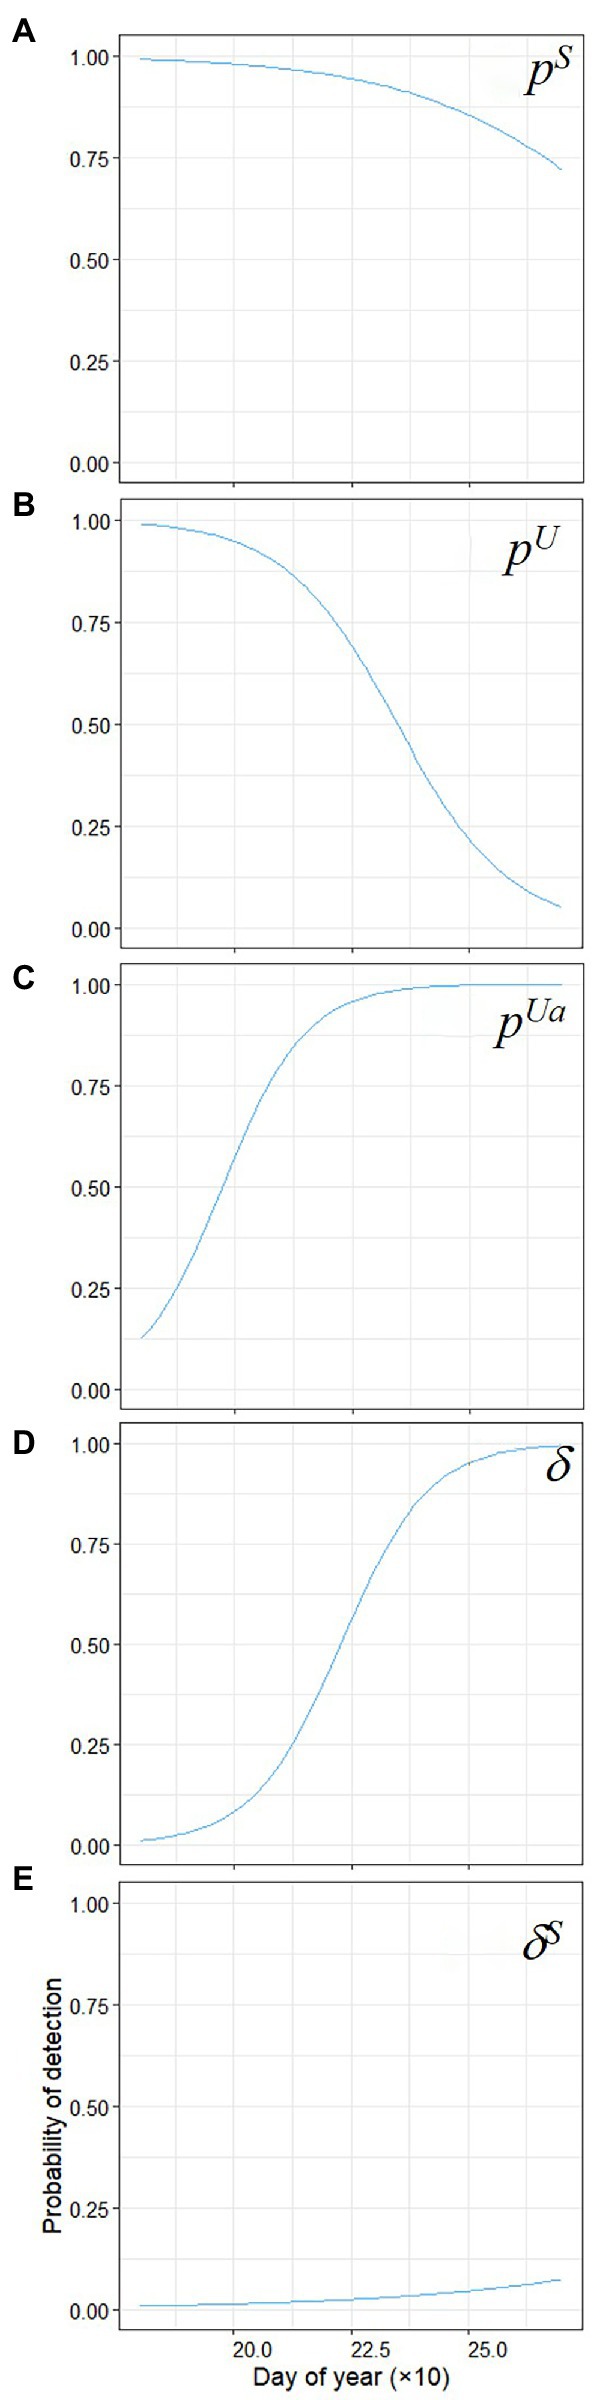
Figure 7. Marginal probability (p) of detecting (A) non-native present, (B) native chub present/ non-native bass absent, (C) native abundant/ non-native absent, (D) evidence of the native abundant/ given non-native bass absent, (E) evidence of abundant native/ non-native present with day of year. Day of year 175 = July 1 and 280 = September 30.
Discussion
Non-native species have been introduced widely into freshwater streams of the Pacific Northwestern United States (Rubenson and Olden, 2019). Their proliferation often results in pervasive effects on native species (Hazelton and Grossman, 2009). However, management favoring native species may need to be justified by its demonstrated effect on potentially vulnerable species, for example if the non-native species is a popular sportfish, as is the case in our Umpqua basin example. Objectively evaluating interactions between non-native and sensitive native fishes in the Pacific Northwest may become more critical given that predicted stream temperature warming may benefit non-native warm-water species, such as smallmouth bass (Jones et al., 2020). Choices will need to be made on which species interaction issues to focus efforts (Petersen and Kitchell, 2001; Lawrence et al., 2014).
Because we integrated the detection probability of the native Umpqua chub, we were able to conclude that their probability of presence and abundance does not differ substantially when smallmouth bass were present or absent at the site level. Furthermore, the SIF was well above 1 at 6.75 indicating the native species Umpqua chub was in fact strongly associated with the non-native species smallmouth bass. The results that the two species occur together with near equal probability as chub alone, combined with the positive SIF, do not support the old hypothesis that there is a negative interaction between the two species at reach scales, i.e., that smallmouth bass exclude Umpqua chub. Further management of smallmouth bass in the Umpqua Basin should consider the outcome of our 2SMS occupancy modeling example.
We also did not see much of a negative density dependent effect on interactions of bass and chub, as indicated by comparisons of chub occupancy when bass are present or not ( = 0.14 = 0.18 or chub abundant (i.e., ≥ 67 fish; = 0.08 = 0.19 . In fact, chub occupancy was higher when bass were present indicating a positive density dependent effect; i.e., there is a much bigger positive effect on chub being abundant when bass are present.
Simultaneously including habitat covariates and incorporating multiple states into two species occupancy models allowed us to disentangle the effects detection probability had on density dependent occupancy states. True species interactions from previous studies were likely obscured by just looking at chub and bass presence without incorporating detection probability and covariates. For example, the much lower native chub detection probabilities when non-native bass are present (0.21–0.34) compared to when bass are not present (0.82) indicate chub are much more difficult to detect when non-native bass are present. Interestingly, by incorporating covariates on occupancy, we found elevation to be one of the main drivers of occupancy probability of the native, non-native, and co-occurrence of the two. Non-native bass and native chub in the abundant occupancy states were highest at lower elevations while native chub in both the present and abundant occupancy states were higher when bass were present at higher elevations. However, there was no elevation relationship of native chub when bass were absent. This is what we would expect if non-natives were not excluding natives given bass and chub alone (in the abundant state) are both negatively related to elevation. This indicates a zone of sympatry at higher-elevation stream reaches where native chub co-occur with non-native bass even in the abundant state. This density dependent relationship may have been obscured by not incorporating the very different detection probabilities when bass and chub co-occur versus when chub are detected alone.
That chub are much more difficult to detect when non-native bass are present is compelling evidence that native chub may be changing behavior in response to the presence of a predator (Hazelton and Grossman, 2009). The presence of predators has been found to alter habitat use of potential prey fishes in other studies (Peterson and Rabeni, 2001; Stuart-Smith et al., 2008; Hazelton and Grossman, 2009). Through incorporating covariates into detection probability sub models, we found additional support that native chub may in fact have a beneficial adaptive behavioral response to this non-native potential predator. We found that chub detection probability was higher with less bedrock and more boulder substrates when non-native smallmouth bass were present. The detection probability could be due to a shift in native chub habitat use in the presence of non-native bass in areas with no cover from predators (bedrock) to cover (boulder).
In our case study, we found day of year affected detection in almost all the native species states, but the relationships seemed counter-intuitive; the probability of detecting chub and bass alone declined over time yet, chub in the abundant state increased with day of year. The higher chub detection later in the season is likely due to young of year chub that are usually the most abundant cohort, growing and becoming more visible later in the sampling period after August. The negative relationship we found between day of year and smallmouth bass detection could also be due to life history of this species like variability in movement patterns and/ or reproductive timing. Smallmouth bass can move long distances (≥30 km) as water temperatures warm or cool, even between different watersheds into and out of the Umpqua Basin (Lawrence et al., 2012; Rubenson and Olden, 2017). Adult bass could have been actively moving to suitable spawning areas earlier in the season making them more detectable. Alternatively, male bass may have been actively guarding nests constructed in shallow areas and less detectable later in the season. Life history may affect detection probability increasing bias if sampling occurs during the reproductive period, therefore including covariates like day of year to account for this bias is important when examining species relationships.
We found that anthropogenic land use covariates at larger scales (i.e., 200 and 500 m) were negatively associated with both species’ occupancy. Greater urban and shrub land cover were associated with a lower probability of non-native bass and native chub alone and their co-occurrence. Shrub cover has been related to encroachment of urban areas in other studies (Singkran and Meixler, 2008). Thus, the inclusion of covariates on occupancy in our 2SMS model might lead us to hypothesize that effects of conversion to anthropogenic land cover types may be an area for future study for both fishes (Hazelton and Grossman, 2009).
We can also validate 2SMS model results by comparing the historical survey data (i.e., 1987–1999) with the more recent survey data (2006–2021). Native Umpqua chub were thought to be lost from several watersheds between 1987 and 1998 resulting in the assertion that Umpqua chub populations were being restricted to smaller tributaries as smallmouth bass became established in larger streams (Simon and Markle, 1999; O’Malley et al., 2013). However, these initial assertions were based upon only 12 original observations. With more extensive and standardized snorkel surveys conducted during 2006–2007 (n = 93), 2015–2017 (n = 55), 2019 (n = 81), and 2021 (n = 75) we detected Umpqua chub in all of the streams they had not been detected in during 1987 and 1998. Moreover, native chub occupancy was highest in the South Umpqua River watershed where non-native bass were first introduced into the basin and have had the longest time to co-exist with smallmouth bass. This finding is contrary to the assertion that smallmouth bass exclude Umpqua chub which was based on analyses that did not account for detection probability of either species (Simon and Markle, 1999). Thus, a more accurate picture of the species interactions in the Umpqua basin emerged after 2006, even before we combined more extensive standardized repeated snorkel survey methodology with our new 2SMS occupancy model.
Although our results do not support the hypothesis that smallmouth bass exclude Umpqua chub within survey reaches, the scale of our sampling may have been too coarse to evaluate interactions between these species. Our primary sampling unit (the survey) was six-times the average wetted width of the stream and therefore, each sample site typically incorporated multiple habitat unit types (e.g., some combination of slow-water and fast-water habitat units; Oregon Department of Fish and Wildlife [ODFW], 2021). Consequently, our sampling strategy may not detect interactions between non-native smallmouth bass and native Umpqua chub if they occur at the habitat unit or microhabitat unit scale (e.g., exclusion of Umpqua chub from specific habitat types). Future surveys could be modified to evaluate whether Umpqua chub use slow- versus fast-water habitats when smallmouth bass are present or absent to provide greater insight into potential fine-scale effects of smallmouth bass on Umpqua chub. Additionally, the large watershed random effect for non-native bass occupancy indicates a substantial amount of variation exists among watersheds that was not accounted for with the survey, environmental, or land cover covariates. Some of the unaccounted variation may be related to differences in streamflow among watersheds which could affect occupancy for either fish species. Therefore, future surveys could include streamflow covariates. This illustrates how our 2SMS model could also inform future sampling designs.
Findings from our 2SMS model could be useful for informing and prioritizing future non-native fish management decisions. In our case study, costly actions to reduce smallmouth bass occurrence in the Umpqua basin cannot be justified based on the hypothesis that smallmouth bass are likely excluding Umpqua chub as our research does not support this hypothesis. However, it may be that other native species are negatively affected by smallmouth bass in the basin such as Western brook lamprey (Lampetra richardsoni) and Pacific lamprey (Entosphenus tridentatus) that would require management strategies (Jones et al., 2020). Such predator/ prey interactions may benefit from our 2SMS occupancy modeling efforts to understand whether the potential overlap of smallmouth bass has a negative effect on lamprey as suggested by Jones et al. (2020).
In summary, the development of our 2SMS model permits simultaneous modeling of two species and multiple states while accounting for imperfect detection, multiple covariates, and random effects. When detection probabilities and species interactions are not incorporated, it may be possible to perceive patterns in data that may not be accurate. In our example, the various historical survey methodologies, each with their own detection probabilities and the fact that different elevation streams with varying substrates have differing detection probabilities, limited the ability to make an unbiased hypothesis. The ability to model the probability that two species co-occur while accounting for possible density dependence allows greater insight into processes that influence species interactions and should aid managers in prioritizing conservation actions for species of concern. Our 2SMS model explicitly examined the hypothesis of whether chub density was affected by presence of bass at any density. However, higher bass density could affect occupancy of chub and this model parameterization could be of interest, and potentially useful in maximizing targeted removal efforts should managers seek to do so. Our 2SMS occupancy model can be used with other types of repeated survey data, e.g., songbird point counts, for disentangling the potential effects of non-native species.
Data availability statement
The datasets presented in this study can be found in online repositories. The names of the repository/repositories and accession number(s) can be found at: https://datadryad.org/stash/share/131eAcQh_qB8lBlqeokdBArDAhR-MDQnQD-7gSkwusE.
Ethics statement
The animal study was reviewed and approved by the IAUCUC.
Author contributions
PS and MM conceived of the survey approach. JP conceived of the modeling approach. JP and PW designed the modeling approach, PW conducted the Bayesian analyses, and JP and PW participated equally in writing the manuscript. PW, JP, MM, and PS edited the manuscript. PS, MM, and JP provided expert information. All authors contributed to the article and approved the submitted version.
Funding
The data used for this publication were financed with funds from the U.S. Bureau of Land Management, the U.S. Fish and Wildlife Service, and the U.S. Forest Service. The Oregon Cooperative Fish and Wildlife Research Unit is jointly sponsored by the U.S. Geological Survey, the U.S. Fish and Wildlife Service, the Oregon Department of Fish and Wildlife, Oregon State University, and the Wildlife Management Institute. Any use of trade, firm, or product names is for descriptive purposes only and does not imply endorsement by the U.S. Government.
Acknowledgments
Numerous field crews conducted snorkel surveys to make the analyses in this paper possible. We thank Juliet Harrison, Caleb Baldwin, and Allison Manwaring for providing feedback on earlier drafts of this article.
Conflict of interest
The authors declare that the research was conducted in the absence of any commercial or financial relationships that could be construed as a potential conflict of interest.
Publisher’s note
All claims expressed in this article are solely those of the authors and do not necessarily represent those of their affiliated organizations, or those of the publisher, the editors and the reviewers. Any product that may be evaluated in this article, or claim that may be made by its manufacturer, is not guaranteed or endorsed by the publisher.
Supplementary material
The Supplementary material for this article can be found online at: https://www.frontiersin.org/articles/10.3389/fevo.2022.1014707/full#supplementary-material
References
Bailey, L. L., Reid, J. A., Forsman, E. D., and Nichols, J. D. (2009). Modeling co-occurrence of northern spotted and barred owls: accounting for detection probability differences. Biol. Conserv. 142, 2983–2989. doi: 10.1016/j.biocon.2009.07.028
Brewer, S. K. (2011). Patterns in young-of-year smallmouth bass microhabitat use in multiple stream segments with contrasting land uses. Fish. Manag. Ecol. 18, 506–512. doi: 10.1111/j.1365-2400.2011.00806.x
Brewer, S. K., Rabeni, C. F., Sowa, S. P., and Annis, G. (2007). Natural landscape and stream segment attributes influencing the distribution and relative abundance of riverine smallmouth bass in Missouri. N. Am. J. Fish Manag. 27, 326–341. doi: 10.1577/M06-122.1
Brooks, S. P., and Gelman, A. (1998). General methods for monitoring convergence of iterative simulations. J. Comput. Graph. Stat. 9, 266–285.
Coleman, B. T., and Hill, R. A. (2014). Living in a landscape of fear: the impact of predation, resource availability and habitat structure on primate range use. Anim. Behav. 88, 165–173. doi: 10.1016/j.anbehav.2013.11.027
Crockett, J. G., Lanier, W. E., and Bailey, L. L. (2021). Few impacts of introduced cutthroat trout (Oncorhynchus clarki) on aquatic stages of boreal toads (Anaxyrus boreas boreas). J. Herpetol. 55, 310–317. doi: 10.1670/20-033
Dauwalter, D. C., Splinter, D. K., Fisher, W. L., and Marston, R. A. (2007). Geomorphology and stream habitat relationships with smallmouth bass (Micropterus dolomieu) abundance at multiple spatial scales in eastern Oklahoma. Can. J. Fish. Aquat. Sci. 64, 1116–1129. doi: 10.1139/f07-085
Franklin, T. W., Dysthe, J. C., Rubenson, E. S., Carim, K. J., Olden, J. D., McKelvey, K. S., et al. (2018). A non-invasive sampling method for detecting non-native smallmouth bass (Micropterus dolomieu). Northwest Sci. 92, 149–157. doi: 10.3955/046.092.0207
Gelman, A., Jakulin, A., Grazia-Pittau, M., and Su, Y. (2008). A weakly informative default prior distribution for logistic and other regression models. Ann. Appl. Stat. 2, 1360–1383. doi: 10.1214/08-AOAS191
Geyer, N. A. (2003). South Umpqua River Watershed Assessment and Action Plan, November 2003. Roseburg, OR: Umpqua Basin Watershed Council.
Gould, W. R., Ray, A. M., Bailey, L. L., Thoma, D., Daley, R., and Legg, K. (2019). Multistate occupancy modeling improves understanding of amphibian breeding dynamics in the greater Yellowstone area. Ecol. Appl. 29, 1–13. doi: 10.1002/eap.1825
Gutiérrez-González, C. E., and López-González, C. A. (2017). Jaguar interactions with pumas and prey at the northern edge of jaguars’ range. PeerJ 5:e2886. doi: 10.7717/peerj.2886
Hasegawa, K., and Nakashima, A. (2018). Wild masu salmon is outcompeted by hatchery masu salmon, a native invader, rather than brown trout, a nonnative invader. Biol. Invasions 20, 3161–3166. doi: 10.1007/s10530-018-1765-5
Hazelton, P. D., and Grossman, G. D. (2009). The effects of turbidity and an invasive species on foraging success of rosyside dace (Clinostomus funduloides). Freshw. Biol. 54, 1977–1989. doi: 10.1111/j.1365-2427.2009.02248.x
Hernandez-Puentes, C., Torre, I., and Vilella, M. (2022). Spatio-temporal interactions within a Mediterranean community of Mesocarnivores. Mamm. Biol. 102, 357–373. doi: 10.1007/s42991-022-00230-w
Hooten, M. B., and Hobbs, N. T. (2015). A guide to Bayesian model selection for ecologists. Ecol. Monogr. 85, 3–28. doi: 10.1890/14-0661.1
Hosmer, D. W. Jr., Lemeshow, S., and Sturdivant, R. X. (2013). Applied Logistic Regression 398. Hoboken, NJ: John Wiley & Sons.
Ingeman, K. E. (2016). Lionfish cause increased mortality rates and drive local extirpation of native prey. Mar. Ecol. Prog. Ser. 558, 235–245. doi: 10.3354/meps11821
Jones, K. L., Dunham, J. B., O’Connor, J. E., Keith, M. K., Mangano, J. F., Coates, K., et al. (2020). River network and reach-scale controls on habitat for lamprey larvae in the Umpqua River Basin, Oregon. N. Am. J. Fish Manag. 40, 1400–1416. doi: 10.1002/nafm.10487
Kafley, H., Lamichhane, B. R., Maharjan, R., Khadka, M., Bhattarai, N., and Gompper, M. E. (2019). Tiger and leopard co-occurrence: intraguild interactions in response to human and livestock disturbance. Basic Appl. Ecol. 40, 78–89. doi: 10.1016/j.baae.2019.07.007
Kuo, L., and Mallick, B. (1998). Variable selection for regression models. Sankhya Indian J. Stat. Ser. B 60, 65–81.
Lawrence, D. J., Olden, D., and Torgersen, C. E. (2012). Spatiotemporal patterns and habitat associations of smallmouth bass (Micropterus dolomieu) invading salmon-rearing habitat. Freshwater Biology 57, 1929–1945.
Lawrence, D. J., Stewart-Koster, B., Olden, J. D., Ruesch, A. S., Torgersen, C. E., Lawler, J. L., et al. (2014). The interactive effects of climate change, riparian management, and a nonnative predator on stream-rearing salmon. Ecol. Appl. 24, 895–912. doi: 10.1890/13-0753.1
Luiselli, L. (2006). Site occupancy and density of sympatric Gaboon viper (Bitis gabonica) and nose-horned viper (Bitis nasicornis). J. Trop. Ecol. 22, 555–564. doi: 10.1017/S0266467406003397
MacKenzie, D. I., Bailey, L. L., and Nichols, J. D. (2004). Investigating species co-occurrence patterns when species are detected imperfectly. J. Anim. Ecol. 73, 546–555. doi: 10.1111/j.0021-8790.2004.00828.x
MacKenzie, D. I., Nichols, J. D., Royle, J. A., Pollock, K. H., Bailey, L. L., and Hines, J. E.. (2018). Occupancy estimation and modeling: inferring patterns and dynamics of species occurrence, 2nd Edition. Academic Press, San Diego, CA.
MacKenzie, D. I., Nichols, J. D., Seamans, M. E., and Gutierrez, R. J. (2009). Modeling species occurrence dynamics with multiple states and imperfect detection. Ecology 90, 823–835. doi: 10.1890/08-0141.1
Markle, D. F., Pearsons, T., and Bills, D. (1991). Natural history of Oregonichthys kalawatseti (Pisces: Cyprinidae), with a description of a new species from the Umpqua River of Oregon. Copeia 1991, 277–293. doi: 10.2307/1446578
MacRae, P. S., and Jackson, D. A.. (2001). The influence of smallmouth bass predation and habitat complexity on structure of littoral zone fish assemblages. Can. J. Fish. Aquat. Sci. 58, 342–351. doi: 10.1139/cjfas-58-2-342
Moore, D., and McCabe, G.. (1993). Introduction to the practice of statistics, W. H. Freeman and Company. New York.
Morrison, M. L., Marcot, B. G., and Mannan, R. W.. (2006). Wildlife–habitat relationships: concepts and applications, 3rd Edition. University of Wisconsin Press, Madison.
Ngoprasert, D., Steinmetz, R., Sribuarod, K., and Gale, G. A. (2022). The overlap of sympatric sun bears and Asiatic black bears in space and time. Mamm. Biol. 102, 143–153. doi: 10.1007/s42991-021-00201-7
Nichols, J. D., Hines, J. E., MacKenzie, D. I., Seamans, M. E., and Gutierrez, R. J. (2007). Occupancy estimation and modeling with multiple states and state uncertainty. Ecology 88, 1395–1400. doi: 10.1890/06-1474
O’Malley, K. G., Markle, D. F., and Ardren, W. R. (2013). Timing of population fragmentation in a vulnerable minnow, the Umpqua chub, and the role of nonnative predators. Trans. Am. Fish. Soc. 142, 447–457. doi: 10.1080/00028487.2012.728166
Oregon Department of Fish and Wildlife [ODFW] (2021). “Biological review, occupancy and abundance, and sampling considerations for Umpqua chub status and trend monitoring” in Oregon Department of Fish and Wildlife – Science bulletin 2021–01, (eds. Baldwin, C., Meeuwig, M. H., Monzyk, F., Peterson, J. P., Scheerer, P., and Sipher, C. Salem, OR: Oregon Department of Fish and Wildlife).
Pearsons, T. N. (1989). Ecology and decline of a rare western minnow: the Oregon chub (Oregonichthys crameri). Master’s Thesis. Corvallis, OR: Oregon State University.
Petersen, J. H., and Kitchell, J. F. (2001). Climate regimes and water temperature changes in the Columbia River: bioenergetics implications for predators of juvenile salmon. Can. J. Fish. Aquat. Sci. 58, 1831–1841. doi: 10.1139/f01-111
Peterson, J. T., and Barajas, M. F. (2018). An evaluation of three fish surveys in the Bay-Delta, 1995–2015. San Franc. Estuary Watershed Sci. 16, 1–28. doi: 10.15447/sfews.2018v16iss4art2
Peterson, J. T., and Paukert, C. (2009). “Data conversion,” in Standard Sampling Methods for North American freshwater fishes. eds. S. Bonar, W. Hubert, and D. Willis (Bethesda, MD: American Fisheries Society), 195–216.
Peterson, J. T., and Rabeni, C. F. (2001). The relation of fish assemblages to channel units in an Ozark stream. Trans. Am. Fish. Soc. 130, 911–926. doi: 10.1577/1548-8659(2001)130<0911:TROFAT>2.0.CO;2
Plummer, M. (2012). JAGS: A program for analysis of Bayesian graphical models using Gibbs sampling. Available at: http://mcmcjags.sourceforge.net/
R Development Core Team. (2021). R: a language and environment for statistical computing. R Foundation for Statistical Computing, Vienna, Austria
Richmond, O. M. W., Hines, J. E., and Beissinger, S. R. (2010). Two species occupancy models: a new parameterization applied to co-occurrence of secretive rails. Ecol. Appl. 20, 2036–2046. doi: 10.1890/09-0470.1
Rogosch, J. S., and Olden, J. D. (2021). Comparing opportunistic and strategic removal efforts to manage invasive fish species using a dynamic multi-state occupancy model. J. Appl. Ecol. 58, 2797–2809. doi: 10.1111/1365-2664.14012
Rota, C. T., Wikle, C. K., Kays, R. W., Forrester, T. D., McShea, W. J., Parsons, A. W., et al. (2016). A two-species occupancy model accommodating simultaneous spatial and interspecific dependence. Ecology 97, 48–53. doi: 10.1890/15-1193.1
Royle, J. A., and Dorazio, R. M. (2008). Hierarchical modeling and inference in ecology: the analysis of data from populations, metapopulations, and communities. Elsevier Academic Press, San Diego, CA.
Rubenson, E. S., and Olden, J. D. (2017). Dynamism in the upstream invasion edge of a freshwater fish exposes range boundary constraints. Oecologia 184, 453–467.
Rubenson, E. S., and Olden, J. D. (2019). Growth and recruitment of nonnative smallmouth bass along the upstream edge of its riverine distribution. Northwest Sci. 93, 1–15. doi: 10.3955/046.093.0102
Sanderson, B. L., Barnas, K. A., and Wargo Rub, A. M. (2009). Nonindigenous species of the Pacific Northwest: an overlooked risk to endangered salmon? Bioscience 59, 245–256. doi: 10.1525/bio.2009.59.3.9
Schall, M. K., Wertz, T., Smith, G. D., Blazer, V. S., and Wagner, T. (2019). Movement dynamics of smallmouth bass (Micropterus dolomieu) in a large river-tributary system. Fish. Manag. Ecol. 26, 590–599. doi: 10.1111/fme.12369
Schultz, L. D., Heck, M. P., Kowalski, B. M., Eagle-Smith, C. A., Coates, K., and Dunhame, J. B. (2017). Bioenergetics models to estimate numbers of larval lampreys consumed by Smallmouth bass in Elk Creek, Oregon. N. Am. J. Fish Manag. 37, 714–723. doi: 10.1080/02755947.2017.1317677
Shreve, R. L. (1969). Stream lengths and basin areas in topologically random channel networks. J. Geol. 77, 397–414. doi: 10.1086/628366
Simon, D. C., and Markle, D. F. (1999). Evidence of a relationship between smallmouth bass (Micropterus dolomieu) and decline of Umpqua chub (Oregonichthys kalawatseti) in the Umpqua Basin, Oregon. Northwest. Nat. 80, 110–113. doi: 10.2307/3536657
Singkran, N., and Meixler, M. S. (2008). Influences of habitat and land cover on fish distributions along a tributary to Lake Ontario, New York. Landsc. Ecol. 23, 539–551. doi: 10.1007/s10980-008-9212-0
Stuart-Smith, R. D., White, R. W. G., and Barmuta, L. A. (2008). A shift in the habitat use pattern of a lentic galaxiid fish: an acute behavioural response to an introduced predator. Environ. Biol. Fish 82, 93–100. doi: 10.1007/s10641-007-9256-z
U.S. Fish and Wildlife Service [USFWS] (2020). Federally listed, proposed, candidate, delisted species and species of concern under the jurisdiction of the Fish and Wildlife Service within Oregon. Available at: www.fws.gov/oregonfwo/Documents/OregonSpeciesStateList.pdf
U.S. Geological Survey [USGS] (2013). USGS NED 1/3 arc-second 2013 1 x 1-degree IMG raster digital data [online database]. Reston, VA: USGS.
van Buuren, S., and Groothuis-Oudshoorn, K. (2011). mice: multivariate imputation by chained equations in R. J. Stat. Softw. 45, 1–67. doi: 10.18637/jss.v045.i03
Veblen, K. E. (2012). Savanna glade hotspots: plant community development and synergy with large herbivores. J. Arid Environ. 78, 119–127. doi: 10.1016/j.jaridenv.2011.10.016
Walters, C. M., and Osborne, D. C. (2022). Occurrence patterns of wild turkeys altered by wild pigs. Wildl. Soc. Bull. 46, 1–15. doi: 10.1002/wsb.1266
Wang, F., McShea, W. J., Wang, D., and Li, S. (2015). Shared resources between giant panda and sympatric wild and domestic mammals. Biol. Conserv. 186, 319–325. doi: 10.1016/j.biocon.2015.03.032
Keywords: covariates, non-native species, smallmouth bass, snorkel surveys, two-species multi-state occupancy model, Umpqua chub
Citation: Wohner PJ, Scheerer PD, Meeuwig MH and Peterson JT (2023) A comprehensive multi-state conditional occupancy model for evaluating interactions of non-native and native species. Front. Ecol. Evol. 10:1014707. doi: 10.3389/fevo.2022.1014707
Edited by:
Paulo A. V. Borges, University of the Azores, PortugalReviewed by:
Matt Haworth, Colorado State University, United StatesYan Hua, Guangdong Academy of Forestry, China
Copyright © 2023 Wohner, Scheerer, Meeuwig and Peterson. This is an open-access article distributed under the terms of the Creative Commons Attribution License (CC BY). The use, distribution or reproduction in other forums is permitted, provided the original author(s) and the copyright owner(s) are credited and that the original publication in this journal is cited, in accordance with accepted academic practice. No use, distribution or reproduction is permitted which does not comply with these terms.
*Correspondence: Patti J. Wohner, ✉ d29obmVycEBvcmVnb25zdGF0ZS5lZHU=