 Roni Tadmor-Levi1,2
 David Cummings3Tomer Borovski1†Rachel Shapira1Evgeniya Marcos-Hadad1
 Lior David1,2*
- 1Department of Animal Sciences, Robert H. Smith Faculty of Agriculture, Food and Environment, The Hebrew University of Jerusalem, Rehovot, Israel
- 2National Natural History Collections, The Hebrew University of Jerusalem, Jerusalem, Israel
- 3Kinneret Limnological Laboratory, Israel Oceanographic and Limnological Research, Migdal, Israel
Freshwater bodies are key in supporting aquatic and terrestrial life. Ecological balance of freshwater habitats is very vulnerable, hence, often significantly disrupted by climatic changes and anthropogenic acts. In Israel, due to its relatively arid climate, many freshwater resources have been disrupted and still are under great pressure. The Sea of Galilee is the largest surface freshwater body in the Middle East and a habitat to unique populations of several fishes, including six cichlid species. Studies on the ecology of these fish and their conservation require effective monitoring tools. In this study, a simple and efficient molecular method was developed to identify the species of these lake cichlids using high resolution melting analysis of mini DNA barcodes. The species of an individual sample can be identified by a single tube PCR reaction. This assay successfully identified sequence differences both among and within species. Here, this method identified the species for 279 small cichlid fry that could not be morphologically identified, allowing to estimate relative species abundance and map their distribution in time and location. The results are key to understand not only the ecology of young stages but also their recruitment potential to adult fish populations and their sustainability. This method can be readily implemented in further ecological studies and surveys related to these species, in the lake and its surroundings, as a tool to enhance understanding and protection of these species.
Introduction
The longstanding dependency of humans on water contributed considerably to the poor ecological state of freshwater resources all around the world and to depletion of natural fish faunas inhabiting these habitats (Dynesius and Nilsson, 1994; Sala et al., 2000; Dudgeon et al., 2006; Vörösmarty et al., 2010; Carpenter et al., 2011; Darwall and Freyhof, 2016; Reid et al., 2019). Effective management of freshwater habitats should be based on constantly monitoring changes in their biotic and abiotic elements to avoid irreversible disruptions, while considering priorities for balancing between anthropogenic needs and sustainability of other natural species (Frankham et al., 2014; Reid et al., 2019; Albert et al., 2021; Arthington, 2021).
The moderate to low rainfall characterizing Israel’s climate have made its freshwater habitats a precious national resource, yet a highly vulnerable one (Ben-Tuvia, 1981; Goren and Galil, 2005; Sternberg et al., 2015; Borovski et al., 2018). The Sea of Galilee (Lake Kinneret) is the largest surface freshwater body in the Middle-East and because of its prime role in freshwater supply for many years, its water level and quality are highly regulated (Serruya, 1978; Berman, 1998; Berman et al., 2014; Markel et al., 2014). Nevertheless, water levels of the lake have been fluctuating considerably depending on the balance between water demands and rainfall (Zohary and Ostrovsky, 2011; Zohary et al., 2014).
Situated in a historical continental bridge region, the fish fauna in the Sea of Galilee includes a mix of species of North-African, West-Asian and South-European origins. Yet, the Sea of Galilee is a relatively small habitat (surface area of ∼166.7 km2), isolated for over 10,000 years. Populations of approximately 18 native and eight non-native species are supported by this unique habitat. Native cyprinids (10 species) originated from the Middle East and Asia, whereas native cichlids (six species) from Africa (Goren and Ortal, 1999). These native species populations are unique, some are endemic and others are isolated and adapted to live at the edge of their distribution ranges (Ben-Tuvia, 1960, 1981; Goren and Ortal, 1999; Ostrovsky et al., 2014a; Tadmor-Levi et al., 2022). Changes in water surface level have dramatic effects on ecology of lakes and particularly, on shallow littoral zones (Adrian et al., 2009; Gaeta et al., 2014). Over the years, the Sea of Galilee underwent dramatic water level fluctuations (Berman, 1998; Zohary and Ostrovsky, 2011; Zohary and Gasith, 2014). During low water level periods, large sections of the shallow littoral zone dry off and taken over by land vegetation. When water levels increase back, these vegetated sections become inundated, forming a new habitat re-occupied by fish. Shallow waters serve as spawning grounds for cichlids and as nursery for first life stages of fry (Ben-Tuvia, 1960; Cnaani and Hulata, 2008; Cummings et al., 2017). At times of water level fluctuations, low levels in particular, spawning, and recruitment of young fish could be negatively affected and thus, the sustainability of fish populations could be compromised.
Native cichlid species in Israel are of an African origin. The Sea of Galilee is home to five Tilapine species: Sarotherodon galilaeus (Linnaeus 1758), Oreochromis aureus (Stiendachner 1864), Coptodon zillii (Gervais 1848), and the endemic Tristramella simonis (Gunther 1864), and Tristramella sacra (Gunther 1864). Haplochrominae is represented in the lake by the comparatively much smaller species–Astatotilapia flaviijosephi (Lortet 1883). The cichlids of the Sea of Galilee are important members of the lake’s food web and they hold economic and cultural importance for the local people (Ostrovsky et al., 2014a; Zohary et al., 2014). The cichlids provided alarming examples for vulnerability of fish populations in the lake and for the need of efficient population monitoring methods. S. galilaeus (also known as Galilee tilapia or St. Peter’s fish) was abundant in the lake, however, between 2005 and 2008, the annual commercial catch of S. galilaeus dramatically declined to less than 5% of its average before. Since then, concerns were raised regarding the sustainability of its population (Zohary et al., 2008; Gophen et al., 2015; Sternberg et al., 2015), also because the genetic variation of this population had recently declined (Borovski et al., 2018). T. sacra, an endemic cichlid, which had always been relatively rare, is now considered extinct (Goren, 2014).
Monitoring fish populations requires reliable and efficient tools that can provide spatial and temporal information on the distribution and abundance of different species. Fish populations in the Sea of Galilee are monitored by acoustic surveys, which provide information on abundance and distribution of pelagic fish shoals. Based on signal strength, size of fish can be estimated, hinting to conjectured species (Walline et al., 1992; Ostrovsky et al., 2014a,b; Zohary et al., 2014). Therefore, these surveys are monitoring primarily abundant and pelagic species like the native Bleak (Mirogrex terraesanctae). Another estimate for fish population size and distribution comes from commercial fishing landings.
DNA barcoding became an established molecular method to identify biological species, including fish (Hebert et al., 2003; Hajibabaei et al., 2007; Ratnasingham and Hebert, 2007; Ward et al., 2009). Fish DNA barcoding is mainly based on sequence of the 5’ part of the mtDNA encoded Cytochrome C oxidase subunit I gene (COI). With the advent of molecular tools, DNA barcoding has become more affordable and offers some advantages over morphological taxonomy such as: species identification at different developmental/morphological stages (Ko et al., 2013), surveying large numbers of specimens (Valentini et al., 2009; Kress et al., 2015) tracing species footprints in environmental samples (e.g., stool, water, and soil) (Pont et al., 2018; Ushio et al., 2018; Beng and Corlett, 2020) or in foods, enhancing food safety and preventing fraud (Galimberti et al., 2013; Maralit et al., 2013; Badia-Melis et al., 2015). Traditionally, barcoding involves DNA sequencing; however, barcoding efficiency and costs could be further improved to support more and larger ecological studies, not only by high-throughput metabarcoding of many parallel samples (Taberlet et al., 2012; Creer et al., 2016; Hebert et al., 2018), but also for fewer samples and more focused studies. One such method, named Bar-HRM, is based on analyzing the melting curves of shorter PCR amplicons (minibarcodes) by high resolution DNA melting (HRM) analysis (Ririe et al., 1997; Wittwer et al., 2003). A change in even one base pair between otherwise identical two DNA sequences could translate into difference in their melting curves, allowing their distinction by HRM analysis. This method should be tailored according to species of interest and was successfully developed to identify species of cyprinids, trout and a few more, based on sequence differences of specific mini COI barcodes (McGlauflin et al., 2010; Fitzcharles, 2012; Behrens-Chapuis et al., 2018). Much like DNA barcoding, this method could also be tailored for additional uses, for example, prevention of food adulterations was demonstrated in plants (Ganopoulos et al., 2012; Madesis et al., 2012; Anthoons et al., 2022) and fish (Tomás et al., 2017; Fernandes et al., 2018).
Identifying the species of samples by DNA barcoding requires comparisons against an established benchmark sequence database (Weigand et al., 2019), commonly established as part of the Barcode of Life (BOLD) Systems (Ratnasingham and Hebert, 2007). With the goal in mind of better monitoring its fish populations and enhancing ecological studies concerning the Sea of Galilee fish fauna, we have recently established a DNA barcoding database containing representative COI barcodes for the majority of fish species from the unique populations inhabiting this lake and its surroundings (Tadmor-Levi et al., 2022). Based on this barcoding information, in this study, we further tailored a cheap, fast and reliable Bar-HRM method to identify the cichlid species of the lake. As a proof of its utility, we have used this method to identify the species of small fry that could not be morphologically identified to the species level and mapped their distribution in terms of species, time and location during their first independent life stage in the littoral zone of the Sea of Galilee.
Materials and methods
Fish DNA samples
This study made use of DNA from fish belonging to six cichlid species: Oreochromis aureus (Blue tilapia), Oreochromis niloticus (Nile tilapia), Sarotherodon galilaeus (Galilee tilapia or St. Peter’s fish), Tristramella simonis (Short jaw Tristramella), Astatotilapia flaviijosephi (Jordan mouthbrooder), and Coptodon zillii (Redbelly tilapia). Although the pure species was not reported in the lake, O. niloticus was included in our study since it exists in Israel and since hybrids between O. niloticus females and O. aureus males were reported in the lake (Goren and Galil, 2005; Tadmor-Levi et al., 2022). O. niloticus × O. aureus fish will be identified as O. niloticus by our method, which detects maternally inherited mtDNA. This set of DNA samples was from adult fish that were morphologically identified for their species and their COI was sequenced as part of our previous studies (Borovski et al., 2018; Tadmor-Levi et al., 2022). Therefore, they were used to create a reference panel for developing the Bar-HRM identification method (see below).
In addition, we applied the Bar-HRM identification method to about 300 DNA samples, extracted individually from cichlid fry (body length < 10 cm) that could not be morphologically identified to the species level. These fish were collected as part of a different study, surveying site utilization by cichlids in areas with inundated vegetation of the Sea of Galilee (Cummings et al., 2017). DNA was extracted from fry collected from three shores, representing the eastern side of the Sea of Galilee: “Zacki”—located to the northeast of the lake (part of the “Beteha” region), “Tseelon” shore–located ∼8 km south to “Zacki” and “Sheizaf” shore–located to the southeast, ∼17 km south to “Zacki,” see map in Cummings et al. (2017). Fry were collected during two periods: 21/04/2014–21/05/2014 and 20/06/2014–10/07/2014. Since this study made use of DNA from fish collected for, and reported in other studies, details of permits for fish sampling and ethics procedures are given there (Cummings et al., 2017; Borovski et al., 2018; Tadmor-Levi et al., 2022).
DNA extraction
DNA from individual fry, stored in 99% Ethanol at –20°C, was extracted following the protocol based on salting out proteins (Martínez et al., 1998). In brief, about 5 mg of tissue was dried from ethanol and placed in 550 μL of cell lysis solution (50 mM Tris- HCl, pH 8.0, 50 mM EDTA, 100 mM NaCl). SDS solution was added to a concentration of 1% and cells were further lysed by incubation with 1 μL Proteinase K solution (20 mg/mL) for 2 h at 50°C. To precipitate the proteins, 300 μL of 5 M NaCl was added to the lysate and the sample was vortexed and centrifuged (13,000 rpm, 10 min). The supernatant liquid phase was mixed with 900 μL of freezer-cold 100% isopropanol, incubated for 2 h at –20°C and centrifuged (13,000 rpm, 5 min). The resulting DNA-containing pellet was washed with 700 μL of 70% ethanol, dried for 15 min and dissolved overnight in 100 μL of double distilled water at 4°C. DNA concentration and quality (Optical Density 260/280 ratio) was measured using NanoDrop ND-1000 (NanoDrop Technologies, Wilmington, DE, United States). DNA samples were diluted to a concentration of 25 ng/μL and stored at –20°C for further analysis.
Cichlid DNA barcoding information
Over 50 COI sequences of the six species were obtained from our previous work (Tadmor-Levi et al., 2022), and are now publicly available from BOLD systems (project name LKCOX1). The file was augmented by GenBank sequences of O. niloticus [GenBank accessions: gi-291002159 (GIFT strain), and gi-291002173 (Egyptian strain)] and O. aureus (GenBank gi-284177685). The O. aureus GenBank sequence was identical to the sequences we previously found in Israel. Sequences were aligned to the O. aureus reference using ClustalW algorithm and trimmed at uneven ends to create a 467 bp long multiple alignment file. Redundant COI haplotypes were filtered out from the file and an alignment of 11 different COI haplotypes remained (Supplementary Data Sheet 1). An unrooted species haplotype phylogeny was built based on the DNA sequence alignment using the Kimura two-parameter distances, Neighbor-Joining clustering and 1,000 bootstraps testing methods as implemented in MEGA7 (Kumar et al., 2016). This representation of the COI sequence variation was used for Bar-HRM assay design (see below).
Reference panel for Bar-HRM evaluation
In order to develop and evaluate the Bar-HRM assay, we chose DNA samples from adult fish that were morphologically identified to the species level and their COI sequences were available (Tadmor-Levi et al., 2022). This panel included 33 DNA samples representing the relevant COI variation of S. galilaeus, O. aureus, A. flaviijosephi, O. niloticus, C. zillii, and T. simonis (5–6 replicates per species). Since two COI haplotypes were identified for each A. flaviijosephi and T. simonis, samples representing this intraspecific variation were included in the reference panel. For S. galilaeus, Israeli fish all shared the same COI haplotype but fish from Ghana, Africa, had a different one. Although not found in Israel, due to the availability of DNA from Ghanaian fish, such samples were also included in the panel to better address the sensitivity of the Bar-HRM method developed in detecting intraspecific variation vs. inter-specific differences. O. niloticus samples included in the panel also had two COI haplotypes, representing two aquaculture strains (GIFT and Egypt). Finally, included was also a sample of O. niloticus × O. aureus hybrid (NxA) that represents what could sometimes be found in the Sea of Galilee. For method evaluation, HRM analysis was done in biological replicates (5–6 samples per species) and also in technical replicates (repeated reactions on the same panel).
High resolution melting analysis
As part of developing the Bar-HRM assay, several primer pairs were designed and tested, based on the O. aureus reference sequence. Primer design was done using the Primer3 web interface2 with the default settings. The final Bar-HRM assay includes two pairs of primers, which amplified amplicons of 200–300 bp (Table 1). PCR amplification followed by HRM analysis were carried out in a LightCycler-96 instrument (Roche, Basel, Switzerland). Analysis of the resulting HRM curves to determine the species of samples was done using the LightCycler-96 series software 1.1 with manual inspection of some random and questionable samples.
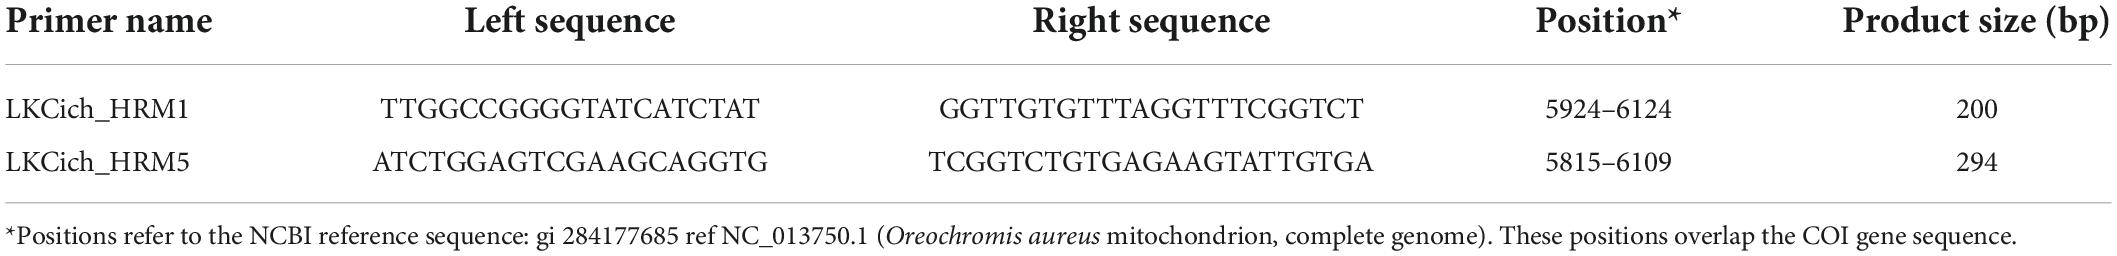
Table 1. Polymerase chain reaction (PCR) primers used for high resolution DNA melting (HRM) analysis.
Polymerase chain reaction procedure
A DNA template of 50 ng was used in a total reaction volume of 20 μL. The rest of the PCR mix contained: 1.66 μM of each left and right primers, 2.5 mM MgCl2 (Applied Biosystems, Waltham, MA, United States), 1.66 mM of each of the four dNTPs (Larova, Jena, Germany), 2 μL 10× Taq buffer (Applied Biosystems, Waltham, MA, United States), one unit of Taq DNA polymerase, 1.3 μM of SYTO-9 (Thermo Fisher Scientific, Waltham, MA, United States) and PCR grade water to adjust to the final volume. SYTO-9 is a dsDNA intercalating fluorescent dye that upon dsDNA denaturation is released and its fluorescence drops down. The PCR profile used for amplification was: initial denaturation at 94°C for 2 min followed by 14 cycles with a touchdown profile of denaturing at 94°C for 30 s, annealing for 30 s, starting from 60°C and going down to 53°C with a 0.5°C decrease per cycle, and extension at 72°C for 30 s. The touchdown cycles were followed by additional 30 amplification cycles identical to the last one and a final elongation stage of 10 min at 72°C.
High resolution DNA melting procedure
The amplification cycles created a fluorescently labeled PCR product that was immediately analyzed by a following HRM segment with a profile of initial denaturation for 1 min at 95°C, followed by annealing at 65°C for 1 s and melting by a continuous increase of up to 97°C at a rate of 0.07°C per second.
Results and discussion
Variation in cytochrome C oxidase subunit I gene DNA barcodes among Sea of Galilee cichlids
The focus of this study were species relevant to the Sea of Galilee and its surroundings. To develop a Bar-HRM method for species identification, over 50 sequences of the mtDNA encoded COI gene for six species were aligned in one 467 bp long multiple alignment that allowed comparing the variation between and within the different species. Sequences of individuals of the same species were mostly redundant, attesting to the suitability of COI for DNA barcoding of these species. After exclusion of species-redundant sequences, an alignment of 11 variable sequences remained, which contained two different COI haplotypes for S. galilaeus, A. flaviijosephi, O. niloticus, and T. simonis, while only one for C. zillii and O. aureus (Figure 1). From these 11 haplotypes, two are of O. niloticus, a species not reported in the lake, one is of a O. niloticus × O. aureus hybrid (NxA), not native but could also be found in the lake, one is unique to S. galilaeus fish found in Ghana but not in Israel and seven are of fish native to the Sea of Galilee.
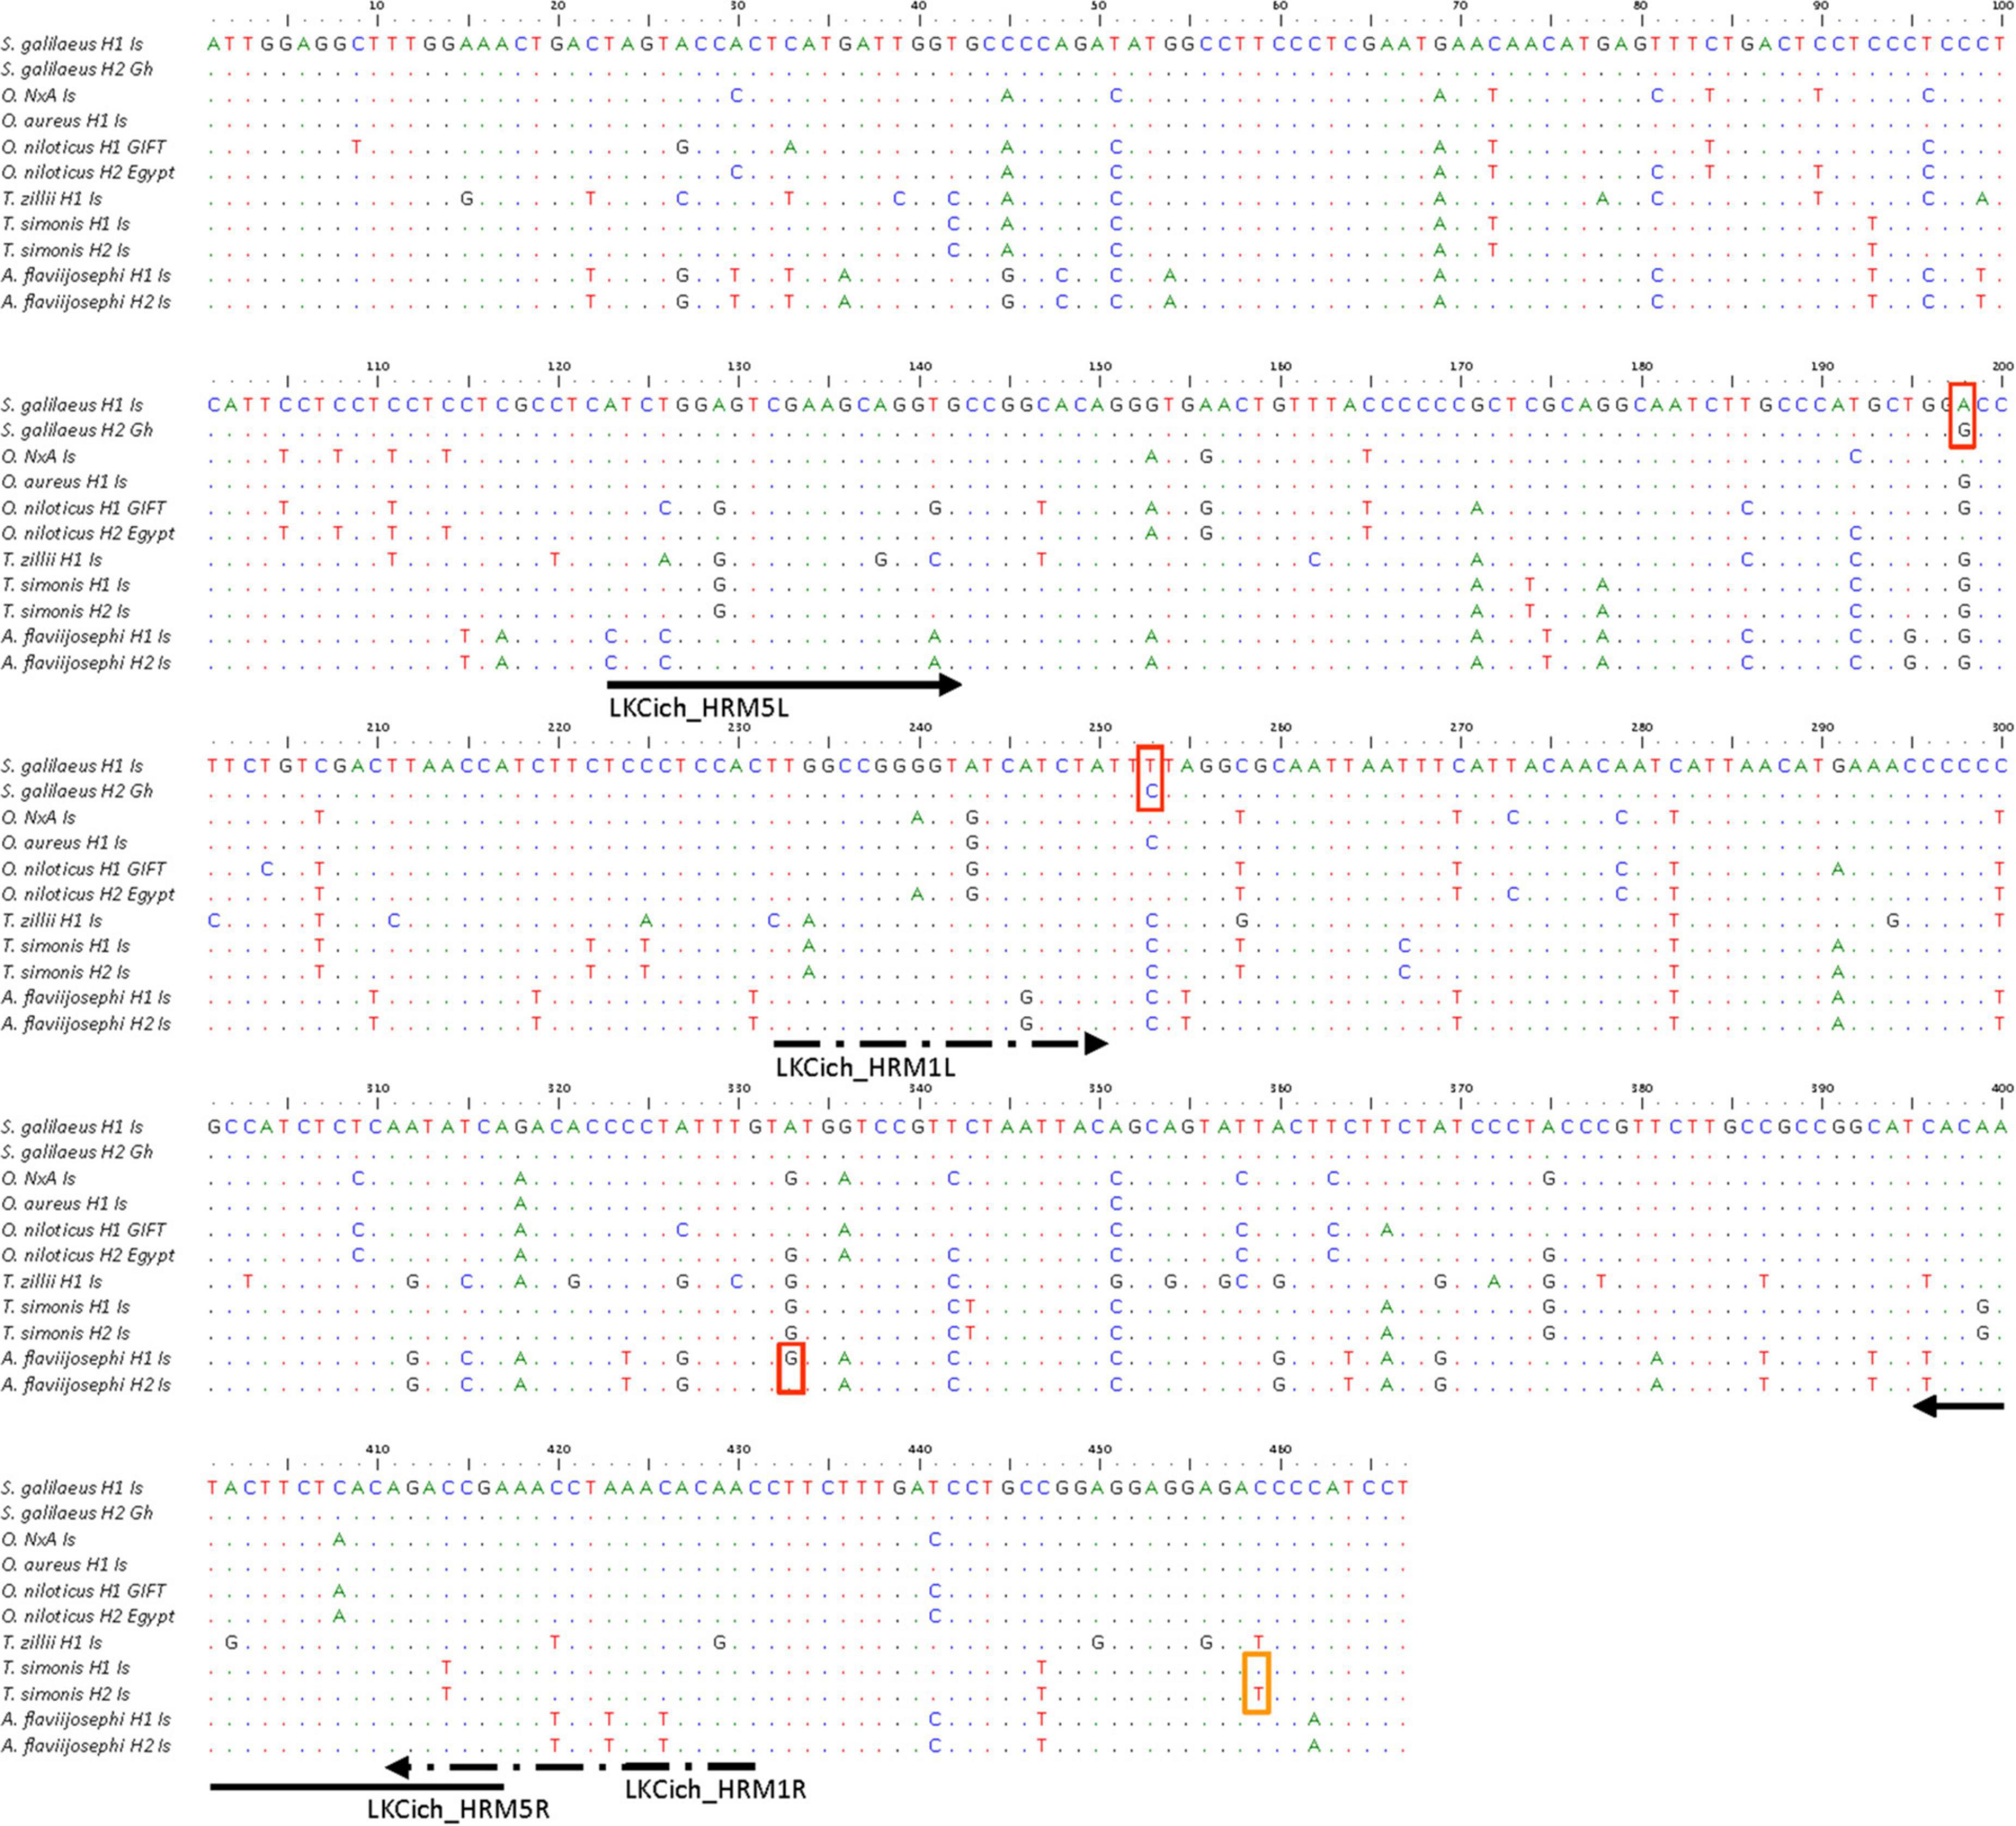
Figure 1. Multiple alignment of the 11 COI haplotypes used for developing the cichlid species identification method. On the left are the species and haplotype names. Variable bases relative to the top sequence are shown by their letter. Underneath the alignment marked are name, position, and direction of the PCR primers. Red and orange small boxes show positions within and outside, respectively, the HRM primer amplicon that are polymorphic between haplotypes of the same species.
In this set of cichlids, a total of 112 polymorphic positions were identified in 467 bp of aligned sequence, which translates to one polymorphism every 4.17 bases or 24%, on average (Figure 1). This high level of polymorphism is concordant with differences among different genera. The final sequence alignment was used to construct an unrooted species phylogeny (Figure 2). Although COI variation could be found also within morphologically defined species (intraspecific), this was not a problem, since as can be seen in the haplotype phylogeny (Figure 2) and generally, interspecific divergence in COI sequences is significantly larger than intraspecific variation (Behrens-Chapuis et al., 2018). Thus, all species could be reliably separated based on these COI haplotypes.
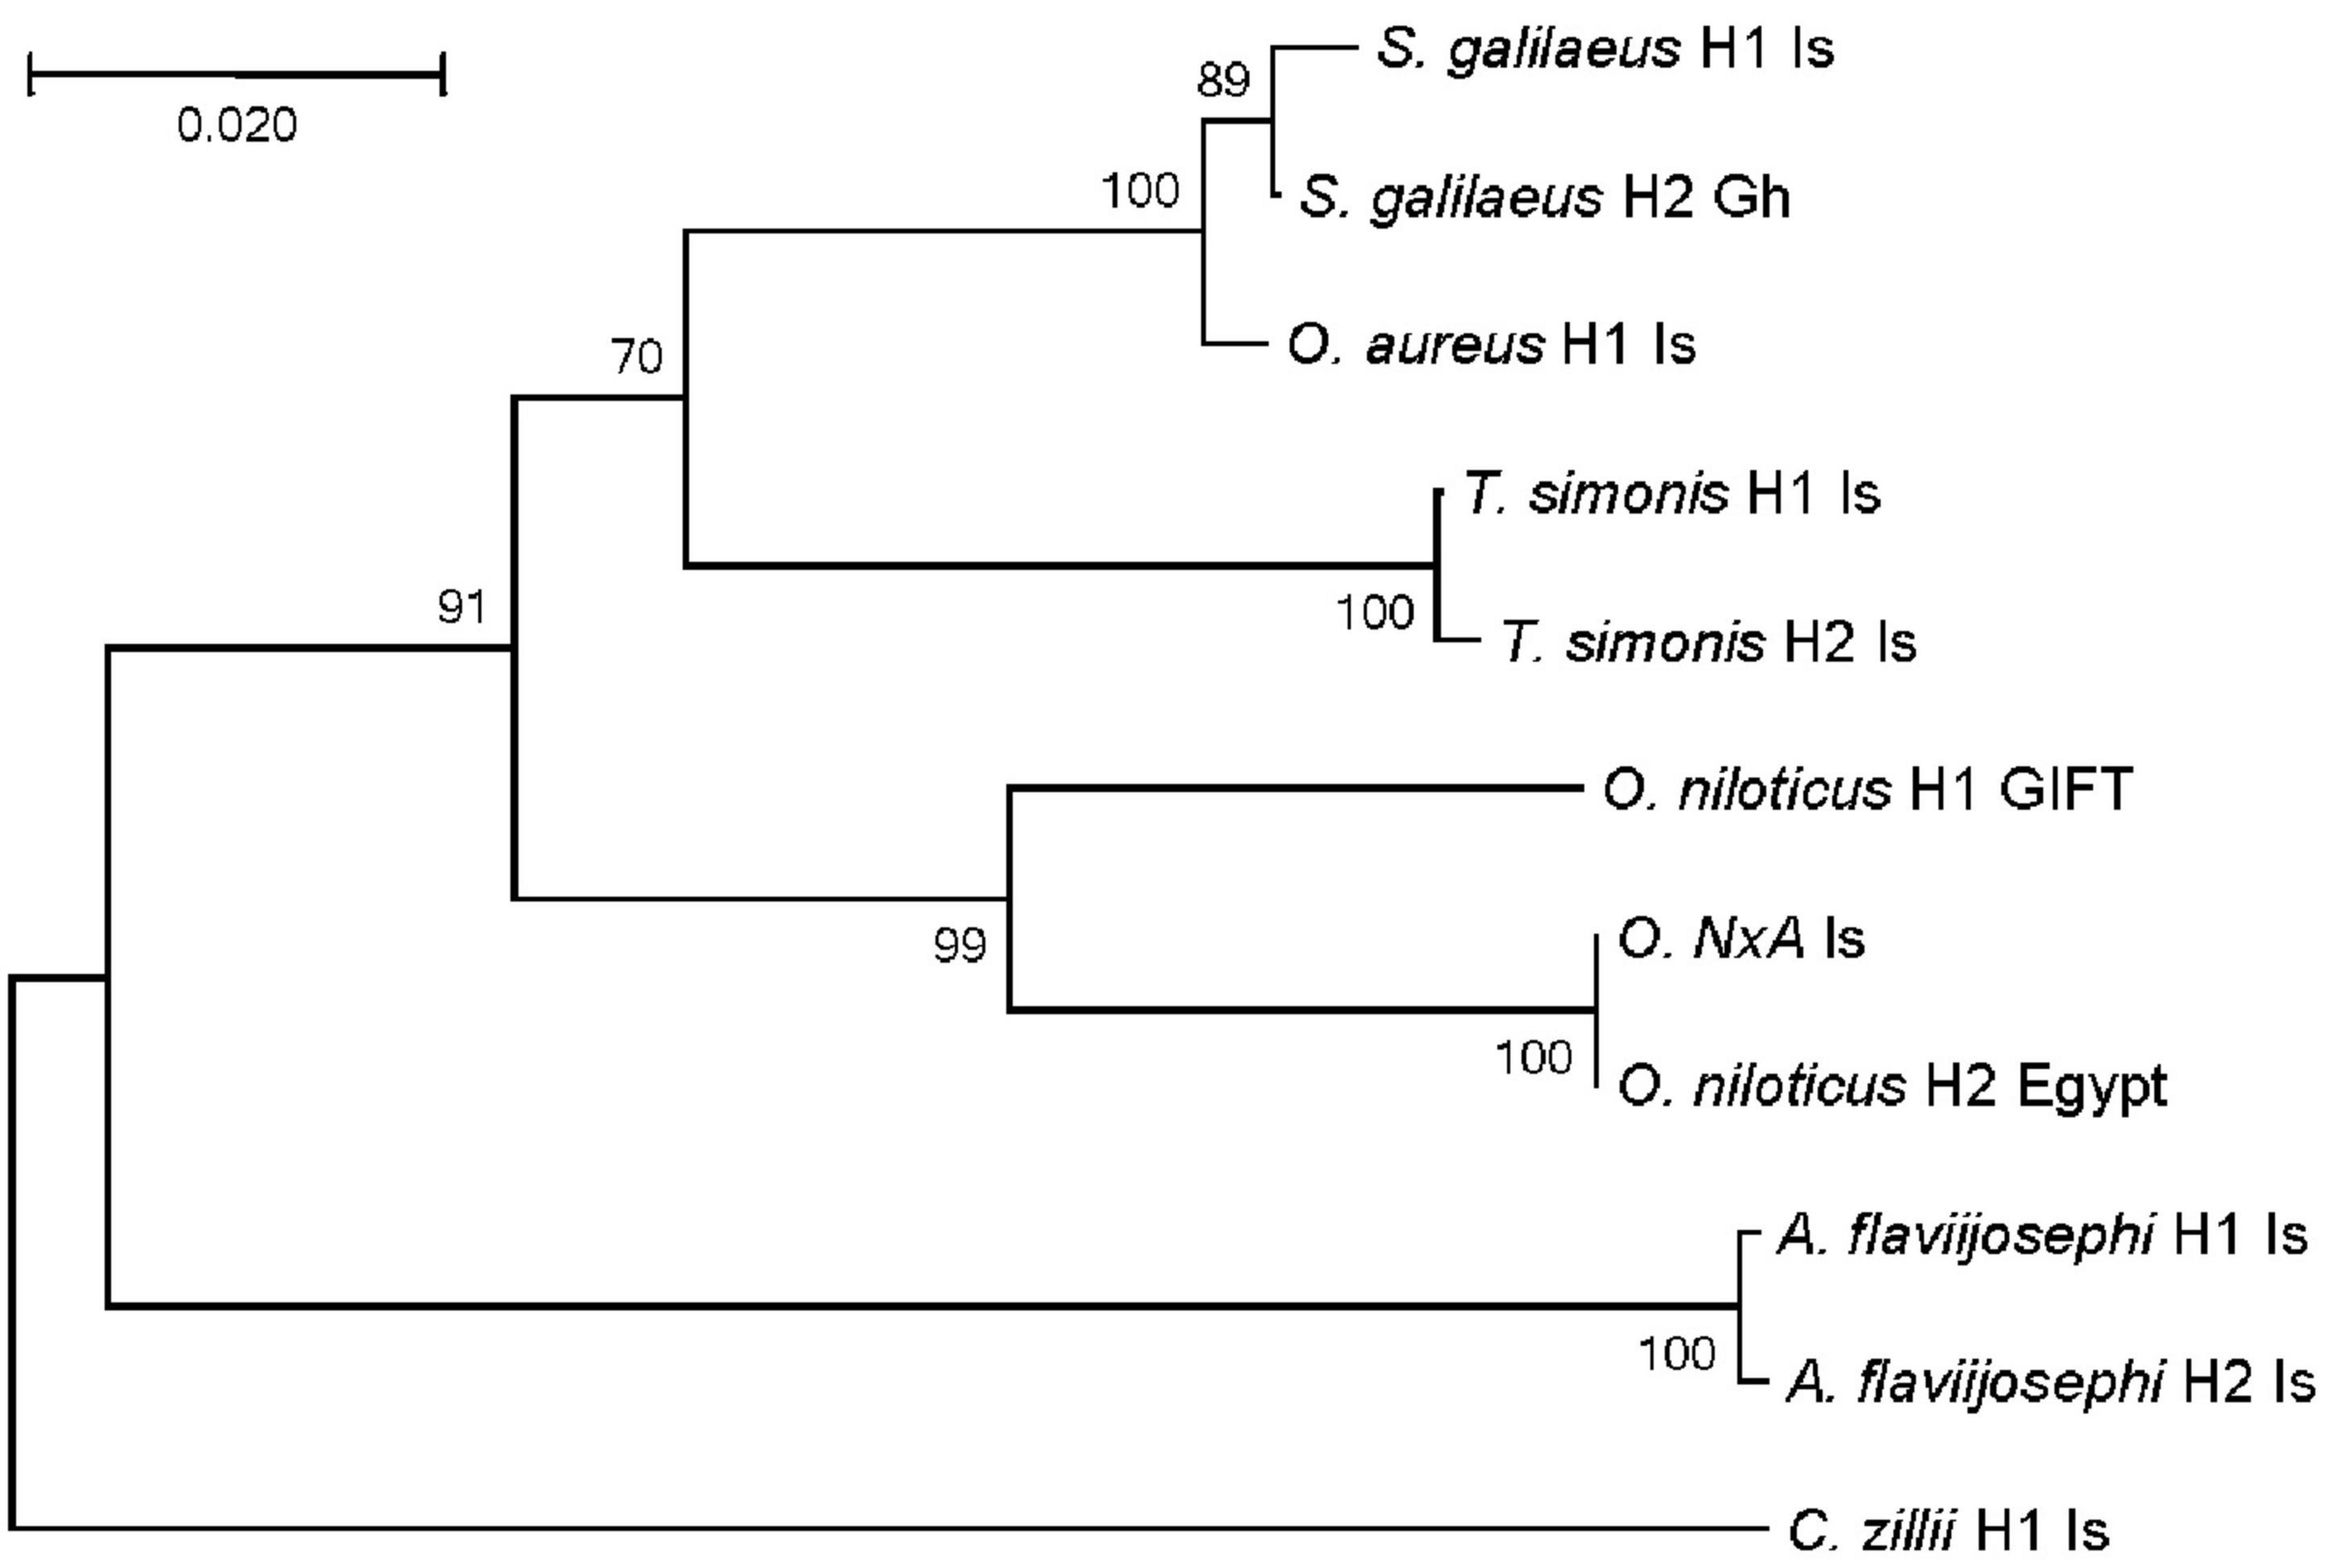
Figure 2. Unrooted haplotype phylogeny of the six cichlid species based on their COI haplotypes. Numbers next to splits are percent bootstrap support from 1,000 replicates. Next to branch tips are species names, haplotype number, and country of origin (Is, Israel; Gh, Ghana; Egypt and GIFT strain). Sample NxA was morphologically identified as a hybrid between Oreochromis niloticus and Oreochromis aureus.
The Cichlidae family includes about 1,700 known species and although only six are represented here, the phylogeny of these six (Figure 2) captures some of the complex taxonomic relationships existing within this species-rich family. In the phylogeny, A. flaviijosephi clustered separately, capturing the major separation between the Tilapiinae and Haplochrominae sub-families of African cichlids. Among the Tilapine species, C. zillii is as separated from other species of its group (O. aureus, S. galilaeus, T. simonis, and O. niloticus), as it is separated from A. flaviijosephi, which represents the other sub-family, Haplochrominae. The position of C. zillii in the phylogeny relative to the other species supports the recent change in its taxonomic affiliation from Tilapia to Coptodon. Taxonomic diversity and complexity in morphological features had occasionally led to changing genus and species affiliations of cichlids (Trewavas, 1983; Dunz and Schliewen, 2013; Nyingi et al., 2021).
Within Tilapines, O. aureus clustered more closely to S. galilaeus and T. simonis than to O. niloticus, despite their shared genus (Oreochromis) and their lower reproductive barriers, that resulted in the presence of a hybrid (NxA) in the lake (Tadmor-Levi et al., 2022). Moreover, hybrids between O. niloticus females and O. aureus males are commonly produced for aquaculture production by natural pond reproduction. In contrast, hybrids of O. aureus or O. niloticus with S. galilaeus or T. simonis were not reported in the lake and O. niloticus × S. galilaeus could be produced only by artificial reproduction (Agresti et al., 2000), suggesting higher reproductive barriers between the species of different genera, as might be expected. In addition, in terms of adaptation, among the four species, only O. niloticus is not native to the lake. Thus, it seems that the lower reproduction barrier is consistent with the common genus definition of the two Oreochromis species, whereas the COI variation places O. aureus closer to species of different genera (Sarotherodon and Tristramella), with which it shares adaptation to the lake habitat. These alleged incongruities among genetic similarity, reproduction barriers, adaptations and morphological taxonomy within the cichlids of the Sea of Galilee and its surrounding region reflect the taxonomic complexity of African cichlids in general.
Considerations for Bar-HRM development
Abundant COI sequence variation was identified among the six species (Figure 1). Although, intuitively, the identification method development should benefit from the many variants found among species, in practice, an efficient single-tube Bar-HRM method also requires similarities. We sought to design a primer pair that will commonly amplify multiple species, allowing a single-tube identification assay. Thus, several primers, yielding amplification products of various lengths, were designed on relatively conserved regions and tested for successful PCR amplification on the reference DNA panel representing the six species. Two pairs of primers were selected for the assay, LKCich_HRM1 and LKCich_HRM5 (Table 1). These primer pairs locate to regions with relatively less variation, while flanking a highly polymorphic region (Figure 1). PCR using LKCich_HRM5 amplified the corresponding sequence from five out of six species (excluding C. zillii), whereas using LKCich_HRM1 amplified all six. Furthermore, LKCich_HRM5 amplicons resulted in distinctive HRM curves for each of the five species. Therefore, by analyzing either the melting curve profile or the HRM difference plots, a single primer pair, LKCich_HRM5, could in practice positively identify five species and by a negative result also the 6th (Figure 3A). In order to positively identify C. zillii samples and avoid misidentification by unsuccessful PCR reactions, primer pair LKCich_HRM1 could be used on samples that failed amplification by LKCich_HRM5 to obtain a distinctive HRM curve also for C. zillii (Figure 3B). Furthermore, LKCich_HRM1 distinguished not only C. zillii, but also separated S. galilaeus, O. aureus and A. flaviijosephi from O. niloticus and T. simonis (Figure 3B), separations that second the results of LKCich_HRM5 assays.
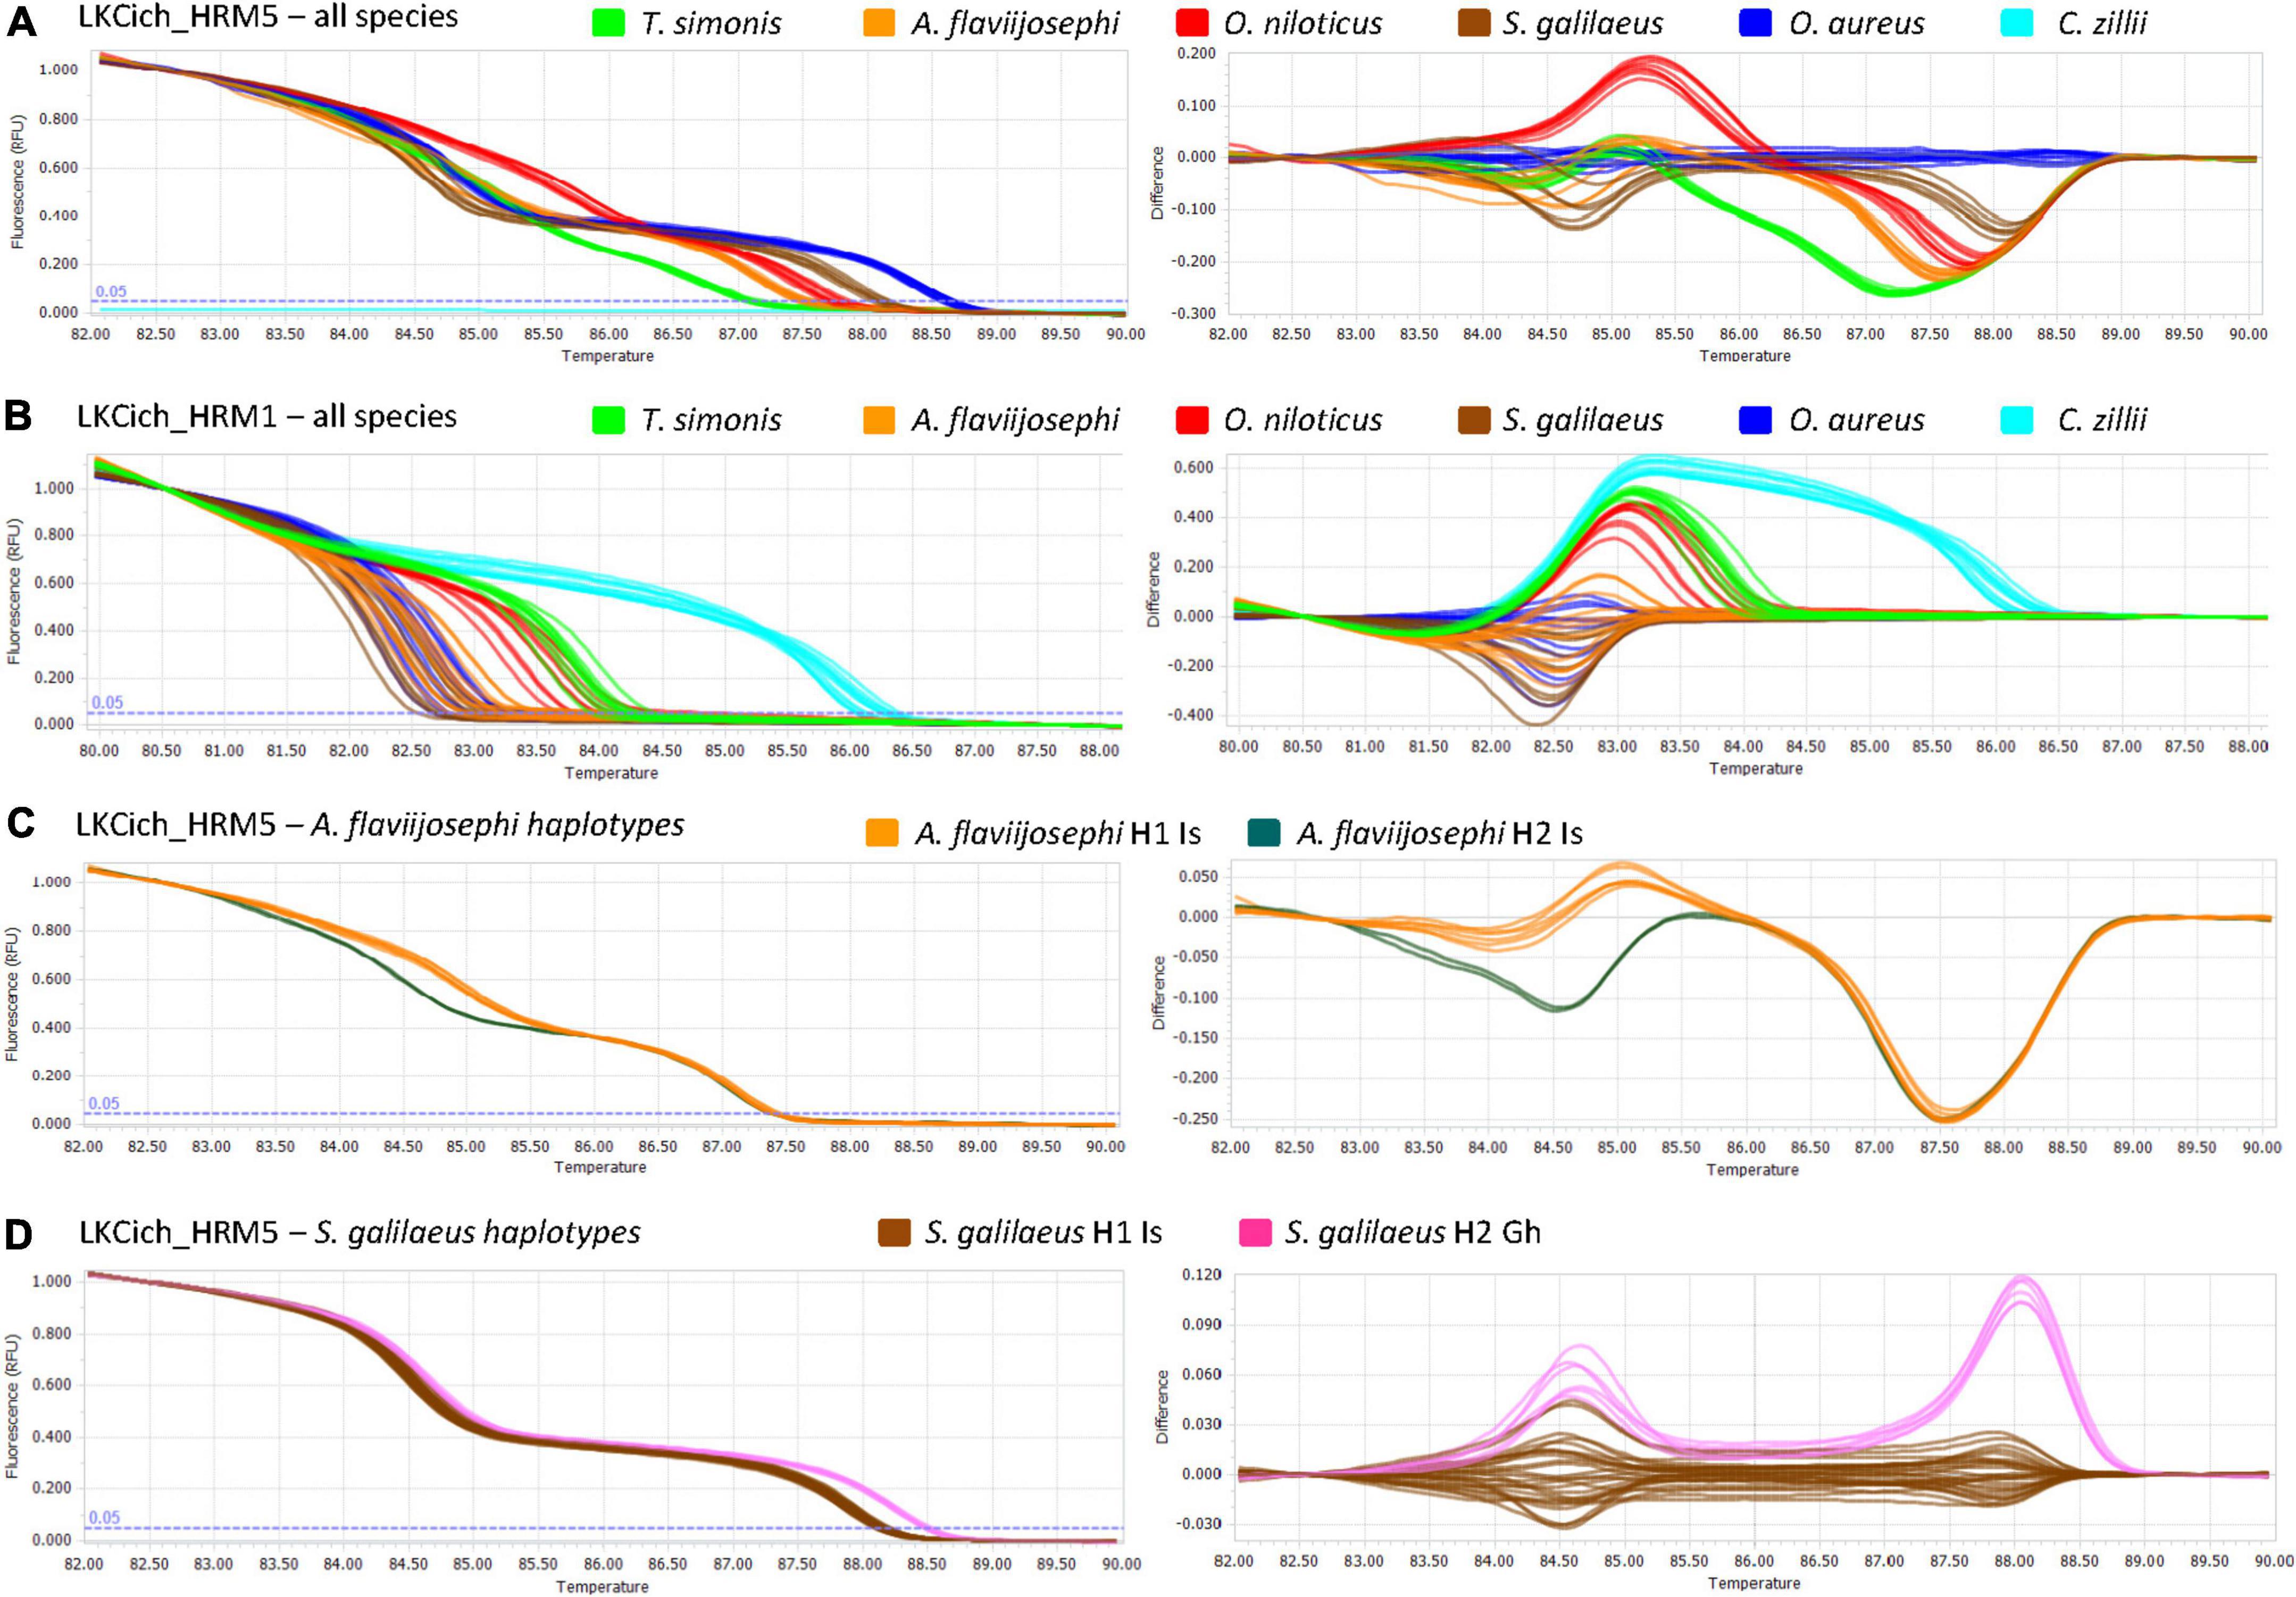
Figure 3. Bar-HRM analyses of the reference sample set of six cichlid species. In all panels, the melting curve profiles (fluorescence level as a function of melting temperature) are shown on the left and the differences plots (difference in fluorescence as a function of melting temperature) on the right. For each panel, curves of different species are shown in different colors as indicated in the panel legend. (A). Results obtained by primer pair LKCich_HRM5 for samples of all six species. Each line is an individual replicate. Note the difference in curve shape among species in contrast to the similarity among individuals of the same species even if they have different haplotypes. Coptodon zillii samples are not amplified as reflected by light blue flat lines on the left melting curve plot. (B). Results obtained by primer pair LKCich_HRM1 for samples of all six species. For these primers the most notable difference in melting curves is for C. zillii. More subtle differences could be found also between additional species, allowing independent verification for some species in addition to curves from LKCich_HRM5. (C). Results obtained by primers LKCich_HRM5 for samples of Astatotilapia flaviijosephi with different haplotypes that were both found in Israel (H1 Is and H2 Is). (D). Results obtained by primers LKCich_HRM5 for samples of Sarotherodon galilaeus with different haplotypes (H1 Is from Israel and H2 Gh from Ghana).
Furthermore, included in the reference panel were two haplotypes for S. galilaeus, T. simonis and A. flaviijosephi as indicated in the haplotype phylogeny (Figure 2). However, within the regions flanked by the two Bar-HRM primer pairs, intraspecific haplotype variation was found for S. galilaeus and A. flaviijosephi but not for T. simonis (Figure 1). Accordingly, Bar-HRM using LKCich_HRM5 primer pair resulted in distinctive HRM curves identifying intraspecific variation within A. flaviijosephi and S. galilaeus (Figures 3C,D, respectively).
The results of the reference panel confirmed the specificity and reliability of this single tube assay. The HRM curves obtained from replicate samples of the same species were very similar to each other, while considerably different from those of other species (Figure 3). These results were also consistent across technical replicates, analyzing again the same reference panel by both Bar-HRM primer pairs. Moreover, for LKCich_HRM5 primer pair, intraspecific variation that was detected did not interfere with detection of interspecific variation, consistent with the expectation that when variation between species is detected, it will be considerably higher than that within species, as evident here in DNA barcoding sequences of even closely related species.
In order for a single tube Bar-HRM assay to reliably identify different species, it should yield interspecific HRM differences, which will be larger and/or different than intraspecific ones. Therefore, the design principles of a single tube Bar-HRM assay, which will successfully identify different species, are essentially different from principles of the more commonly used HRM assays designed to identify the genotypes of a single DNA variant. Here, in order to separate multiple species using a single primer pair, the design must include successful amplification from multiple species of a region differing in sequence among the species, the combination of which will generate both inter- and intraspecific HRM differences. Generally, since the DNA melting temperature (Tm) depends also on amplicon size and not only on base composition, single base variations can be more easily detected within smaller amplicons, typically 50–100 bp in length (Liew et al., 2004). To meet the above requirements, the LKCich_HRM5 primer pair amplifies a 300 bp amplicon. In fact, the LKCich_HRM1 primer pair, which amplifies a 200 bp amplicon, neither separates all the species nor intraspecific haplotypes, despite sequence differences among all species and overlap in sequence with the successful LKCich_HRM5 amplicon (Figure 1). Other single tube Bar-HRM assays in fish amplified amplicons of 150–200 bp (McGlauflin et al., 2010; Fitzcharles, 2012; Behrens-Chapuis et al., 2018), smaller than our assay, but on the large side of the HRM method. Therefore, we recommend that, counter intuitively to design principles of a regular short HRM assay, a single tube Bar-HRM design should relax the amplicon length parameter and consider longer amplicons containing sufficient interspecific variants and possibly one or two intraspecific ones as well.
Identification of cichlid fry species
Having in hand the identification method, its utility was tested in estimating the distribution and relative abundance of cichlid fry in shallow inundated areas of the Sea of Galilee littoral belt. Altogether, 279 cichlid fry that were too small (<10 cm total length) to be morphologically identified to the species level were analyzed. HRM profiles identified 247 (88%), 30 (11%) and 2 (1%) samples as S. galilaeus, O. aureus, and O. niloticus, respectively. Analyzing the distribution of fry species revealed that the overall proportions were similar for both periods and for all three sampling sites (Figure 4). No significant difference in the proportion of the three species was found between sampling sites (χ2 = 1.733, df = 4, P = 0.7847) or periods (χ2 = 0.228, df = 2, P = 0.8925). Since the sampling sites represent the eastern shore of the lake (Cummings et al., 2017), this homogeneity in proportions likely reflects the overall situation there, indicating that S. galilaeus fry were by far the most prevalent in this side of the lake from April to July. Although there are no good population size estimates for lake cichlids, acoustic surveys and commercial fishing landings suggested that S. galilaeus had the largest population size among the lake cichlids (Ostrovsky et al., 2014a), and this was also the situation at the fry stage sampling. It is not surprising that we did not find fry of other species like T. simonis or A. flaviijosephi, since these species are considered to be far less abundant in the lake, hence, fry of these species are likely also rarer and might be found in other habitats or times.
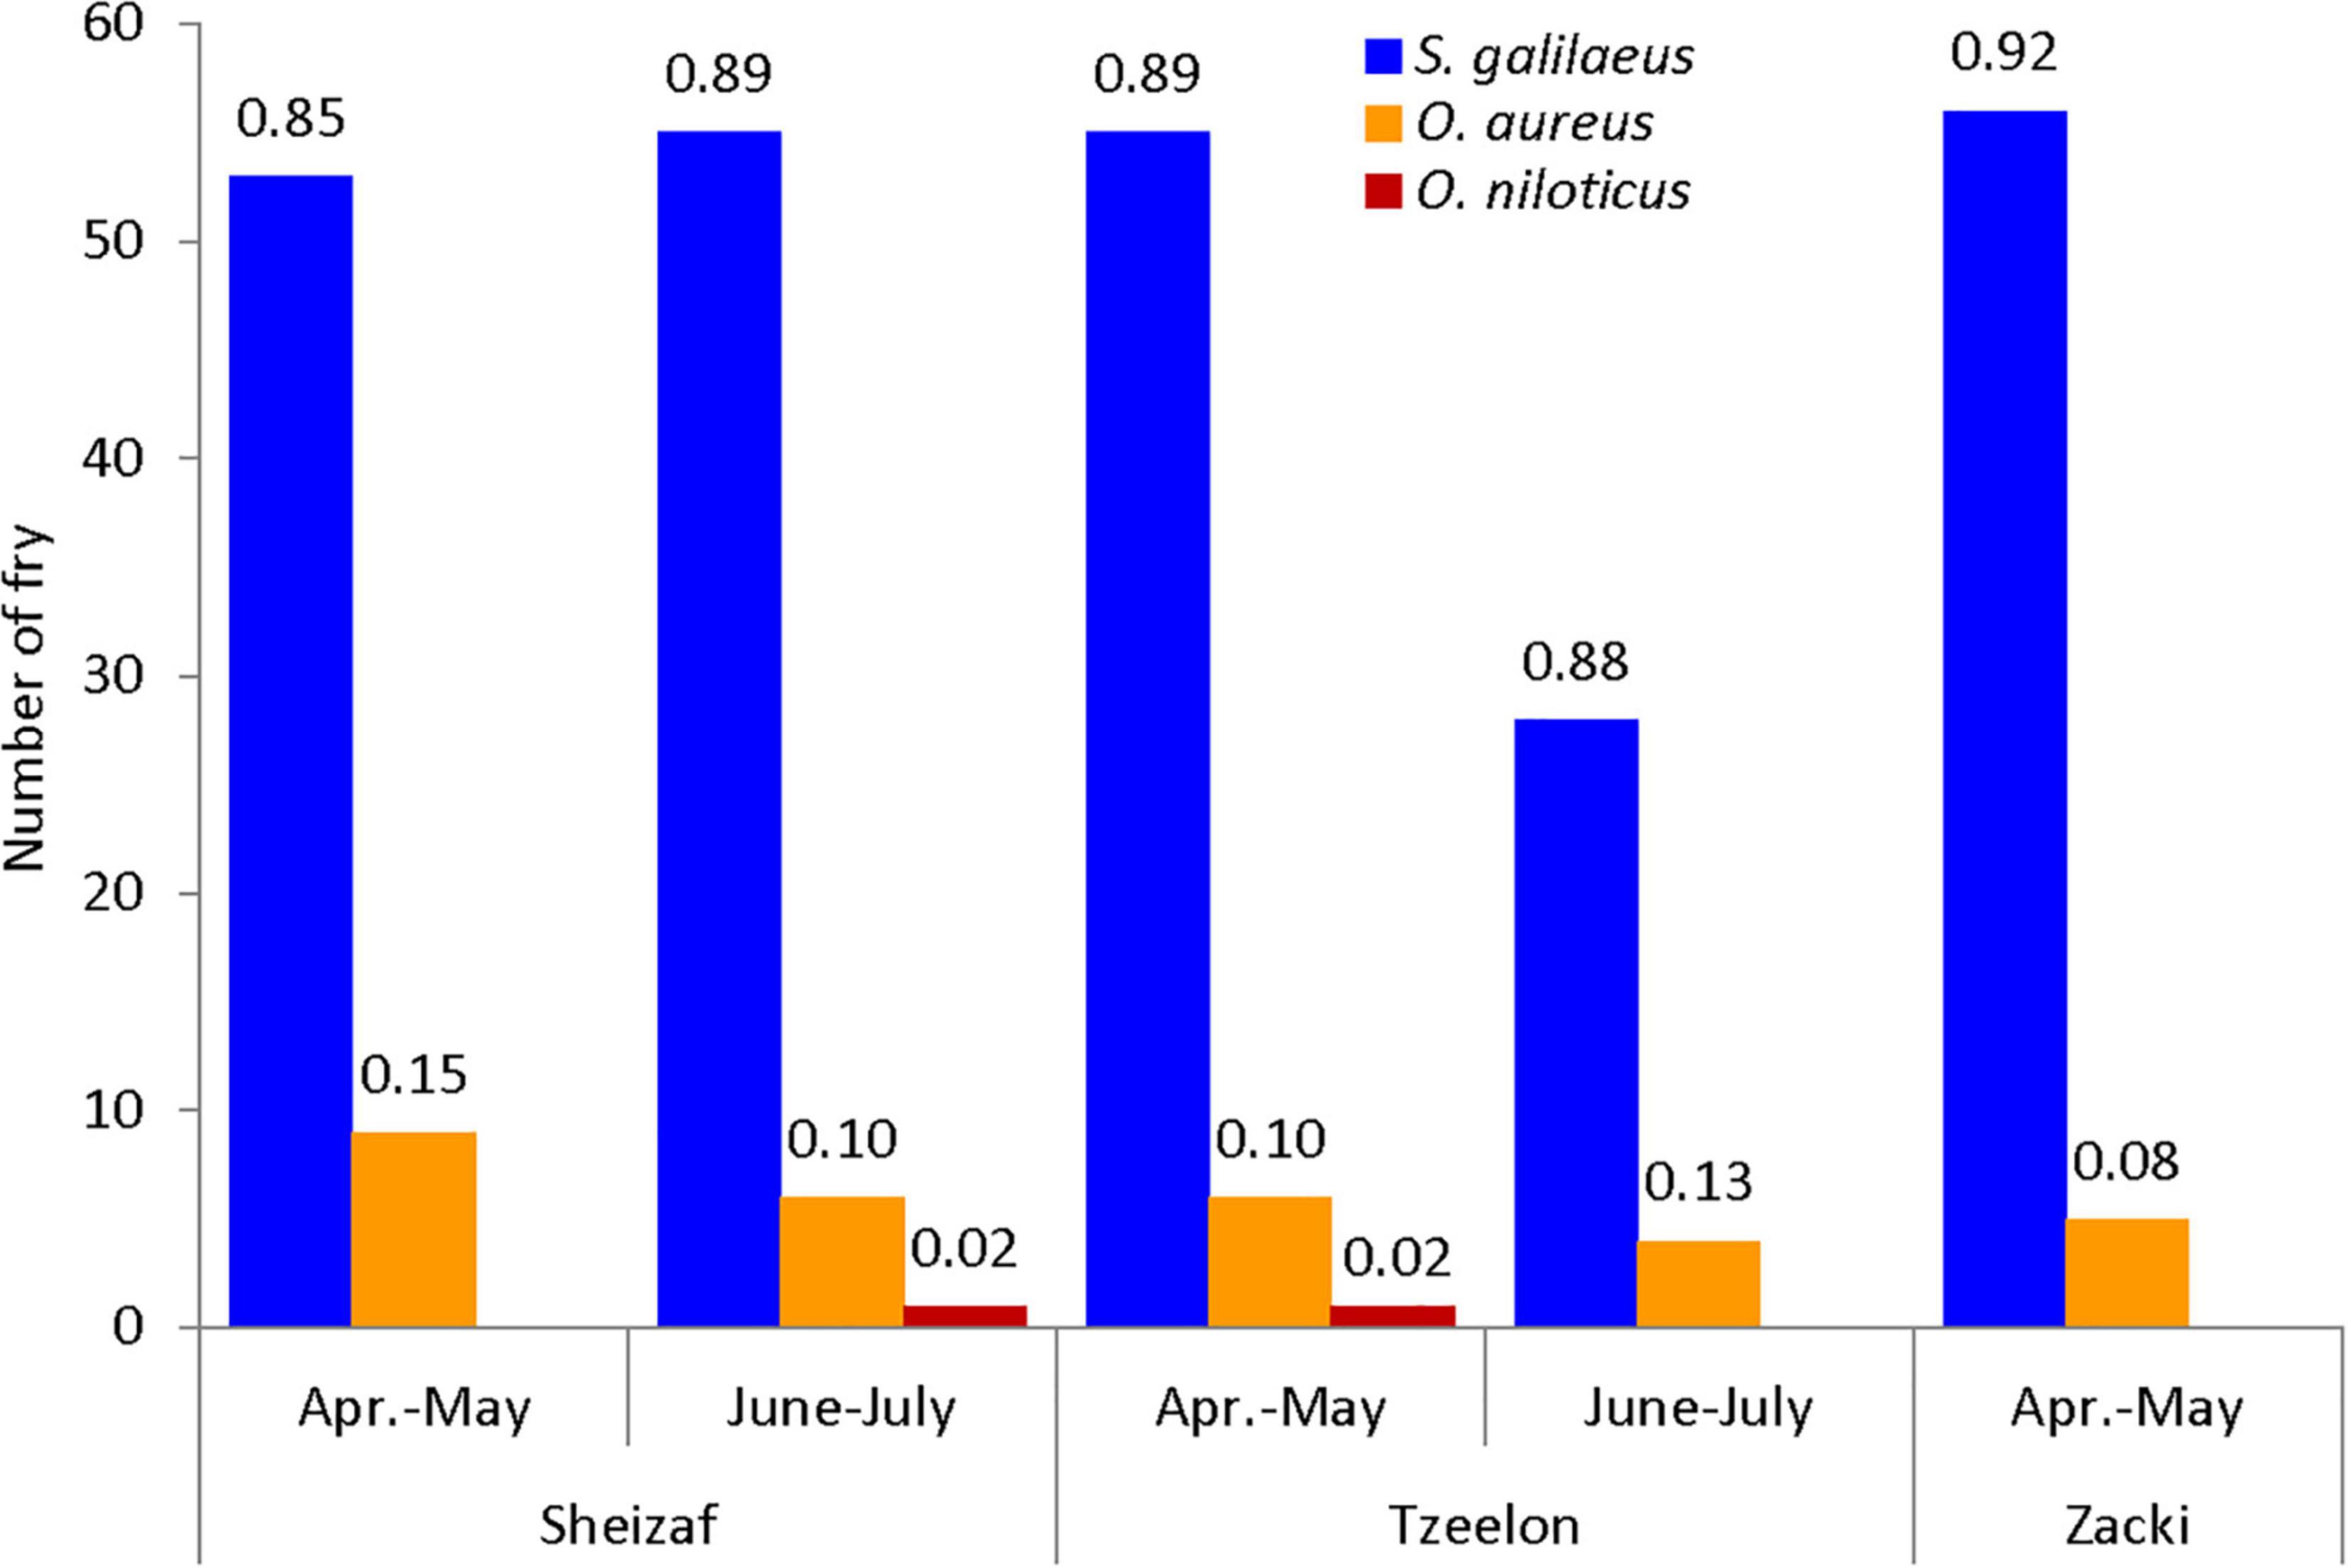
Figure 4. Distribution of fry by place, period and species as it was identified by the Bar-HRM method. Species are colored differently. On the Y-axis is the number of fry and on column tips, the proportion of each species in its place and period category.
In the same survey, in parallel to fry, also adult fish that were morphologically identified to the species level were captured. Interestingly, among the adult fish, about 2/3 were C. zillii and the rest were S. galilaeus and O. aureus (Cummings et al., 2017). This apparent disconcordance between abundance of adult and fry stage cichlids could reflect the little overlap in spawning times. S. galilaeus and O. aureus spawn earlier than C. zillii, likely resulting in a delay in time between spawning stage, when adults are present, and nursery stage, when independent fry are found in the littoral zone and adults return to deeper parts of the lake (Ben-Tuvia, 1960; Shefler, 1987; Bruton and Gophen, 1992; Cummings et al., 2017).
Two fry specimens, each sampled at a different period and location, were identified as O. niloticus, a species that is not native to the lake. Although unlikely, these might be mistaken identifications, placing the accuracy of the method at 99%. However, it is more likely that these were hybrids with maternal O. niloticus lineage, in addition to the NxA adult sample, which was also morphologically identified as such and included in the phylogeny (Figure 2). These are less likely be first filial generation (F1) hybrid fry that escaped aquaculture ponds and found their way into the lake, since these were small fry, and there are no aquaculture ponds next to the eastern part of the lake. Pure O. niloticus fish are not native to the Sea of Galilee, and thus, perhaps more likely is the case that these specimens were second or further generation progeny of an O. niloticus × O. aureus hybrid female crossed to such or to a pure O. aureus male, suggesting the possibility for such natural reproduction of hybrids in the lake. Although their proportion was low in the sample, in the overall fry and adult population numbers will scaleup to many potential hybrids in the lake. Being a mitochondrial gene, COI can only detect hybrids with an O. niloticus maternal origin. The reciprocal hybrid, if it exists, will be identified as the native O. aureus fish. Thus, the extent and prevalence of such hybrids might be even higher.
Conclusion
In this study, we have developed an efficient and accurate method based on DNA barcodes to identify the species of cichlids inhabiting the Sea of Galilee and its surrounding freshwater habitats. This is a PCR based, single tube, Bar-HRM assay that can even separate between different COI haplotypes of the same species. To maximize the coverage of the assay, the method was developed on a reference set of samples from adult fish, the species of which were identified morphologically, representing all the COI haplotypes identified previously in a larger set of samples from this region (Tadmor-Levi et al., 2022). The utility of this method was demonstrated in identifying young fry, the species of which could not have been successfully identified by morphological taxonomy. DNA-based identification allowed studying abundance and distribution of fry by species in their nursery habitat. Fry of S. galilaeus were much more abundant relative to fry of O. aureus and since this relative abundance did not vary by place or date, our findings probably represent the overall state of fry in this season. It is yet to be determined how fry will be recruited to form the adult population. Nevertheless, our results suggest that sections of the lake, which became inundated as a result of increased water levels, are nurseries to cichlid fry, and therefore, are important habitats to support the sustainability of populations in the lake, in particular that of S. galilaeus which only recently suffered from a drastic reduction in its population size. Notably, two fry samples were identified as O. niloticus, indicating the presence of notable numbers of NxA, and possibly AxN, hybrids that are probably reproducing in the lake. Although in its infancy, we see a promising future for this methodology in enhancing ecological research on the Sea of Galilee fishes and in protecting the sustainability of these unique fish populations of the region.
Data availability statement
The original contributions presented in this study are included in the article/Supplementary material, further inquiries can be directed to the corresponding author.
Author contributions
RT-L, DC, TB, RS, and LD designed the research. RT-L, DC, TB, RS, and EM-H performed the research. RT-L, RS, EM-H, and LD analyzed the data. RT-L and LD wrote the manuscript. All authors contributed to the article and approved the submitted version.
Funding
This study was funded by grant #186-0001-11 from the Israel Ministry of Agriculture and Rural Development to LD.
Acknowledgments
In memory of our dear friend and colleague TB, who initiated and contributed to this research project.
Conflict of interest
The authors declare that the research was conducted in the absence of any commercial or financial relationships that could be construed as a potential conflict of interest.
Publisher’s note
All claims expressed in this article are solely those of the authors and do not necessarily represent those of their affiliated organizations, or those of the publisher, the editors and the reviewers. Any product that may be evaluated in this article, or claim that may be made by its manufacturer, is not guaranteed or endorsed by the publisher.
Supplementary material
The Supplementary Material for this article can be found online at: https://www.frontiersin.org/articles/10.3389/fevo.2022.1010838/full#supplementary-material
Supplementary data sheet 1 | Alignment of 11 COI haplotypes representing the haplotypes of the six species of this study (COI haplotypes.fasta).
Footnotes
References
Adrian, R., O’Reilly, C. M., Zagarese, H., Baines, S. B., Hessen, D. O., Keller, W., et al. (2009). Lakes as sentinels of climate change. Limnol. Oceanogr. 54, 2283–2297.
Agresti, J. J., Seki, S., Cnaani, A., Poompuang, S., Hallerman, E. M., Umiel, N., et al. (2000). Breeding new strains of tilapia: Development of an artificial center of origin and linkage map based on AFLP and microsatellite loci. Aquaculture 185, 43–56. doi: 10.1016/S0044-8486(99)00335-X
Albert, J. S., Destouni, G., Duke-Sylvester, S. M., Magurran, A. E., Oberdorff, T., Reis, R. E., et al. (2021). Scientists’ warning to humanity on the freshwater biodiversity crisis. Ambio 50, 85–94.
Anthoons, B., Lagiotis, G., Drouzas, A. D., de Boer, H., and Madesis, P. (2022). Barcoding high resolution melting (Bar-HRM) enables the discrimination between toxic plants and edible vegetables prior to consumption and after digestion. J. Food Sci. [Epub ahead of print]. doi: 10.1007/s13280-020-01318-8
Arthington, A. H. (2021). Grand challenges to support the freshwater biodiversity emergency recovery plan. Front. Environ. Sci. 9:664313. doi: 10.1111/1750-3841.16253
Badia-Melis, R., Mishra, P., and Ruiz-García, L. (2015). Food traceability: New trends and recent advances. A review. Food Control 57, 393–401. doi: 10.3389/fenvs.2021.664313
Behrens-Chapuis, S., Malewski, T., Suchecka, E., Geiger, M. F., Herder, F., and Bogdanowicz, W. (2018). Discriminating European cyprinid specimens by barcode high-resolution melting analysis (Bar-HRM)—A cost efficient and faster way for specimen assignment? Fish. Res. 204, 61–73. doi: 10.1016/j.foodcont.2015.05.005
Beng, K. C., and Corlett, R. T. (2020). Applications of environmental DNA (eDNA) in ecology and conservation: Opportunities, challenges and prospects. Biodivers. Conserv. 29, 2089–2121. doi: 10.1016/j.fishres.2018.02.007
Ben-Tuvia, A. (1960). The biology of the cichlid fishes of lake tiberias and huleh. Bull. Res. Counc. Israel 8B, 153–188. doi: 10.1007/s10531-020-01980-0
Ben-Tuvia, A. (1981). Man-induced changes in the freshwater fish fauna of Israel. Aquac. Res. 12, 139–148.
Berman, T. (1998). Lake Kinneret and its catchment: International pressures and environmental impacts. Water Policy 1, 193–207. doi: 10.1111/j.1365-2109.1981.tb00023.x
Berman, T., Zohary, T., Nishri, A., and Sukenik, A. (2014). “General background,” in Lake kinneret, eds T. Zohary, A. Sukenik, T. Berman, and A. Nishri (Dordrecht: Springer), 1–15. doi: 10.1016/S1366-7017(98)00014-2
Borovski, T., Tadmor-Levi, R., Shapiro, J., Rubinstein, G., Agyakwah, S. K., Hulata, G., et al. (2018). Historical and recent reductions in genetic variation of the Sarotherodon galilaeus population in the Sea of Galilee. Conserv. Genet. 19, 1323–1333. doi: 10.1007/978-94-017-8944-8_1
Bruton, M., and Gophen, M. (1992). The effect of environmental factors on the nesting and courtship behaviour ofTilapia zillii in Lake Kinneret (Israel). Hydrobiologia 239, 171–178. doi: 10.1007/s10592-018-1102-7
Carpenter, S. R., Stanley, E. H., and Vander Zanden, M. J. (2011). State of the world’s freshwater ecosystems: Physical, chemical, and biological changes. Annu. Rev. Environ. Resour. 36, 75–99. doi: 10.1007/BF00007674
Cnaani, A., and Hulata, G. (2008). “Tilapias,” in Genome mapping and genomics in fishes and aquatic animals, eds T. D. Kocher and C. Kole (Heidelberg: Springer), 101–116. doi: 10.1146/annurev-environ-021810-094524
Creer, S., Deiner, K., Frey, S., Porazinska, D., Taberlet, P., Thomas, W. K., et al. (2016). The ecologist’s field guide to sequence-based identification of biodiversity. Methods Ecol. Evol. 7, 1008–1018. doi: 10.1007/978-3-540-73837-4_4
Cummings, D., Goren, M., Gasith, A., and Zohary, T. (2017). Inundated shore vegetation as habitat for cichlids breeding in a lake subjected to extreme water level fluctuations. Inland Waters 7, 449–460. doi: 10.1111/2041-210X.12574
Darwall, W. R., and Freyhof, J. (2016). “Lost fishes, who is counting? The extent of the threat to freshwater fish biodiversity,” in Conservation of freshwater fishes, eds G. P. Closs, M. Krkosek, and J. D. Olden (Cambridge: Cambridge University Press), 1–36. doi: 10.1080/20442041.2017.1388984
Dudgeon, D., Arthington, A. H., Gessner, M. O., Kawabata, Z.-I., Knowler, D. J., Lévêque, C., et al. (2006). Freshwater biodiversity: Importance, threats, status and conservation challenges. Biol. Rev. 81, 163–182. doi: 10.1017/CBO9781139627085.002
Dunz, A. R., and Schliewen, U. K. (2013). Molecular phylogeny and revised classification of the haplotilapiine cichlid fishes formerly referred to as “Tilapia”. Mol. Phylogenet. Evol. 68, 64–80. doi: 10.1017/S1464793105006950
Dynesius, M., and Nilsson, C. (1994). Fragmentation and flow regulation of river systems in the northern third of the world. Science 266, 753–762. doi: 10.1016/j.ympev.2013.03.015
Fernandes, T. J., Costa, J., Oliveira, M. B. P., and Mafra, I. (2018). COI barcode-HRM as a novel approach for the discrimination of hake species. Fish. Res. 197, 50–59. doi: 10.1126/science.266.5186.753
Fitzcharles, E. (2012). Rapid discrimination between four Antarctic fish species, genus Macrourus, using HRM analysis. Fish. Res. 127, 166–170. doi: 10.1016/j.fishres.2017.09.014
Frankham, R., Bradshaw, C. J., and Brook, B. W. (2014). Genetics in conservation management: Revised recommendations for the 50/500 rules, Red List criteria and population viability analyses. Biol. Conserv. 170, 56–63. doi: 10.1016/j.fishres.2012.02.002
Gaeta, J. W., Sass, G. G., and Carpenter, S. R. (2014). Drought-driven lake level decline: Effects on coarse woody habitat and fishes. Can. J. Fish. Aquat. Sci. 71, 315–325.
Galimberti, A., De Mattia, F., Losa, A., Bruni, I., Federici, S., Casiraghi, M., et al. (2013). DNA barcoding as a new tool for food traceability. Food Res. Int. 50, 55–63. doi: 10.1016/j.biocon.2013.12.036
Ganopoulos, I., Madesis, P., Darzentas, N., Argiriou, A., and Tsaftaris, A. (2012). Barcode high resolution melting (Bar-HRM) analysis for detection and quantification of PDO “Fava Santorinis”(Lathyrus clymenum) adulterants. Food Chem. 133, 505–512. doi: 10.1016/j.foodres.2012.09.036
Gophen, M., Sonin, O., Lev, M., and Snovsky, G. (2015). Regulated fishery is beneficial for the sustainability of fish population in Lake Kinneret (Israel). Open J. Ecol. 5, 513–527. doi: 10.1016/j.foodchem.2012.01.015
Goren, M. (2014). Tristramella sacra. The IUCN red list of threatened species. doi: 10.2305/IUCN.UK.2014-1.RLTS.T61372A19010617.en
Goren, M., and Galil, B. (2005). A review of changes in the fish assemblages of Levantine inland and marine ecosystems following the introduction of non-native fishes. J. Appl. Ichthyol. 21, 364–370.
Goren, M., and Ortal, R. (1999). Biogeography, diversity and conservation of the inland water fish communities in Israel. Biol. Conserv. 89, 1–9. doi: 10.1111/j.1439-0426.2005.00674.x
Hajibabaei, M., Singer, G. A., Hebert, P. D., and Hickey, D. A. (2007). DNA barcoding: How it complements taxonomy, molecular phylogenetics and population genetics. Trends Genet. 23, 167–172. doi: 10.1016/S0006-3207(98)00127-X
Hebert, P. D., Braukmann, T. W., Prosser, S. W., Ratnasingham, S., DeWaard, J. R., Ivanova, N. V., et al. (2018). A Sequel to Sanger: Amplicon sequencing that scales. BMC Genomics 19:219. doi: 10.1016/j.tig.2007.02.001
Hebert, P. D., Cywinska, A., Ball, S. L., and Dewaard, J. R. (2003). Biological identifications through DNA barcodes. Proc. R. Soc. Lond. B Biol. Sci. 270, 313–321. doi: 10.1186/s12864-018-4611-3
Ko, H.-L., Wang, Y.-T., Chiu, T.-S., Lee, M.-A., Leu, M.-Y., Chang, K.-Z., et al. (2013). Evaluating the accuracy of morphological identification of larval fishes by applying DNA barcoding. PLoS One 8:e53451. doi: 10.1098/rspb.2002.2218
Kress, W. J., García-Robledo, C., Uriarte, M., and Erickson, D. L. (2015). DNA barcodes for ecology, evolution, and conservation. Trends Ecol. Evol. 30, 25–35. doi: 10.1371/journal.pone.0053451
Kumar, S., Stecher, G., and Tamura, K. (2016). MEGA7: Molecular evolutionary genetics analysis version 7.0 for bigger datasets. Mol. Biol. Evol. 33, 1870–1874. doi: 10.1016/j.tree.2014.10.008
Liew, M., Pryor, R., Palais, R., Meadows, C., Erali, M., Lyon, E., et al. (2004). Genotyping of single-nucleotide polymorphisms by high-resolution melting of small amplicons. Clin. Chem. 50, 1156–1164. doi: 10.1093/molbev/msw054
Madesis, P., Ganopoulos, I., Anagnostis, A., and Tsaftaris, A. (2012). The application of Bar-HRM (Barcode DNA-High Resolution Melting) analysis for authenticity testing and quantitative detection of bean crops (Leguminosae) without prior DNA purification. Food Control 25, 576–582. doi: 10.1373/clinchem.2004.032136
Maralit, B. A., Aguila, R. D., Ventolero, M. F. H., Perez, S. K. L., Willette, D. A., and Santos, M. D. (2013). Detection of mislabeled commercial fishery by-products in the Philippines using DNA barcodes and its implications to food traceability and safety. Food Control 33, 119–125. doi: 10.1016/j.foodcont.2011.11.034
Markel, D., Shamir, U., and Green, P. (2014). “Operational management of Lake Kinneret and its watershed,” in Lake kinneret, eds T. Zohary, A. Sukenik, T. Berman, and A. Nishri (Dordrecht: Springer), 541–560. doi: 10.1016/j.foodcont.2013.02.018
Martínez, G., Shaw, E. M., Carrillo, M., and Zanuy, S. (1998). Protein salting-out method applied to genomic DNA isolation from fish whole blood. Biotechniques 24, 238–239. doi: 10.1007/978-94-017-8944-8_31
McGlauflin, M. T., Smith, M. J., Wang, J. T., Young, S. F., Chen, N., Lee, Y. C., et al. (2010). High-resolution melting analysis for the discovery of novel single-nucleotide polymorphisms in rainbow and cutthroat trout for species identification. Trans. Am. Fish. Soc. 139, 676–684. doi: 10.2144/98242bm14
Nyingi, W. D., Agnèse, J.-F., Ford, A. G., Day, J. J., Ndiwa, T. C., Turner, G. F., et al. (2021). “Identifying and conserving tilapiine cichlid species in the twenty-first century,” in The behavior, ecology and evolution of cichlid fishes, Vol. 40, eds M. E. Abate and D. L. Noakes (Dordrecht: Springer), 285–312. doi: 10.1577/T09-103.1
Ostrovsky, I., Goren, M., Shapiro, J., Snovsky, G., and Rynskiy, A. (2014a). “Fish biology and ecology,” in Lake kinneret, eds T. Zohary, A. Sukenik, T. Berman, and A. Nishri (Dordrecht: Springer), 273–292. doi: 10.1007/978-94-024-2080-7_9
Ostrovsky, I., Zohary, T., Shapiro, J., Snovsky, G., and Markel, D. (2014b). “Fisheries management,” in Lake kinneret: Ecology and management, eds T. Zohary, A. Sukenik, T. Berman, and A. Nishri (Heidelberg: Springer), 635–653.
Pont, D., Rocle, M., Valentini, A., Civade, R., Jean, P., Maire, A., et al. (2018). Environmental DNA reveals quantitative patterns of fish biodiversity in large rivers despite its downstream transportation. Sci. Rep. 8:10361. doi: 10.1007/978-94-017-8944-8_36
Ratnasingham, S., and Hebert, P. D. (2007). BOLD: The barcode of life data system (http://www.barcodinglife.org). Mol. Ecol. Notes 7, 355–364. doi: 10.1038/s41598-018-28424-8
Reid, A. J., Carlson, A. K., Creed, I. F., Eliason, E. J., Gell, P. A., Johnson, P. T., et al. (2019). Emerging threats and persistent conservation challenges for freshwater biodiversity. Biol. Rev. 94, 849–873. doi: 10.1111/j.1471-8286.2007.01678.x
Ririe, K. M., Rasmussen, R. P., and Wittwer, C. T. (1997). Product differentiation by analysis of DNA melting curves during the polymerase chain reaction. Anal. Biochem. 245, 154–160. doi: 10.1111/brv.12480
Sala, O. E., Chapin, F. S., Armesto, J. J., Berlow, E., Bloomfield, J., Dirzo, R., et al. (2000). Global biodiversity scenarios for the year 2100. Science 287, 1770–1774. doi: 10.1006/abio.1996.9916
Serruya, C. (1978). Lake kinneret. Berlin: Springer Science & Business Media. doi: 10.1126/science.287.5459.1770
Shefler, D. (1987). Some observations on the fish nurseries along the lake Kinneret shores: The interrelationships between species, and the influence of environmental factors. J. Appl. Ichthyol. 3, 105–116. doi: 10.1007/978-94-009-9954-1
Sternberg, M., Gabay, O., Angel, D., Barneah, O., Gafny, S., Gasith, A., et al. (2015). Impacts of climate change on biodiversity in Israel: An expert assessment approach. Reg. Environ. Change 15, 895–906. doi: 10.1111/j.1439-0426.1987.tb00461.x
Taberlet, P., Coissac, E., Pompanon, F., Brochmann, C., and Willerslev, E. (2012). Towards next-generation biodiversity assessment using DNA metabarcoding. Mol. Ecol. 21, 2045–2050. doi: 10.1007/s10113-014-0675-z
Tadmor-Levi, R., Borovski, T., Marcos-Hadad, E., Shapiro, J., Hulata, G., Golani, D., et al. (2022). Establishing and using a genetic database for resolving identification of fish species in the Sea of Galilee, Israel. PLoS One 17:e0267021. doi: 10.1111/j.1365-294X.2012.05470.x
Tomás, C., Ferreira, I., and Faria, M. (2017). Codfish authentication by a fast short amplicon high resolution melting analysis (SA-HRMA) method. Food Control 71, 255–263. doi: 10.1371/journal.pone.0267021
Trewavas, E. (1983). Tilapiine fishes of the genera sarotherodon, oreochromis and danakilia. London: British Museum. doi: 10.1016/j.foodcont.2016.07.004
Ushio, M., Murakami, H., Masuda, R., Sado, T., Miya, M., Sakurai, S., et al. (2018). Quantitative monitoring of multispecies fish environmental DNA using high-throughput sequencing. Metabarcoding Metagenom. 2:e23297. doi: 10.5962/bhl.title.123198
Valentini, A., Pompanon, F., and Taberlet, P. (2009). DNA barcoding for ecologists. Trends Ecol. Evol. 24, 110–117. doi: 10.1101/113472
Vörösmarty, C. J., McIntyre, P. B., Gessner, M. O., Dudgeon, D., Prusevich, A., Green, P., et al. (2010). Global threats to human water security and river biodiversity. Nature 467, 555–561. doi: 10.1016/j.tree.2008.09.011
Walline, P. D., Pisanty, S., and Lindem, T. (1992). Acoustic assessment of the number of pelagic fish in Lake Kinneret, Israel. Hydrobiologia 231, 153–163. doi: 10.1038/nature09440
Ward, R. D., Hanner, R., and Hebert, P. D. (2009). The campaign to DNA barcode all fishes, FISH-BOL. J. Fish Biol. 74, 329–356. doi: 10.1007/BF00018199
Weigand, H., Beermann, A. J., Èiampor, F., Costa, F. O., Csabai, Z., Duarte, S., et al. (2019). DNA barcode reference libraries for the monitoring of aquatic biota in Europe: Gap-analysis and recommendations for future work. Sci. Total Environ. 678, 499–524. doi: 10.1111/j.1095-8649.2008.02080.x
Wittwer, C. T., Reed, G. H., Gundry, C. N., Vandersteen, J. G., and Pryor, R. J. (2003). High-resolution genotyping by amplicon melting analysis using LCGreen. Clin. Chem. 49, 853–860. doi: 10.1016/j.scitotenv.2019.04.247
Zohary, T., and Gasith, A. (2014). “The littoral zone,” in Lake kinneret, ecology and management, eds T. Zohary, A. Sukeni, T. Berman, and A. Nishri (Dordrecht: Springer), 517–532. doi: 10.1373/49.6.853
Zohary, T., Gasith, A., Markel, D., and Ostrovsky, I. (2008). The collapse of the Saint Peter’s fish fishery in Lake Kinneret. Fish. Fishbreed. Israel 39, 1214–1224. doi: 10.1007/978-94-017-8944-8_29
Zohary, T., and Ostrovsky, I. (2011). Ecological impacts of excessive water level fluctuations in stratified freshwater lakes. Inland Waters 1, 47–59.
Keywords: Bar-HRM, Sea of Galilee, tilapia, COI, DNA barcoding, freshwater fish ecology
Citation: Tadmor-Levi R, Cummings D, Borovski T, Shapira R, Marcos-Hadad E and David L (2022) A method for quick and efficient identification of cichlid species by high resolution DNA melting analysis of minibarcodes. Front. Ecol. Evol. 10:1010838. doi: 10.3389/fevo.2022.1010838
Received: 03 August 2022; Accepted: 25 August 2022;
Published: 15 September 2022.
Edited by:
Rodney L. Honeycutt, Pepperdine University, United StatesReviewed by:
Dianrong Sun, South China Sea Fisheries Research Institute (CAFS), ChinaJarrett D. Phillips, University of Guelph, Canada
Copyright © 2022 Tadmor-Levi, Cummings, Borovski, Shapira, Marcos-Hadad and David. This is an open-access article distributed under the terms of the Creative Commons Attribution License (CC BY). The use, distribution or reproduction in other forums is permitted, provided the original author(s) and the copyright owner(s) are credited and that the original publication in this journal is cited, in accordance with accepted academic practice. No use, distribution or reproduction is permitted which does not comply with these terms.
*Correspondence: Lior David, bGlvci5kYXZpZEBtYWlsLmh1amkuYWMuaWw=
†Deceased