 David J. A. Wood
 Paul C. Stoy
 Scott L. Powell2
 Erik A. Beever
- 1U.S. Geological Survey, Northern Rocky Mountain Science Center, Bozeman, MT, United States
- 2Department of Land Resources and Environmental Sciences, Montana State University, Bozeman, MT, United States
- 3Department of Biological Systems Engineering, University of Wisconsin–Madison, Madison, WI, United States
- 4Department of Ecology, Montana State University, Bozeman, MT, United States
Ecological processes are complex, often exhibiting non-linear, interactive, or hierarchical relationships. Furthermore, models identifying drivers of phenology are constrained by uncertainty regarding predictors, interactions across scales, and legacy impacts of prior climate conditions. Nonetheless, measuring and modeling ecosystem processes such as phenology remains critical for management of ecological systems and the social systems they support. We used random forest models to assess which combination of climate, location, edaphic, vegetation composition, and disturbance variables best predict several phenological responses in three dominant land cover types in the U.S. Northwestern Great Plains (NWP). We derived phenological measures from the 25-year series of AVHRR satellite data and characterized climatic predictors (i.e., multiple moisture and/or temperature based variables) over seasonal and annual timeframes within the current year and up to 4 years prior. We found that antecedent conditions, from seasons to years before the current, were strongly associated with phenological measures, apparently mediating the responses of communities to current-year conditions. For example, at least one measure of antecedent-moisture availability [precipitation or vapor pressure deficit (VPD)] over multiple years was a key predictor of all productivity measures. Variables including longer-term lags or prior year sums, such as multi-year-cumulative moisture conditions of maximum VPD, were top predictors for start of season. Productivity measures were also associated with contextual variables such as soil characteristics and vegetation composition. Phenology is a key process that profoundly affects organism-environment relationships, spatio-temporal patterns in ecosystem structure and function, and other ecosystem dynamics. Phenology, however, is complex, and is mediated by lagged effects, interactions, and a diversity of potential drivers; nonetheless, the incorporation of antecedent conditions and contextual variables can improve models of phenology.
Introduction
The modeling and management of ecosystems are challenged by the hierarchical, non-linear, scale- and context-dependent, and complex dynamics found in the system’s processes and functions (Scholes, 2017; Newman et al., 2019; Park et al., 2021). For example, ecological services and ecosystem function are tightly intertwined with phenology, the timing and magnitude of seasonal events (Morisette et al., 2009; Richardson et al., 2013). Predicting the consequences of climate change and management of ecosystems requires accurate predictions of phenology to avoid unintended consequences to human health, agriculture, and biodiversity, as well as impacts to and interactions with other species in the system (Stevenson et al., 2015; Renner and Zohner, 2018; Beard et al., 2019). However, variations in phenological dates and the magnitude of ecosystem response to climate can be influenced by multiple factors, making predictions of phenological measures across space and time complex (e.g., de Jong et al., 2011; Zhang et al., 2017; Piao et al., 2019; Zhang Q. et al., 2019; Zhang X. et al., 2019; Felton et al., 2021; Park et al., 2021). Therefore, to understand ecological systems and their phenology, it is necessary to disentangle the non-linear and interactive effects of climate drivers, which may vary across different soil and vegetation types.
Satellite-based, remote-sensing measurements of vegetation cycles, which provide insights into land-surface phenology, are useful for quantifying the seasonality (e.g., start of season, end of season, and productivity) of the land cover of a remotely sensed pixel and its responses to different climate drivers (Morisette et al., 2009; Hanes et al., 2014; Chen et al., 2020). However, the spatially heterogeneous nature of many systems (e.g., within a pixel) may lead to unexpected responses, or signals dominated by dynamics of a subset of the land cover (Zhang et al., 2017; Park et al., 2021). In addition, the identified and proposed drivers of land-surface phenology are numerous, which complicates modeling and prediction. For example, whereas temperature is the dominant driver of vegetation productivity at global scales, precipitation has been shown to be a larger driver of the variation in productivity at local and regional scales (Jung et al., 2017). At a regional level, vapor pressure deficit (VPD) during mid to late summer (July and August) was a better predictor of productivity across the U.S. Northern Great Plains (Konings et al., 2017) than either temperature or precipitation alone. Globally, increased VPD has constrained increases in productivity (Yuan et al., 2019), and is an important driver of stomatal conductance and plant responses (Konings and Gentine, 2017; Konings et al., 2017; Zhang Q. et al., 2019; Fu et al., 2022). The factors that most strongly govern phenological aspects vary across space, and among different vegetation communities (Xia et al., 2015; Fu et al., 2017; Maurer et al., 2020; Wood et al., 2021). Furthermore, climatic controls on phenology are complex, may interact, and can be non-linear (Ponce-Campos et al., 2013; Knapp et al., 2015; Al-Yaari et al., 2020; Gao et al., 2020; Maurer et al., 2020), and ecosystems may respond to far more than just current conditions as they develop.
Phenological measures often respond to conditions both prior to and during the growing season (Bianchi et al., 2019; Liu et al., 2019; Ren et al., 2020). The length of the lag or legacy effect can be relatively short or can extend to multiple years through mechanisms including energy storage, resource allocation (e.g., fecundity/inclusive fitness), and community-level structural and compositional change (Sala et al., 2012; Ogle et al., 2015; Bandieri et al., 2020). For example, in some land-cover types, predictions of current-year productivity can be improved by including precipitation from the prior year (Webb et al., 1978; Oesterheld et al., 2001; Ogle et al., 2015). Legacy effects are stronger in some community types than others, perhaps due to different phenological strategies and rooting depths (Yahdjian and Sala, 2006; Reichmann et al., 2013; Liu et al., 2019) or differential adaptation to pulse dynamics (Felton et al., 2019). The strength of influence can reflect the intensity of the legacy conditions (Yahdjian and Sala, 2006; Felton et al., 2019), e.g., the magnitude of prior drought. Among phenological phenomena, legacy effects are commonly assessed by including conditions from both the current and prior year in models, and are primarily studied for season-long productivity; however, impacts from legacy factors, such as within-community compositional changes and plant strategies (e.g., root:shoot allocation, and critical periods for reproduction) may also influence phenological timing. Therefore, an assessment of legacy impacts on date-based phenological measures remains a research frontier.
The U.S. Northwestern Great Plains (NWP) constitute an excellent region to study phenology, given that they contain a wide range of values for abiotic and biotic factors including climate, vegetation communities, and soils (USDA Natural Resources Conservation Service, 2006). For example, the area has large variability in productivity across years (Petrie et al., 2016); is experiencing changing seasonality (Ren et al., 2020); and has spatial and land cover variability in phenological drivers (Wood et al., 2021). The region also has experienced unique changes to climate in the last few decades (Bromley et al., 2020), and has ongoing land-use changes (Auch et al., 2011; Stoy et al., 2018). Disagreements regarding predictions of future productivity and composition, as well as unknowns about the drivers of phenology across the NWP (Reeves et al., 2014; Ficklin and Novick, 2017; Wonkka et al., 2019) indicate that improved models can help reduce uncertainty.
We sought to improve phenological interpretation by more precisely identifying the key drivers and temporal windows of phenological events across the NWP. To most effectively highlight abiotic and biotic drivers of phenology, our study builds on prior work by explicitly including lagged climate drivers in analyzing the year-to-year variability of phenology of the NWP, and by exploring the influences of highly correlated variables and non-linear dynamics. We specifically sought to compare relative influences of hypothesized climate drivers of land-surface phenology such as temperature, precipitation, growing-degree days, and VPD over current and prior time periods while also incorporating indices of location, soils, disturbance, and land-cover heterogeneity as additional predictors. Our objectives are to (1) examine multiple potential drivers of phenological measures across each of several land cover types to better understand the relative roles of climate, soils, and pixel composition; (2) determine the role of legacy effects across land cover types and phenological measures; and (3) identify relationships, interactions, thresholds, and non-linear responses among key variables.
Materials and methods
Study area
Our study area matches prior work on phenological measures in the NWP (Wood et al., 2021). In brief, the area (Figure 1) includes the U.S. portions of the Northwestern Great and Glaciated Plains Level 3 ecoregions, as well as similar transitional areas from the Middle Rockies (intermontane grasslands) and Wyoming Basins (semi-arid grass-shrub ecotone) ecoregions (Omernik, 1987). Land cover in the region includes barren and shrubland systems in the west, changing to mixed-grass and tallgrass prairie farther east as annual average precipitation increases. Temperature and precipitation also covary predictably with elevation, leading to forested areas in higher elevations (e.g., along the Rocky Mountain front on the western edge, and in mountain ranges to the east including the Black Hills and Bighorn Mountains). The region includes agriculture primarily in its northern and eastern portions, and along major rivers. The lower-elevation grasslands and shrublands receive a range of 33–56 cm (study area median = 41.9 cm, standard deviation (SD) = 14.1 cm) of precipitation annually, while at higher elevations, annual precipitation can exceed 160 cm (USDA Natural Resources Conservation Service, 2006; Daly et al., 2008; PRISM Climate Group, 2021). Mean monthly temperatures over the periods of 1991–2020 were predominantly below freezing in winter months and warm in summer months, ranging from a median over the 30-year period of −6.4°C (SD = 2.7°C) in January to 21.2°C (SD = 2.6°C) in July (Daly et al., 2008; PRISM Climate Group, 2021).
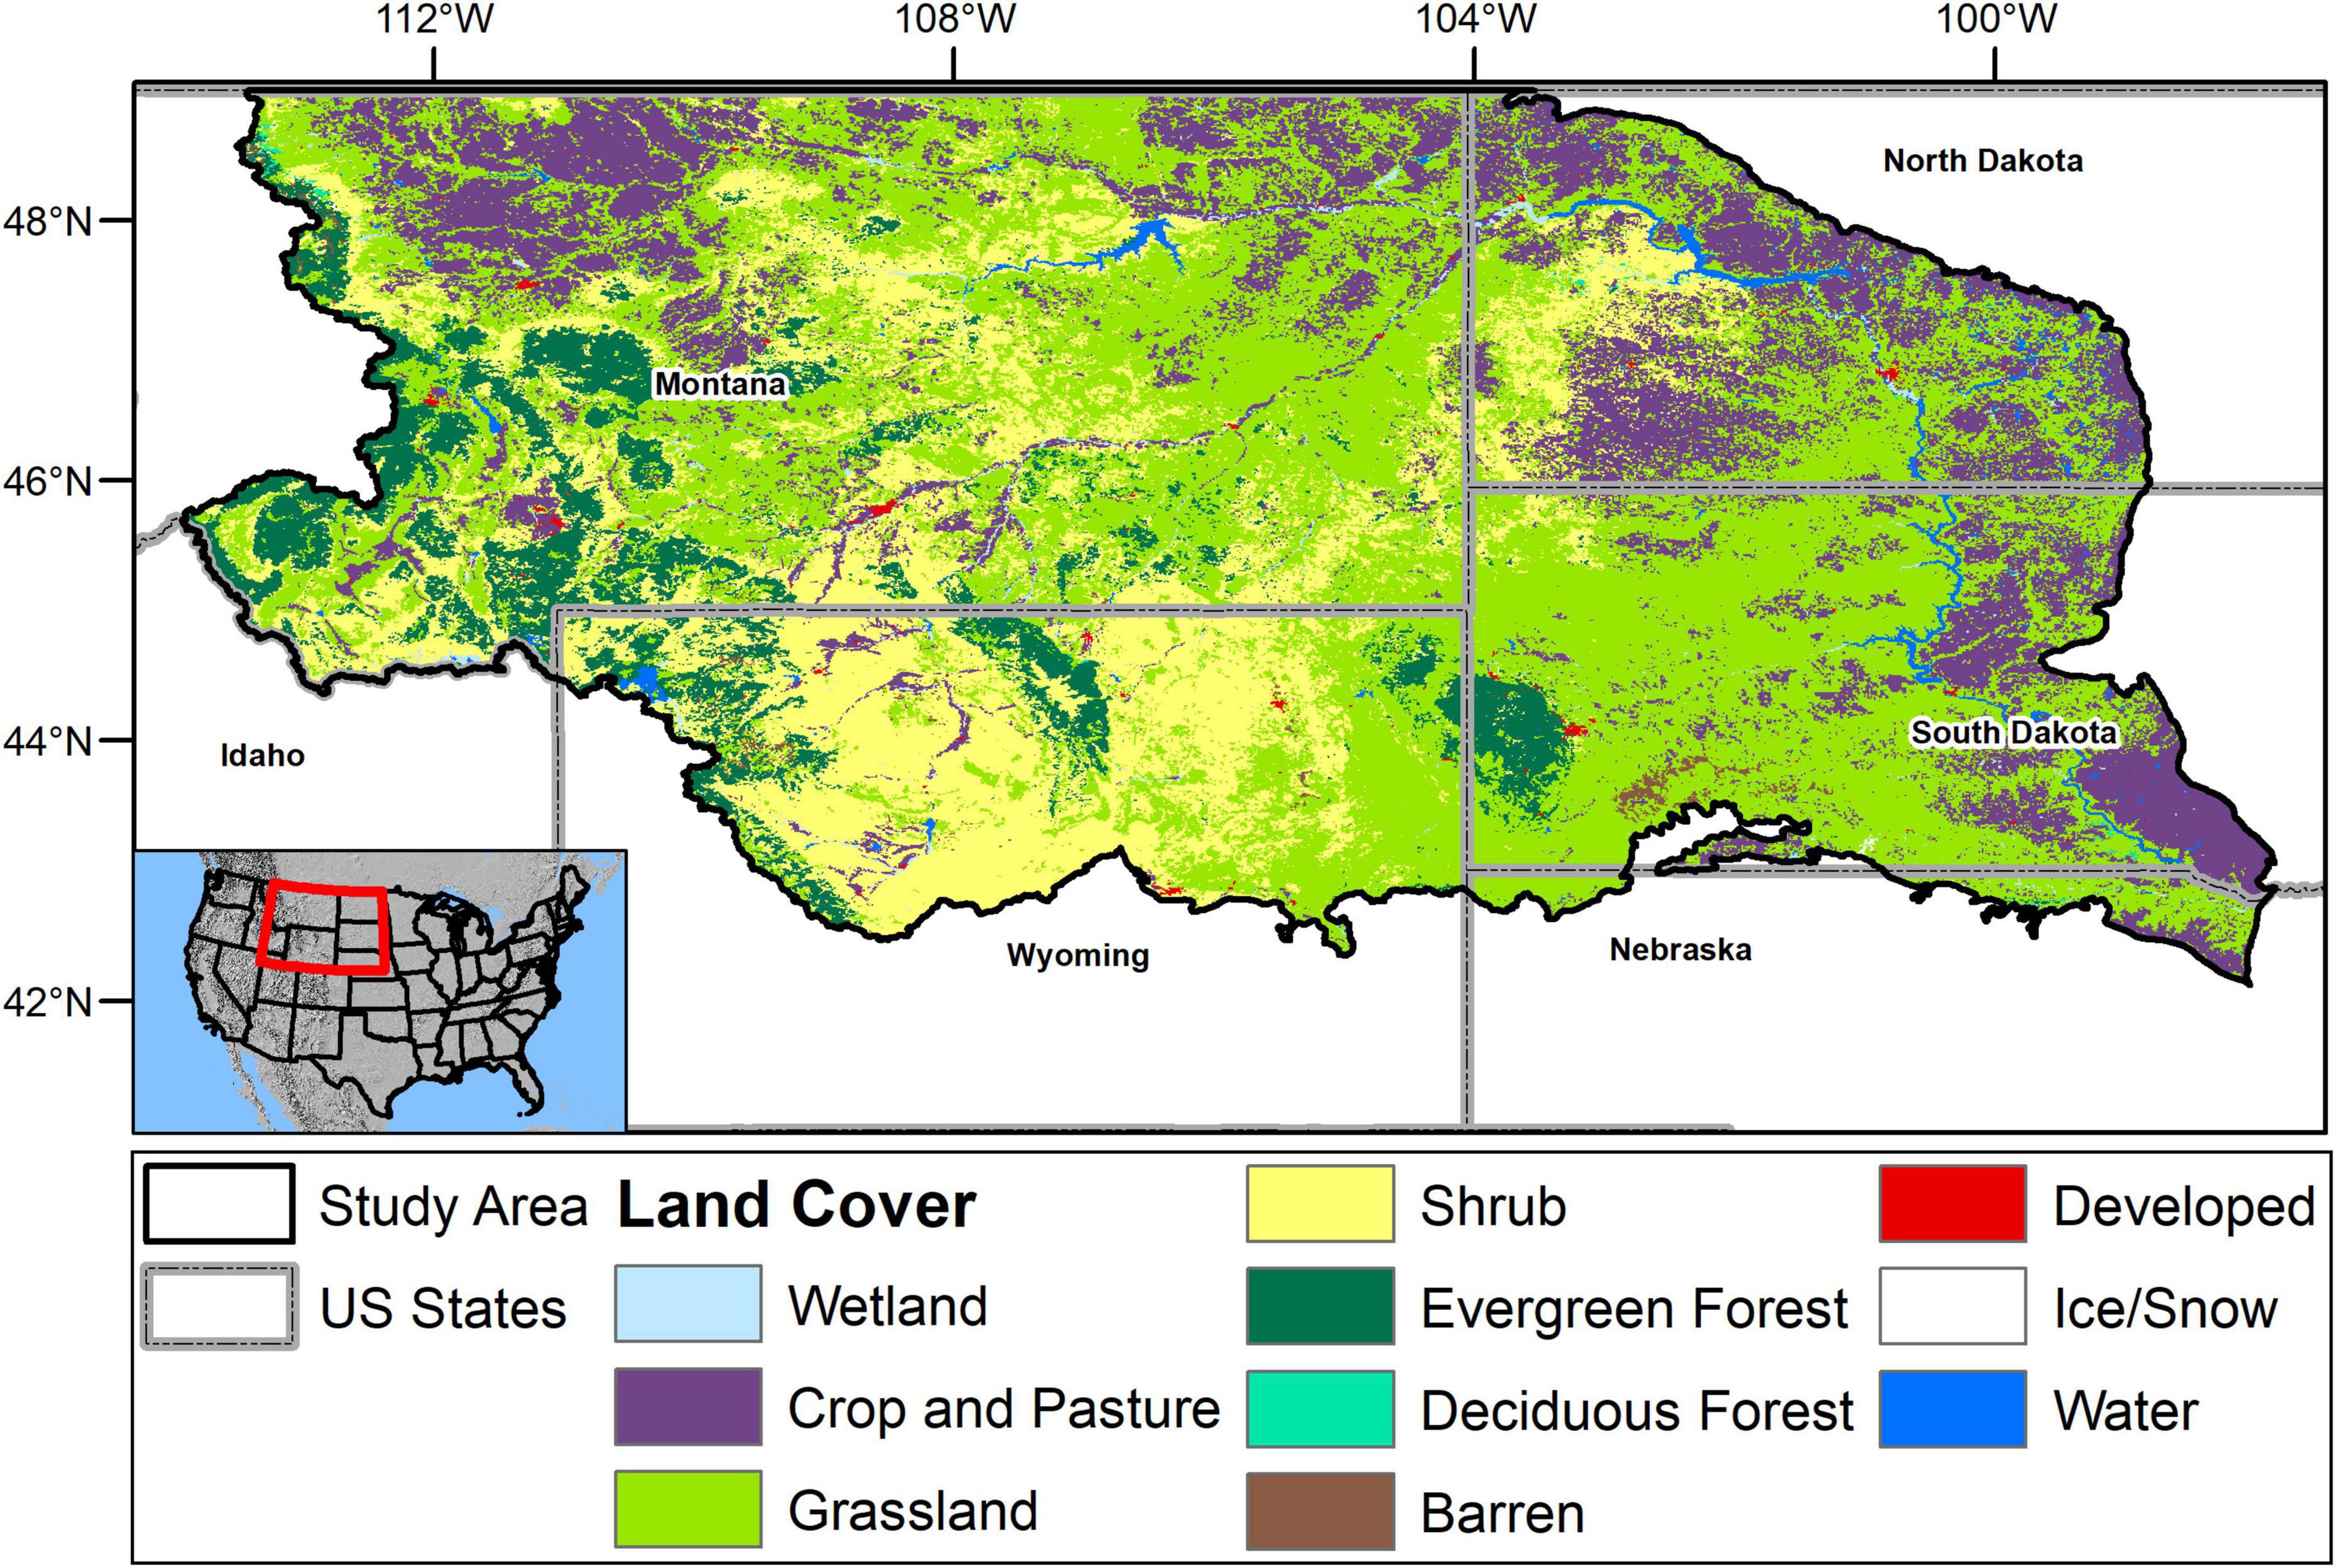
Figure 1. The U.S. Northwestern Plains, as defined by Level 3 Ecoregions (Omernik, 1987) and land cover from 2013 as mapped in the National Land Cover Database (Wickham et al., 2014). The study area includes the Northwestern Great and Glaciated Plains (Level 3) Ecoregions, plus portions of the Wyoming Basins and Middle Rocky Mountains.
Data collection
Phenological data come from a 25-year dataset derived from the Advanced Very High Resolution Radiometer (AVHRR) satellite covering the years 1989–2014 (USGS EROS, 2015). The USGS approach to process AVHRR data used normalized difference vegetation index (NDVI) composites of daily, 1-km-resolution values, smoothed the time series, and then identified phenological measures using a delayed moving-average algorithm (Reed et al., 1994; Swets, 1999; Eidenshink, 2006). We followed data-selection and preparation procedures from Wood et al. (2021). In brief, due to orbital degradation at the end of life for several of the remote-sensing platforms carrying the AVHHR sensor, we removed data from 1992, 1993, 1994, 1999, and 2002 to minimize any concerns from correlations between the solar zenith angle and phenological measures (Ji and Brown, 2017). We selected three phenological measures, including the start of the growing season, maximum NDVI (a surrogate for vegetation productivity at the peak of the growing season; hereafter, peak productivity), and time-integrated NDVI (a surrogate for vegetative productivity across the entire growing season; hereafter, season-long productivity).
We selected possible independent variables from prior phenological studies and then identified datasets to characterize values or factors. Our predictors (see Supplementary Table 1 for a full list) included land cover type defined by the National Land Cover database (Wickham et al., 2014; Yang et al., 2018), similar ecological location as defined by major land resource area or watershed using the 4th level hydrologic unit code (MLRA, HUC; Seaber et al., 1987; USDA Natural Resources Conservation Service, 2006), soil characteristics derived from SSURGO (Soil Survey Staff, 2017), and fire perimeters (Welty et al., 2017). Soil and location data did not vary through time; they were held constant for each pixel. However, land cover type/composition and fire (if a pixel fell within a recorded fire perimeter or not) were calculated for each year or through time, or as available for land cover. The 2016 National Land Cover Database is a Landsat-based classification of cover at 30-m resolution for the U.S. for 2001, 2004, 2006, 2008, 2011, 2013, and 2016. There are sixteen classes, including water/ice, urban/developed, agricultural, and natural land-cover classes. We combined the four urban and the two wetland classes together, as they are not the focus of our study in the largely semi-arid and rural NWP (Stoy et al., 2018). We also combined pasture and crop together as managed land cover types. We then aggregated 30-m pixels to identify the primary (modal) land-cover class and the proportion of each classification within each 1-km AVHRR pixel for each year in the land-cover database. If available, we used the land-cover classification for the current year, and if unavailable, we used data from 2001 or the most recent prior year to produce primary and proportional land cover layers for each year of the study period. Our analysis focused on pixels where shrub, grassland, and evergreen forests were the primary land cover type, and we included the proportion of 8 possible within pixel land-cover types (barren, deciduous forest, evergreen forest, shrub, grassland, urban, wetland, and agriculture) as predictors of phenological events in our analyses.
Climate variables included annual, water-year, and seasonal time periods from the current and prior years (i.e., a 1-, 2-, 3-, or 4-year lag). We included precipitation, temperature, VPD, and growing degree-days from the Parameter-elevation Relationships on Independent Slopes Model (PRISM) data, version AN81d (∼800-m resolution; Daly et al., 2008). We aggregated these daily data into specific time periods (Supplementary Table 1), taking the mean for daily mean temperature, VPD maximum (VPDmax), and VPD minimum (VPDmin) over 3-month periods (seasons: winter, January–March; spring, April–June; summer, July–September; and fall, October–December), a 6-month period (growing season: spring plus summer), the water year (prior fall, plus current-year winter, spring, and summer), or calendar year (current-year winter, spring, summer, and fall). To calculate precipitation, we summed daily values over the seasonal and annual time periods. We calculated growing degree-days (GDD) over the same time period using daily mean temperature with a base of 0°C:
For VPDmax, we also calculated the number of days in the calendar year in which the daily value exceeded the sum of the long-term mean plus either one- or two-times the standard deviation of the distribution for a pixel. We then created lagged variables, using data from 1, 2, 3, or 4 calendar years prior to the current year for each seasonal and yearly measure. Finally, to assess cumulative effects of weather across different durations of time, we calculated the multiyear (mean or sum) conditions of the prior 2, 3, or 4 years (i.e., not including the current year).
Data analysis
Phenological measures have uncertain drivers, along with interactions and high correlation among potential variables. Therefore, we used machine learning, namely random forests (Breiman, 2001) as a tool to broadly survey many possible drivers and reduce our collection of potential variables (Genuer et al., 2010). Advantages of machine learning over linear models include decreased sensitivity to highly correlated predictor variables, identification of complex interactions between variables, and improved performance for predictions (e.g., Cutler et al., 2007; Oliveira et al., 2012; Villoslada et al., 2020), and as a result they are increasingly used to address ecological problems (Cutler et al., 2007). Machine learning approaches have also been applied to remote sensing based studies of vegetation classification (e.g., Long et al., 2013; Jones et al., 2018) and phenology (e.g., Wessels et al., 2011; Gómez et al., 2016; Czernecki et al., 2018; Wang et al., 2021), and applications are expanding into areas traditionally approached using general linear regression modeling (e.g., Picardi et al., 2020). In addition, although random-forests analyses require subjectivity in variable selection (Cutler et al., 2007), advances in variable-selection techniques and visualization methods for impacts of included variables (Genuer et al., 2010; Hapfelmeier and Ulm, 2013) provides more rigor and improves interpretation of the potential effects of selected variables.
To prepare phenological events and potential drivers, we sampled each AVHRR pixel in ArcGIS (ESRI, Redlands, CA), and organized rows into individual records, i.e., pixel/year combinations. Each row in our dataset corresponded to 1 year at each pixel with the associated, soil, geographic, climate, and disturbance-potential variables, including antecedent climate, for a possible 262 predictor variables. We split the full dataset by land cover, using the modal land cover in the year of record (i.e., a given AVHRR pixel could be in different categories or have different sub-pixel makeups across years).
We split each dataset into a testing and training set in R 4.0.3 (R Core Team, 2020) and then used the ranger (Wright and Ziegler, 2017) implementation of random forests, within the Variable Selection Using Random Forest (VSURF) approach (Genuer et al., 2010, 2015) to analyze a three-step process for each phenology measure within each primary land cover type (see Supplementary Table 2). The three steps in VSURF are the threshold, interpretation, and prediction steps, each of which uses a different approach to select variables, as ranked by importance scores. The threshold step removes variables based on the standard deviation of mean importance scores, and the interpretation and prediction steps remove variables based on two approaches incorporating the out-of-bag error to select variables, wherein the interpretation step is meant to be inclusive, and the prediction step is intended to reduce redundancy in variables (Genuer et al., 2010). The ultimate objective is to identify variables that contribute to the dependent variable and produce a parsimonious model with good predictive ability. The final set of variables is restricted to those with meaningful improvement to model performance, therefore, all variables included in the final model are strongly associated with the given phenological measure for that land-cover type.
We then created final random-forest models with the training datasets using the variables identified from the VSURF process for each combination of land cover type and phenological measure (see Supplementary Table 2). We used the final models to predict phenological measures from the testing dataset and calculated mean square error to assess model performance. We used the variable importance scores from the final random forest models to show the rank and relative contributions of final variables in the land cover/phenological measure combinations. We then used the final model to visualize relationships between three sets of two variables using partial-dependence plots, comparing the top-ranked current-year variable to three of the final model variables from the VSURF selection process to show illustrative combinations. We use the points (x, y, and z values) generated from the partial-dependence calculation over the range of the two selected variables to create a surface for display and overlaid a contour map derived from a kernel density algorithm to show the distribution of the two-variable combination over the surface. Analyses were conducted on the USGS High Performance Computer Yeti.1 We used the R packages ranger (Wright and Ziegler, 2017), VSURF (Genuer et al., 2015), and pdp (Greenwell, 2017) for analysis and the packages akima (Akima and Gebhardt, 2020), RColorBrewer (Neuwirth, 2014), and plot3D (Soetaert, 2017) for display.
Results
Overview
The multi-step VSURF process greatly reduced the number of potential explanatory variables for each phenological measure and land cover combination while maintaining performance for most models (Table 1). Final models each included 10–16 predictors (see Table 1 and Supplementary Tables 3–5 for a full list of final variables for each land cover type). In general, overall model accuracy was higher for peak and season-long productivity (R2 of 0.74–0.90) than for start-of-season dates (R2 0.61–0.68) (Table 1). Testing error was similar to training errors in most models, indicating that the final models, produced by variable selection, generally do not overfit and do generalize well.
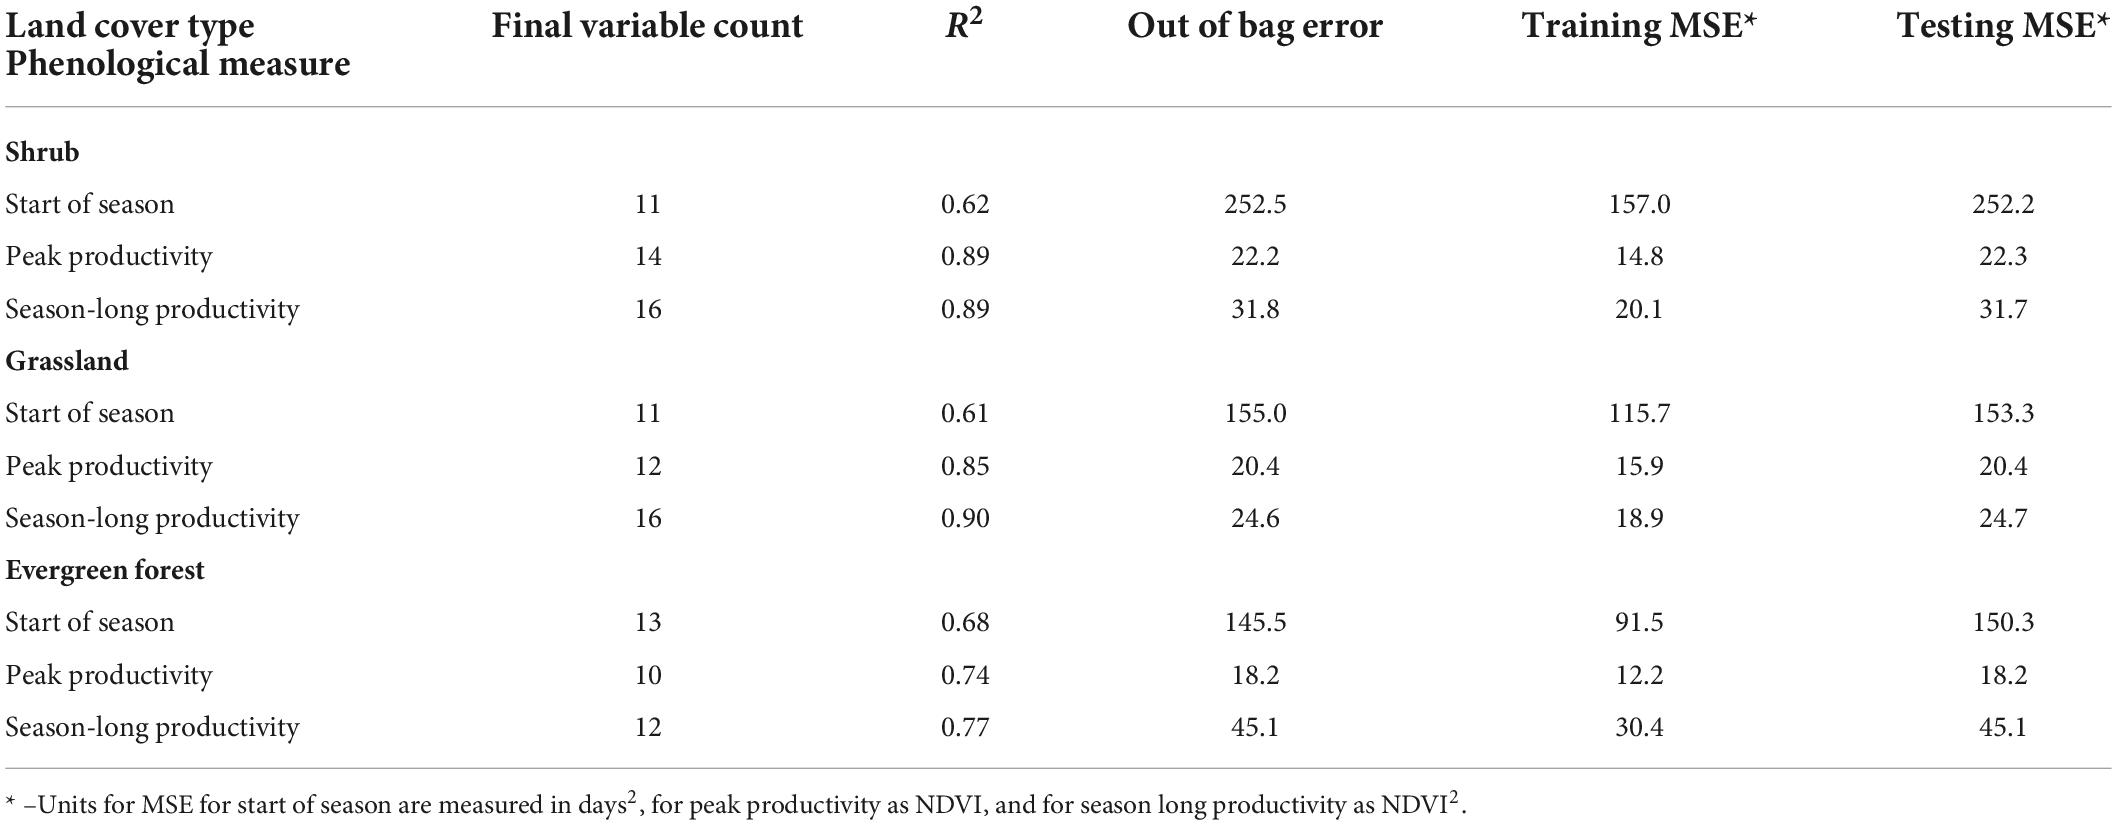
Table 1. Model performance using Random Forests analyses for identification of the most predictive climate, soil, and disturbance variables on three phenology measures, across three dominant, natural land-cover types.
Overall, we found evidence suggesting that antecedent conditions—over periods ranging from a few months to multiple years—are often associated with current-year timing and magnitude of phenological events (Figure 2 and Supplementary Tables 3–5). Interestingly, the proportion of variables in the start of season models from the prior year or water year was larger than for models of the two productivity measures. Productivity measures tended to have a split between potential drivers in the current year (including the prior fall alone or as part of a water-year time period) or variables spanning multiple years (albeit with substantial variability, across response variables). Contextualizing variables (e.g., watershed, MLRA, pixel composition, and soil characteristics) often were included in the top set of predictors (Figure 3), especially for evergreen forests, where (a) more such variables were included, and (b) contextual variables were in the final models for all three phenological measures. In addition, in comparing the two productivity measures, VPD, temperature, and GDD were more commonly found in final models with season-long productivity compared to peak productivity, for which precipitation and context tended to appear more frequently (Figure 3).
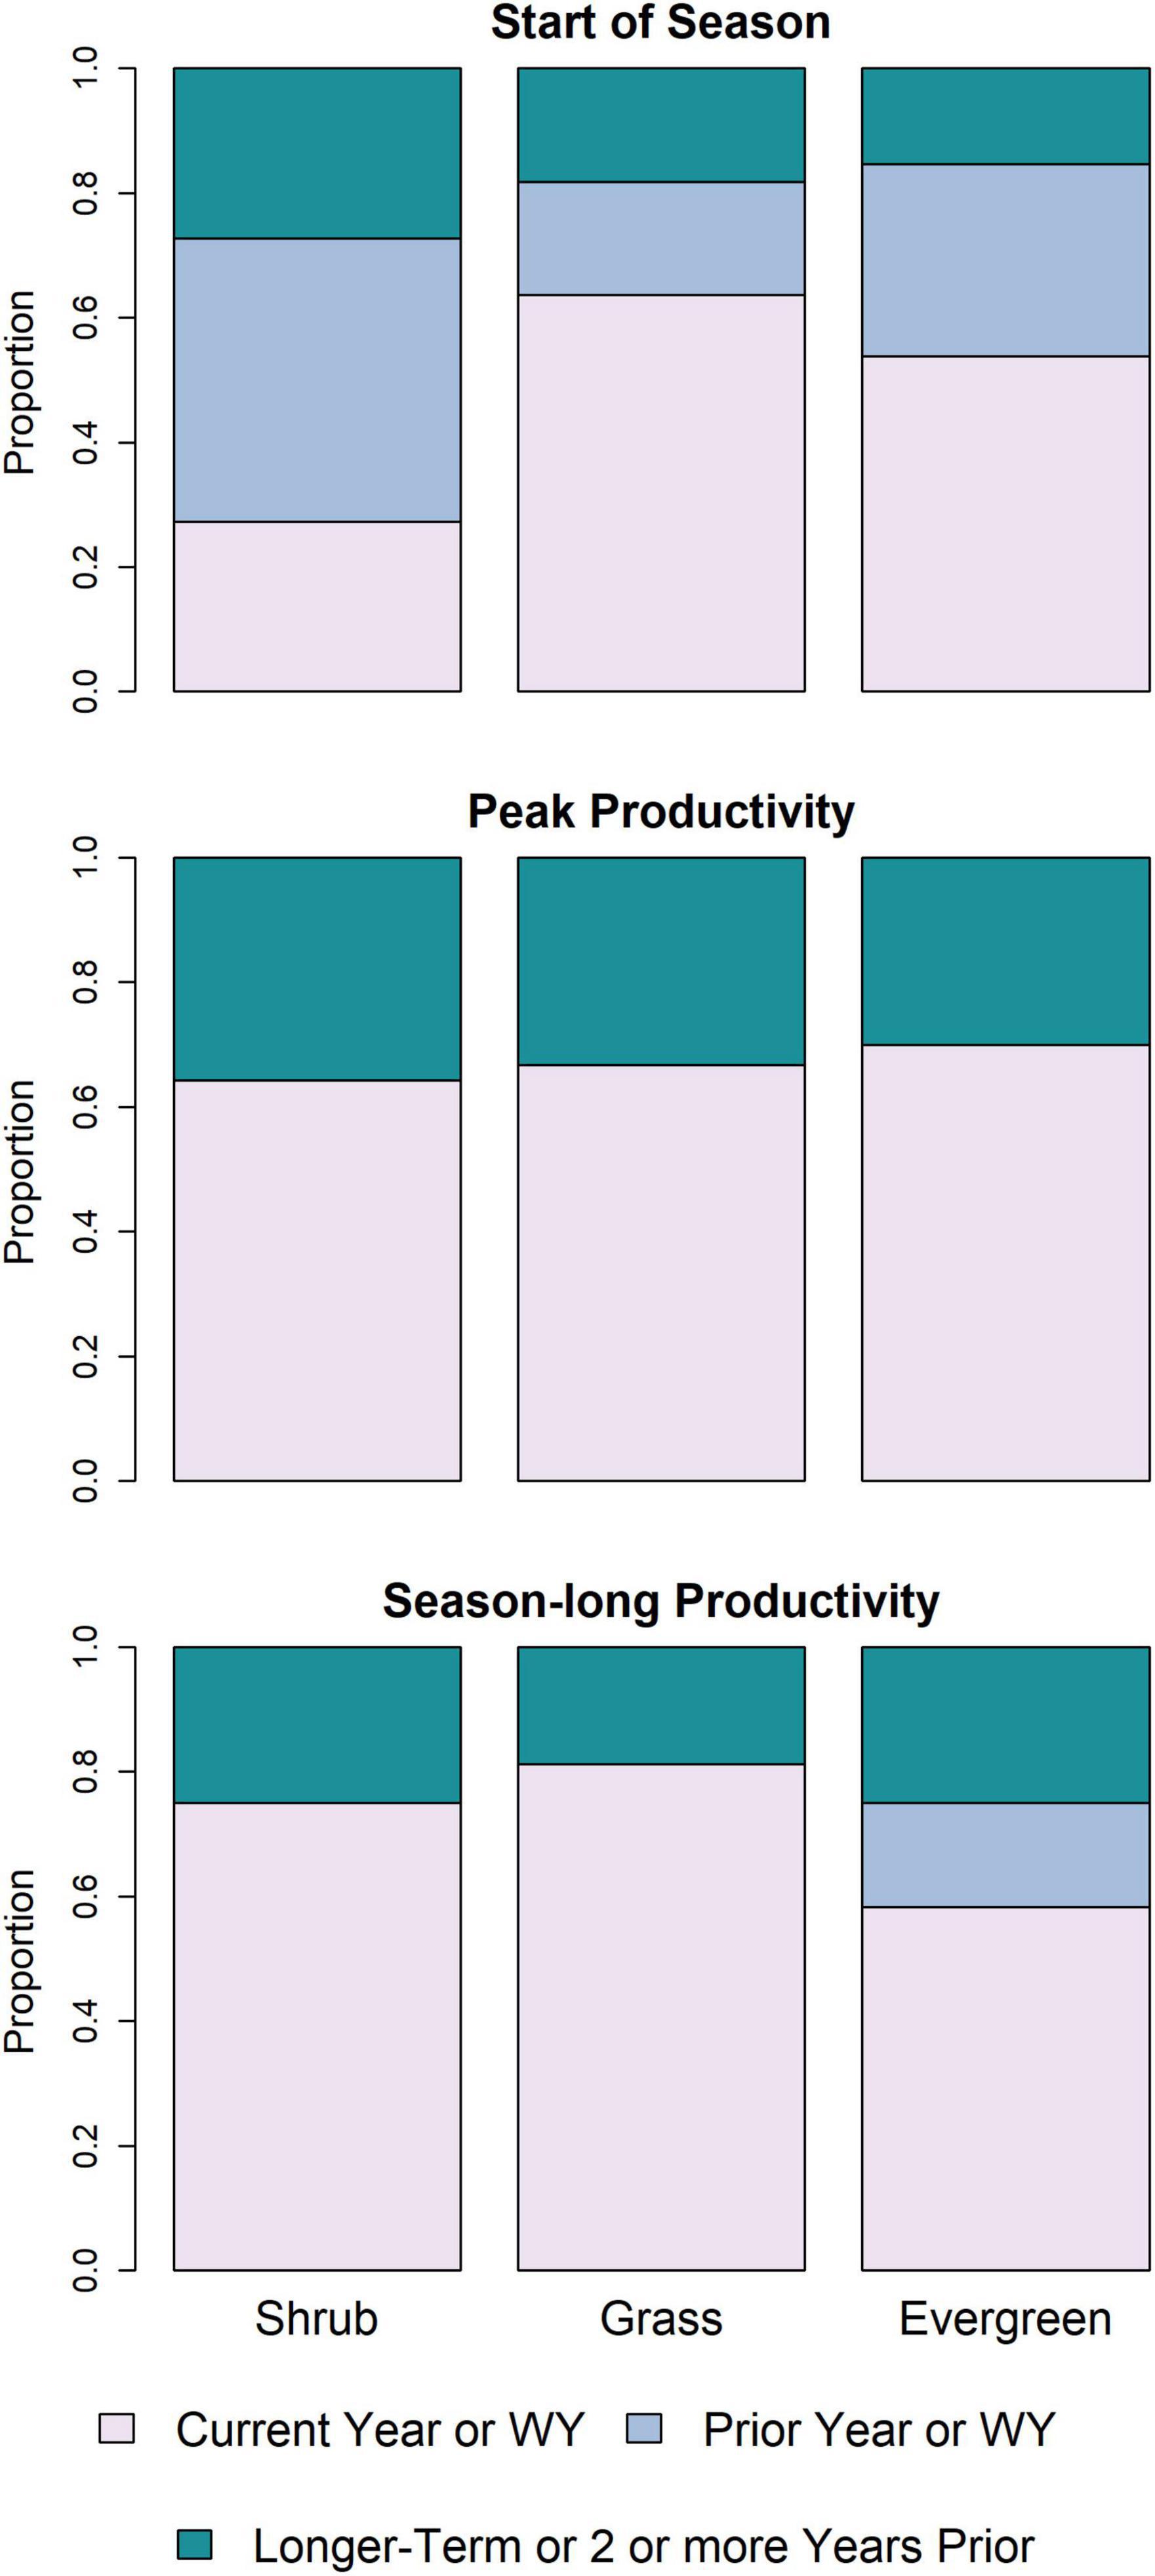
Figure 2. Stacked bar plots indicating the temporal windows of predictor variables derived from a random forest variable selection approach used to identify a set of drivers strongly associated with phenological measures for a given land cover type. The temporal periods represent current, prior, and longer-term (i.e., multiple-year variables, or years/seasons 2 or more years prior to the current year) windows. Results are presented for three phenological measure for three predominant land cover types in the U.S. Northwestern Plains. WY, Water Year; Evergreen, Evergreen Forest.
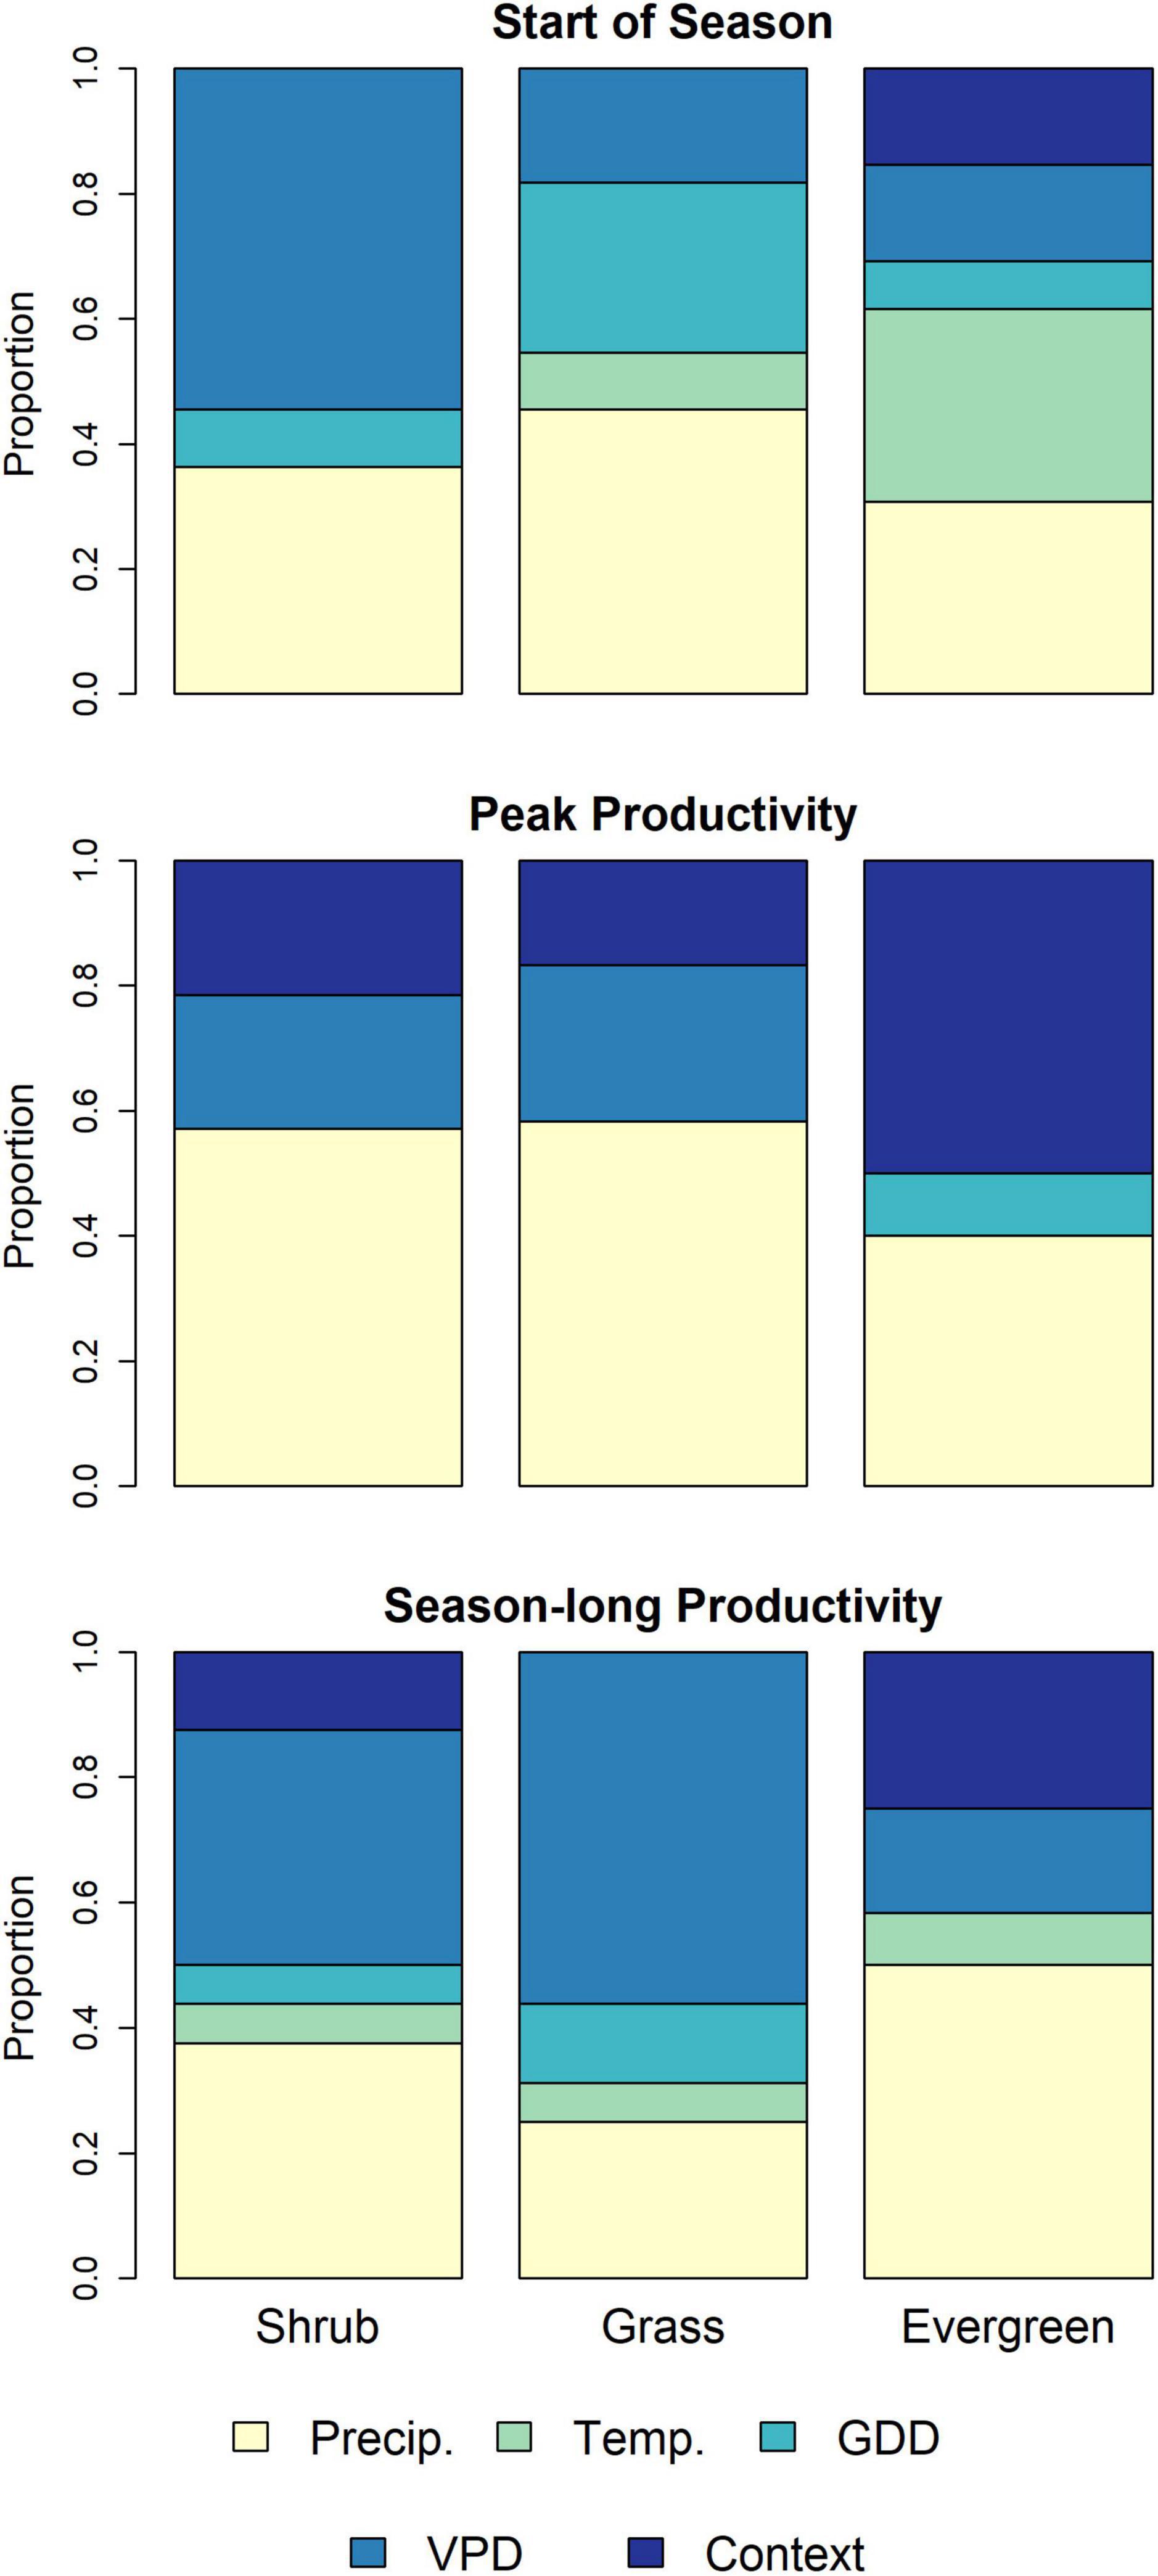
Figure 3. Stacked bar plots indicating proportions of predictor variables derived from a random forest variable selection approach used to identify a set of drivers strongly associated with phenological measures for a given land cover type. Variable types represent different climate predictors (e.g., VPD, GDD) or contextual factors (e.g., soil characteristics or location). Results are presented for three phenological measure for three predominant land cover types in the U.S. Northwestern Plains. Evergreen, Evergreen Forest; Precip, Precipitation; Temp, Temperature; GDD, Growing Degree Days; VPD, Vapor Pressure Deficit; Context, contextual variables (i.e., soil, pixel composition, and location variables).
Phenological events and antecedent conditions
Variables in the final random-forest models represent complicated dynamics including interactions and non-linear responses. We highlight some commonalities across land cover types and key findings below, using partial dependence plots to illustrate the relationships between two variables while holding all other predictors constant. For example, winter precipitation (and in some cases, also GDD) was included in the final models for the date of the start of season for shrubland (Figure 4), grassland (Figure 5), and evergreen forest land cover types (Figure 6). Across these types, very low winter precipitation tended to produce earlier starts to the growing season, but this phenomenon also was associated with conditions in the prior water year and/or fall. Specifically, higher precipitation in the fall of the prior year (i.e., 3–6 months before the growing season in the focal year) delayed the start date whereas a higher mean VPDmax in the prior water year advanced the start date in the shrub land cover type (Figure 4). In addition, variables representing longer-term climate conditions were also top predictors. For example, in shrub land cover, higher VPDmax over the prior three water years led to earlier dates for the start of season (Figure 4).
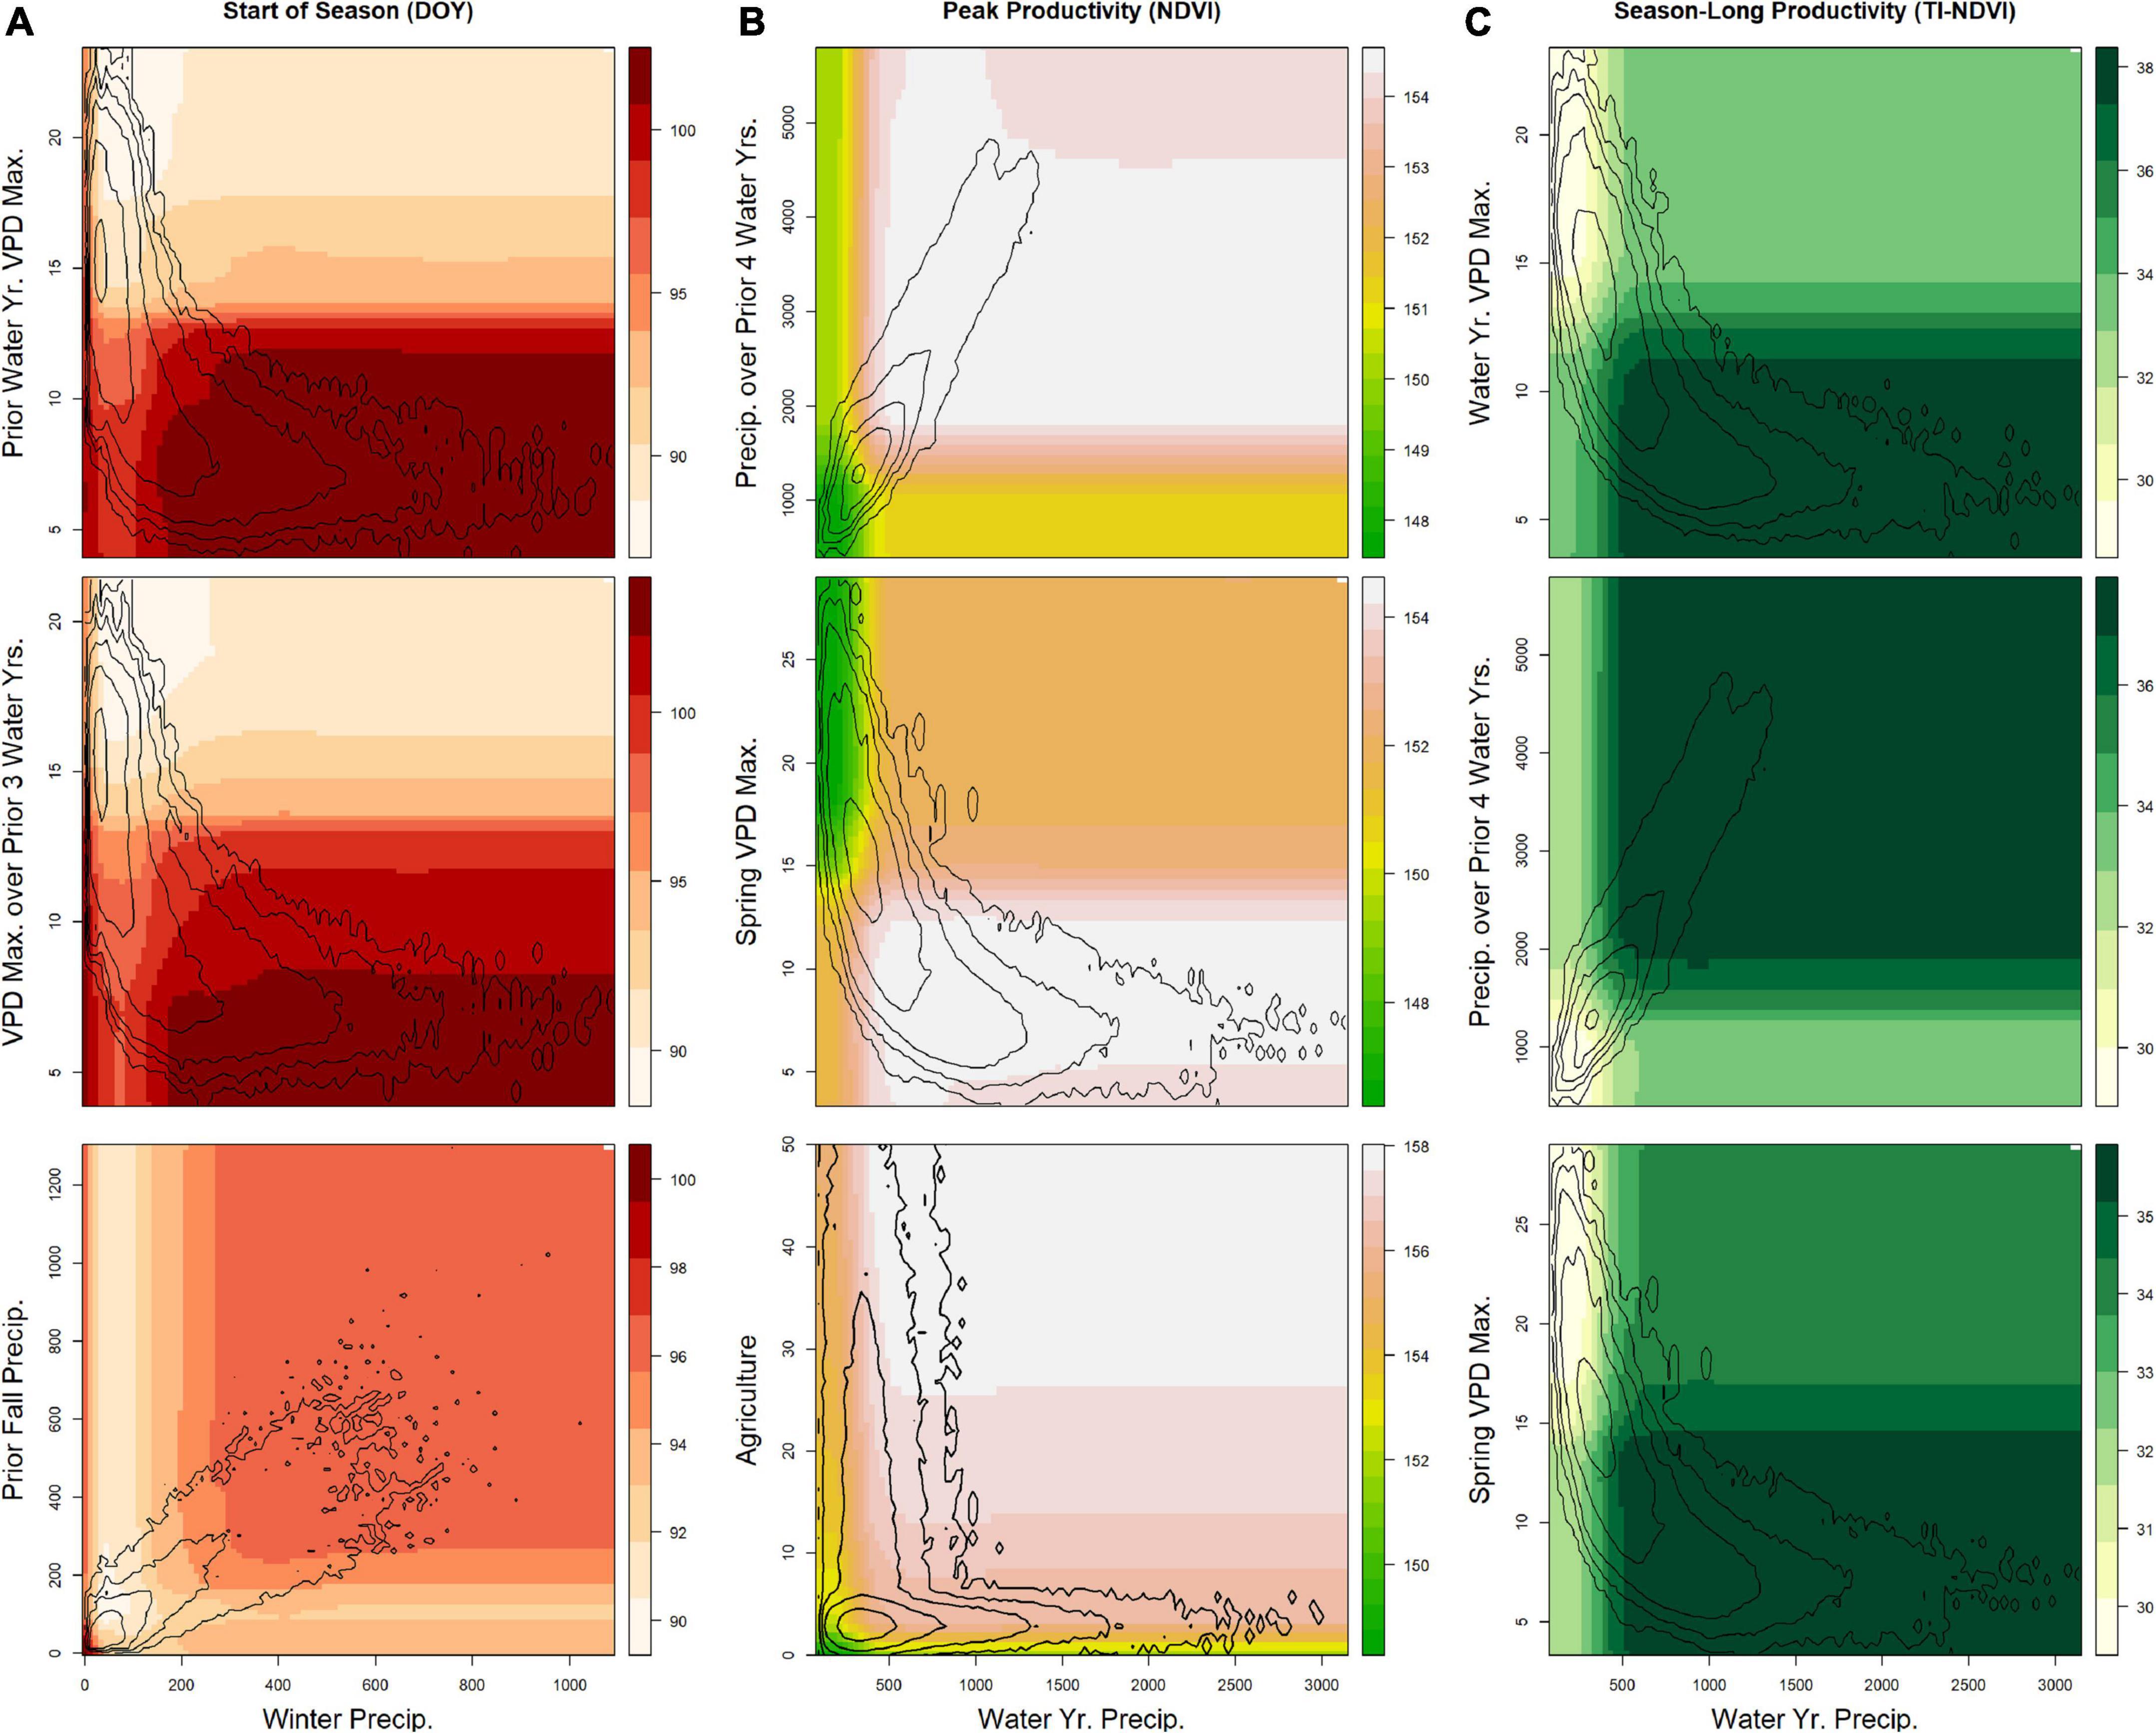
Figure 4. Results from the final random forest models for areas of the U.S. Northwestern Plains having primarily shrub land cover pixels. For each phenological measure, three partial-dependence plots show the relationship between selected pairs of variables. Contour lines show the natural logarithm of the kernel density (i.e., the distribution of the two variables in the dataset). Seasonal and yearly variables represent either (A) the mean over the time period for temperature (°C, Temp.) and vapor pressure deficit (hPa, VPD), (B) the cumulative sum for precipitation (mm, Precip.), or (C) exceedance of vapor pressure deficit (days over 1 or 2 times the SD of the long-term distribution) and growing degree-days (°C, GDD). Max, Maximum; SD, standard deviation.
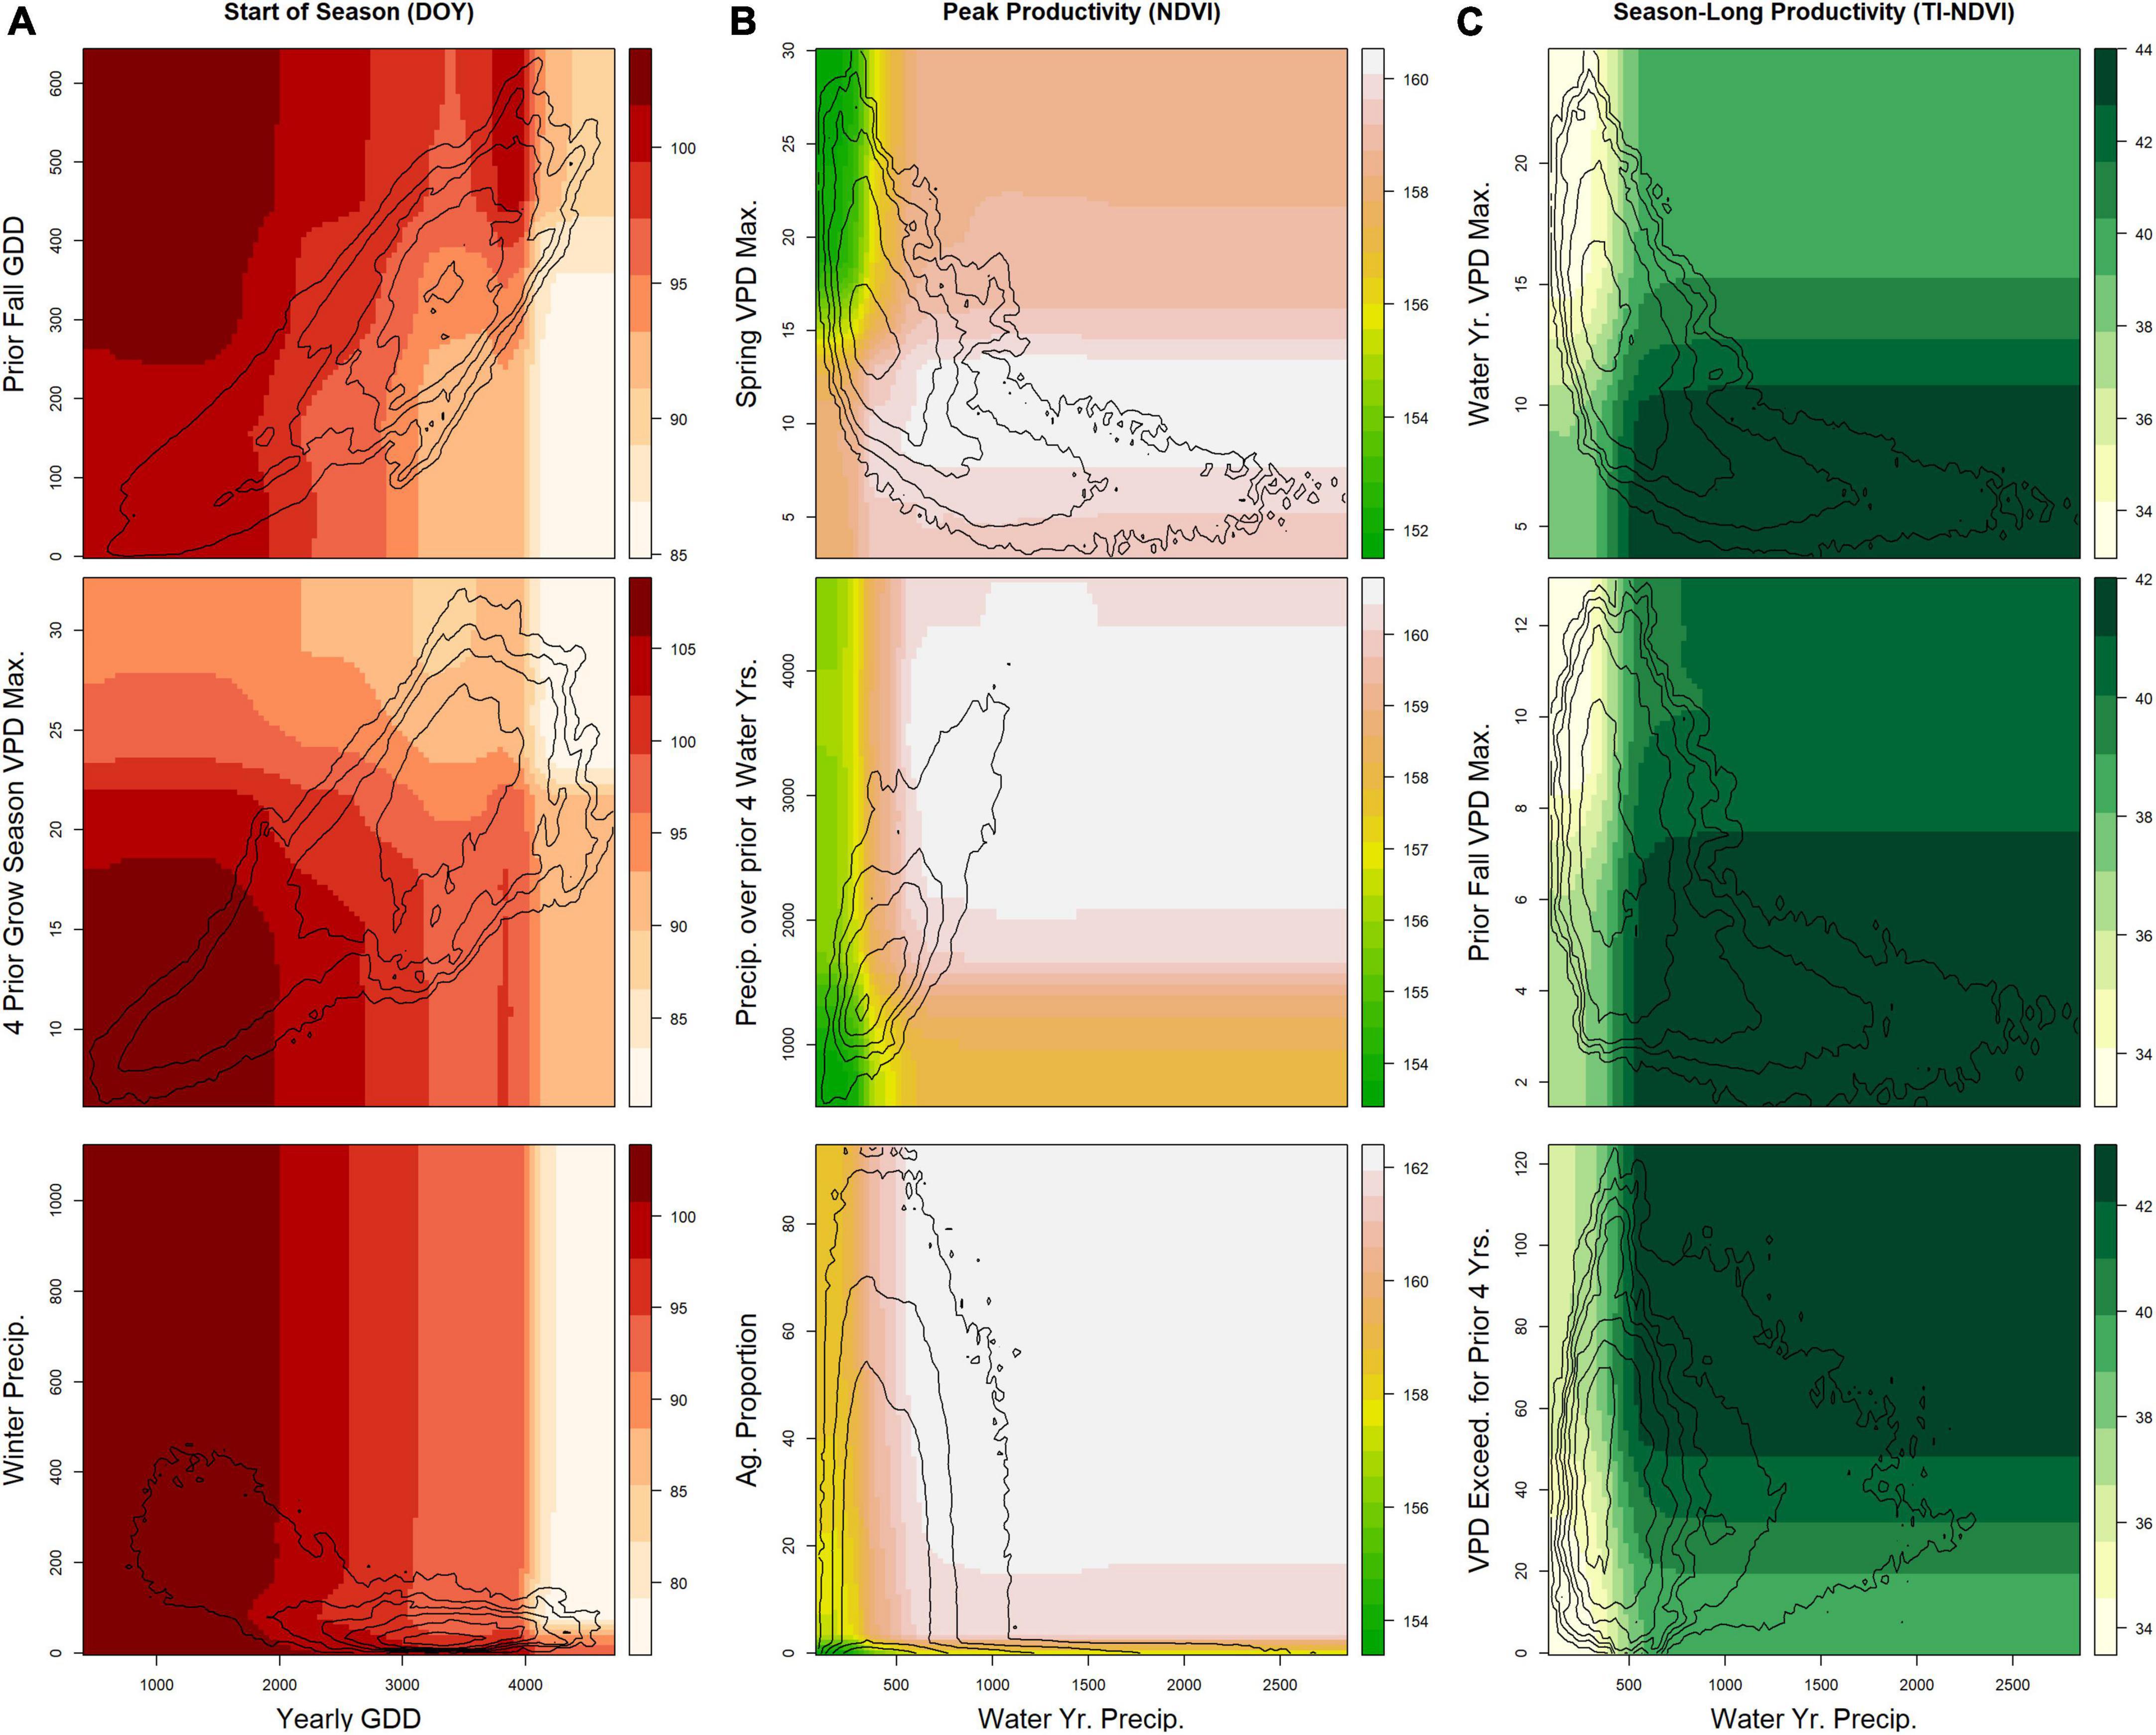
Figure 5. Results from the final random forest models for areas of the U.S. Northwestern Plains having primarily grassland land cover pixels. For each phenological measure, three partial-dependence plots show the relationship between selected pairs of variables. Contour lines show the natural logarithm of the kernel density (i.e., the distribution of the two variables in the dataset). Seasonal and yearly variables represent either (A) the mean over the time period for temperature (°C, Temp.) and vapor pressure deficit (hPa, VPD), (B) the cumulative sum for precipitation (mm, Precip.), or (C) exceedance of vapor pressure deficit (days over 1 or 2 times the SD of the long-term distribution) and growing degree-days (°C, GDD). Max, Maximum; SD, standard deviation.
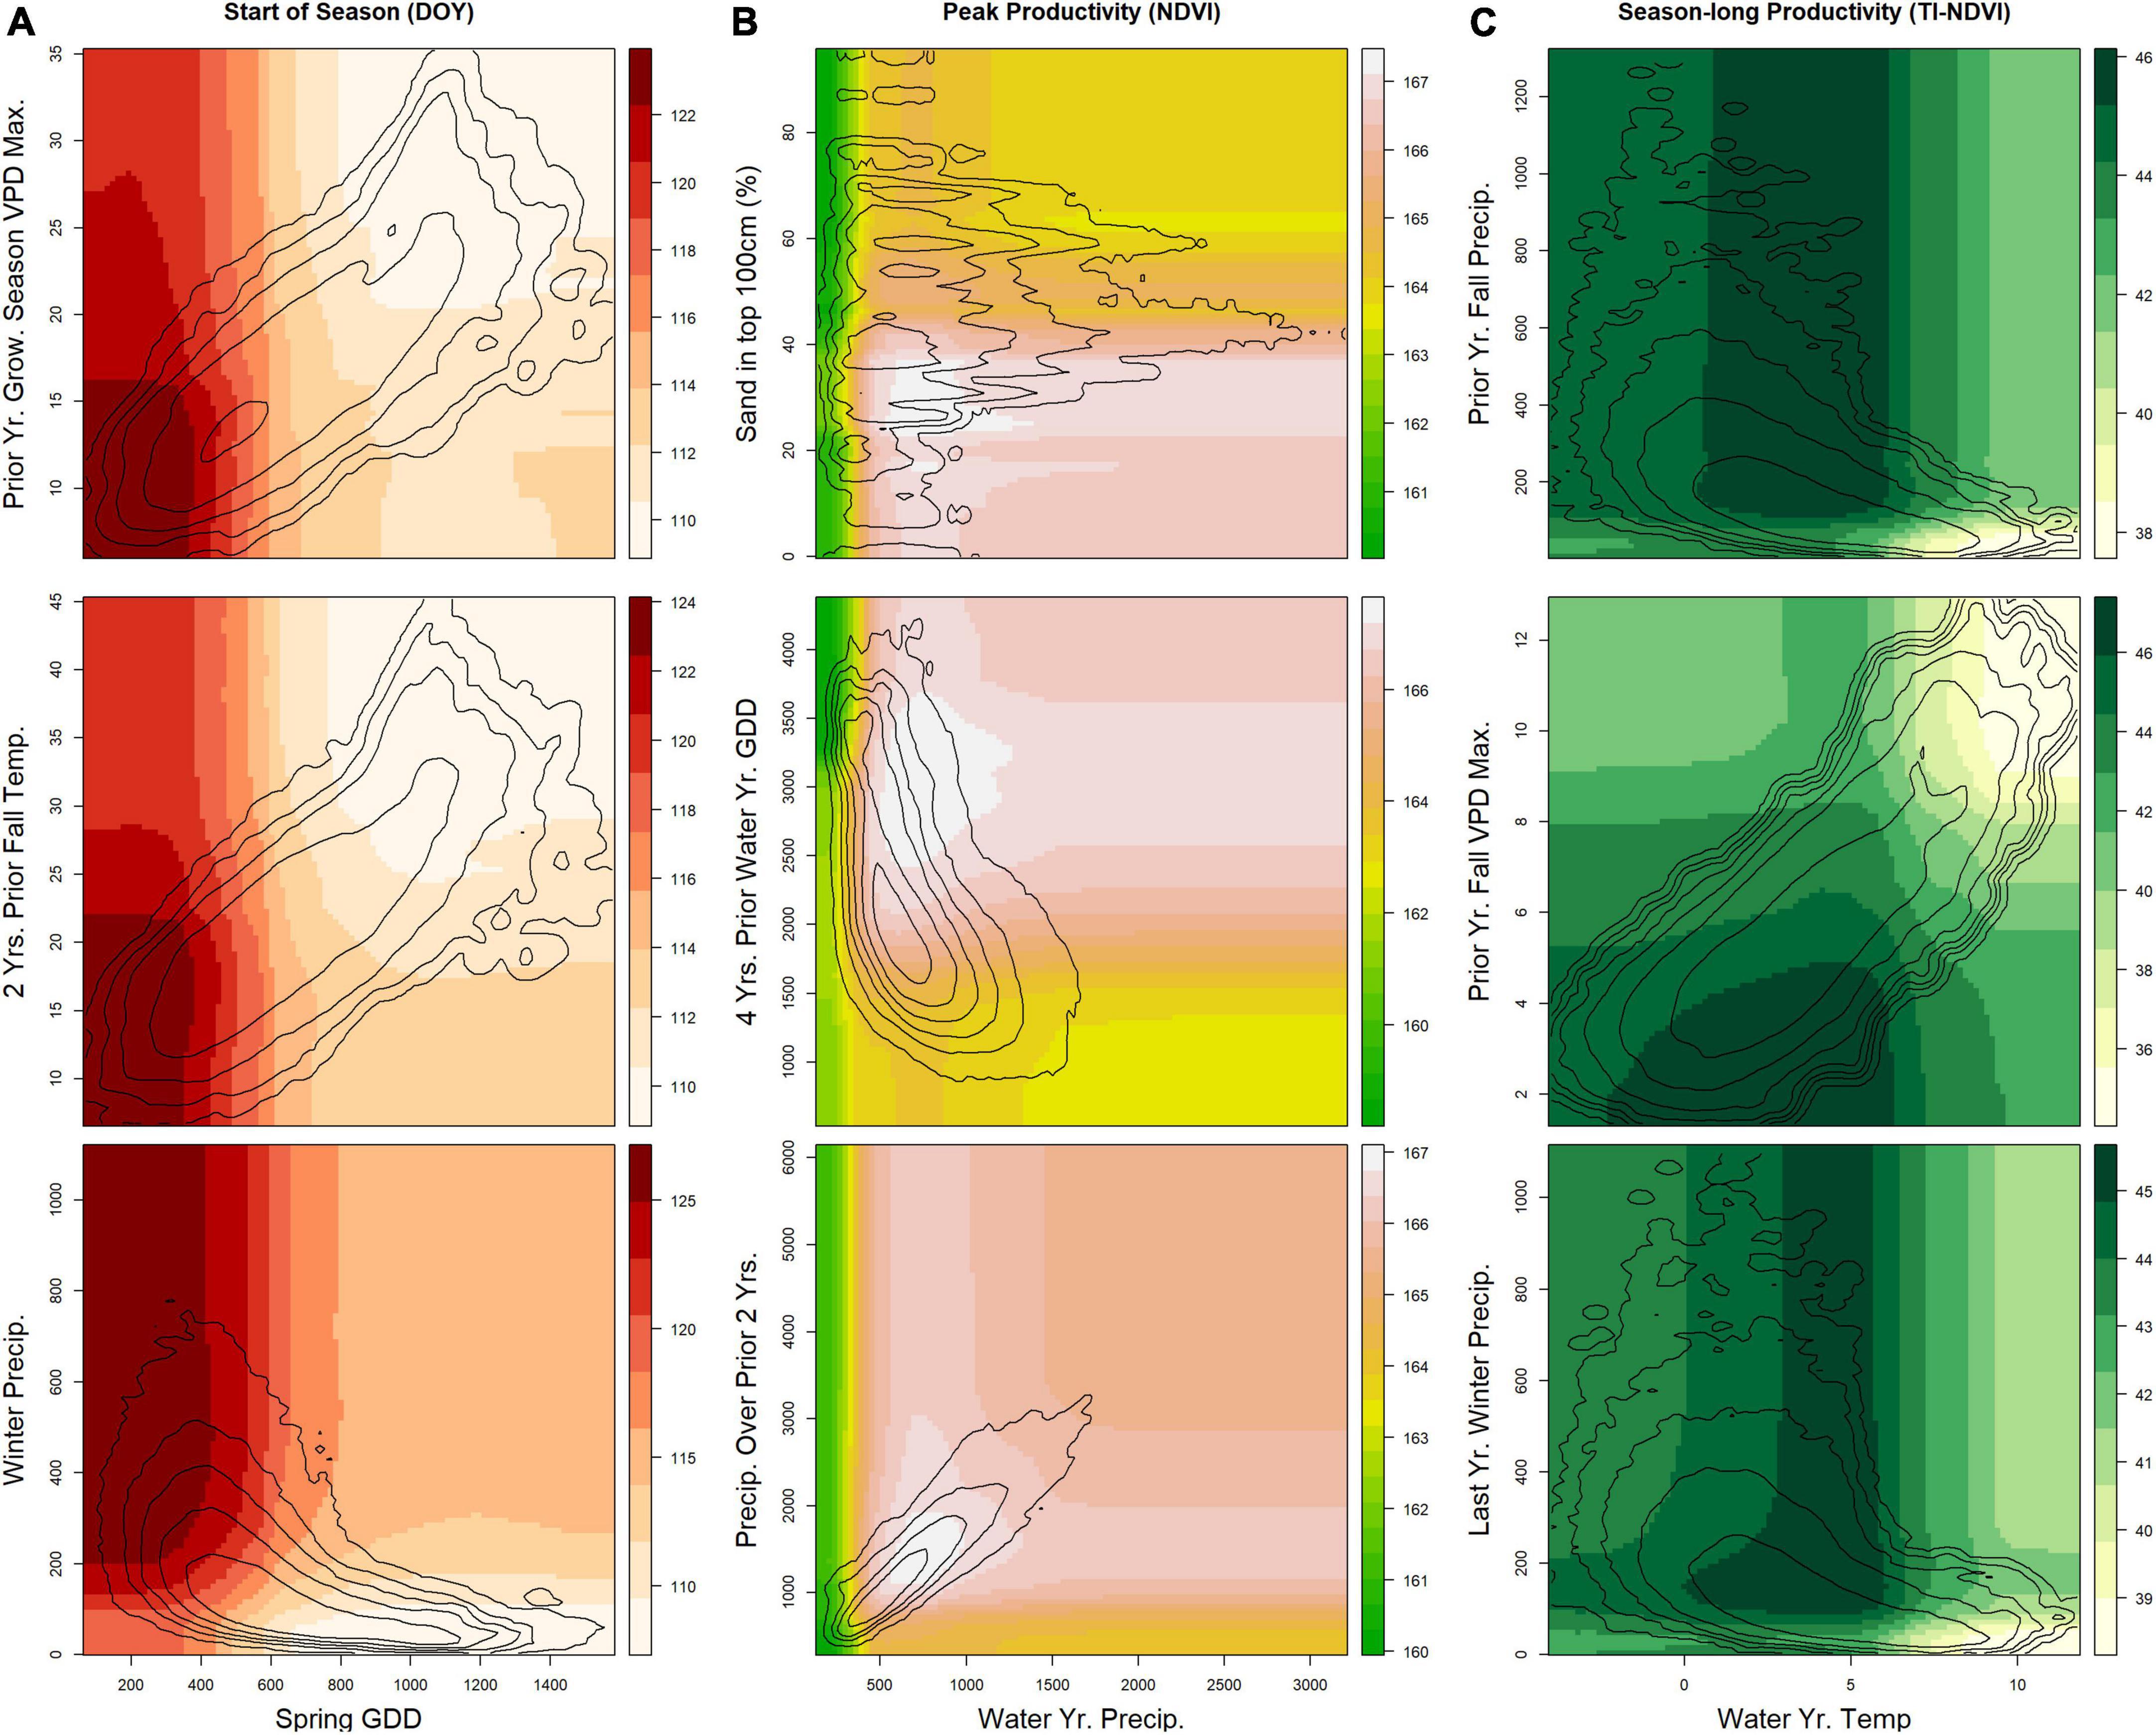
Figure 6. Results from the final random forest models for areas of the U.S. Northwestern Plains having primarily evergreen forest land cover pixels. For each phenological measure, three partial-dependence plots show the relationship between selected pairs of variables. Contour lines show the natural logarithm of the kernel density (i.e., the distribution of the two variables in the dataset). Seasonal and yearly variables represent either (A) the mean over the time period for temperature (°C, Temp.) and vapor pressure deficit (hPa, VPD), (B) the cumulative sum for precipitation (mm, Precip.) or (C) exceedance of vapor pressure deficit (days over 1 or 2 times the SD of the long-term distribution) and growing degree-days (°C, GDD). Max, Maximum; SD, standard deviation.
The final set of variables from maximum productivity and season-long productivity models varied across land cover types, but some commonalities were evident. Water-year precipitation had the highest importance score in maximum productivity models in the shrubland (Supplementary Table 3) and grassland (Supplementary Table 4) types, which constitute most of the study area. Its influence was combined with soil characteristics [e.g., cation exchange capacity (CEC), silt content, or both], pixel composition (proportion of other land cover types present in the pixel), location (MLRA or HUC), VPD (wherein higher spring and growing season VPDmax decreased productivity), and legacy and cumulative moisture availability (precipitation and/or various VPD measures) in the final models (see Figures 4–6). However, the final model for maximum productivity in evergreen forests had contextual variables (sand and silt composition) as the top two predictor variables; additional contextual variables such as watershed and subpixel makeup also appeared in the final model. For all three land cover types, cumulative precipitation over the past 2, 3, or 4 years was a final selected variable in maximum-productivity models. For season-long productivity, the highest importance score for shrubland and grassland land cover types remained water-year precipitation, whereas the prior year’s fall precipitation was most important for evergreen forests. Season-long productivity tended to be influenced by other climate variables from the current year (yearly and/or seasonal temperature, GDD, VPD, and precipitation), whereas location and soil variables appeared less frequently as top predictors (though they were present in some models). Legacy effects were for specific prior periods or more-recent periods (notably, the prior year’s fall and winter preceding the current year’s growing season), except in shrublands (wherein the prior 4 years’ VPD exceedance and water-year precipitation were most predictive).
Discussion
Our results demonstrated that drivers of phenological events in the NWP and the magnitudes of their influence are diverse, scale- and context-dependent, and interact with other factors. Although these findings are in overall agreement with other studies (Xia et al., 2015; Piao et al., 2019; Ren et al., 2020; Park et al., 2021) we found that phenology across our study domain exhibits unique features that we elaborate upon here. Although there is ample evidence for short-term lags and memory effects (i.e., the accumulation of temperature over weeks to months) contributing to current measured processes or ecosystem states (e.g., Oesterheld et al., 2001; Sala et al., 2012; Reichmann et al., 2013; Clark et al., 2014; Fu et al., 2017; Griffin-Nolan et al., 2018; Kannenberg et al., 2020; Ren et al., 2020), we demonstrated longer-term influences on several phenology measures throughout the NWP, across multiple land-cover types. Our findings can be used to enable more-accurate predictions of phenology and responses to increased variability from climate change. For example, we found climate conditions over multiple prior years influenced the amount of current-year productivity (i.e., via an interaction with current-year climate conditions). Accounting for variables such as precipitation, VPD, and GDD over multiple prior years can be used in current-year (e.g., Hartman et al., 2020; Reeves et al., 2020; Jones et al., 2021) and future production forecasts (e.g., Reeves et al., 2014; Wonkka et al., 2019). Improved forecasting allows for more-robust allocation decisions (e.g., stocking rates and herd sizes) that balance ecological and social objectives. In addition, legacy conditions over longer terms and from within the past year influenced start-of-season dates, again combined with current-year climate. In evaluating options such as seeding dates for restoration, accounting for legacy conditions can contribute to identifying when an effective time period may be to act. Furthermore, assessment of the effectiveness of management actions may need to account for multi-year conditions, to better understand results and inform future activities. For example, expected changes from modified management practices may have been limited not because of ineffective actions, but instead because of cumulative conditions over the monitoring period.
Antecedent conditions
Legacy climate effects exist in grasslands (Wang et al., 2001; Sala et al., 2012; Griffin-Nolan et al., 2018) and forested systems (Kannenberg et al., 2019), and the strength of their influence can be tied to the magnitude of prior events (Yahdjian and Sala, 2006; Kannenberg et al., 2020). We found that cumulative precipitation over the past four water years was a key predictor of current-year maximum productivity and season-long productivity in shrublands, effectively boosting or limiting the impact of the current year’s precipitation (Figure 4). Legacy impacts in grass and shrub land-cover types are mixed, with larger effects typically documented on grasses than on shrubs (Yahdjian and Sala, 2006; Reichmann et al., 2013). Grass cover often declines during drought (Rondeau et al., 2018), and although many communities may show resilience to drought, grasslands are one of the most sensitive communities (Ponce-Campos et al., 2013). C4 grasses are expected to perform better than C3 species during drought conditions given their higher water-use efficiency (Smart et al., 2007; Griffin-Nolan et al., 2018), although the timing of precipitation within the year also plays a role (Knapp et al., 2020). Consequences of drier years include reduced tiller density (Reichmann et al., 2013), decreased species richness (with larger impacts to annuals and forbs than perennials), and recovery that can take several years (Tilman and El Haddi, 1992; Samson et al., 2004).
Evergreen forests also responded to cumulative multi-year precipitation, although the effects were less clear (Figure 6). More-mesic systems tend to be less sensitive to drought because they are often limited by multiple factors (Ponce-Campos et al., 2013), and because forests have complicated drivers of productivity (Lubenow and Reinhardt, 2020). In addition, longer-term cumulative lags were not restricted to productivity measures for the forest land-cover type.
In shrublands, an earlier start to spring was associated with higher mean VPDmax of the past three water years (Figure 4). Changes over multiple years may be due to within-vegetation-community shifts in the dominance of perennial vs. annual and herbaceous vs. woody species. Perennial herbaceous species within a land cover type may increase over a wetter time period, (i.e., from increased PPT or reduced VPD over multiple years) and the later spring start of perennial herbaceous species would lead to a later date for start of season for the land cover type. To our knowledge, our findings include longer-term legacy influences than those previously reported, and our partial dependence analyses also demonstrate potential feedbacks and interactions between legacy and current conditions.
We also identified legacy impacts occurring over shorter timescales. For example, fall and winter conditions from the prior 1–2 years were important variables in models predicting start of season in shrub land-cover (Figure 4 and Supplementary Table 3). Specifically, higher VPDmax two falls prior was the highest ranked predictor, and higher precipitation in the prior fall and lower VPDmax in the prior year led to a later start of season. The date of the start of season has been found to reflect temperatures from the prior fall and current spring (Cook et al., 2012). Furthermore, conditions in the prior year may change root:shoot allocations, lead to shifts in annuals vs. perennial species, and can have implications for flowering timing (Tilman and El Haddi, 1992; Samson et al., 2004; Mulder and Diggle, 2019; Zhang B. et al., 2019). Within-year time lags (e.g., conditions from a season earlier than the event in question) are also more commonly identified in phenological studies than are lags from prior years (Wang et al., 2011; Fu et al., 2017; Liu et al., 2019; Lian et al., 2020). Analyses examining the collection of impacts from climate measures over the growing season have also identified tradeoffs, limiting factors, and implications for changes of phenological measures (e.g., Hu et al., 2010; Wang et al., 2011; Lian et al., 2020; Maurer et al., 2020; Potter, 2020; Ren et al., 2020).
Differences and commonalities in associations
Differences in top predictors across our three focal vegetation land cover types and across our phenological measures likely reflect divergent limiting factors. Growth periods can be limited by temperature or water availability, individually or in combination (Cowles et al., 2018; Chen et al., 2019; Piao et al., 2019; Reed et al., 2019; Yang et al., 2021). Precipitation tends to be more tightly tied to productivity in drier regions than in more-mesic areas, where other factors may play a larger role (Webb et al., 1978; Maurer et al., 2020). Differences in vegetation structure also lead to differences in the response of phenology to climate drivers. We found a higher proportion of VPD variables being important predictors of season-long productivity in grasslands compared to in woody (evergreen and shrub) cover types, in which precipitation was a more frequent top predictor. Evergreen trees and shrubs [such as sagebrush (Artemisia tridentata), the dominant shrub in the region] must maintain plant functions year-round, whereas grasses can senesce during dry and cold seasons. In general, temperature and/or VPD variables tended to rank higher in season-long productivity models (in the top few importance scores) than in peak productivity models. The drivers and controls for peak productivity differ from season-long productivity (Butterfield et al., 2020; Gao et al., 2020; Wood et al., 2021), and our results indicate that season-long productivity reflects key water-year (i.e., prior fall variables often appear in the top set of predictors) and temperature predictors (i.e., GDD and VPD variables), whereas peak productivity more strongly reflects current-year weather variables and contextual variables (Figures 2, 3).
Start of season tended to have both temperature and precipitation variables as top predicted drivers, within the spring and prior fall seasons. Whereas we found land cover types had complicated connections between temperature and precipitation, one clear pattern was that earlier start of season dates in evergreen forests relate to increased spring growing degree-days and drier immediately preceding winters (but with nuances and interactions with current and prior-year conditions). Although increased precipitation prior to the start of the growing season is tied to earlier start dates in many parts of the globe, if winter precipitation falls as snow, as is often the case in the NWP, it actually may cause a delayed start (Potter, 2020; Ren et al., 2020). The timing and rate of melting snow is tied to temperature, and whereas higher temperatures may lead to early growing season starts, the increased early season evapotranspiration and VPD from higher temperatures can lead to decreased season-long productivity.
Influences of contextual drivers
Land-cover heterogeneity, measured as the proportion of land cover type within each AVHRR pixel, frequently influenced either peak or season-long productivity. Primary production, normally tied to moisture availability, differs across vegetation communities (Webb et al., 1978) and can vary within small extents due to topography, structural differences, and physiology. Although one might expect heterogeneity in phenological responses from different subpixel makeups should affect date-based measures (Zhang et al., 2017), in our research, proportions of land-cover types within a pixel were not top predictors of start of season measures. The variability explained by climate drivers likely exceeded that from sub-pixel land cover types at regional scales.
Soil characteristics also appeared in the set of final selected variables for date- and productivity-based phenological measure, among all land cover types. Although soil variables were held constant across our 25-year research window, differences in composition (silt, sand, and clay), nutrient availability (CEC), texture, and water capacity influence the availability of water to plants and the longevity of available water in the root zone. Consequently, these edaphic characteristics can mediate phenological responses to climatic conditions, disturbances, and other factors. Soil water fluxes also can interact with phenology measures. For example, additional transpiration can lead to increased water losses with an earlier spring (Lian et al., 2020) but the rate of loss is dependent on soil properties and interacts with climate (Gremer et al., 2015; Or and Lehmann, 2019). In both our research and in other models, errors in predictions are reduced by emphasizing the importance of environmental variability beyond climate (e.g., Reeves et al., 2014).
Further study and limitations
We identified some unexpected variables in several cover types for start of season dates. For example, variables in the final set included yearly growing degree days, and (same year) fall VPDmax, time periods that include Julian dates well after spring, the expected period for the start of season. However, the AVHRR dataset contains some start of season dates falling late in the year. Because dates in the late summer or fall (e.g., around Julian date 300) are far from where most start of season dates are found (closer to 90–120 in our study) the inclusion of variables explaining later starting days may account for a large amount of variance in the models. At least three possibilities exist: (1) dates falling late in the year are presumably in more moisture-limited areas where NDVI signals did not exceed baseline levels or thresholds until precipitation occurred later in the year (Smith et al., 2019); (2) year-long variables are correlated with variables covering earlier time periods while also explaining later start dates in some conditions; or (3) dates falling later in the year are artifacts/errors in the processing of remote sensing information (e.g., Berman et al., 2020). Further study could focus more specifically on areas with uncharacteristic start of season dates and changes in model performance with the inclusion or omission of the smaller sets of variables we have included. Furthermore, with the parsimonious sets of results from this study, more specific examinations of the interactions and implications of changes in identified variables can be undertaken. For example, future efforts can take a closer look at land cover types and phenological measures either at levels lower on the ecological hierarchy or more locally through continuous (de Beurs and Henebry, 2007; Clark et al., 2014) and other emerging analytical approaches, such as survival analyses (e.g., Templ et al., 2016; Elmendorf et al., 2019).
Surprisingly, fire never appeared in our sets of top predictors. However, fire can radically change vegetation phenology, wherein its effects last for multiple years, depending on the fire severity and speed of recovery (Miller et al., 2013; Vermeire and Russell, 2018; Wood et al., 2019; Vanderhoof et al., 2020; Gemitzi and Koutsias, 2021; Wang et al., 2021). If fire resulted in a change in land-cover type, pixels would have shifted vegetation class (such as from forest to grassland) in our approach. For other fire effects, such as within-type compositional shifts, impacts to phenology are important but may need a more specific assessment (e.g., Wang et al., 2021). In our study, we had relatively few pixels within fire perimeters. For example, only a few thousand of over a million records in the evergreen forest land cover type were within fire perimeters. In addition to fire, grazing can also lead to possible phenological impacts through changes in composition, productivity, and sensitivity to precipitation variability (Fuhlendorf and Engle, 2001; Briske et al., 2005; Beever et al., 2008; Batbaatar et al., 2021). Data for grazing intensity do not exist at the scale of our study, but this metric should be considered in future assessments.
Our findings underscore that antecedent conditions from months to years before the temporal window of the response variable, as well as non-climate variables, need to be considered to understand and predict phenological responses to, and consequences of, future climate and land-use scenarios. For example, one consequence of multi-year influences on current year productivity is that systems may take multiple years to recover annual productivity after drought, especially after prolonged or severe drought. The NWP may therefore be at risk due to climate change; a large portion of the area is projected to leave the region’s current climate envelope (Wonkka et al., 2019) and to experience increased future summer drying (Ficklin and Novick, 2017). Our study can help remove uncertainty from projections by facilitating understanding of responses of potential vegetation communities to changes in the trends and variability of future climates. Furthermore, the implications of the influence of legacy conditions extend to planning management actions. Restoration and vegetation-treatment actions often need to take place during critical time periods, such as spring green-up, which in turn is influenced by multiple-year and prior-season conditions. Likewise, when using date- or phenology-based indicators to assess ecological condition, the broader climate context (e.g., conditions over multiple years, prior growing season, and water years) are needed to interpret responses. Phenology has important feedbacks with climate and is a key ecosystem process (Richardson et al., 2013; Beard et al., 2019), and through identifying key drivers over novel temporal windows of duration and lag, this study enables improved incorporation of ecosystem processes into models of the natural world.
Data availability statement
The data used in this submission have already been published and are primarily publicly available from the sources cited in the article/Supplementary material and Wood et al. (2022). Further inquiries can be directed to the corresponding author.
Author contributions
DW, PS, and SP conceived and designed the study. DW and EB collected the data sources. DW performed the analysis and wrote the original draft of the manuscript. All authors provided critical review, revisions during the writing process, and approve this version.
Funding
DW and EB received support from the Bureau of Land Management Montana-Dakotas State Office (Interagency Agreement L15PG00230 and L20PG00168). PS support includes the University of Wisconsin—Madison and the U.S. National Science Foundation (DEB-1552976 and OIA-1632810). SP received support from Montana State University.
Acknowledgments
Kathryn Irvine, Lisa Rew, and Lance McNew, as well as two reviewers, provided constructive comments on an earlier draft. An earlier version of this manuscript appeared in the dissertation of DW. Any use of trade, firm, or product names is for descriptive purposes only and does not imply endorsement by the U.S. Government.
Conflict of interest
The authors declare that the research was conducted in the absence of any commercial or financial relationships that could be construed as a potential conflict of interest.
Publisher’s note
All claims expressed in this article are solely those of the authors and do not necessarily represent those of their affiliated organizations, or those of the publisher, the editors and the reviewers. Any product that may be evaluated in this article, or claim that may be made by its manufacturer, is not guaranteed or endorsed by the publisher.
Supplementary material
The Supplementary Material for this article can be found online at: https://www.frontiersin.org/articles/10.3389/fevo.2022.1007010/full#supplementary-material
Footnotes
References
Akima, H., and Gebhardt, A. (2020). Akima: Interpolation of irregularly and regularly spaced data. R package Version 0.6-2.1. Available online at: https://cran.r-project.org/package=akima
Al-Yaari, A., Wigneron, J. P., Ciais, P., Reichstein, M., Ballantyne, A., Ogée, J., et al. (2020). Asymmetric responses of ecosystem productivity to rainfall anomalies vary inversely with mean annual rainfall over the conterminous United States. Glob. Change Biol. 26, 6959–6973. doi: 10.1111/gcb.15345
Auch, R. F., Sayler, K. L., Napton, D. E., Taylor, J. L., and Brooks, M. S. (2011). Ecoregional differences in late-20th-century land-use and land-cover change in the US northern great plains. Great Plains Res. 21, 231–243.
Bandieri, L. M., Fernández, R. J., and Bisigato, A. J. (2020). Risks of neglecting phenology when assessing climatic controls of primary production. Ecosystems 23, 164–174. doi: 10.1007/s10021-019-00393-7
Batbaatar, A., Bork, E. W., Broadbent, T., Alexander, M. J., Cahill, J. F., Carlyle, C. N., et al. (2021). Grazing alters the sensitivity of plant productivity to precipitation in northern temperate grasslands. J. Veg. Sci. 32:e13008. doi: 10.1111/jvs.13008
Beard, K. H., Kelsey, K. C., Leffler, A. J., and Welker, J. M. (2019). The missing angle: Ecosystem consequences of phenological mismatch. Trends Ecol. Evol. 34, 885–888. doi: 10.1016/j.tree.2019.07.019
Beever, E. A., Tausch, R. J., and Thogmartin, W. E. (2008). Multi-scale responses of vegetation to removal of horse grazing from great basin (USA) mountain ranges. Plant Ecol. 196, 163–184. doi: 10.1007/s11258-007-9342-5
Berman, E. E., Graves, T. A., Mikle, N. L., Merkle, J. A., Johnston, A. N., and Chong, G. W. (2020). Comparative quality and trend of remotely sensed phenology and productivity metrics across the western United States. Remote Sens. 12:2538. doi: 10.3390/rs12162538
Bianchi, E., Villalba, R., and Solarte, A. (2019). NDVI spatio-temporal patterns and climatic controls over northern Patagonia. Ecosystems 23, 84–97. doi: 10.1007/s10021-019-00389-3
Briske, D. D., Fuhlendorf, S. D., and Smeins, F. (2005). State-and-transition models, thresholds, and rangeland health: A synthesis of ecological concepts and perspectives. Rangel. Ecol. Manag. 58, 1–10. doi: 10.2111/1551-5028(2005)58<1:SMTARH>2.0.CO;2
Bromley, G. T., Gerken, T., Prein, A. F., and Stoy, P. C. (2020). Recent trends in the near-surface climatology of the northern North American great plains. J. Clim. 33, 461–475. doi: 10.1175/JCLI-D-19-0106.1
Butterfield, Z., Buermann, W., and Keppel-Aleks, G. (2020). Satellite observations reveal seasonal redistribution of northern ecosystem productivity in response to interannual climate variability. Remote Sens. Environ. 242:111755. doi: 10.1016/j.rse.2020.111755
Chen, M., Parton, W. J., Hartman, M. D., Del Grosso, S. J., Smith, W. K., Knapp, A. K., et al. (2019). Assessing precipitation, evapotranspiration, and NDVI as controls of U.S. great plains plant production. Ecosphere 10:e02889. doi: 10.1002/ecs2.2889
Chen, X., Wang, W., Chen, J., Zhu, X., Shen, M., Gan, L., et al. (2020). Does any phenological event defined by remote sensing deserve particular attention? An examination of spring phenology of winter wheat in northern China. Ecol. Indic. 116:106456. doi: 10.1016/j.ecolind.2020.106456
Clark, J. S., Melillo, J., Mohan, J., and Salk, C. (2014). The seasonal timing of warming that controls onset of the growing season. Glob. Change Biol. 20, 1136–1145. doi: 10.1111/gcb.12420
Cook, B. I., Wolkovich, E. M., and Parmesan, C. (2012). Divergent responses to spring and winter warming drive community level flowering trends. Proc. Natl. Acad. Sci. U.S.A. 109, 9000–9005. doi: 10.1073/pnas.1118364109
Cowles, J., Boldgiv, B., Liancourt, P., Petraitis, P. S., and Casper, B. B. (2018). Effects of increased temperature on plant communities depend on landscape location and precipitation. Ecol. Evol. 8, 5267–5278. doi: 10.1002/ece3.3995
Cutler, D. R., Edwards, T. C. Jr., Beard, K. H., Cutler, A., Hess, K. T., Gibson, J., et al. (2007). Random forests for classification in ecology. Ecology 88, 2783–2792. doi: 10.1890/07-0539.1
Czernecki, B., Nowosad, J., and Jabłońska, K. (2018). Machine learning modeling of plant phenology based on coupling satellite and gridded meteorological dataset. Int. J. Biometeorol. 62, 1297–1309. doi: 10.1007/s00484-018-1534-2
Daly, C., Halbleib, M., Smith, J. I., Gibson, W. P., Doggett, M. K., Taylor, G. H., et al. (2008). Physiographically sensitive mapping of climatological temperature and precipitation across the conterminous United States. Int. J. Clim. 28, 2031–2064. doi: 10.1002/joc.1688
de Beurs, K. M., and Henebry, G. M. (2007). A statistical framework for the analysis of long image time series. Int. J. Remote Sens. 26, 1551–1573. doi: 10.1080/01431160512331326657
de Jong, R., de Bruin, S., de Wit, A., Schaepman, M. E., and Dent, D. L. (2011). Analysis of monotonic greening and browning trends from global NDVI time-series. Remote Sens. Environ. 115, 692–702. doi: 10.1016/j.rse.2010.10.011
Eidenshink, J. (2006). A 16-year time series of 1 km AVHRR satellite data of the conterminous United States and Alaska. Photogramm. Eng. Remote Sens. 72, 1027–1035. doi: 10.14358/PERS.72.9.1027
Elmendorf, S. C., Crimmins, T. M., Gerst, K. L., and Weltzin, J. F. (2019). Time to branch out? Application of hierarchical survival models in plant phenology. Agric. For. Meteorol. 279:107694. doi: 10.1016/j.agrformet.2019.107694
Felton, A. J., Shriver, R. K., Bradford, J. B., Suding, K. N., Allred, B. W., and Adler, P. B. (2021). Biotic vs abiotic controls on temporal sensitivity of primary production to precipitation across North American drylands. New Phytol. 231, 2150–2161. doi: 10.1111/nph.17543
Felton, A. J., Zavislan-Pullaro, S., and Smith, M. D. (2019). Semiarid ecosystem sensitivity to precipitation extremes: Weak evidence for vegetation constraints. Ecology 100:e02572. doi: 10.1002/ecy.2572
Ficklin, D. L., and Novick, K. A. (2017). Historic and projected changes in vapor pressure deficit suggest a continental-scale drying of the United States atmosphere. J. Geophys. Res. Atmos. 122, 2061–2079. doi: 10.1002/2016JD025855
Fu, Z., Ciais, P., Prentice, I. C., Gentine, P., Makowski, D., Bastos, A., et al. (2022). Atmospheric dryness reduces photosynthesis along a large range of soil water deficits. Nat. Commun. 13:989. doi: 10.1038/s41467-022-28652-7
Fu, Z., Stoy, P. C., Luo, Y., Chen, J., Sun, J., Montagnani, L., et al. (2017). Climate controls over the net carbon uptake period and amplitude of net ecosystem production in temperate and boreal ecosystems. Agric. For. Meteorol. 243, 9–18. doi: 10.1016/j.agrformet.2017.05.009
Fuhlendorf, S. D., and Engle, D. M. (2001). Restoring heterogeneity on rangelands: Ecosystem management based on evolutionary grazing patterns: We propose a paradigm that enhances heterogeneity instead of homogeneity to promote biological diversity and wildlife habitat on rangelands grazed by livestock. BioScience 51, 625–632. doi: 10.1641/0006-3568(2001)051[0625:RHOREM]2.0.CO;2
Gao, X., Liang, S., and Sauer, J. (2020). Greening hiatus in eurasian boreal forests since 1997 caused by a wetting and cooling summer climate. J. Geophys. Res. 125:e2020JG005662. doi: 10.1029/2020JG005662
Gemitzi, A., and Koutsias, N. (2021). Assessment of properties of vegetation phenology in fire-affected areas from 2000 to 2015in the Peloponnese, Greece. Remote Sens. Appl. 23:100535. doi: 10.1016/j.rsase.2021.100535
Genuer, R., Poggi, J.-M., and Tuleau-Malot, C. (2010). Variable selection using random forests. Pattern Recognit. Lett. 31, 2225–2236. doi: 10.1016/j.patrec.2010.03.014
Genuer, R., Poggi, J.-M., and Tuleau-Malot, C. (2015). VSURF: An R package for variable selection using random forests. R J. 7, 19–33. doi: 10.32614/RJ-2015-018
Gómez, C., White, J. C., and Wulder, M. A. (2016). Optical remotely sensed time series data for land cover classification: A review. ISPRS J. Photogramm. Remote Sens. 116, 55–72. doi: 10.1016/j.isprsjprs.2016.03.008
Greenwell, B. M. (2017). pdp: An R package for constructing partial dependence plots. R J. 9, 421–436. doi: 10.32614/RJ-2017-016
Gremer, J. R., Bradford, J. B., Munson, S. M., and Duniway, M. C. (2015). Desert grassland responses to climate and soil moisture suggest divergent vulnerabilities across the southwestern United States. Glob. Change Biol. 21, 4049–4062. doi: 10.1111/gcb.13043
Griffin-Nolan, R. J., Carroll, C. J., Denton, E. M., Johnston, M. K., Collins, S. L., Smith, M. D., et al. (2018). Legacy effects of a regional drought on aboveground net primary production in six central US grasslands. Plant Ecol. 219, 505–515. doi: 10.1007/s11258-018-0813-7
Hanes, J. M., Liang, L., and Morisette, J. T. (2014). “Land surface phenology,” in Biophysical applications of satellite remote sensing, ed. J. M. Hanes (Berlin: Springer), 99–125. doi: 10.1007/978-3-642-25047-7_4
Hapfelmeier, A., and Ulm, K. (2013). A new variable selection approach using random forests. Comput. Stat. Data Anal. 60, 50–69. doi: 10.1016/j.csda.2012.09.020
Hartman, M. D., Parton, W. J., Derner, J. D., Schulte, D. K., Smith, W. K., Peck, D. E., et al. (2020). Seasonal grassland productivity forecast for the U.S. great plains using grass-cast. Ecosphere 11:e03280. doi: 10.1002/ecs2.3280
Hu, J. I. A., Moore, D. J. P., Burns, S. P., and Monson, R. K. (2010). Longer growing seasons lead to less carbon sequestration by a subalpine forest. Glob. Change Biol. 16, 771–783. doi: 10.1111/j.1365-2486.2009.01967.x
Ji, L., and Brown, J. F. (2017). Effect of NOAA satellite orbital drift on AVHRR-derived phenological metrics. Int. J. Appl. Earth Obs. Geoinf. 62, 215–223. doi: 10.1016/j.jag.2017.06.013
Jones, M. O., Allred, B. W., Naugle, D. E., Maestas, J. D., Donnelly, P., Metz, L. J., et al. (2018). Innovation in rangeland monitoring: Annual, 30 m, plant functional type percent cover maps for U.S. rangelands, 1984-2017. Ecosphere 9:e02430. doi: 10.1002/ecs2.2430
Jones, M. O., Robinson, N. P., Naugle, D. E., Maestas, J. D., Reeves, M. C., Lankston, R. W., et al. (2021). Annual and 16-day rangeland production estimates for the western United States. Rangel Ecol. Manag. 77, 112–117. doi: 10.1016/j.rama.2021.04.003
Jung, M., Reichstein, M., Schwalm, C. R., Huntingford, C., Sitch, S., Ahlstrom, A., et al. (2017). Compensatory water effects link yearly global land CO2 sink changes to temperature. Nature 541, 516–520. doi: 10.1038/nature20780
Kannenberg, S. A., Novick, K. A., Alexander, M. R., Maxwell, J. T., Moore, D. J. P., Phillips, R. P., et al. (2019). Linking drought legacy effects across scales: From leaves to tree rings to ecosystems. Glob. Change Biol. 25, 2978–2992. doi: 10.1111/gcb.14710
Kannenberg, S. A., Schwalm, C. R., Anderegg, W. R. L., and Rejmanek, M. (2020). Ghosts of the past: How drought legacy effects shape forest functioning and carbon cycling. Ecol. Lett. 23, 891–901. doi: 10.1111/ele.13485
Knapp, A. K., Carroll, C. J. W., Denton, E. M., La Pierre, K. J., Collins, S. L., and Smith, M. D. (2015). Differential sensitivity to regional-scale drought in six central US grasslands. Oecologia 177, 949–957. doi: 10.1007/s00442-015-3233-6
Knapp, A. K., Chen, A., Griffin-Nolan, R. J., Baur, L. E., Carroll, C. J. W., Gray, J. E., et al. (2020). Resolving the dust bowl paradox of grassland responses to extreme drought. Proc. Natl. Acad. Sci. U.S.A. 117, 22249–22255. doi: 10.1073/pnas.1922030117
Konings, A. G., and Gentine, P. (2017). Global variations in ecosystem-scale isohydricity. Glob. Change Biol. 23, 891–905. doi: 10.1111/gcb.13389
Konings, A. G., Williams, A. P., and Gentine, P. (2017). Sensitivity of grassland productivity to aridity controlled by stomatal and xylem regulation. Nat. Geosci. 10, 284–288. doi: 10.1038/ngeo2903
Lian, X., Piao, S., Li, L. Z. X., Li, Y., Huntingford, C., Ciais, P., et al. (2020). Summer soil drying exacerbated by earlier spring greening of northern vegetation. Sci. Adv. 6:eaax0255. doi: 10.1126/sciadv.aax0255
Liu, Y., Schwalm, C. R., Samuels-Crow, K. E., Ogle, K., and Liu, L. (2019). Ecological memory of daily carbon exchange across the globe and its importance in drylands. Ecol. Lett. 22, 1806–1816. doi: 10.1111/ele.13363
Long, J. A., Lawrence, R. L., Greenwood, M. C., Marshall, L., and Miller, P. R. (2013). Object-oriented crop classification using multitemporal ETM+ SLC-off imagery and random forest. Gisci. Remote Sens. 50, 418–436. doi: 10.1080/15481603.2013.817150
Lubenow, D. R., and Reinhardt, K. (2020). The environmental drivers of annual variation in forest greenness are variable in the northern intermountain west, USA. Ecosphere 11:e03212. doi: 10.1002/ecs2.3212
Maurer, G. E., Hallmark, A. J., Brown, R. F., Sala, O. E., Collins, S. L., and Coulson, T. (2020). Sensitivity of primary production to precipitation across the United States. Ecol. Lett. 23, 527–536. doi: 10.1111/ele.13455
Miller, R. F., Chambers, J. C., Pyke, D. A., Pierson, F. B., and Williams, C. J. (2013). A review of fire effects on vegetation and soils in the great basin region: Response and ecological site characteristics. Gen. Tech. Rep. 126:308. doi: 10.2737/RMRS-GTR-308
Morisette, J. T., Richardson, A. D., Knapp, A. K., Fisher, J. I., Graham, E. A., Abatzoglou, J., et al. (2009). Tracking the rhythm of the seasons in the face of global change: Phenological research in the 21st century. Front. Ecol. Environ. 7, 253–260. doi: 10.1890/070217
Mulder, C. P. H., and Diggle, P. K. (2019). Diverse developmental responses to warming temperatures underlie changes in flowering phenologies. Integr. Comp. Biol. 59, 559–570. doi: 10.1093/icb/icz076
Neuwirth, E. (2014). RColorBrewer: Colorbrewer palettes. Version 1.1-2. Available online at: https://cran.r-project.org/package=RColorBrewer
Newman, E. A., Kennedy, M. C., Falk, D. A., and McKenzie, D. (2019). Scaling and complexity in landscape ecology. Front. Ecol. Evol. 7:293. doi: 10.3389/fevo.2019.00293
Oesterheld, M., Loreti, J., Semmartin, M., and Sala, O. E. (2001). Inter-annual variation in primary production of a semi-arid grassland related to previous-year production. J. Veg. Sci. 12, 137–142. doi: 10.1111/j.1654-1103.2001.tb02624.x
Ogle, K., Barber, J. J., Barron-Gafford, G. A., Bentley, L. P., Young, J. M., Huxman, T. E., et al. (2015). Quantifying ecological memory in plant and ecosystem processes. Ecol. Lett. 18, 221–235. doi: 10.1111/ele.12399
Oliveira, S., Oehler, F., San-Miguel-Ayanz, J., Camia, A., and Pereira, J. M. C. (2012). Modeling spatial patterns of fire occurrence in mediterranean Europe using multiple regression and random forest. For. Ecol. Manag. 275, 117–129. doi: 10.1016/j.foreco.2012.03.003
Omernik, J. M. (1987). Ecoregions of the conterminous United States. Ann. Assoc. Am. Geogr. 77, 118–125. doi: 10.1111/j.1467-8306.1987.tb00149.x
Or, D., and Lehmann, P. (2019). Surface evaporative capacitance: How soil type and rainfall characteristics affect global-scale surface evaporation. Water Resour. Res. 55, 519–539. doi: 10.1029/2018WR024050
Park, D. S., Newman, E. A., and Breckheimer, I. K. (2021). Scale gaps in landscape phenology: Challenges and opportunities. Trends Ecol. Evol. 36, 709–721. doi: 10.1016/j.tree.2021.04.008
Petrie, M., Brunsell, N., Vargas, R., Collins, S., Flanagan, L., Hanan, N., et al. (2016). The sensitivity of carbon exchanges in great plains grasslands to precipitation variability. J. Geophys. Res. Biogeosci. 121, 280–294. doi: 10.1002/2015JG003205
Piao, S., Wang, X., Park, T., Chen, C., Lian, X., He, Y., et al. (2019). Characteristics, drivers and feedbacks of global greening. Nat. Rev. Earth Environ. 1, 14–27. doi: 10.1038/s43017-019-0001-x
Picardi, S., Messmer, T., Crabb, B., Kohl, M., Dahlgren, D., Frey, N., et al. (2020). Predicting greater sage-grouse habitat selection at the southern periphery of their range. Ecol. Evol. 10, 13451–13463. doi: 10.1002/ece3.6950
Ponce-Campos, G. E., Moran, M. S., Huete, A., Zhang, Y., Bresloff, C., Huxman, T. E., et al. (2013). Ecosystem resilience despite large-scale altered hydroclimatic conditions. Nature 494, 349–352. doi: 10.1038/nature11836
Potter, C. (2020). Snowmelt timing impacts on growing season phenology in the northern range of yellowstone national park estimated from MODIS satellite data. Landsc. Ecol. 35, 373–388. doi: 10.1007/s10980-019-00951-3
R Core Team (2020). R: A language and environment for statistical computing. 4.0, 3rd Edn. Vienna: R Foundation for Statistical Computing.
Reed, B. C., Brown, J. F., VanderZee, D., Loveland, T. R., Merchant, J. W., and Ohlen, D. O. (1994). Measuring phenological variability from satellite imagery. J. Veg. Sci. 5, 703–714. doi: 10.2307/3235884
Reed, P. B., Pfeifer-Meister, L. E., Roy, B. A., Johnson, B. R., Bailes, G. T., Nelson, A. A., et al. (2019). Prairie plant phenology driven more by temperature than moisture in climate manipulations across a latitudinal gradient in the pacific northwest, USA. Ecol. Evol. 9, 3637–3650. doi: 10.1002/ece3.4995
Reeves, M. C., Hanberry, B. B., Wilmer, H., Kaplan, N. E., and Lauenroth, W. K. (2020). An assessment of production trends on the great plains from 1984 to 2017. Rangel Ecol. Manag. 78, 165–179. doi: 10.1016/j.rama.2020.01.011
Reeves, M. C., Moreno, A. L., Bagne, K. E., and Running, S. W. (2014). Estimating climate change effects on net primary production of rangelands in the United States. Clim. Change 126, 429–442. doi: 10.1007/s10584-014-1235-8
Reichmann, L. G., Sala, O. E., and Peters, D. P. (2013). Precipitation legacies in desert grassland primary production occur through previous-year tiller density. Ecology 94, 435–443. doi: 10.1890/12-1237.1
Ren, S., Li, Y., and Peichl, M. (2020). Diverse effects of climate at different times on grassland phenology in mid-latitude of the northern hemisphere. Ecol. Indic. 113:106260. doi: 10.1016/j.ecolind.2020.106260
Renner, S. S., and Zohner, C. M. (2018). Climate change and phenological mismatch in trophic interactions among plants. Insects, and vertebrates. Annu. Rev. Ecol. Evol. Syst. 49, 165–182. doi: 10.1146/annurev-ecolsys-110617-062535
Richardson, A. D., Keenan, T. F., Migliavacca, M., Ryu, Y., Sonnentag, O., and Toomey, M. (2013). Climate change, phenology, and phenological control of vegetation feedbacks to the climate system. Agric. For. Meteorol. 169, 156–173. doi: 10.1016/j.agrformet.2012.09.012
Rondeau, R. J., Decker, K. L., and Doyle, G. A. (2018). Potential consequences of repeated severe drought for shortgrass steppe species. Rangel Ecol. Manag. 71, 91–97. doi: 10.1016/j.rama.2017.07.002
Sala, O. E., Gherardi, L. A., Reichmann, L., Jobbagy, E., and Peters, D. (2012). Legacies of precipitation fluctuations on primary production: Theory and data synthesis. Philos. Trans. R. Soc. Biol. Sci. 367, 3135–3144. doi: 10.1098/rstb.2011.0347
Samson, F. B., Knopf, F. L., and Ostlie, W. R. (2004). Great plains ecosystems: Past, present, and future. Wildl. Soc. Bull. 32, 6–15. doi: 10.2193/0091-7648(2004)32[6:GPEPPA]2.0.CO;2
Scholes, R. J. (2017). Taking the mumbo out of the jumbo: Progress towards a robust basis for ecological scaling. Ecosystems 20, 4–13. doi: 10.1007/s10021-016-0047-2
Seaber, P. R., Kapinos, F. P., and Knapp, G. L. (1987). Hydrologic unit maps. Denver, CO: U.S. Geological Survey.
Smart, A. J., Dunn, B. H., Johnson, P. S., Xu, L., and Gates, R. N. (2007). Using weather data to explain herbage yield on three great plains plant communities. Rangel Ecol. Manag. 60, 146–153. doi: 10.2111/05-099R4.1
Smith, W. K., Dannenberg, M. P., Yan, D., Herrmann, S., Barnes, M. L., Barron-Gafford, G. A., et al. (2019). Remote sensing of dryland ecosystem structure and function: Progress, challenges, and opportunities. Remote Sens. Environ. 233:111401. doi: 10.1016/j.rse.2019.111401
Soetaert, K. (2017). plot3D: Plotting multi-dimensional data. Version 1.3. Available online at: https://CRAN.R-project.org/package=plot3D
Soil Survey Staff (2017). Gridded soil survey geographic (gSSURGO) database for the conterminous United States. Available online at: https://gdg.sc.egov.usda.gov/ (accessed March 20, 2019).
Stevenson, T. J., Visser, M. E., Arnold, W., Barrett, P., Biello, S., Dawson, A., et al. (2015). Disrupted seasonal biology impacts health, food security and ecosystems. Proc. R. Soc. Biol. Sci. 282:20151453. doi: 10.1098/rspb.2015.1453
Stoy, P. C., Ahmed, S., Jarchow, M., Rashford, B., Swanson, D., Albeke, S., et al. (2018). Opportunities and trade-offs among BECCS and the food, water, energy, biodiversity, and social systems nexus at regional scales. BioScience 68, 100–111. doi: 10.1093/biosci/bix145
Swets, D. L. (1999). “A weighted least-squares approach to temporal smoothing of NDVI,” in Proceedings of the 1999 ASPRS annual conference, from image to information, (Bethesda, MD: American society for photogrammetry and remote sensing).
Templ, B., Fleck, S., and Templ, M. (2016). Change of plant phenophases explained by survival modeling. Inter. J. Biometeorol. 61, 881–889. doi: 10.1007/s00484-016-1267-z
Tilman, D., and El Haddi, A. (1992). Drought and biodiversity in grasslands. Oecologia 89, 257–264. doi: 10.1007/BF00317226
USDA Natural Resources Conservation Service (2006). Land resource regions and major land resource areas of the United States, the Caribbean, and the Pacific basin. Washington, DC: U.S. Dept. of Agriculture, Natural Resources Conservation Service.
Vanderhoof, M. K., Hawbaker, T. J., Ku, A., Merriam, K., Berryman, E., and Cattau, M. (2020). Tracking rates of postfire conifer regeneration vs. Deciduous vegetation recovery across the western United States. Ecol. Appl. 31:e02237. doi: 10.1002/eap.2237
Vermeire, L. T., and Russell, M. L. (2018). Seasonal timing of fire alters biomass and species composition of Northern Mixed Prairie. Rangel Ecol. Manag. 71, 714–720. doi: 10.1016/j.rama.2018.06.005
Villoslada, M., Bergamo, T. F., Ward, R. D., Burnside, N. G., Joyce, C. B., Bunce, R. G. H., et al. (2020). Fine scale plant community assessment in coastal meadows using UAV based multispectral data. Ecol. Indic. 111, 1–13. doi: 10.1016/j.ecolind.2019.105979
Wang, J., Price, K. P., and Rich, P. M. (2001). Spatial patterns of NDVI in response to precipitation and temperature in the central great plains. Inter. J. Remote Sens. 22, 3827–3844. doi: 10.1080/01431160010007033
Wang, J., Zhang, X., and Rodman, K. (2021). Land cover composition, climate, and topography drive land surface phenology in a recently burned landscape: An application of machine learning in phenological modeling. Agric. For. Meteorol. 304–305:108432. doi: 10.1016/j.agrformet.2021.108432
Wang, X., Piao, S., Ciais, P., Li, J., Friedlingstein, P., Koven, C., et al. (2011). Spring temperature change and its implication in the change of vegetation growth in North America from 1982 to 2006. Proc. Natl. Acad. Sci. U.S.A. 108, 1240–1245. doi: 10.1073/pnas.1014425108
Webb, W., Szarek, S., Lauenroth, W., Kinerson, R., and Smith, M. (1978). Primary productivity and water use in native forest, grassland, and desert ecosystems. Ecology 59, 1239–1247. doi: 10.2307/1938237
Welty, J. L., Pilliod, D. S., and Arkle, R. S. (2017). Combined wildfire dataset for the United States and certain territories, 1870-2015: U.S. Reston, VA: Geological Survey.
Wessels, K., Steenkamp, K., von Maltitz, G., and Archibald, S. (2011). Remotely sensed vegetation phenology for describing and predicting the biomes of South Africa. Appl. Veg. Sci. 14, 49–66. doi: 10.1111/j.1654-109X.2010.01100.x
Wickham, J., Homer, C., Vogelmann, J., McKerrow, A., Mueller, R., Herold, N., et al. (2014). The multi-resolution land characteristics (MRLC) consortium–20 years of development and integration of USA national land cover data. Remote Sens. 6, 7424–7441. doi: 10.3390/rs6087424
Wonkka, C. L., Twidwell, D., Allred, B. W., Bielski, C. H., Donovan, V. M., Roberts, C. P., et al. (2019). Rangeland vulnerability to state transition under global climate change. Clim. Change 153, 59–78. doi: 10.1007/s10584-018-02365-7
Wood, D. J. A., Powell, S., Stoy, P. C., Thurman, L. L., and Beever, E. A. (2021). Is the grass always greener? Land surface phenology reveals differences in peak and season-long vegetation productivity responses to climate and management. Ecol. Evol. 11, 11168–11199. doi: 10.1002/ece3.7904
Wood, D. J. A., Seipel, T., Irvine, K. M., Rew, L. J., and Stoy, P. C. (2019). Fire and development influences on sagebrush community plant groups across a climate gradient in northern Nevada. Ecosphere 10:e02990. doi: 10.1002/ecs2.2990
Wood, D. J. A., Stoy, P. C., Powell, S. L., and Beever, E. A. (2022). Model performance and output variables for phenological events across land cover types in the northwestern plains, 1989-2014. Reston, VA: U.S. Geological Survey.
Wright, M. N., and Ziegler, A. (2017). Ranger: A fast implementation of random forests for high dimensional data in C++ and R. J. Stat. Softw. 77, 1–17. doi: 10.18637/jss.v077.i01
Xia, J., Niu, S., Ciais, P., Janssens, I. A., Chen, J., Ammann, C., et al. (2015). Joint control of terrestrial gross primary productivity by plant phenology and physiology. Proc. Natl. Acad. Sci. U.S.A. 112, 2788–2793. doi: 10.1073/pnas.1413090112
Yahdjian, L., and Sala, O. E. (2006). Vegetation structure constrains primary production response to water availability in the Patagonian steppe. Ecology 87, 952–962. doi: 10.1890/0012-9658(2006)87[952:VSCPPR]2.0.CO;2
Yang, L., Guan, Q., Lin, J., Tian, J., Tan, Z., and Li, H. (2021). Evolution of NDVI secular trends and responses to climate change: A perspective from nonlinearity and nonstationarity characteristics. Remote Sens. Environ. 254:112247. doi: 10.1016/j.rse.2020.112247
Yang, L., Jin, S., Danielson, P., Homer, C., Gass, L., Bender, S. M., et al. (2018). A new generation of the United States national land cover database: Requirements, research priorities, design, and implementation strategies. ISPRS J. Photogramm. Remote Sens. 146, 108–123. doi: 10.1016/j.isprsjprs.2018.09.006
Yuan, W., Zheng, Y., Piao, S., Ciais, P., Lombardozzi, D., Wang, Y., et al. (2019). Increased atmospheric vapor pressure deficit reduces global vegetation growth. Sci. Adv. 5:eaax1396. doi: 10.1126/sciadv.aax1396
Zhang, B., Cadotte, M. W., Chen, S., Tan, X., You, C., Ren, T., et al. (2019). Plants alter their vertical root distribution rather than biomass allocation in response to changing precipitation. Ecology 100:e02828. doi: 10.1002/ecy.2828
Zhang, Q., Ficklin, D., Manzoni, S., Wang, L., Way, D., Phillips, R., et al. (2019). Response of ecosystem intrinsic water use efficiency and gross primary productivity to rising vapor pressure deficit. Environ. Res. Lett. 14:074023. doi: 10.1088/1748-9326/ab2603
Zhang, X., Liu, L., and Henebry, G. M. (2019). Impacts of land cover and land use change on long-term trend of land surface phenology: A case study in agricultural ecosystems. Environ. Res. Lett. 14:044020. doi: 10.1088/1748-9326/ab04d2
Keywords: climate variability, legacy impacts, Northwestern Great Plains, random forests, hysteresis, restoration timing, grassland, shrubland
Citation: Wood DJA, Stoy PC, Powell SL and Beever EA (2022) Antecedent climatic conditions spanning several years influence multiple land-surface phenology events in semi-arid environments. Front. Ecol. Evol. 10:1007010. doi: 10.3389/fevo.2022.1007010
Received: 29 July 2022; Accepted: 12 September 2022;
Published: 06 October 2022.
Edited by:
Xuezhen Zhang, Institute of Geographic Sciences and Natural Resources Research (CAS), ChinaReviewed by:
Fang Huang, Northeast Normal University, ChinaJianmin Wang, South Dakota State University, United States
Copyright © 2022 Wood, Stoy, Powell and Beever. This is an open-access article distributed under the terms of the Creative Commons Attribution License (CC BY). The use, distribution or reproduction in other forums is permitted, provided the original author(s) and the copyright owner(s) are credited and that the original publication in this journal is cited, in accordance with accepted academic practice. No use, distribution or reproduction is permitted which does not comply with these terms.
*Correspondence: David J. A. Wood, ZGp3b29kQGJsbS5nb3Y=
†Present address: David J. A. Wood, Bureau of Land Management, Montana/Dakotas State Office, Billings, MT, United States