 Dongjie Zhang
 Jiangbao Xia
 Jingkuan Sun1
 Pengshuai Shao
 Shouzheng Tong
- 1Shandong Key Laboratory of Eco-Environmental Science for Yellow River Delta, Binzhou University, Binzhou, China
- 2The Institute for Advanced Study of Coastal Ecology, Key Laboratory of Ecological Restoration and Conservation of Coastal Wetlands in Universities of Shandong, Ludong University, Yantai, China
- 3Northeast Institute of Geography and Agroecology, Chinese Academy of Sciences, Changchun, China
Plant nutrient trade-off, a growth strategy, regulates nutrient stoichiometry, allocation and stoichiometric relationships, which is essential in revealing the stoichiometric mechanism of wetland plants under environmental fluctuations. Nonetheless, how wetland restoration and degradation affect nutrient trade-off of wetland plants was still unclear. In this study, field experiments were conducted to explore the dynamic of nutrient stoichiometry and nutrient limitation of Carex schmidtii under wetland restoration and degradation. Plant nutrient stoichiometry and stoichiometric relationships among natural (NW), restored (RW), and degraded (DW) tussock wetlands were examined. Results showed that nutrient stoichiometry of C. schmidtii was partly affected by wetland restoration and degradation, and growth stages. The N:P and N:K ratios indicated N-limitation for the growth of C. schmidtii. Robust stoichiometric scaling relationships were quantified between some plant nutrient concentrations and their ratios of C. schmidtii. Some N- and P-related scaling exponents are varied among NW, RW, and DW. PCA indicated that wetland restoration and degradation had significantly affected on the nutrient trade-offs of C. schmidtii (May∼August). Compared to NW, nutrient trade-off in RW was more similar to DW. Carex schmidtii had significant correlation between most nutrients and their ratios, and the SEM indicated that plant P and K concentrations had a high proportional contribution to plant C and N concentrations. Insights into these aspects are expected to contribute to a better understanding of nutrient trade-off of C. schmidtii under wetland restoration and degradation, providing invaluable information for the protection of C. schmidtii tussock wetlands.
Introduction
Plant nutrient trade-off focus on the mass balance of multiple elements and nutrient distribution and stoichiometric relationships, controlling plant growth and eco-physiological responses to environmental fluctuations in wetland ecosystems (Elser et al., 2000; Güsewell and Koerselman, 2002; He et al., 2019; Chen et al., 2020). Biomass nutrient stoichiometry indicates the limits of elements on plant growth and explains plant functional diversity, community structure, and vegetation patterns based on the availability of nutrients (Busch et al., 2018; Peng et al., 2019; Yu et al., 2020; Sardans et al., 2021). Dynamic nutrient stoichiometry, availability, and limitation imply plant nutrition status at different growth stages (Zhang et al., 2019a; Bratt et al., 2020). Plant nutrient trade-off and stoichiometric relationship regarding biomass nutrients can regulate the dynamic equilibrium of nutrients and maintain the stoichiometric homeostasis or flexibility in plants and the ecosystem (Wright et al., 2004; Yu et al., 2015; Tian et al., 2018). Therefore, the research on plant nutrient trade-off helps clarify the mechanism of stoichiometric homeostasis or flexibility and nutrient balance of wetland plants under environmental fluctuations.
Carbon (C), nitrogen (N), phosphorus (P), and potassium (K) are the main biogenic elements and composition element of plant organisms (Lawniczak et al., 2010; Wright et al., 2011; Rong et al., 2015; Chiwa et al., 2019; Wan et al., 2020). Plant C concentration is closely related to carbon fixation during photosynthesis (Hartmann et al., 2020). N and P, as essential components of higher plants, provide source elements for the synthesis and transformation of protein and nucleic acids (Elser et al., 1996; Huang et al., 2021). Previous studies reported that approximately 75% of a leaf’s organic N concentrated in chlorophyll, thylakoid proteins, and associated cofactors and enzymes (Loomis, 1997). Phosphorus, in form of phosphate, ATP, and phospholipid, is the main components of the nucleus and has profound effects on plant eco-physiological processes (Elser et al., 1996; Ghimire et al., 2017). K is involved in the production, transportation and storage of carbohydrates in plants, playing a role in leaf turgor maintenance and promoting protein synthesis and activating certain enzymes or coenzymes (Gierth and Mäser, 2007; Chiwa et al., 2019). Previous studies have reported that C, N, P, and their ratios are closely associated with plant growth and adaptation to environmental changes (Rong et al., 2015; Pan et al., 2020; Zhang et al., 2021a). However, limited studies focused on the roles that the stoichiometric relationship between K and other nutrient elements in the adaption mechanism of plants to environmental stresses in restored and degraded wetlands.
Nutrient availability and limitation drive ecosystem development, affecting species competition of the vegetation and plant growth (Güsewell and Koerselman, 2002; Zhang et al., 2019a). The N:P ratio and N:K ratio regulate plant eco-physiological processes and resource acquisition (Koerselman and Meuleman, 1996; Hoosbeek et al., 2002; Peng et al., 2019), the dynamic change of which can also precisely reflect the gradual nutrient limitation and shifts in nutrient availability. Koerselman and Meuleman (1996) reported that the N:P ratio < 14 indicates N limitation and N:P ratio > 16 indicates P limitation, while 14 < N:P ratio < 16 indicates co-limitation of N and P. Similarly, N:K ratio < 1.2 indicates that the N limitation and N:K ratio > 1.4 indicates K limitation for plant growth (Hoosbeek et al., 2002). There have been a number of studies that investigated the nutrient availability and limitation of wetland plants across species at a global or zonal scale (Güsewell et al., 2003; Tian et al., 2018), but the nutrient limitation for the growth of single species at different growth stages in wetland system, especially in restored and degraded wetlands has received limited attention.
Nutrient trade-off regulates C, N, P, K, affecting nutrient availability and limitation of plants (Rong et al., 2015; Branco et al., 2018; Zhang et al., 2021a). Nutrient trade-off in the soil-plant system determines nutrient capture and usage of wetland plants, as well as control plant growth and community functioning (Van de Waal et al., 2010; Song et al., 2014). Additionally, nutrient trade-off is closely related to the ability of the plant to maintain stoichiometric homoeostasis despite changes in environmental gradients (Yu et al., 2011). It was reported that the strong stoichiometric relationships between plant nutrients and their ratios could be quantified by a power function as i = βjα, where i and j indicate plant nutrient concentrations and their ratios, respectively; α and β indicate the scaling exponent and normalization constant, which are the slope and the “elevation” or Y-intercept of the log-log linear i vs. j regression line, respectively (Wright et al., 2004; Reich et al., 2010; Tian et al., 2018). The scaling exponent α was widely applied to quantified the stoichiometric relationship between N and P across species under multiple nutrient environments (Tian et al., 2019; Guo et al., 2020; Zhao et al., 2021). However, limited studies focus on the scaling exponent related to C and K.
Momoge Wetland Nature Reserve (MWNR), an international wetland, appeals to a variety of rare birds like white stork, northern goshawk, lesser kestrel, and white-naped crane (Jiang et al., 2016; Ding et al., 2021). Carex schmidtii, a native tussock-forming species, is widely distributed in the riparian wetland along the Nenjiang River in MWNR (Zhang et al., 2019b; Qi et al., 2021a), which has abundant root systems and storage of biological elements (i.e., C, N, P, Si), and was capable of supporting a rich plant diversity (Lawrence and Zedler, 2011; Opdekamp et al., 2012; Zhang et al., 2019a; Qi et al., 2021a). Therefore, C. schmidtii tussock wetlands play important roles in nutrient cycling and biodiversity supporting. However, C. schmidtii tussocks are degrading on this area due to climate change and human activities (Pan et al., 2006; Zhang et al., 2019a; Qi et al., 2021b) and the management and conservation of tussock wetlands has become an urgent necessity. In recent years, with the strengthening of wetland conservation in China, many wetland restoration projects have been implemented, and comprehensive and deepening wetland restoration and protection are further developed for tussock wetlands (Guo et al., 2016; Zhang et al., 2019b; Qi et al., 2021c). Wetland restoration engineering has been conducted to restore tussocks, especially in semi-arid zones, utilizing seedbanks, transplanting rhizomes, creating microtopography, and regulating hydrological conditions (Zhang et al., 2019b; Wang M. et al., 2020; Qi et al., 2021c). It is recorded that a restoration project was conducted in 2008 by planting C. schmidtii tussocks, and significant recovery effect was achieved in the initial stage of restoration project. After 10 years, biodiversity and plant growth performance have been well investigated (Zhang et al., 2021b). However, despite the importance of nutrient trade-off for the ecological adaptation of wetland species, how plant C, N, P, and K of C. schmidtii respond to wetland restoration and degradation is still unclear. Meanwhile, the variation of plant nutrient trade-off of C. schmidtii during growth stages also need to be identified.
Previous studies have advanced the understanding of eco-physiological responses and growth of C. schmidtii to environmental fluctuations (Yan et al., 2015; Zhang et al., 2019b). The structure and biodiversity of C. schmidtii community under multiple environments was also evaluated to imply the restoration of tussock wetlands (Guo et al., 2016; Qi et al., 2021c). However, nutrient limitation and trade-off of wetland plants, especially C. schmidtii in restored (RW) and degraded (DW) tussock wetlands have received limited attention. In this study, plant samples were collected, and C, N, P, and K of C. schmidtii were determined. The purposes of this study are: (1) to examine nutrient stoichiometry of C. schmidtii at the entire growth stages; (2) to identify how wetland restoration and degradation alter nutrient stoichiometry and scaling exponents of C. schmidtii; (3) to reveal nutrient limitation and trade-off of C. schmidtii in RW and DW. Three hypotheses were made: (1) Wetland restoration and degradation significantly affected the nutrient trade-off of C. schmidtii; (2) Wetland restoration relieved the nutrient limitation for the growth of C. schmidtii compared to DW; (3) The development of nutrient balance achieved in RW with reference to natural tussock wetland (NW) is opposite of that in DW. The findings of nutrient stoichiometry and stoichiometric relationship of C. schmidtii are expected to help protect and manage C. schmidtii tussock wetlands.
Materials and Methods
Study Area
The study area is in the eastern of MWNR (45°42′– 46°18′N, 122°27′–124°04′E) in Jilin province, Northeast China. The MWNR characterized by a continental monsoon climate, covers a total area of 1.44 × 10³ km2 with the mean annual temperature of 4.2°C and a frost-free period of 160 days. The mean annual precipitation is approximately 412 mm and 70–80% of the precipitation falls in July and August. Dominant soil types are marsh and meadow soil. The typical marsh plants are Phragmites australis, Typha orientalis, Bolboschoenus planiculmis, C. schmidtii, Deyeuxia angustifolia, Suaeda glauca, and Trapa japonica (Ding et al., 2021; Qi et al., 2021a).
Carex schmidtii tussocks were widely distributed in the riparian wetland along the downstream of the Nenjiang River in MNNR. However, a large area of C. schmidtii tussock wetland degraded due to climate change and human activity. Therefore, wetland restoration was conducted in this area, and C. schmidtii tussock was recognized as the prior choice for the wetland restoration (Zhang et al., 2019b). C. schmidtii tussocks were collected from local wetlands and cut into uniform pieces. The ridge and furrow micro-topography were artificially constructed in degraded wetland, and C. schmidtii tussocks were uniformly planted on the ridge at a density of 9 tussocks/m2 in the spring of 2008 (Qi et al., 2021c; Zhang et al., 2021b), and then the area of RW was 0.08 km2 after 10 years’ natural restoration (Figure 1B). Moreover, NW (Figure 1A) without anthropogenic disturbance and DW (Figure 1C) were also selected to study the nutrient trade-off of C. schmidtii. Properties of soil nutrients and plant growth of C. schmidtii in this zone referred to Zhang et al. (2019a,2021b).
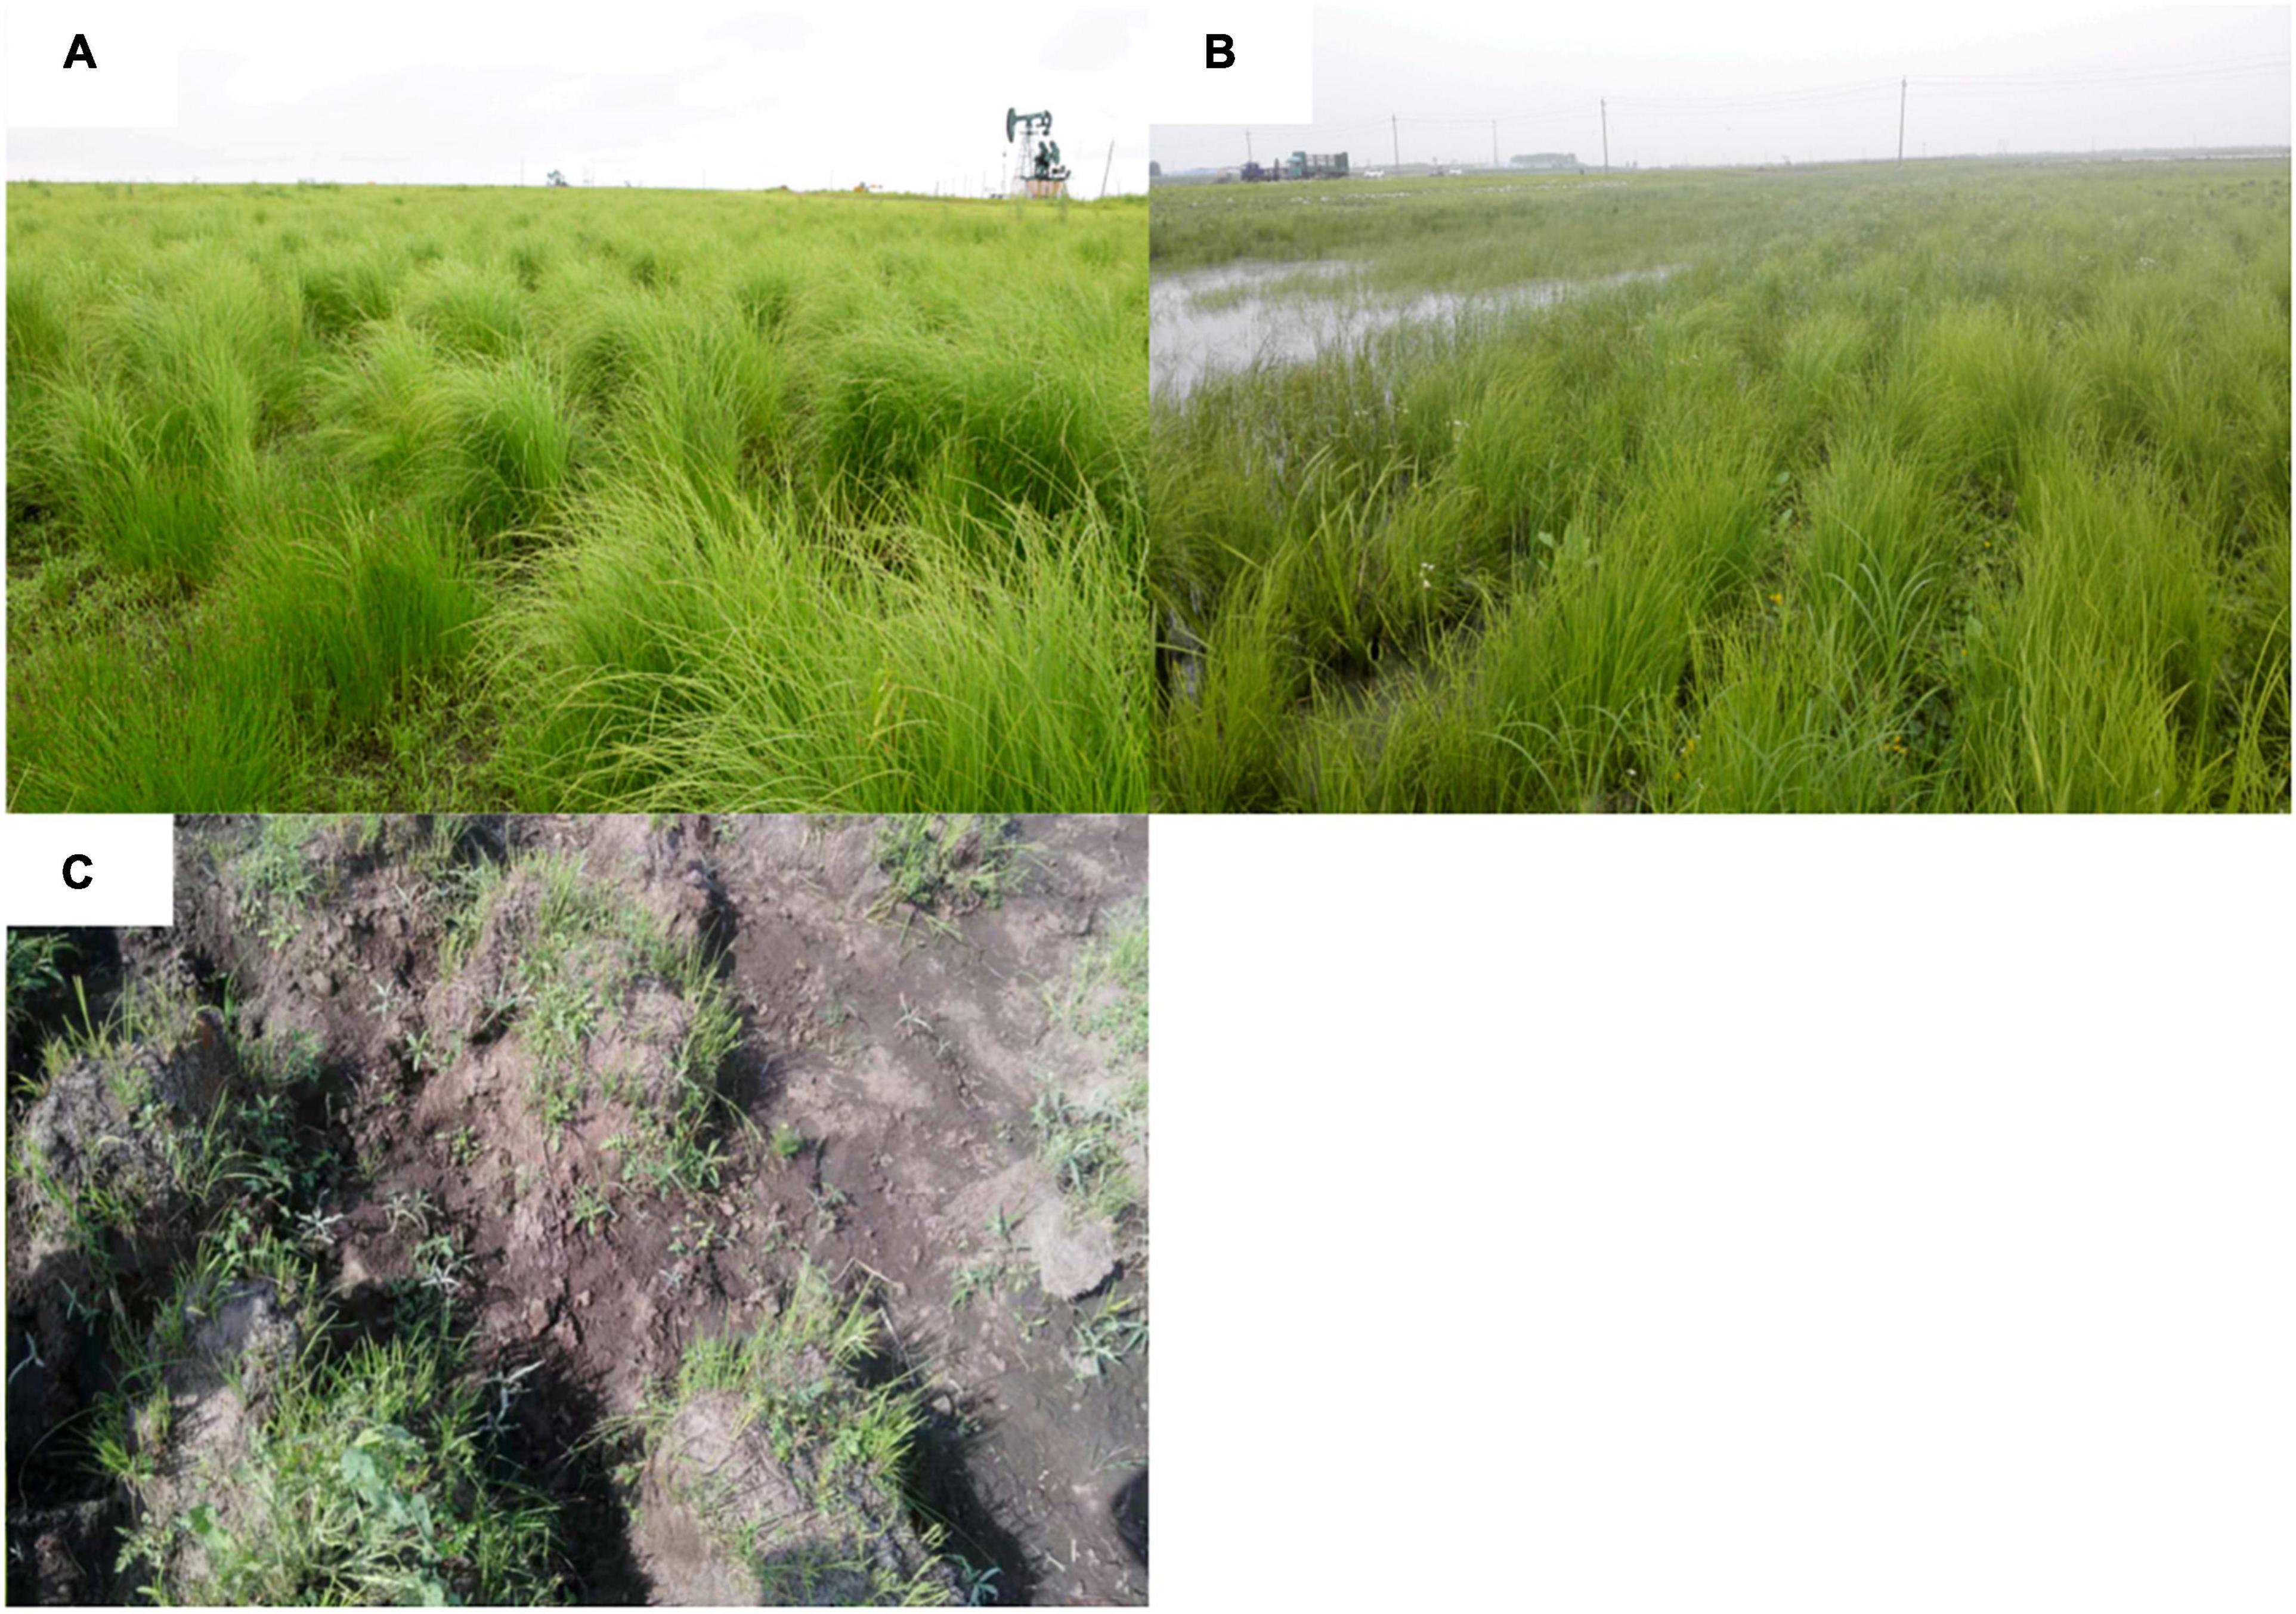
Figure 1. Carex schmidtii in natural (A), restored (B), and degraded (C) tussock wetlands (Zhang et al., 2021b).
Experiment Design and Field Sampling
A total of 2500 m2 sampling site was fixed in NW, RW, and DW, respectively. The landform of RW is gentle without water storage structure. The NW and DW closed to RW were selected. The landform of NW is typical saucer-shaped depressions without anthropogenic disturbance. The landform of DW, a damaged saucer depression whose hydrological connection with other wetlands was destroyed due to building roads, but the water storage structures (low-lying terrain gathering water) of DW remained. It is noted that serious drought occurred in RW from June to July referring to the average soil water content (Supplementary Figure 1). The soil water content was determined using five-point sampling method in sampling plot in the middle of each month. Considering the same climatic conditions in this zone, the absence of water storage structure and hydrological connection with other wetlands led to serious drought in RW. Field sampling was carried out every month from May to September. Three fixed experimental plots with 5 m × 5 m were set in the three wetlands (sampling site), respectively, and the distance of each experimental plot was 20 m. Aboveground biomass of C. schmidtii was gained in a 1 m × 1 m sample in each experimental plot (Zhang et al., 2021b). A total of fifteen samples were gained in each wetland during the entire growth stages (May∼ September).
Determination of C, N, P, and K Concentrations of Carex schmidtii
Plant samples collected from in NW, RW, and DW were killed at 120°C for 2 h, and dried at 65°C to a constant weight, and then ground into powder and sieved through a 0.25 mm sieve. Plant C concentration was measured with a TOC analyzer (Multi N/C 2100, Jena, Germany). Plant samples were digested by sulfuric acid (with a mass fraction (ω) of = 98% and a density (ρ) of 1.84 g/cm3) and hydrogen peroxide (ω = 30%; ρ = 1.13 g/cm3) at 375°C using a muffle furnace until the liquid was clear, and then the clear liquid was cooled to room temperature to make up the volume. Plant N and P concentrations were determined using Kjeldahl determination and the Molybdenum-Antimony-Spectropho-Tometric Method with an automatic chemistry analyzer (Smartchem 300, Advanced Monolithic Systems, Graz, Italy), respectively. Plant K concentration was determined with an atomic emission spectrophotometer (I-7500, Shimadzu, Japan; Zhang et al., 2021a). All nutrient ratios were calculated as mass ratios.
Data Analysis
Plant C, N, P, and K concentrations and their ratios were gain from the 1 m × 1 m sample in each experimental plot, and checked for normality and homogeneity before the further analyses. Plant P concentration was log-transformed to meet the normality. When the assumptions of homoscedasticity were not met, permutational ANOVA was implemented in R 4.0.1 (package “lmPerm”). Effect of growth stage on nutrient concentration and their ratios of C. schmidtii were evaluated using one-way analysis of variance (ANOVA), and fitting was applied to describe the relationship between nutrient stoichiometry. Duncan’s multiple range test was employed to determine the differences at the 0.05 significance level. In order to clarify how wetland restoration and degradation alter nutrient stoichiometry of C. schmidtii, the differences in the nutrient stoichiometry of C. schmidtii among NW, RW, and DW at each growth stage (Month) were examined with ANOVA. The nutrient stoichiometric relationships of C. schmidtii were determined using the general scaling function Lg i = α Lg j + β, where i and j indicate C, N, P, K concentrations and their ratios of C. schmidtii, respectively; α and β indicate the scaling exponent and normalization constant, which are the slope and the “elevation” or Y-intercept of the log-log linear i vs. j regression line, respectively (Tian et al., 2018; Zhang et al., 2021a). α < 1 indicates a faster change in an element concentration in proportion to other element concentration, vice versa when α > 1. Ordinary least square (OLS) regression was performed to determine the scaling relationship under different treatments (package “lmodel2” in R) among three tussock wetlands. The correlation between plant C, N, P, and K concentrations and their ratios of C. schmidtii were performed with R (“PerformanceAnalytics” package, “corrr” package). Principal component analysis (PCA) was performed to identify the difference of nutrient trade-offs among NW, RW, and DW using the “FactomineR” and “factoextra” packages in R. Structural equation model (SEM) analysis was performed to evaluate the pathways and flux between biomass nutrients and their ratios of C. schmidtii in R (“sem” package).
Results
Ecological Stoichiometry of Carex schmidtii and Its Dynamic
The mean values of C, N, P, and K concentrations of C. schmidtii in tussock wetland were 320.59 ± 9.34, 17.34 ± 1.08, 1.84 ± 0.16, 16.92 ± 1.03 mg g–1, respectively (Supplementary Table 1). The mean values of C:N, C:P, C:K, N:P, N:K, and K:P ratios were 21.62 ± 1.30, 222.66 ± 14.88, 22.51 ± 1.53, 10.10 ± 0.31, 1.07 ± 0.05, 10.11 ± 0.51, respectively. It is noted that the N:P ratio was < 14 and N:K ratio was < 1.2, indicating N-limitation for the growth of C. schmidtii.
Plant nutrients and their ratios were significantly affected by the growth stage except plant C concentration, N:K and K:P ratios (Supplementary Table 2 and Figure 2). The C:N ratio of C. schmidtii increased initially and then decreased with growth time (Figure 2E). Plant C:N ratio in May was 8.09, significantly lower than that in other 4 months (Figure 2E). The average value of C concentration and K:P ratio was 381.25 mg g–1 and 13.28 in July, 60.89% and 90.52% greater than that in May, respectively (Figures 2A,J). The highest plant N, P, and K concentrations were 29.88 mg g–1, 3.73 mg g–1, and 25.43 mg g–1 in May, and then significantly decreased over time (Figures 2B–D). The C:P, C:K, and N:P ratios were 65.13, 9.64, and 8.28 in May, respectively, and then increased during the following growth stages (Figures 2F–H). It is noted that the mean N:P ratio is < 14 in each month (Figure 2H). The N:K ratio of C. schmidtii decreased initially and then increased during the entire growth stages (Figure 2I). The N:K ratio in May and September was 1.21 and 1.30, respectively, but it was < 1.2 from June to August.
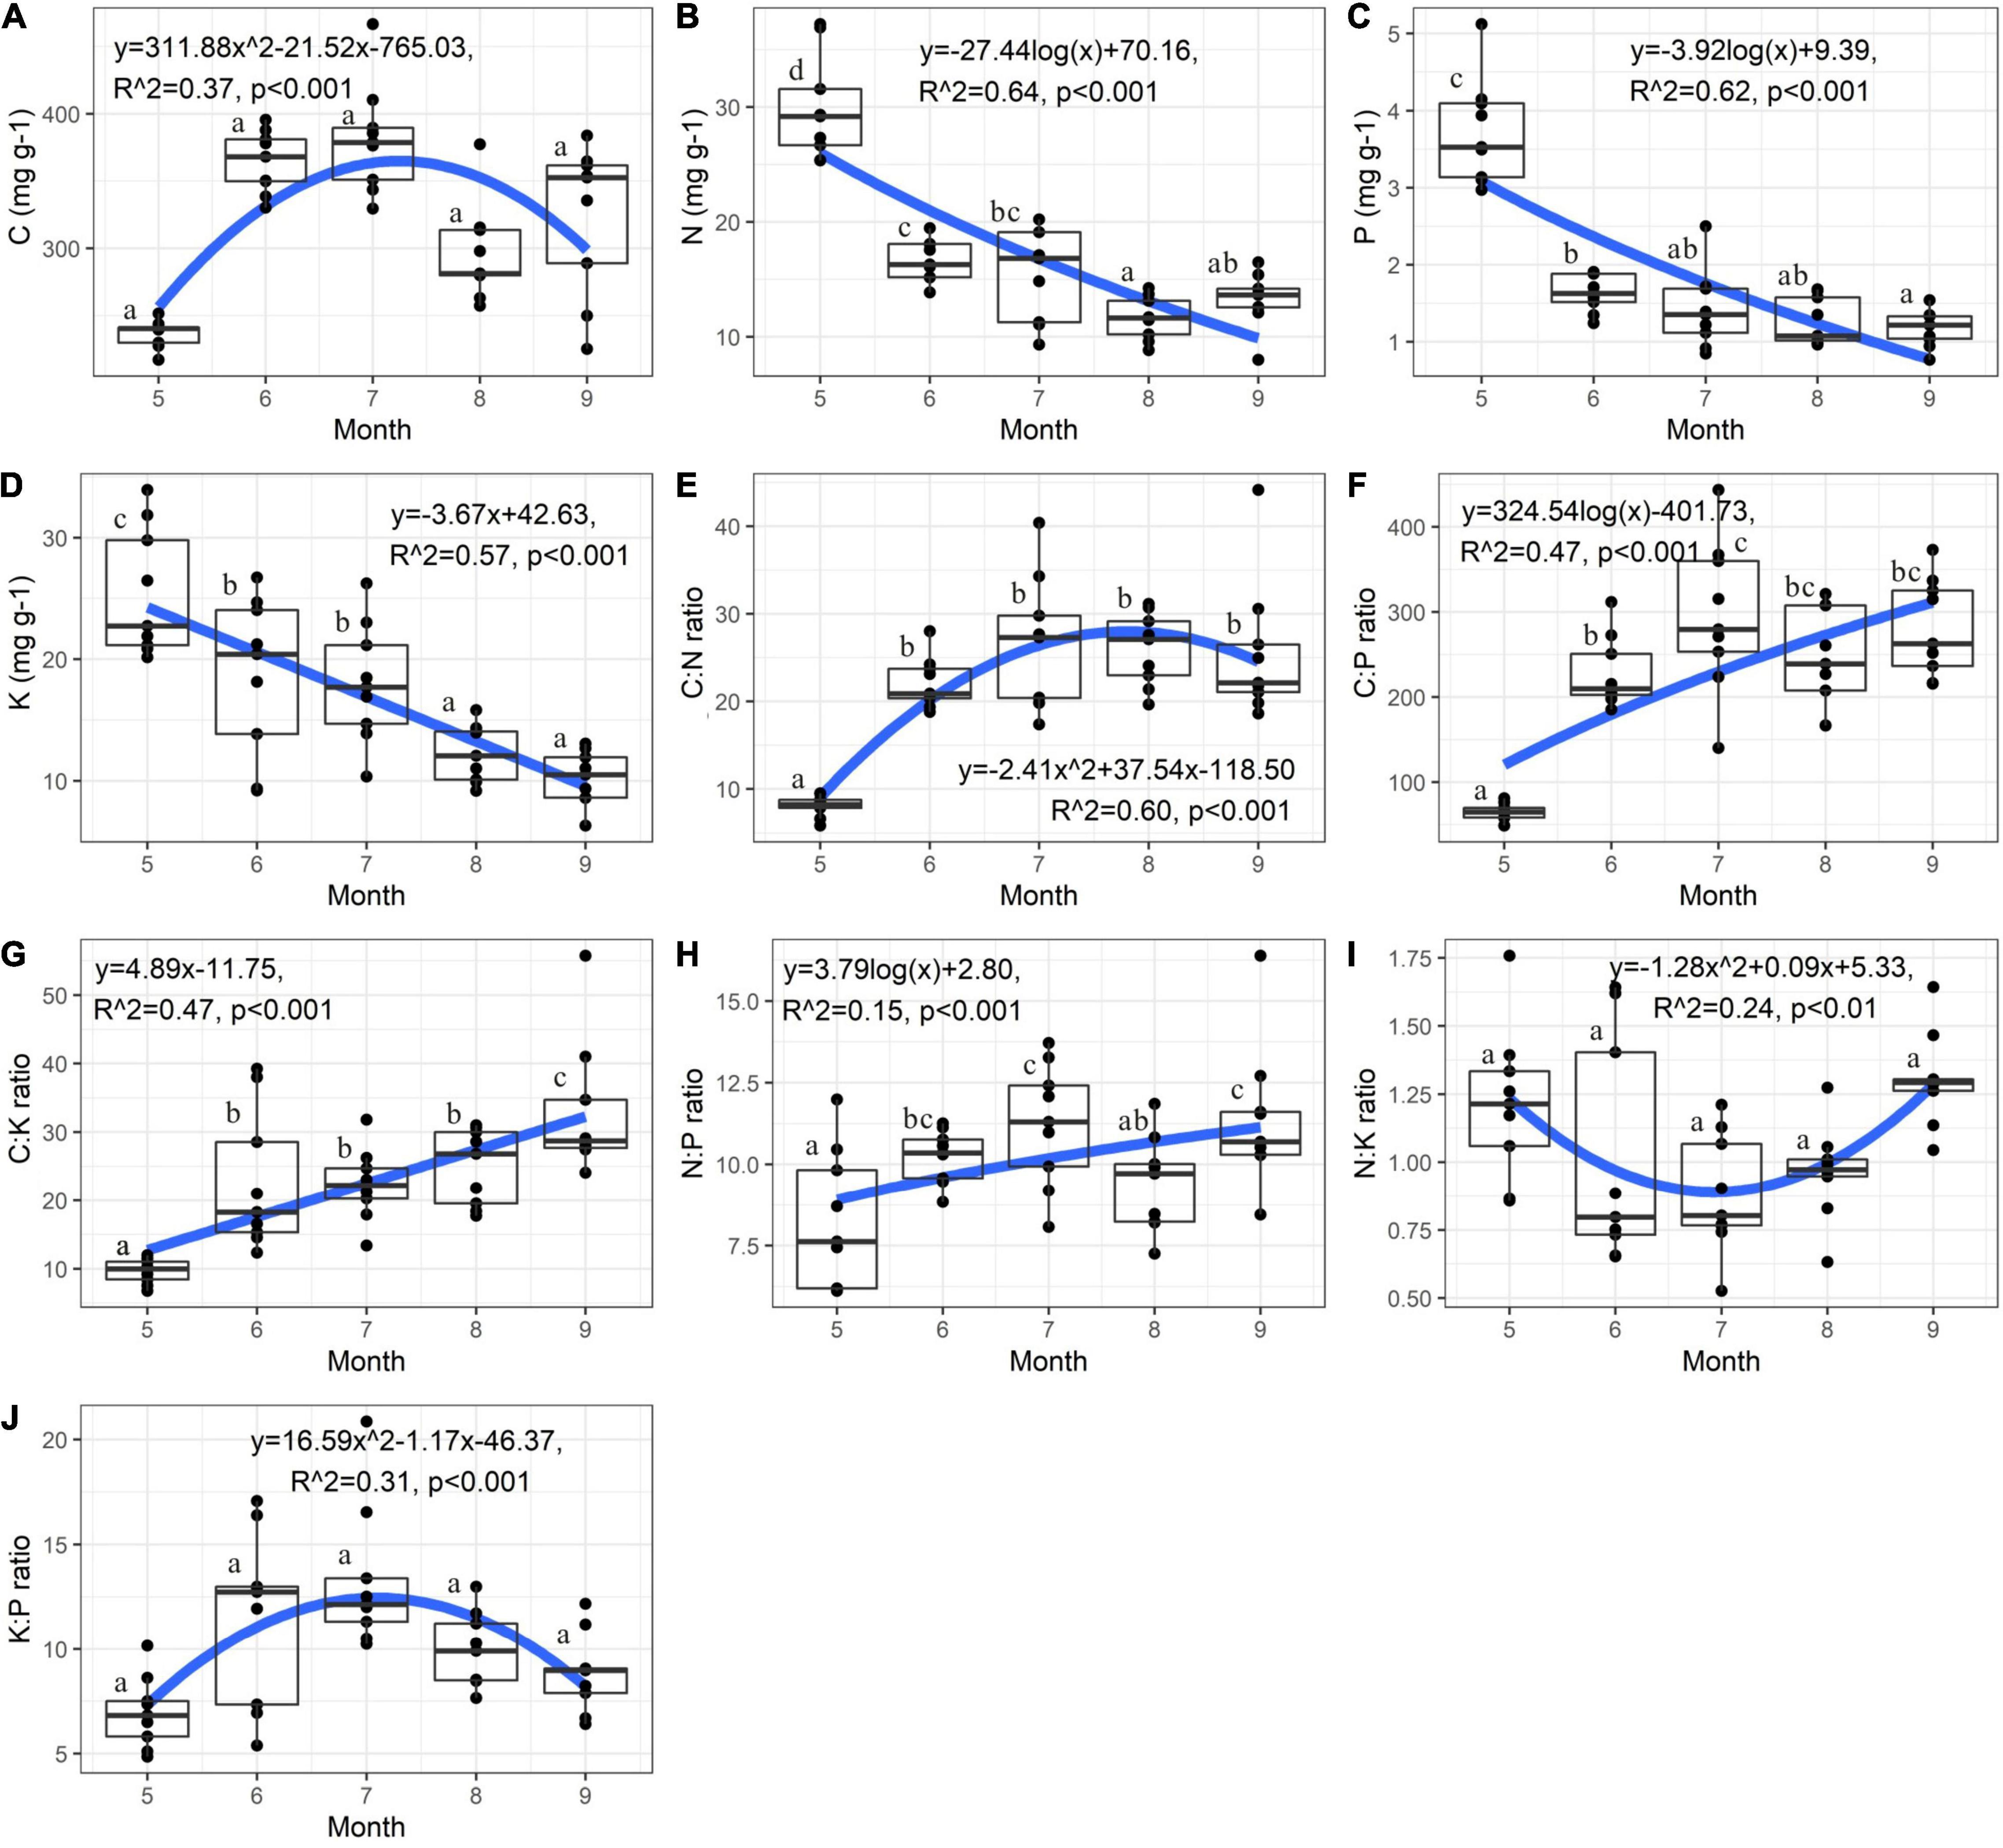
Figure 2. Variation of nutrient stoichiometry of Carex schmidtii at the entire growth stages. (A) C concentration, (B) N concentration, (C) P concentration, (D) K concentration, (E) C:N ratio, (F) C:P ratio, (G) C:K ratio, (H) N:P ratio, (I) N:K ratio, and (J) K:P ratio. Fitting was applied to describe the dynamic of nutrient. NW, Natural tussock wetland; RW, Restored tussock wetland; DW, Degraded tussock wetland.
Effects of Wetland Restoration and Degradation on Ecological Stoichiometry of Carex schmidtii at Each Growth Stage
Wetland restoration and degradation affected the N:P ratio of C. schmidtii in May significantly (Figure 3H and Table 1). The highest N:P ratio was 10.75 recorded in DW, 44.32% greater than the value in RW and 61.99% greater than the value in NW. In June, significant differences in K concentration, C:K, N:K, and K:P ratios were identified among NW, RW, and DW. Plant K concentration of C. schmidtii in DW was 25.15 mg g–1, higher than that in NW (10.81 mg g–1) and RW (19.93 mg g–1, Figure 3). The highest C:K ratio was 35.28 in NW, 1.90 times higher than that in RW and 2.51 times higher than that in DW. The N:K ratio, ranging from 0.71 to 1.56, displayed a pattern similar to the C:K ratio. Plant C concentration of C. schmidtii was significantly affected by wetland restoration and degradation in July (Figure 3). The mean C concentration of C. schmidtii was 411.60 mg g–1 in DW, 20.58% higher than the lowest C concentration of C. schmidtii in NW. There are significant differences in N and K concentrations of C. schmidtii among NW, RW, and DW in August (Figure 3). Plant N and K results recorded the highest value in DW with a value of 13.68 mg g–1 and 14.73 mg g–1, respectively. No significant differences in the nutrient stoichiometry of C. schmidtii were identified among the three wetlands in September. N:P ratio was < 14 in NW, RW, and DW every month. Moreover, N:K ratio of the three wetlands was between 1.2 and 1.4 in September, but less than 1.2 from May to August except for that in DW in May and that in NW in June.
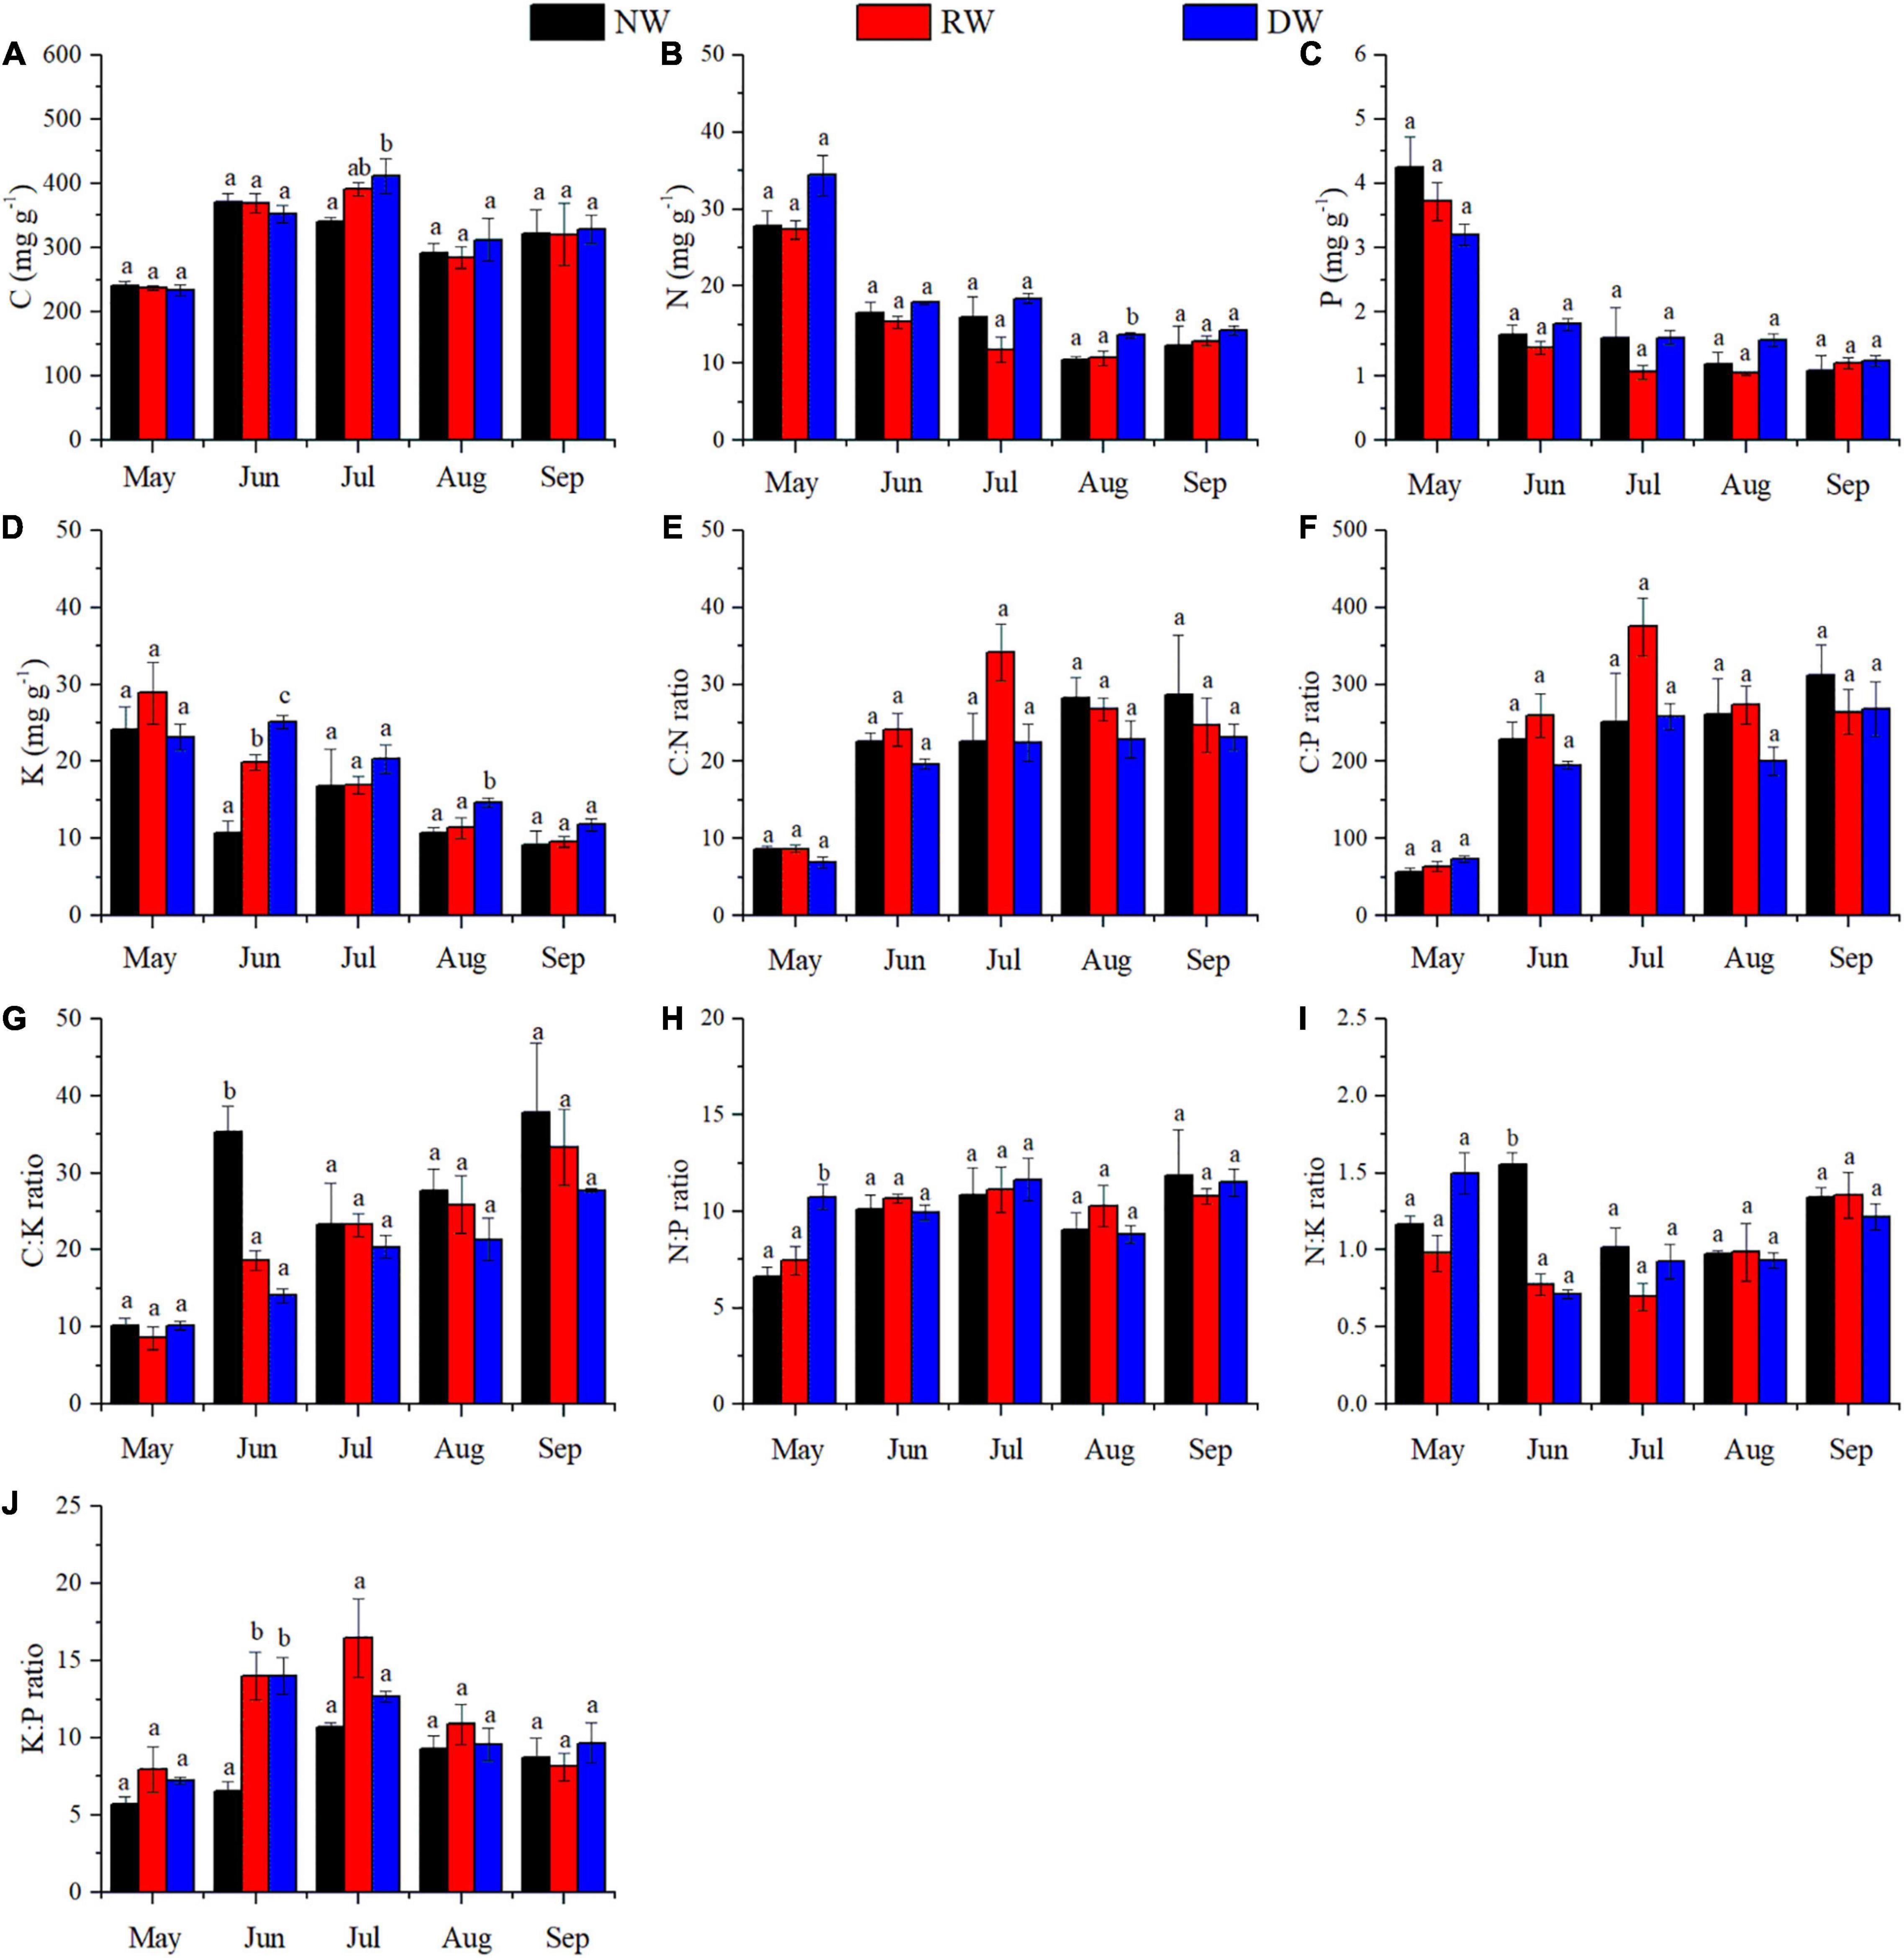
Figure 3. Effect of wetland restoration and degradation on C, N, P, and K stoichiometry of Carex schmidtii at the entire growth stages (means ± se, n = 3). (A) C concentration, (B) N concentration, (C) P concentration, (D) K concentration, (E) C:N ratio, (F) C:P ratio, (G) C:K ratio, (H) N:P ratio, (I) N:K ratio, and (J) K:P ratio. NW, Natural tussock wetland; RW, Restored tussock wetland; DW, Degraded tussock wetland. Different letters stand for significant differences at the 0.05 significance level in NW, RW, and DW in the same growth stage.
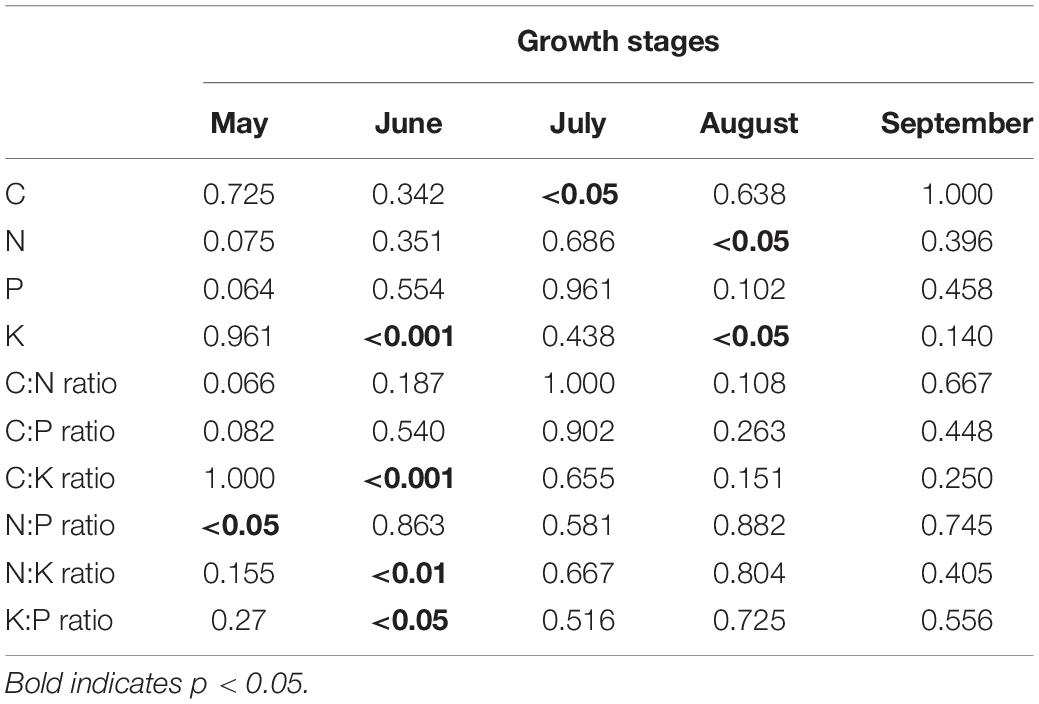
Table 1. Results (p-values) of permutational ANOVAs on the effects of wetland restoration and degradation on ecological stoichiometry of Carex schmidtii during the growth stages.
Effects of Wetland Restoration and Degradation and Growth Stage on the Scaling Exponent of Carex schmidtii
The robust relationships between C, N, P, K concentrations and the corresponding ratios of C. schmidtii (except C∼K, P∼N:K ratio, C:P ratio∼ N:K ratio) are quantified with the power function (Lg i = α Lg j + β; Figure 4 and Supplementary Table 3). Plant C concentration decreases with the N, P concentrations and N:K ratio in DW, but increases with K:P ratio in RW and DW (Table 2 and Supplementary Figures 2–4). The scaling exponent of C∼P decreases from -0.242 in RW to -0.378 in DW, while that of C∼K:P ratio increases from 0.325 to 0.572. Plant N concentration increases with P and K concentrations, while decreases with C:P ratio and C:K ratio in the three wetlands (Table 2). Plant P concentration increases with K concentration, but decreases with the C:P and C:N ratios in the three wetlands (Table 2). Plant K concentration decreases with C:N and C:P ratios in NW and RW. Plant K concentration increases with the N:P ratio in NW. The C:N ratio of C. schmidtii increases with the K:P ratio in RW and DW. The C:P ratio of C. schmidtii decreases with N:K ratio in DW. Plant C:K ratio increases with increasing the N:P ratio.
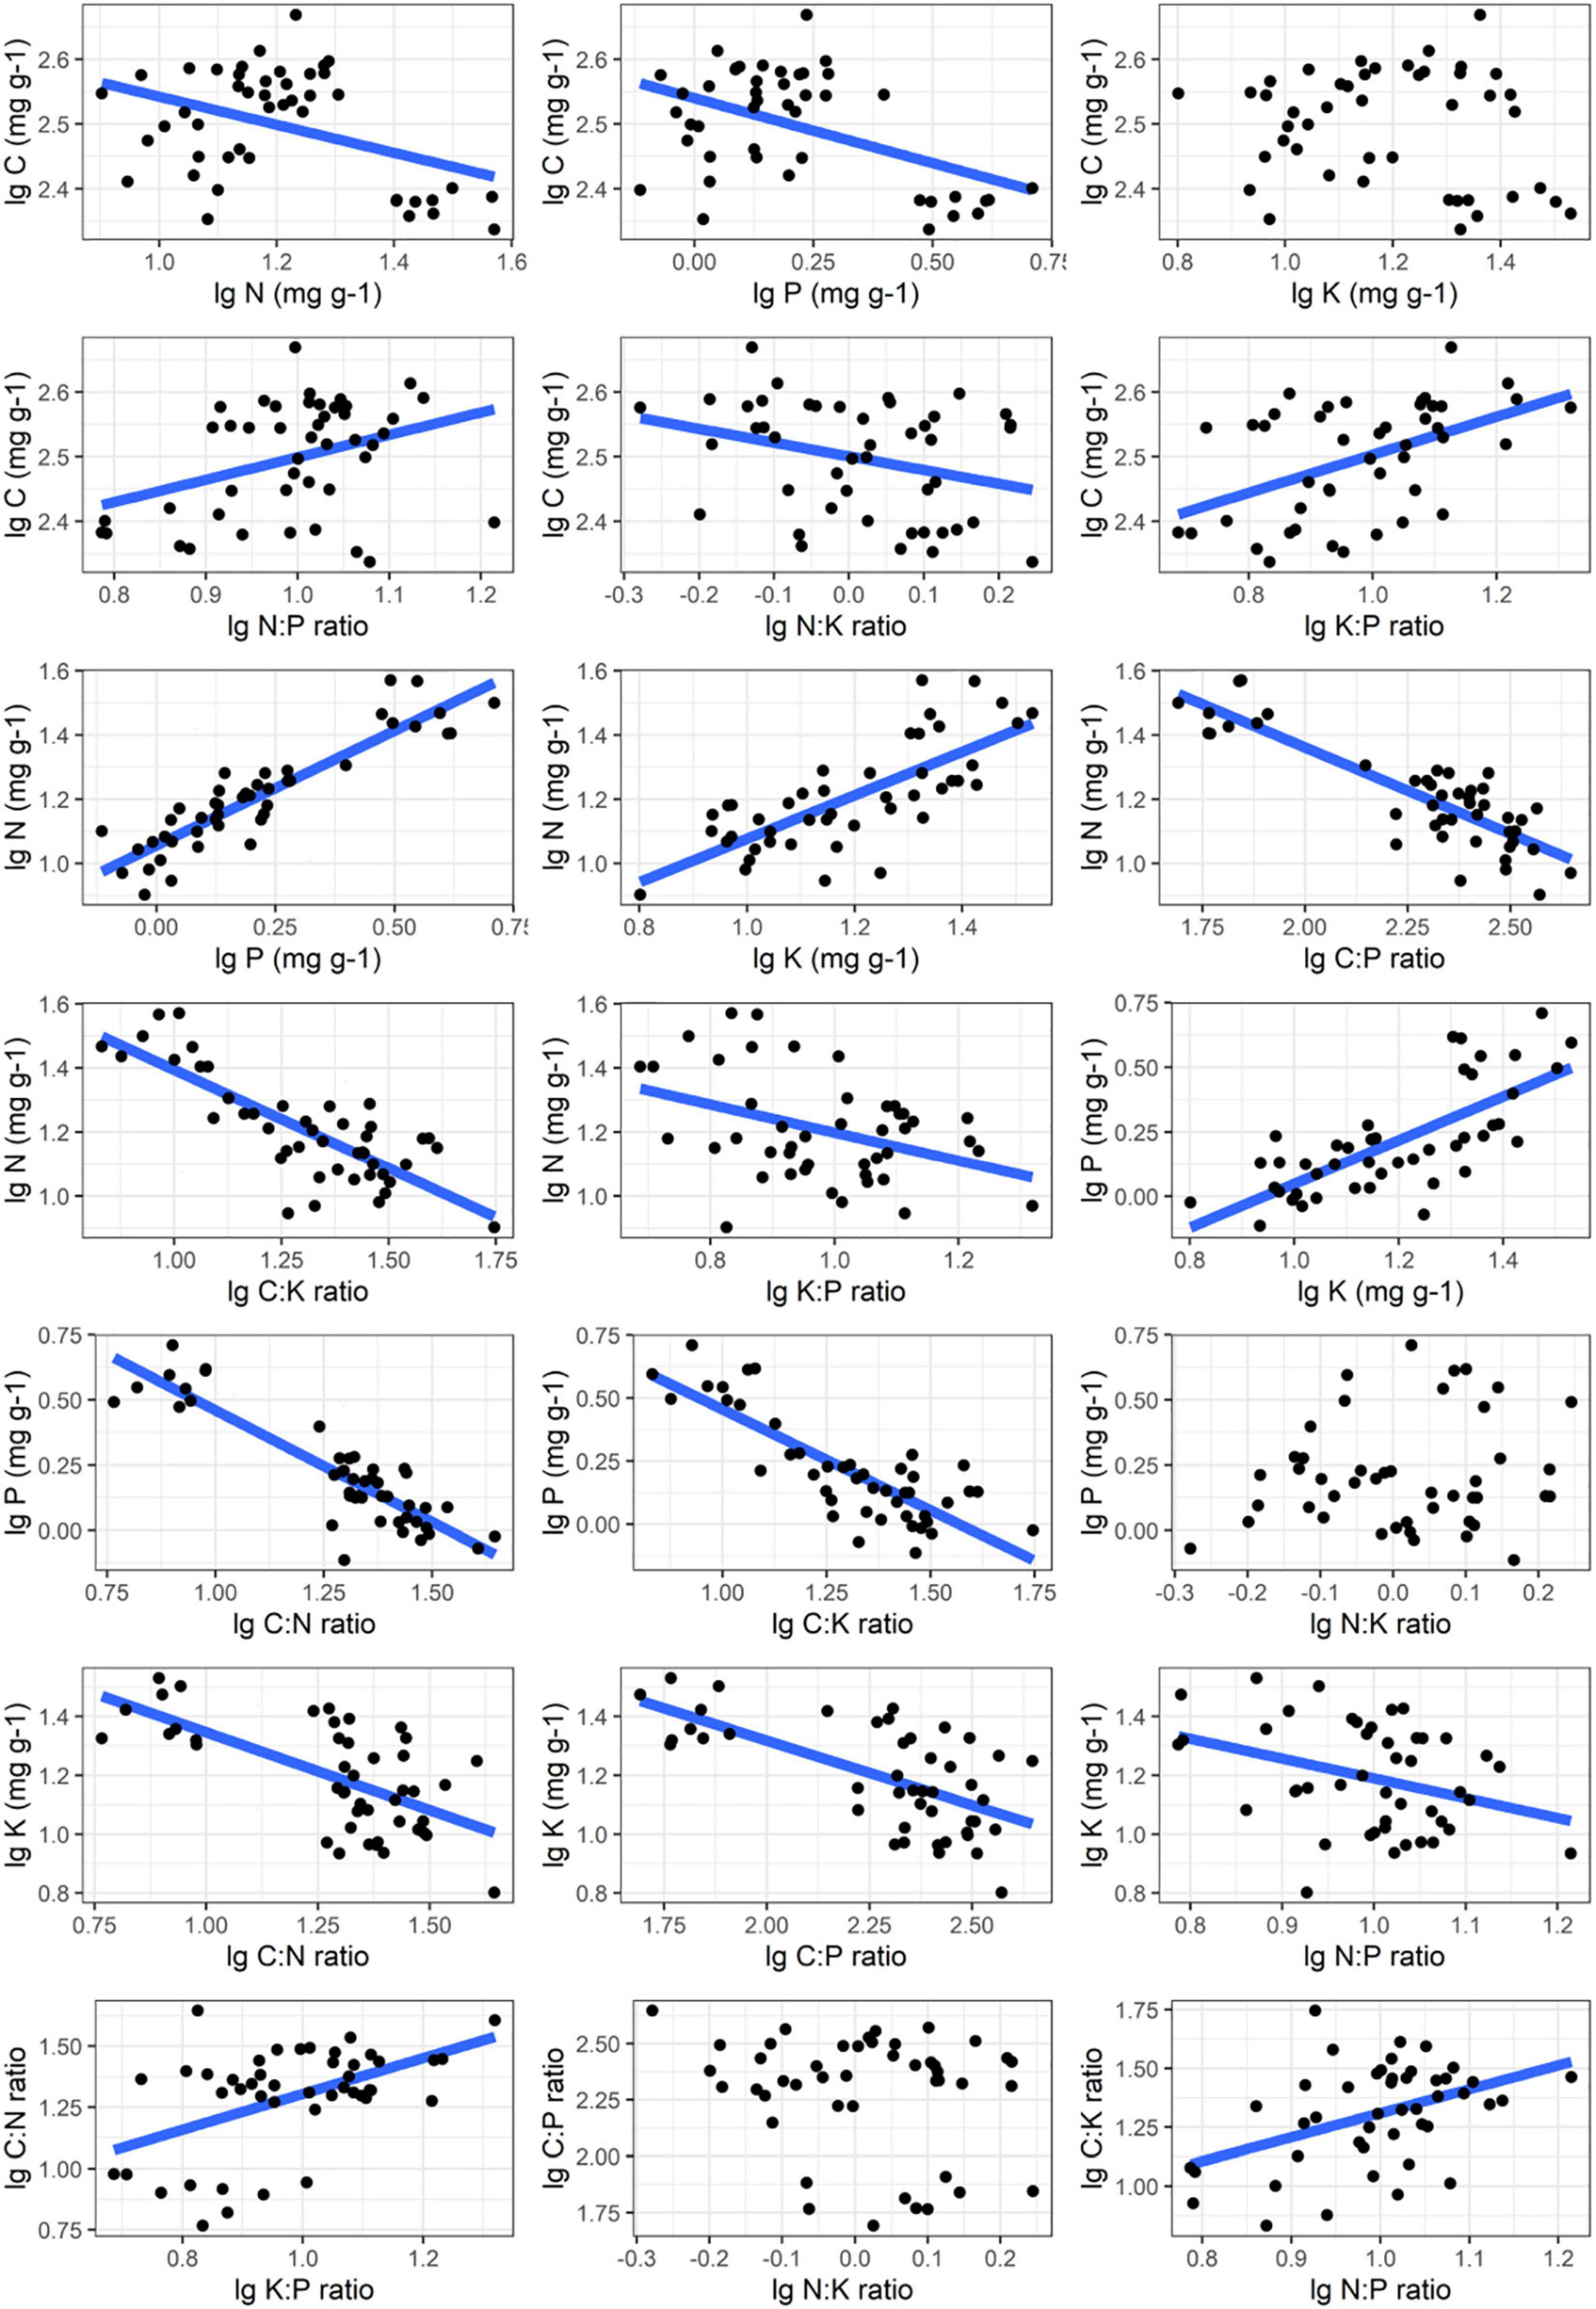
Figure 4. Nutrient stoichiometric relationships of Carex schmidtii. The relationships between C, N, P, K and the corresponding ratios of C. schmidtii are fitted.
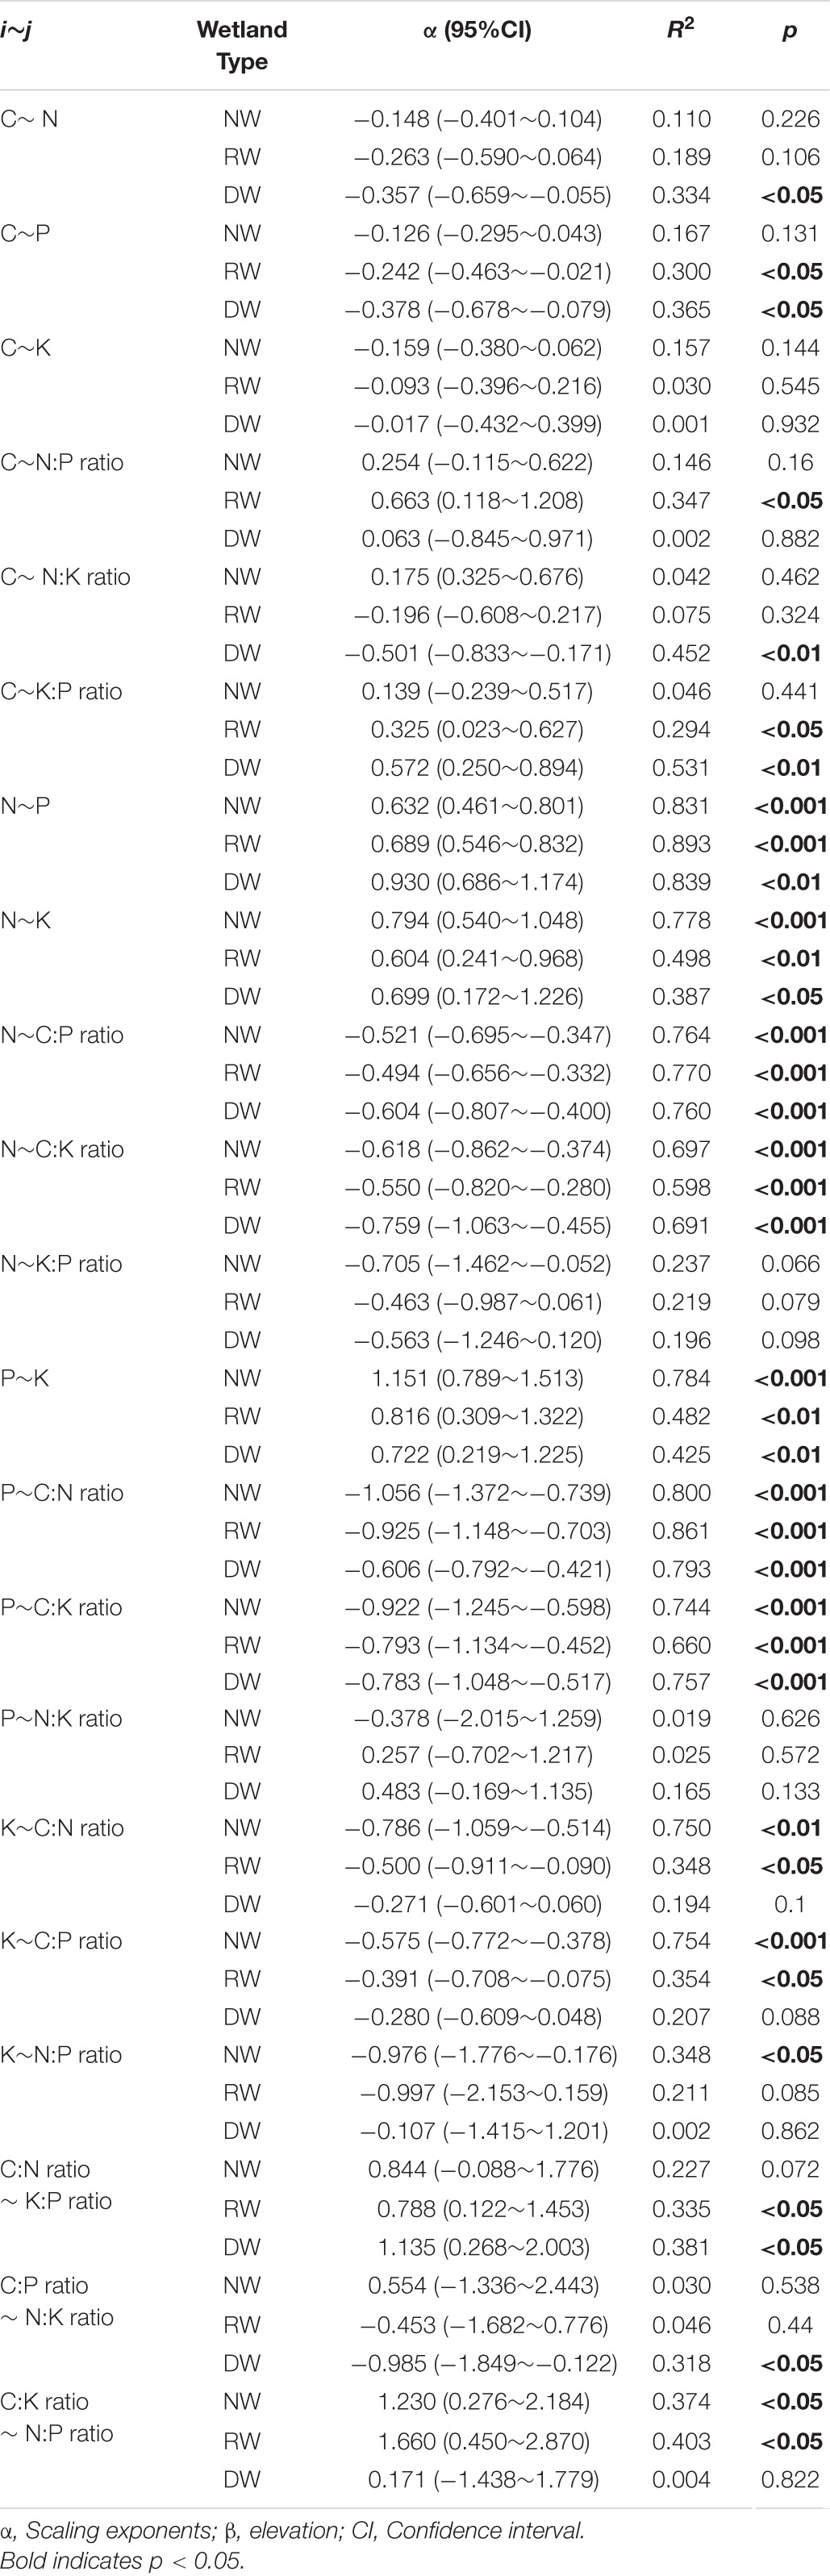
Table 2. Summary of fitting results (Lg i = α Lg j + β) between C, N, P, K concentrations and their ratios of Carex schmidtii under natural (NW), restored (RW), and degraded wetlands (DW).
Principal Component Analysis of Nutrients and Their Ratios of Carex schmidtii
The PCA has summarized 90.52% of the total variability. The first two components reveal 79.9% of the total variability (Supplementary Figure 5). Plant C, N, P, K concentrations, and C:N, C:P, C:K, N:P ratios are important contributors to the PC1. The PC2 is formed based on plant K concentration, N:K, K:P, and C:K ratios. The nutrient trade-off in NW is different from that in DW and RW due to the positions along PC2 (Supplementary Figure 5). In May, the nutrient trade-off in DW had significant differences with NW and RW along PC1 (Figures 5A,B). In June, wetland restoration and degradation affect the plant nutrient trade-off significantly (Figures 5C,D). The nutrient trade-offs in NW, RW, and DW are occupied with different positions along PC1 and PC2. In July, the first two components reveal 81.3% of the total variability. The nutrient trade-offs in DW and NW are different from that in RW because they occupied unique positions in the PCA (Figures 5E,F). Significant differences in nutrient trade-offs are observed in August between DW and RW along PC1 due to the unique positions in the PCA (Figures 5G,H). No significant effects of wetland restoration and degradation were found on the nutrient balances along PC1 and PC2 in September (Figures 5I,J).
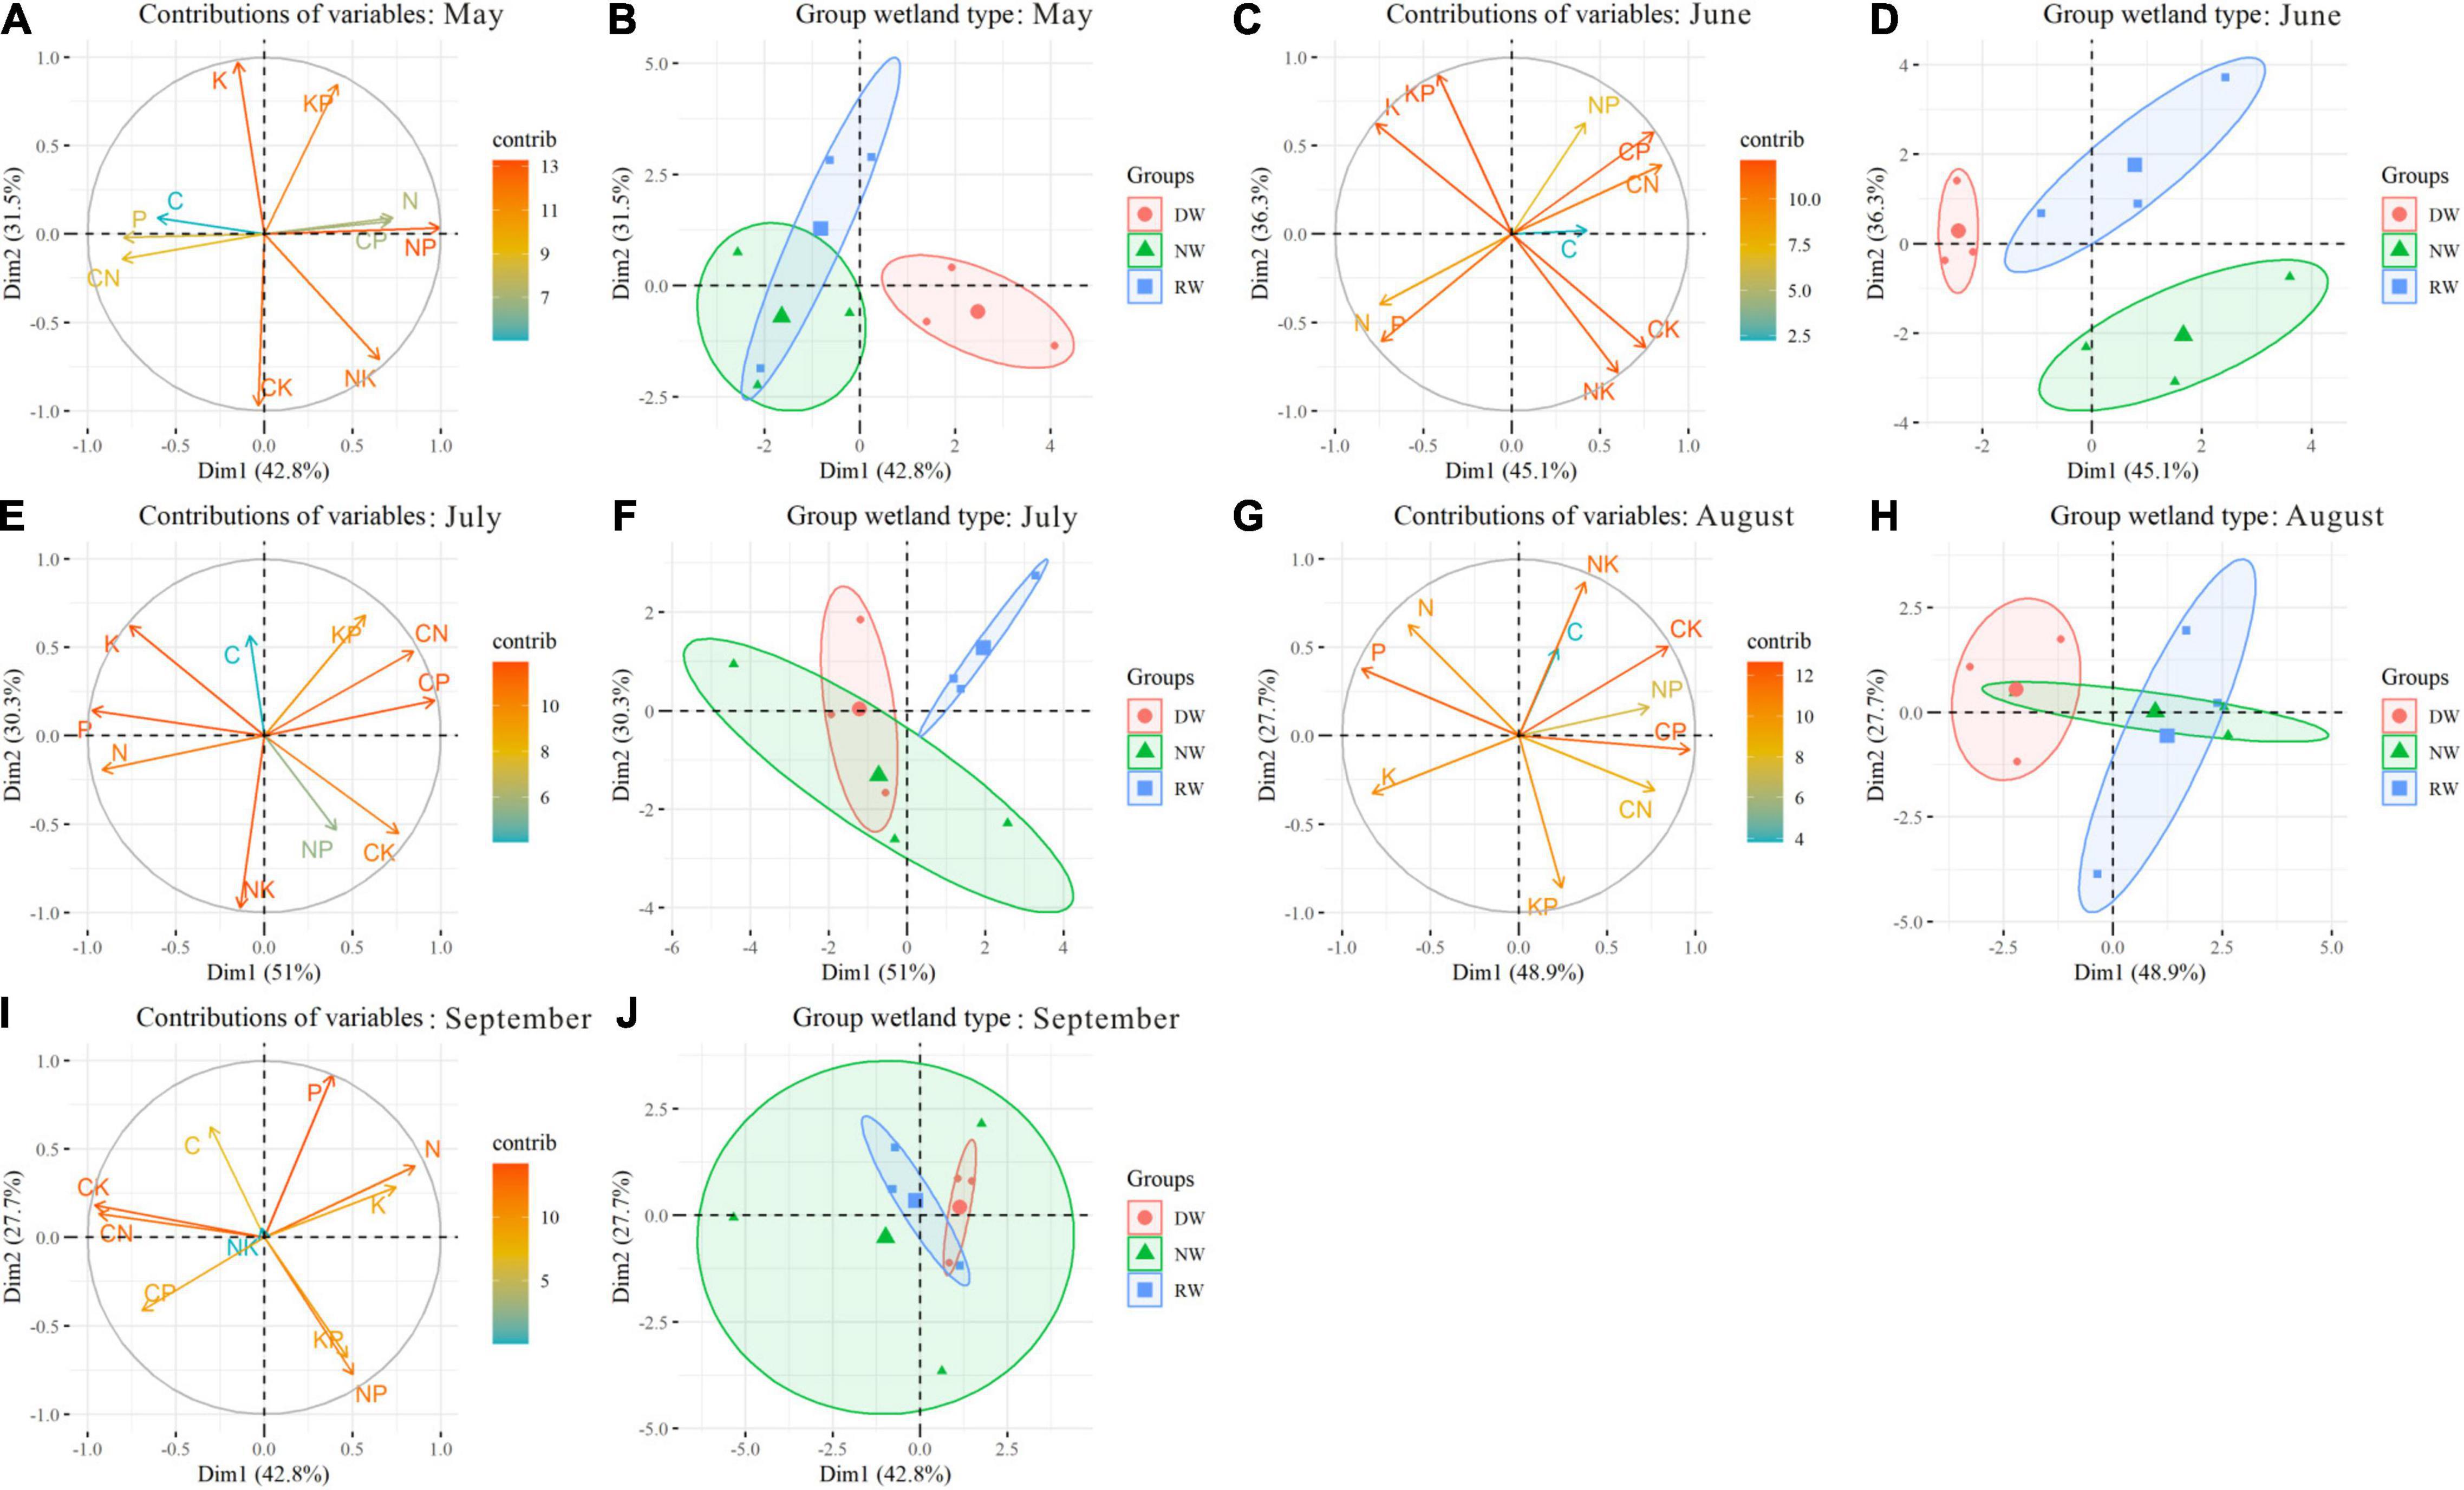
Figure 5. The locations of nutrient stoichiometry in Carex schmidtii reared on wetland type during growth stages. May: (A,B); June: (C,D); July: (E,F); August: (G,H); September: (I,J). Markers represent individual sample locations, while the ellipses represent 95% confidence interval for each group.
The Coupling Relationships of Biomass Nutrients and Their Ratios of Carex schmidtii
Significant correlations between some nutrients and the corresponding ratios are observed (0.30 ≤ |r| ≤ 0.92, Figure 6). Positive relationships are observed between C, N:P ratio, and K:P ratio. In contrast, opposite trends are observed between C, N, P, and K concentrations. Plant N concentration has positive effects on plant P and K concentrations, but it is restricted by the C:P, C:K, and K:P ratios. Plant P concentration is related to plant K concentration and C:N ratio. Plant K concentration is negatively associated with the C:N, C:P, and N:P ratios. Besides, the plant C:N ratio is moderately associated with K:P ratio. The C:K ratio exhibits weak positive relationship with N:P ratio.
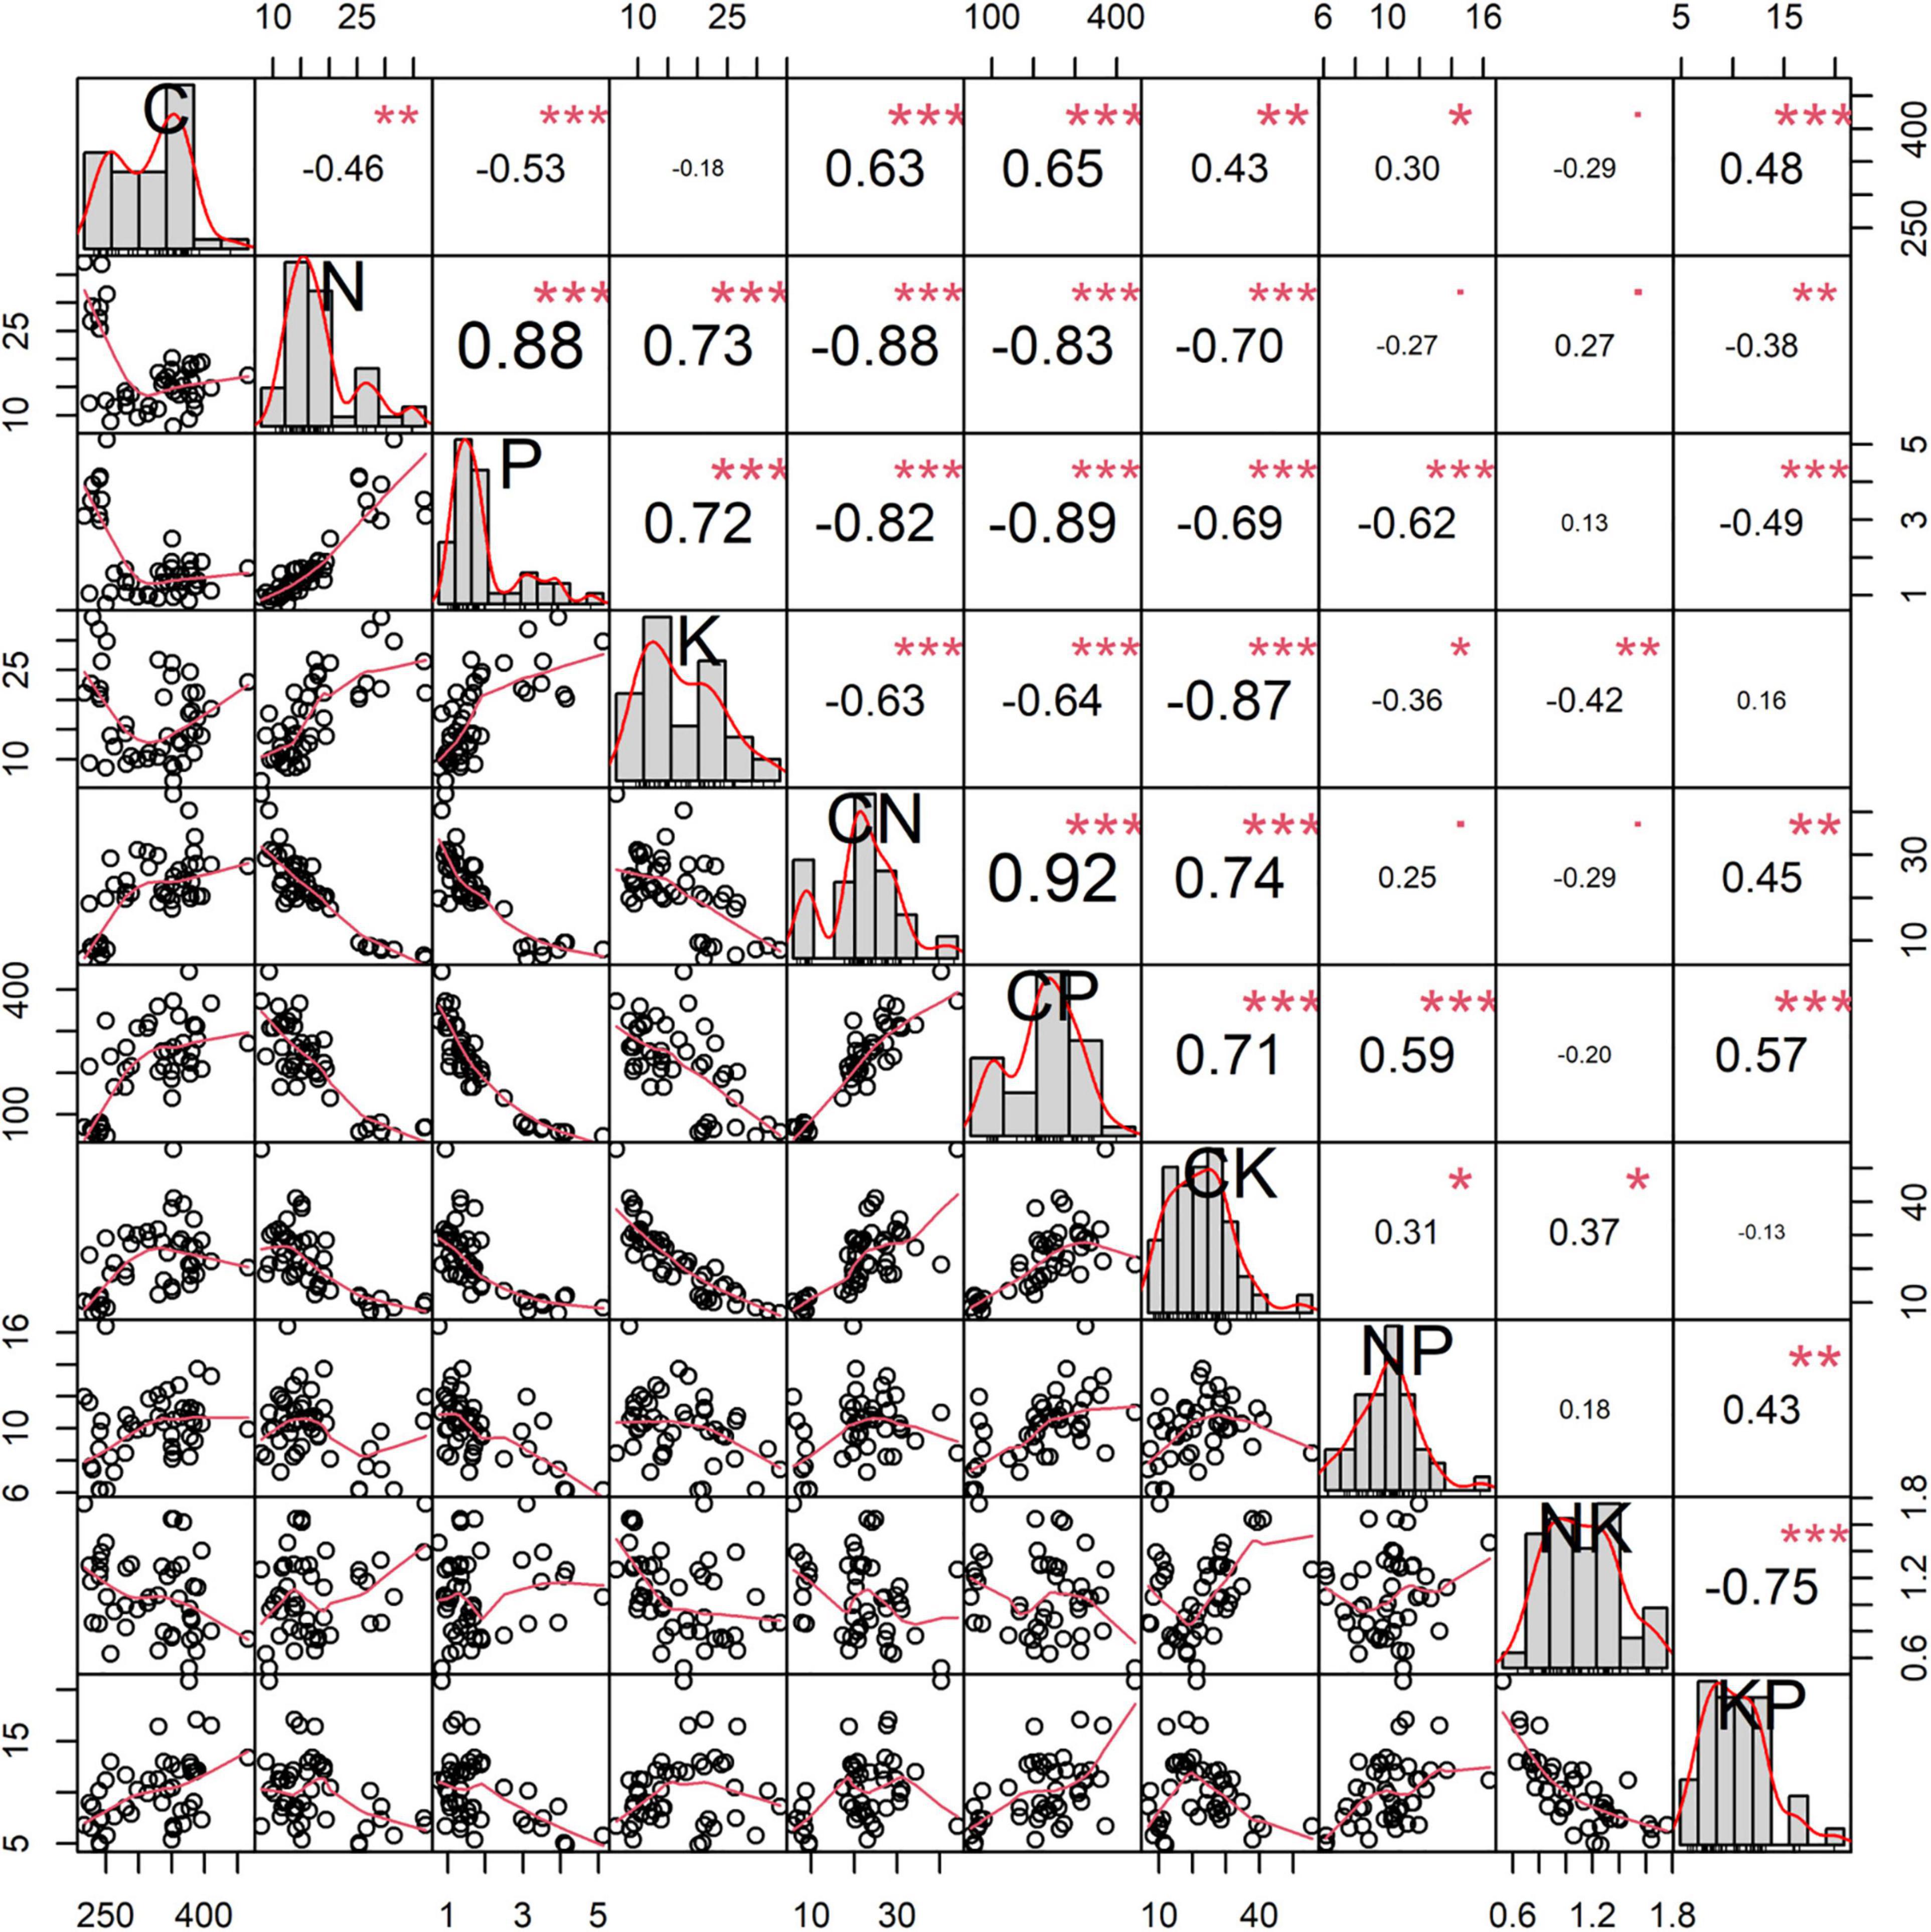
Figure 6. The correlations between C, N, P, and K concentrations and the corresponding ratios of Carex schmidtii. *p < 0.05; **p < 0.01; ***p < 0.001.
The biomass nutrients and their ratios of C. schmidtii are explored using the SEM. Figure 7A shows 53.34% of the variation in plant P concentration, 35.81% of the variation in plant C concentration, and 79.88% of the variation in plant N concentration. Plant K concentration has positive influences on C, N, and P concentrations. Plant P concentration has a negative effect on plant C concentration but a positive affection on plant N concentration. As shown in Figure 7B, the K:P ratio promotes plant C concentration and N:P ratio but inhibits the N:K ratio. However, the N:K ratio can improve the plant C concentration and N:P ratio. In the SEM of plant N concentration and other nutrient ratios, the variables explain 95.59% of the variation in C:P ratio and 75.23% of the variation for plant N concentration (Figure 7C). The C:P, C:K, and K:P ratios negatively affect plant N concentration of C. schmidtii. The SEM results in Figure 7D show that plant C:N and C:K ratios negatively affect plant P concentration. The N:K ratio positively influenced C:K ratio, and the C:K ratio contributed to C:N ratio. The variables in the model explain 62.58% of the variation in plant P concentration. In the SEM of plant K concentration, C:N, C:P, and N:P ratios (Figure 7E), the C:N ratio and N:P ratio explain 44.29% of the variation of plant P concentration by negatively affecting plant P concentration.
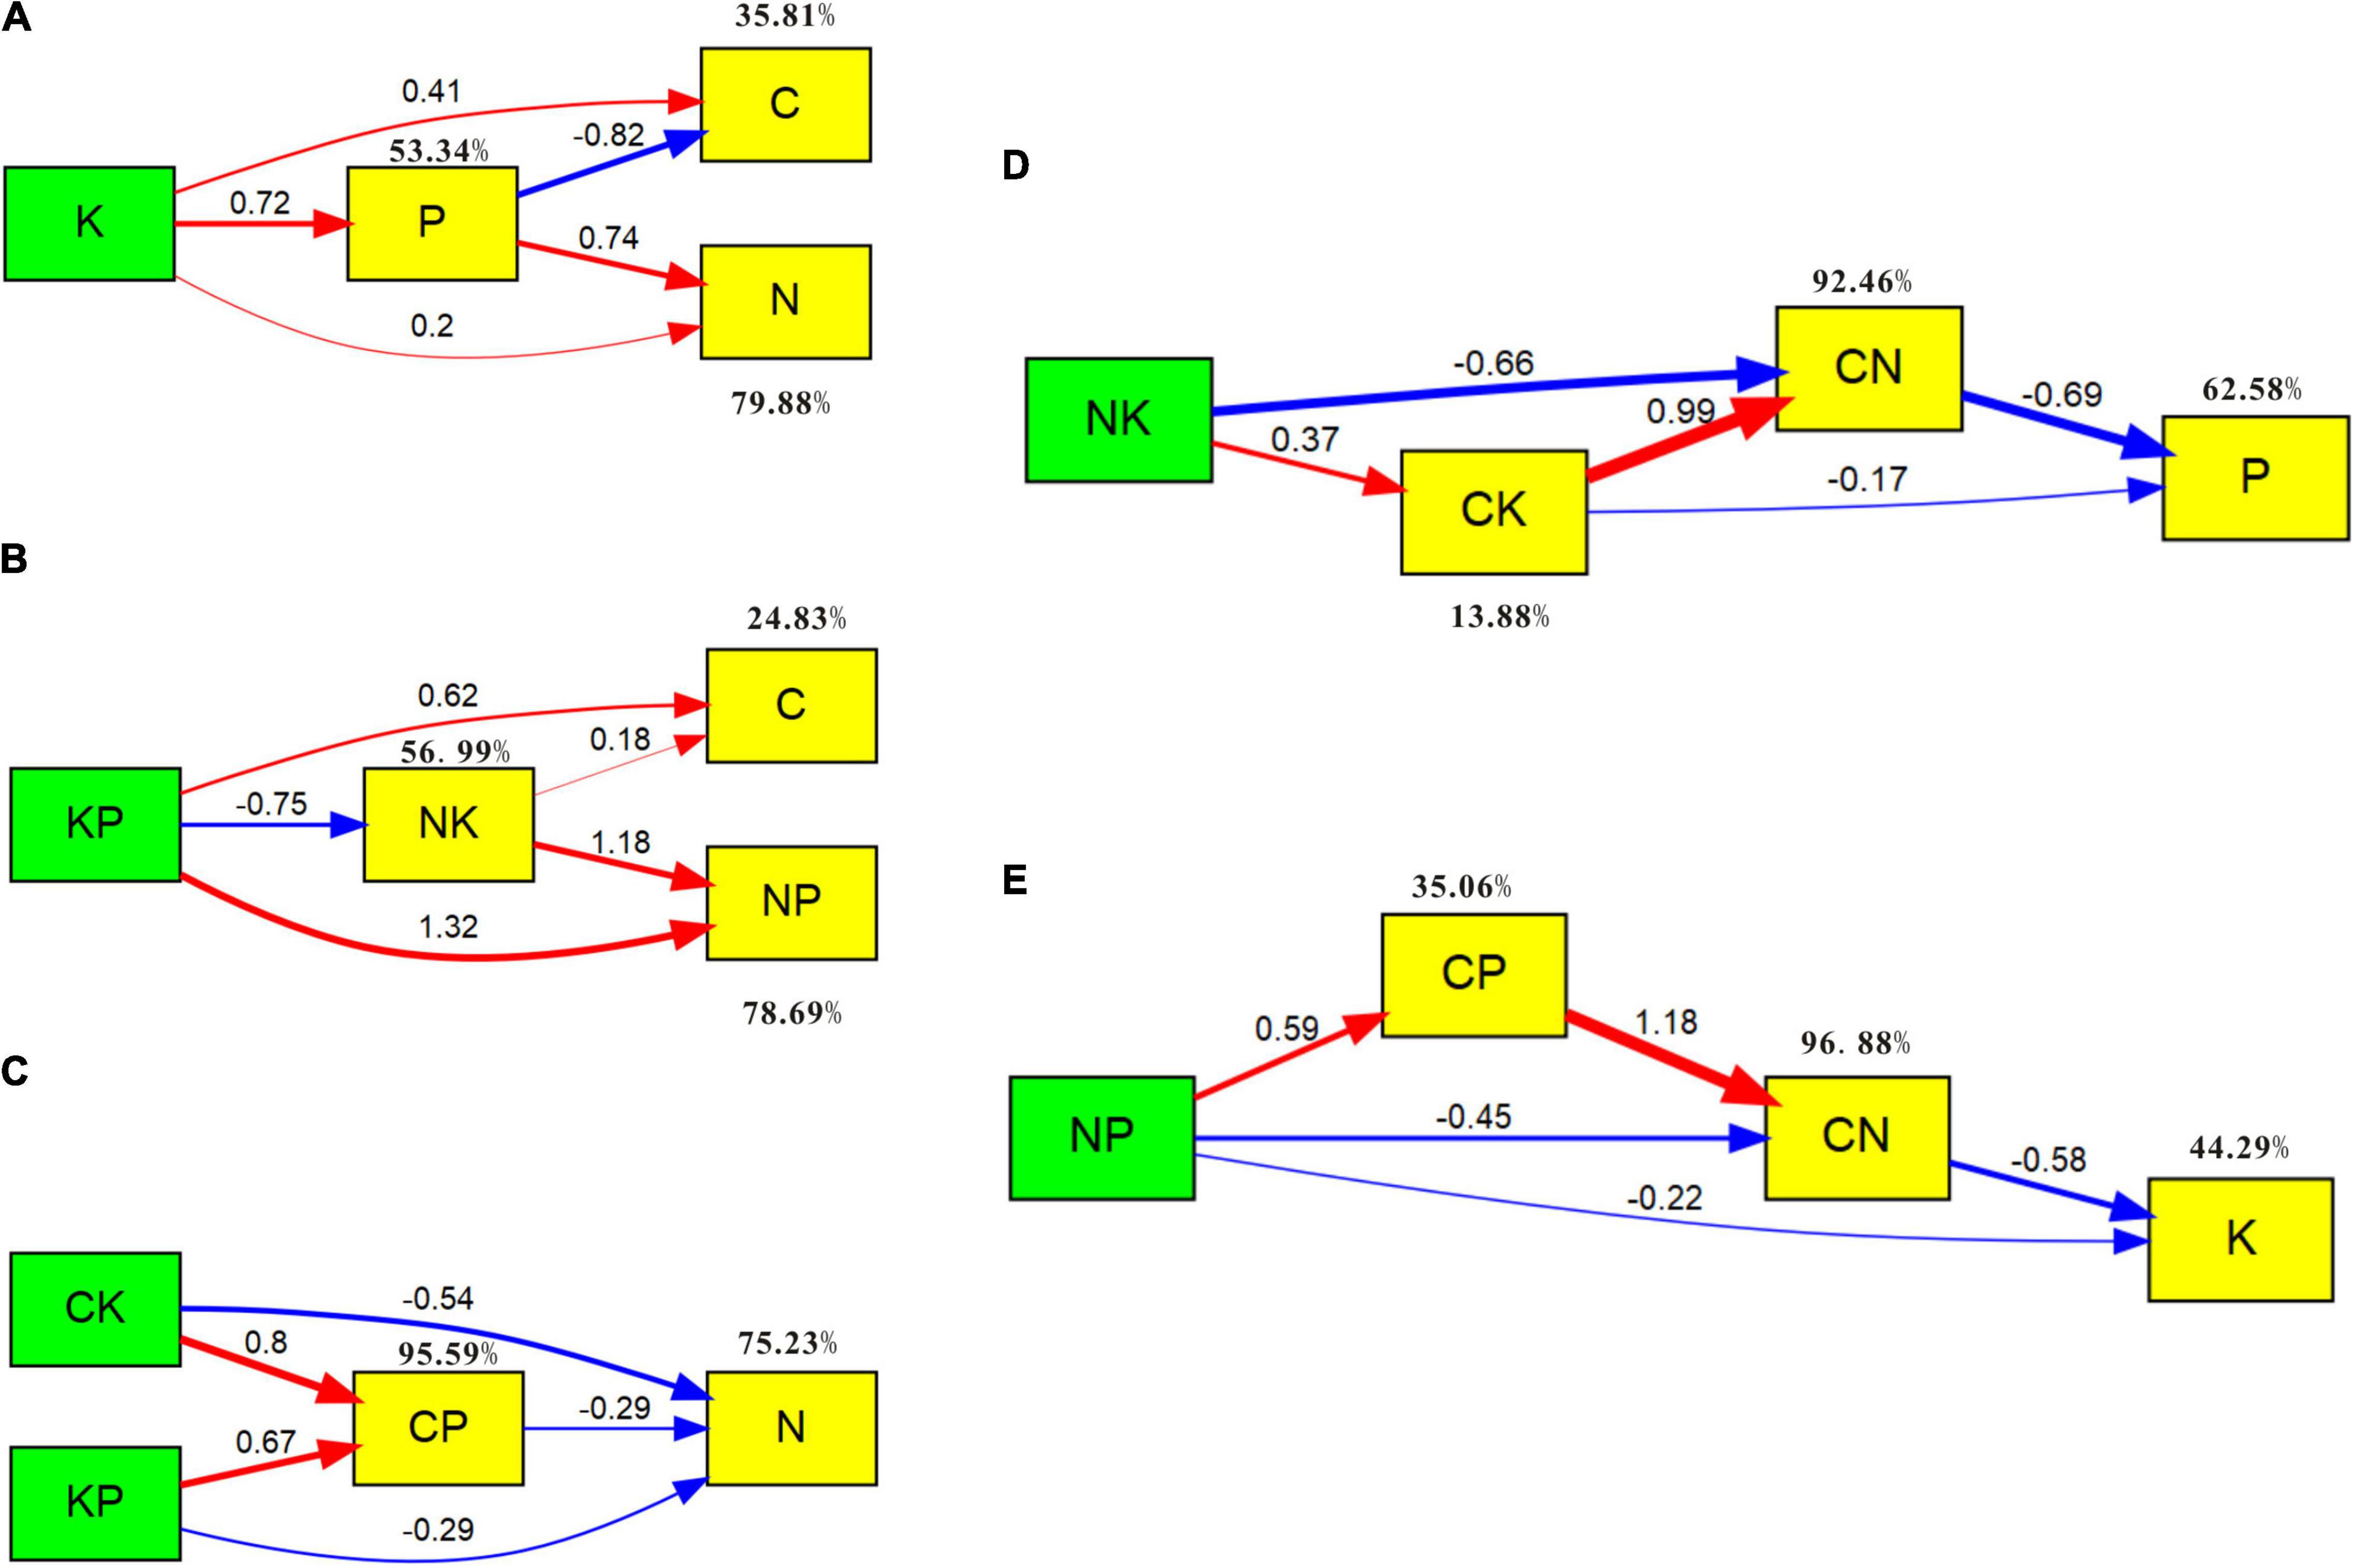
Figure 7. SEM of plant C, N, P, K concentrations and the corresponding ratios. Red and blue solid arrows indicate the significant positive and negative pathways, respectively. Numbers in the arrows indicate the path coefficients. Percentage values close to the variables refer to the proportion of explained variance (R2) by the model. (A) The SEM of plant C, N, P, and K concentrations (χ2 = 0.428, p = 0.513, GFI = 0.995). (B) The SEM of plant C concentration, N:P ratio (NP), K:P ratio (KP), and N:K ratio (NK; χ2 = 0.000, p = 0.987, GFI = 1.000). (C) The SEM of plant N concentration, C:K ratio (CK), C:P ratio (CP), and K:P ratio (χ2 = 0.774, p = 0.379, GFI = 0.991). (D) The SEM of plant P concentration, C:N ratio (CN), C:K ratio, and N:K ratio (χ2 = 0.009, p = 0.925, GFI = 1.000). (E) The SEM of plant K concentration, C:N ratio, C:P ratio, and N:P ratio (χ2 = 1.511, p = 0.219, GFI = 0.983).
Discussion
Environmental changes can affect plant growth and nutrient stoichiometry across species at global and regional scales (Elser et al., 2000; Güsewell et al., 2003; Lawniczak et al., 2010; Hu et al., 2018). Wetland restoration can alter degraded habitats, promote plant growth and improve community biomass. However, wetland degradation due to changes in hydrological conditions and soil environment results in plant dwarfism, and even incomplete life history of plants. All these are closely associated with plant eco-physiological processes and nutrient requirements (Zhang et al., 2019a; Wang M. et al., 2020; Qi et al., 2021c). The effects of wetland restoration and degradation on soil properties are interactive, providing both positive and negative effects (Wang G. et al., 2019; Cui et al., 2021). Wetland restoration can alleviate soil nutrient degradation, affecting N-related stoichiometry in the soil-plant system (Wang G. et al., 2020). However, few studies have explored the effect of wetland restoration and degradation on wetland plants with plant nutrient stoichiometry. This study found that wetland restoration and degradation partly altered nutrient stoichiometry of C. schmidtii, inconsistent with the original hypothesis. Wetland restoration and degradation effects on the nutrient stoichiometry of C. schmidtii are closely related to plant growth stages, nutrient acquisition and utilization (Guo et al., 2016; Zhang et al., 2019a). In the early growth stage (May∼June), nutrients sourced from the root system contributed to rapid growth and biomass accumulation of C. schmidtii seedlings in NW and RW (Lawrence et al., 2013; Rong et al., 2015; Zhang et al., 2021b), diluting plant N, P and K concentrations. Additionally, a large number of seeds of C. schmidtii form and fall off in NW and RW, also reducing plant nutrients. Compared to NW and RW, long-term degradation of C. schmidtii tussocks results in low germination rate and slow growth of C. schmidtii in DW (Wang X. et al., 2019), this being related to a low consumption of K and a high N:P ratio in plants. In July, a higher C concentration were found in DW (Figure 3A), promoting root extension and resists adversity. A similar pattern of plant N and K concentrations is found among the three wetlands in August, and a rapid biomass accumulation and postponement of growth peak of C. schmidtii contributes to a high plant N and K concentrations in DW (Zhang et al., 2021b). At the end of the growth, plant C, N, P, and K concentrations and the corresponding ratios are consistent among the three wetlands. Besides, the nutrient stoichiometry of C. schmidtii varies among growth stages, being consistent with previous studies about C. schmidtii in field and laboratory experiments (Zhang et al., 2021a).
Stoichiometric indices of N:P, N:K, and K:P ratios are important proxies to reflect the gradual and dynamic nutrient availability and limitation of plants (Koerselman and Meuleman, 1996; Olde Venterink et al., 2003). However, the stoichiometric indices provide a different focus on plant nutrient limitation (Güsewell et al., 2003). Both N:P and N:K ratio indicate N-limitation; N:P and K:P ratios imply for P- and N + P-limitation; N:K and K:P ratios indicate K- and K + N-limitation (Olde Venterink et al., 2003). The criteria for nutrient limitation are still controversial. The N:P ratio with a threshold of 14 and 16, and the N:K ratio with a threshold of 1.2 and 1.4 are applied to identify nutrient limitation (Koerselman and Meuleman, 1996; Güsewell et al., 2003). The N:P ratios are < 14 in NW, RW, and DW at entire growth stages, indicating N-limitation for the growth of C. schmidtii (Figure 3H and Supplementary Figure 6). Similarly, the N:K ratio indicates an N-limitation during May–August for most cases (<1.2) and a co-limitation of N and K in September (between 1.2 and 1.4). Besides, K-limitation for plant growth is identified in DW in May and in NW in June (>1.4). In particular, N-limitation for plant growth is gradually reduced in NW and RW (Supplementary Figure 6). However, the N:K ratio in RW indicates that N-limitation increases before decreases over time and finally shifts into the co-limitation of N and K (Supplementary Figure 6). In DW, K-limitation shifts into N-limitation in the early growth stage and the N-limitation gradually decreases over time (Supplementary Figure 6). Plants in NW are (1) limited by N in the early growth stage; (2) shifted to K-limitation in July; (3) and then returned to N-limitation with an increasing trend; (4) at the end of growth stage, N-limitation decreases and turns into co-limitation of N and K (Supplementary Figure 6). The results are consistent with previous studies, revealing that N can limit the growth of C. schmidtii according to soil N:P ratio in the field (Zhang et al., 2019a). Results are partly in line with the second hypothesis that both N:P and N:K ratios indicate that RW strengthen N-limitation in the early growth stages and reduce N-limitation in the end of growth stages of C. schmidtii compared with DW. Besides, RW relieves K-limitation of C. schmidtii in the early growth stages. Therefore, improving the degree of N-limitation of C. schmidtii in the early growth stage provides valuable information for restoring tussock wetlands.
Trade-off between biomass nutrients and the corresponding ratios reveal the integration, relevance, and dynamic nature of nutrient homeostasis or flexibility in plants (Yan et al., 2019; Zhang et al., 2021a). Plant internal states drive nutrient homeostasis or flexibility by modulating nutrient trade-off (Reich et al., 2010; Rong et al., 2015; Julian et al., 2020). Scaling exponent and PCA describe the stoichiometric relationships and give invaluable information for nutrient trade-off (Zhang et al., 2021a). Besides, scaling exponents based on the empirical model (Lg i = α Lg j + β) are vital to predict plant growth and functioning (Tian et al., 2019). Wetland restoration and degradation alter plant nutrient trade-off, especially N∼ and P∼ scaling exponents. Compared with DW, the scaling exponents of N∼P, N∼C:P ratio, N∼C:K ratio, P∼K, P∼C:N ratio and P∼C:K ratio in RW is more closed to NW. However, partly C-related (C∼) and K-related (K∼) scaling exponents are absent due to the non-robust fit, indicating nutrient flexibility of C. schmidtii. PCA shows that the nutrient trade-offs in RW are much more similar to DW, other than NW (Supplementary Figure 5), indicating that C. schmidtii in RW has not yet returned to its best natural level according to NW. Plant nutrient trade-offs in RW and NW developed in the opposite directions (Supplementary Figure 5). While the plant nutrient trade-off in DW gradually approaches NW from May to August (Figure 5). Therefore, how to effectively restore tussock wetlands warrants further studies and more validations. Besides, plant nutrient ratios explain 44.29∼75.23% of N, P, and K concentrations and moderately explain plant C concentration. Plant K and P concentrations explain 79.88% of plant N concentration and explain 35.81% of plant C concentration.
Planting tussocks and regulating hydrological conditions were successfully applied to restore tussock wetland (Lawrence and Zedler, 2011; Guo et al., 2016; Zhang et al., 2019b; Qi et al., 2021c). Plant nutrient trade-off in RW approached DW other than NW in view of the entire growth stage, opposite to the original goal of wetland restoration. The results are closely related to the gentle landform of RW. The absence of water storage structure results in frequent drought (Supplementary Figure 1) and the limitation of the growth of C. schmidtii tussocks. Thus, hydrological management for tussock planting is recommended to recovery the growth of C. schmidtii tussocks.
Conclusion
The nutrient stoichiometry of C. schmidtii was partly affected by wetland restoration and degradation but varied among growth stages. The growth of C. schmidtii was N-limited in the field during the entire growth stages. Significant stoichiometric scaling relationships were quantified between plant C, N, P, K concentrations and the corresponding ratios of C. schmidtii (except for C∼K, K∼N:P ratio, C:P ratio∼ N:K ratio). N-related (N∼) and P-related (P∼) scaling exponents effectively quantified the stoichiometric relationship in natural (NW), restored (RW) and degraded tussock wetlands, indicating changes in an element concentration in proportion to another element concentration (DW; except for N∼K:P ratio and P∼N:K ratio). Wetland restoration and degradation altered nutrient scaling exponent compared with NW. PCA indicated that wetland restoration and degradation had significant effects on the nutrient balances from May to August. The nutrient trade-off in RW was much more similar to DW, other than NW. Carex schmidtii had strong stoichiometric relationships between their nutrients and ratios. The structural equation model indicated that plant P and K concentrations had a high proportional contribution to plant C and N concentrations. These findings help in understanding nutrient trade-off of C. schmidtii under wetland restoration and degradation. Efficient evaluation of nutrient limitation and trade-off of plants are important to reveal the stoichiometric mechanism of C. schmidtii in NW, RW, and DW, providing invaluable information for the restoration and protection of C. schmidtii tussock wetlands. The coupling relationships among community diversity performance, plant growth and eco-physiological responses, and nutrient trade-off of C. schmidtiiin tussock wetlands warrant needs to be studied further.
Data Availability Statement
The original contributions presented in the study are included in the article/Supplementary Material, further inquiries can be directed to the corresponding authors.
Author Contributions
DZ, ST, and XW designed the study. DZ collected the data. DZ, KD, and PS analyzed the data. ST, JX, and JS lead the writing with all co-authors. All authors gave final approval for publication.
Funding
This research was supported by the National Natural Science Foundation of China (Nos. 42101111 and 41871101), the Ph.D. research startup foundation of Binzhou University (No. 2021Y14), the Science and Technology Development Project of Jilin Province, China (No. 20190201115JC), and the Shandong Provincial Natural Science Foundation (No. ZR2021QD101).
Conflict of Interest
The authors declare that the research was conducted in the absence of any commercial or financial relationships that could be construed as a potential conflict of interest.
Publisher’s Note
All claims expressed in this article are solely those of the authors and do not necessarily represent those of their affiliated organizations, or those of the publisher, the editors and the reviewers. Any product that may be evaluated in this article, or claim that may be made by its manufacturer, is not guaranteed or endorsed by the publisher.
Acknowledgments
We thank for the help of Qing Qi and Mingye Zhang. We would like to express their gratitude to EditSprings (https://www.editsprings.com/) for the expert linguistic services provided.
Supplementary Material
The Supplementary Material for this article can be found online at: https://www.frontiersin.org/articles/10.3389/fevo.2021.801608/full#supplementary-material
References
Branco, P., Egas, M., Elser, J. J., and Huisman, J. (2018). Eco-evolutionary dynamics of ecological stoichiometry in plankton communities. Am. Nat. 192, E1–E20. doi: 10.1086/697472
Bratt, A. R., Finlay, J. C., Welter, J. R., Vculek, B. A., and Van Allen, R. E. (2020). Co-limitation by N and P characterizes phytoplankton communities across nutrient availability and land Use. Ecosystems 23, 1121–1137. doi: 10.1007/s10021-019-00459-6
Busch, V., Klaus, V. H., Penone, C., Schäfer, D., Boch, S., Prati, D., et al. (2018). Nutrient stoichiometry and land use rather than species richness determine plant functional diversity. Ecol. Evol. 8, 601–616. doi: 10.1002/ece3.3609
Chen, Y., Stagg, C. L., Cai, Y., Lü, X., Wang, X., Shen, R., et al. (2020). Scaling responses of leaf nutrient stoichiometry to the lakeshore flooding duration gradient across different organizational levels. Sci. Total Environ. 740:139740. doi: 10.1016/j.scitotenv.2020.139740
Chiwa, M., Sheppard, L. J., Leith, I. D., Leeson, S. R., Tang, Y. S., and Cape, J. N. (2019). P and K additions enhance canopy N retention and accelerate the associated leaching. Biogeochemistry 142, 413–423. doi: 10.1007/s10533-019-00543-y
Cui, H., Ou, Y., Wang, L., Liang, A., Yan, B., and Li, Y. (2021). Dynamic changes in microbial communities and nutrient stoichiometry associated with soil aggregate structure in restored wetlands. Catena 197:104984. doi: 10.1016/j.catena.2020.104984
Ding, Z., Liu, Y., Lou, Y., Jiang, M., Li, H., and Lü, X. (2021). How soil ion stress and type influence the flooding adaptive strategies of Phragmites australis and Bolboschoenus planiculmis in temperate saline–alkaline wetlands? Sci. Total Environ. 771:144654. doi: 10.1016/j.scitotenv.2020.144654
Elser, J. J., Dobberfuhl, D. R., MacKay, N. A., and Schampel, J. H. (1996). Organism size, life history, and N:P stoichiometry. Bioscience 46, 674–684. doi: 10.2307/1312897
Elser, J. J., Fagan, W. F., Denno, R. F., Dobberfuhl, D. R., Folarin, A., Huberty, A., et al. (2000). Nutritional constraints in terrestrial and freshwater food webs. Nature 408, 578–580. doi: 10.1038/35046058
Ghimire, B., Riley, W. J., Koven, C. D., Kattge, J., Rogers, A., Reich, P. B., et al. (2017). A global trait-based approach to estimate leaf nitrogen functional allocation from observations. Ecol. Appl. 27, 1421–1434. doi: 10.1002/eap.1542
Gierth, M., and Mäser, P. (2007). Potassium transporters in plants–involvement in K+ acquisition, redistribution and homeostasis. FEBS Lett. 581, 2348–2356. doi: 10.1016/j.febslet.2007.03.035
Guo, J., Jiang, H., Bian, H., He, C., and Gao, Y. (2016). Effects of hydrologic mediation and plantation of Carex schmidtii Meinsh on peatland restoration in China’s Changbai Mountain region. Ecol. Eng. 96, 187–193. doi: 10.1016/j.ecoleng.2016.01.015
Guo, Y., Yan, Z., Gheyret, G., Zhou, G., Xie, Z., and Tang, Z. (2020). The community-level scaling relationship between leaf nitrogen and phosphorus changes with plant growth, climate and nutrient limitation. J. Ecol. 108, 1276–1286. doi: 10.1111/1365-2745.13369
Güsewell, S., and Koerselman, M. (2002). Variation in nitrogen and phosphorus concentrations of wetland plants. Perspect. Plant Ecol. Evol. Syst. 5, 37–61. doi: 10.1078/1433-8319-0000022
Güsewell, S., Koerselman, W., and Verhoeven, J. T. (2003). Biomass N: P ratios as indicators of nutrient limitation for plant populations in wetlands. Ecol. Appl. 13, 372–384.
Hartmann, H., Bahn, M., Carbone, M., and Richardson, A. D. (2020). Plant carbon allocation in a changing world-challenges and progress: introduction to a virtual issue on carbon allocation. New Phytol. 227, 981–988. doi: 10.1111/nph.16757
He, N., Liu, C., Piao, S., Lawren, S., Xu, L., Luo, Y., et al. (2019). Ecosystem traits linking functional traits to macroecology. Trends Ecol. Evol. 34, 200–210. doi: 10.1016/j.tree.2018.11.004
Hoosbeek, M. R., Van Breemen, N., Vasander, H., Buttler, A., and Berendse, F. (2002). Potassium limits potentialgrowth of bog vegetation underelevated atmospheric CO2 and N deposition. Glob. Change Biol. 8, 1130–1138. doi: 10.1046/j.1365-2486.2002.00535.x
Hu, M., Peñuelas, J., Sardans, J., Sun, Z., Wilson, B. J., Huang, J., et al. (2018). Stoichiometry patterns of plant organ N and P in coastal herbaceous wetlands along the East China Sea: implications for biogeochemical niche. Plant Soil 431, 273–288. doi: 10.1007/s11104-018-3759-6
Huang, Y., Lou, C., Luo, L., and Wang, X. C. (2021). Insight into nitrogen and phosphorus coupling effects on mixotrophic Chlorella vulgaris growth under stably controlled nutrient conditions. Sci. Total Environ. 752:141747. doi: 10.1016/j.scitotenv.2020.141747
Jiang, H., Wen, Y., Zou, L., Wang, Z., He, C., and Zou, C. (2016). The effects of a wetland restoration project on the Siberian crane (Grus leucogeranus) population and stopover habitat in Momoge National Nature Reserve, China. Ecol. Eng. 96, 170–177. doi: 10.1016/j.ecoleng.2016.01.016
Julian, P., Gerber, S., Bhomia, R. K., King, J., Osborne, T. Z., and Wright, A. L. (2020). Understanding stoichiometric mechanisms of nutrient retention in wetland macrophytes: stoichiometric homeostasis along a nutrient gradient in a subtropical wetland. Oecologia 193, 969–980. doi: 10.1007/s00442-020-04722-9
Koerselman, W., and Meuleman, A. F. M. (1996). The vegetation N: P ratio: a new tool to detect the nature of nutrient limitation. J. Appl. Ecol. 33, 1441–1450. doi: 10.2307/2404783
Lawniczak, A. E., Zbierska, J., Choiński, A., and Szczepaniak, W. (2010). Response of emergent macrophytes to hydrological changes in a shallow lake, with special reference to nutrient cycling. Hydrobiologia 656, 243–254. doi: 10.1007/s10750-010-0436-z
Lawrence, B. A., and Zedler, J. B. (2011). Formation of tussocks by sedges: effects of hydroperiod and nutrients. Ecol. Appl. 21, 1745–1759.
Lawrence, B. A., Fahey, T. J., and Zedler, J. B. (2013). Root dynamics of Carex stricta-dominated tussock meadows. Plant Soil. 364, 325–339. doi: 10.1007/s11104-012-1360-y
Loomis, R. S. (1997). On the utility of nitrogen in leaves. Proc. Natl. Acad. Sci. U.S.A. 94, 13378–13379. doi: 10.1073/pnas.94.25.13378
Olde Venterink, H., Wassen, M. J., Verkroost, A. W. M., and De Ruiter, P. C. (2003). Species richness–productivity patterns differ between N-, P-, and K-limited wetlands. Ecology 84, 2191–2199. doi: 10.1890/01-0639
Opdekamp, W., Teuchies, J., Vrebos, D., Chormański, J., Schoelynck, J., Van Diggelen, R., et al. (2012). Tussocks: biogenic silica hot-spots in a riparian wetland. Wetlands 32, 1115–1124. doi: 10.1007/s13157-012-0341-5
Pan, X., Zhang, D., and Quan, L. (2006). Interactive factors leading to dying-off Carex tato in Momoge wetland polluted by crude oil, Western Jilin, China. Chemosphere 65, 1772–1777. doi: 10.1016/j.chemosphere.2006.04.063
Pan, Y., Cieraad, E., Armstrong, J., Armstrong, W., Clarkson, B. R., Colmer, T. D., et al. (2020). Global patterns of the leaf economics spectrum in wetlands. Nat. Commun. 11:4519. doi: 10.1038/s41467-020-18354-3
Peng, Y., Peng, Z., Zeng, X., and Hou, J. H. (2019). Effects of nitrogen-phosphorus imbalance on plant biomass production: a global perspective. Plant Soil 436, 245–252. doi: 10.1007/s11104-018-03927-5
Qi, Q., Zhang, D., Zhang, M., Tong, S., An, Y., Wang, X., et al. (2021a). Hydrological and microtopographic effects on community ecological characteristics of Carex schmidtii tussock wetland. Sci. Total Environ. 780:146630. doi: 10.1016/j.scitotenv.2021.146630
Qi, Q., Zhang, D., Zhang, M., Tong, S., Wang, W., and An, Y. (2021b). Spatial distribution of soil organic carbon and total nitrogen in disturbed Carex tussock wetland. Ecol. Indic. 120:106930. doi: 10.1016/j.ecolind.2020.106930
Qi, Q., Zhang, D., Tong, S., Zhang, M., Wang, X., An, Y., et al. (2021c). The driving mechanisms for community expansion in a restored Carex tussock wetland. Ecol. Indic. 121:107040. doi: 10.1016/j.ecolind.2020.107040
Reich, P. B., Oleksyn, J., Wright, I. J., Niklas, K. J., Hedin, L., and Elser, J. J. (2010). Evidence of a general 2/3-power law of scaling leaf nitrogen to phosphorus among major plant groups and biomes. Proc. R. Soc. Lond. B Biol. Sci. 277, 877–883. doi: 10.1098/rspb.2009.1818
Rong, Q., Liu, J., Cai, Y., Lu, Z., Zhao, Z., Yue, W., et al. (2015). Leaf carbon, nitrogen and phosphorus stoichiometry of Tamarix chinensis Lour. in the Laizhou Bay coastal wetland, China. Ecol. Eng. 76, 57–65. doi: 10.1016/j.ecoleng.2014.03.002
Sardans, J., Janssens, I. A., Ciais, P., Obersteiner, M., and Peñuelas, J. (2021). Recent advances and future research in ecological stoichiometry. Perspect. Plant Ecol. Evol. Syst. 50:125611. doi: 10.1016/j.ppees.2021.125611
Song, Z., Liu, H., Zhao, F., and Xu, C. (2014). Ecological stoichiometry of N: P: Si in China’s grasslands. Plant Soil 380, 165–179. doi: 10.1007/s11104-014-2084-y
Tian, D., Yan, Z., Ma, S., Ding, Y., Luo, Y., Chen, Y., et al. (2019). Family-level leaf nitrogen and phosphorus stoichiometry of global terrestrial plants. Sci. China Life Sci. 62, 1047–1057. doi: 10.1007/s11427-019-9584-1
Tian, D., Yan, Z., Niklas, K., Han, W., Kattge, J., Reich, P., et al. (2018). Global leaf nitrogen and phosphorus stoichiometry and their scaling exponent. Natl. Sci. Rev. 5, 728–739. doi: 10.1093/nsr/nwx142
Van de Waal, D. B., Verschoor, A. M., Verspagen, J. M., van Donk, E., and Huisman, J. (2010). Climate-driven changes in the ecological stoichiometry of aquatic ecosystems. Front. Ecol. Environ. 8, 45–152. doi: 10.1890/080178
Wan, S. Z., Yang, G. S., and Mao, R. (2020). Responses of leaf nitrogen and phosphorus allocation patterns to nutrient additions in a temperate freshwater wetland. Ecol. Indic. 110:105949. doi: 10.1016/j.ecolind.2019.105949
Wang, G., Jiang, M., Wang, M., and Xue, Z. (2020). Element composition of soils to assess the success of wetland restoration. Land Degrad. Dev. 31, 1641–1649. doi: 10.1002/ldr.3561
Wang, G., Otte, M. L., Jiang, M., Wang, M., Yuan, Y., and Xue, Z. (2019). Does the element composition of soils of restored wetlands resemble natural wetlands? Geoderma 351, 174–179. doi: 10.1016/j.geoderma.2019.05.032
Wang, M., Wang, S., Wang, G., and Jiang, M. (2020). Soil seed banks and restoration potential of tussock sedge meadows after farming in Changbai Mountain, China. Mar. Freshw. Res. 71, 1099–1106. doi: 10.1071/MF19025
Wang, X., Zhang, D., Qi, Q., Tong, S., An, Y., Lu, X., et al. (2019). The restoration feasibility of degraded Carex Tussock in soda-salinization area in arid region. Ecol. Indic. 98, 131–136. doi: 10.1016/j.ecolind.2018.08.066
Wright, I. J., Reich, P. B., Westoby, M., Ackerly, D. D., Baruch, Z., Bongers, F., et al. (2004). The worldwide leaf economics spectrum. Nature 428, 821–827. doi: 10.1038/nature02403
Wright, S. J., Yavitt, J. B., Wurzburger, N., Turner, B. L., Tanner, E. V. J., Sayer, E. J., et al. (2011). Potassium, phosphorus or nitrogen limit root allocation, tree growth, or litter production in a lowland tropical forest. Ecology 92, 1616–1625. doi: 10.1890/10-1558.1
Yan, H., Liu, R., Liu, Z., Wang, X., Luo, W., and Sheng, L. (2015). Growth and physiological responses to water depths in Carex schmidtii Meinsh. PLoS One 10:e0128176. doi: 10.1371/journal.pone.0128176
Yan, Z., Hou, X., Han, W., Ma, S., Shen, H., Guo, Y., et al. (2019). Effects of nitrogen and phosphorus supply on stoichiometry of six elements in leaves of Arabidopsis thaliana. Ann. Bot. 123, 441–450. doi: 10.1093/aob/mcy169
Yu, M. F., Tao, Y., Liu, W., Xing, W., Liu, G., Wang, L., et al. (2020). C, N, and P stoichiometry and their interaction with different plant communities and soils in subtropical riparian wetlands. Environ. Sci. Pollut. Res. 27, 1024–1034. doi: 10.1007/s11356-019-07004-x
Yu, Q., Elser, J. J., He, N., Wu, H., Chen, Q., Zhang, G., et al. (2011). Stoichiometric homeostasis of vascular plants in the Inner Mongolia grassland. Oecologia 166, 1–10. doi: 10.1007/s00442-010-1902-z
Yu, Q., Wilcox, K., Pierre, K. L., Knapp, A. K., Han, X., and Smith, M. D. (2015). Stoichiometric homeostasis predicts plant species dominance, temporal stability, and responses to global change. Ecology 96, 2328–2335. doi: 10.1890/14-1897.1
Zhang, D., Qi, Q., Tong, S., Wang, J., Zhang, M., Zhu, G., et al. (2021a). Effect of hydrological fluctuation on nutrient stoichiometry and trade-off of Carex schmidtii. Ecol. Indic. 120:106924. doi: 10.1016/j.ecolind.2020.106924
Zhang, D., Sun, J., Cui, Q., Jia, X., Qi, Q., Wang, X., et al. (2021b). Plant growth and diversity performance after restoration in Carex schmidtii tussock wetlands, Northeast China. Comm. Ecol. 22, 391–401. doi: 10.1007/s42974-021-00062-7
Zhang, D., Qi, Q., Tong, S., Wang, X., An, Y., Zhang, M., et al. (2019a). Soil degradation effects on plant diversity and nutrient in tussock meadow wetlands. J. Soil Sci. Plant Nutr. 19, 535–544. doi: 10.1007/s42729-019-00052-9
Zhang, D., Qi, Q., Wang, X., Tong, S., Lv, X., An, Y., et al. (2019b). Physiological responses of Carex schmidtii Meinsh to alternating flooding-drought conditions in the Momoge wetland, northeast China. Aquat. Bot. 153, 33–39. doi: 10.1016/j.aquabot.2018.11.010
Keywords: Carex schmidtii tussocks, nutrient trade-off, wetland restoration and degradation, nutrient dynamics, stoichiometric relationship
Citation: Zhang D, Xia J, Sun J, Dong K, Shao P, Wang X and Tong S (2022) Effect of Wetland Restoration and Degradation on Nutrient Trade-Off of Carex schmidtii. Front. Ecol. Evol. 9:801608. doi: 10.3389/fevo.2021.801608
Received: 25 October 2021; Accepted: 13 December 2021;
Published: 20 January 2022.
Edited by:
Zhenguo Niu, Aerospace Information Research Institute, Chinese Academy of Sciences (CAS), ChinaReviewed by:
Dario Liberati, University of Tuscia, ItalyXinhou Zhang, Nanjing Normal University, China
Copyright © 2022 Zhang, Xia, Sun, Dong, Shao, Wang and Tong. This is an open-access article distributed under the terms of the Creative Commons Attribution License (CC BY). The use, distribution or reproduction in other forums is permitted, provided the original author(s) and the copyright owner(s) are credited and that the original publication in this journal is cited, in accordance with accepted academic practice. No use, distribution or reproduction is permitted which does not comply with these terms.
*Correspondence: Dongjie Zhang, emhhbmdkb25namllMTRAbWFpbHMudWNhcy5hYy5jbg==; Shouzheng Tong, dG9uZ3Nob3V6aGVuZ0BpZ2EuYWMuY24=