 Zenon J. Czenze1,2†‡
 Marc T. Freeman1,2†
 Ryno Kemp1,2
 Barry van Jaarsveld1,2Blair O. Wolf3
 Andrew E. McKechnie1,2*
- 1South African Research Chair in Conservation Physiology, South African National Biodiversity Institute, Pretoria, South Africa
- 2DSI-NRF Centre of Excellence at the FitzPatrick Institute, Department of Zoology and Entomology, University of Pretoria, Pretoria, South Africa
- 3UNM Biology Department, The University of New Mexico, Albuquerque, NM, United States
Avian evaporative cooling and the maintenance of body temperature (Tb) below lethal limits during heat exposure has received more attention in small species compared to larger-bodied taxa. Here, we examined thermoregulation at air temperatures (Tair) approaching and exceeding normothermic Tb in three larger birds that use gular flutter, thought to provide the basis for pronounced evaporative cooling capacity and heat tolerance. We quantified Tb, evaporative water loss (EWL) and resting metabolic rate (RMR) in the ∼170-g Namaqua sandgrouse (Pterocles namaqua), ∼430-g spotted thick-knee (Burhinus capensis) and ∼670-g spotted eagle-owl (Bubo africanus), using flow-through respirometry and a stepped Tair profile with very low chamber humidities. All three species tolerated Tair of 56–60°C before the onset of severe hyperthermia, with maximum Tb of 43.2°C, 44.3°C, and 44.2°C in sandgrouse, thick-knees and eagle-owls, respectively. Evaporative scope (i.e., maximum EWL/minimum thermoneutral EWL) was 7.4 in sandgrouse, 12.9 in thick-knees and 7.8 in eagle-owls. The relationship between RMR and Tair varied substantially among species: whereas thick-knees and eagle-owls showed clear upper critical limits of thermoneutrality above which RMR increased rapidly and linearly, sandgrouse did not. Maximum evaporative heat loss/metabolic heat production ranged from 2.8 (eagle-owls) to 5.5 (sandgrouse), the latter the highest avian value yet reported. Our data reveal some larger species with gular flutter possess pronounced evaporative cooling capacity and heat tolerance and, when taken together with published data, show thermoregulatory performance varies widely among species larger than 250 g. Our data for Namaqua sandgrouse reveal unexpectedly pronounced variation in the metabolic costs of evaporative cooling within the genus Pterocles.
Introduction
Evaporative cooling and the maintenance of body temperature (Tb) below environmental temperature is critical for terrestrial taxa that encounter operative temperatures (Bakken, 1976; Robinson et al., 1976) exceeding normothermic Tb, or when metabolic heat produced during activity must be dissipated to avoid Tb reaching lethal limits (e.g., Nilsson and Nord, 2018; Thompson et al., 2018). There is increasing evidence that among endotherms, evaporative cooling has evolved in tandem with organismal traits such as surface water dependence (Czenze et al., 2020) and roost microsite preferences (Maloney et al., 1999; Cory Toussaint and McKechnie, 2012; Czenze et al., in press). Gaining a better understanding of the upper limits to animals’ evaporative cooling capacity and their exposure to extreme heat events has taken on new urgency in light of rapid global heating (IPCC, 2021), increasingly frequent heat-related mortality events (Welbergen et al., 2008; Ratnayake et al., 2019; McKechnie et al., 2021b) and large increases in risks of lethal dehydration or hyperthermia predicted for coming decades (Albright et al., 2017; Conradie et al., 2020).
On account of birds being predominantly small and diurnal and making limited use of thermally buffered diurnal refugia such as burrows, avian heat tolerance and evaporative cooling capacity has been the subject of long-standing interest among ecological physiologists (e.g., Dawson, 1954; Lasiewski and Seymour, 1972; Weathers, 1981). Maximum evaporative cooling capacity varies substantially among avian orders (reviewed by McKechnie et al., 2021a). Maximum ratios of evaporative heat loss/metabolic heat production (EHL/MHP) are consistently higher in taxa that use pronounced gular flutter (Dawson and Fisher, 1969; O’Connor et al., 2017) or have the capacity for rapid cutaneous evaporative water loss (Calder and Schmidt-Nielsen, 1967; Marder and Arieli, 1988; McKechnie et al., 2016a) compared to groups that rely on panting as their primary pathway of evaporative heat loss (Dawson, 1954; Weathers, 1981). Whereas fractional increases in EWL are broadly consistent across taxa, the metabolic heat production associated with panting means that evaporative cooling capacity and heat tolerance limits tend to be lower in passerines, which represent >50% of extant birds, compared to some non-passerine orders (McKechnie et al., 2021a).
The number of species for which evaporative cooling capacity and heat tolerance limits have been quantified under standardised conditions has increased substantially in the last decade, facilitating direct comparisons among taxa (e.g., Whitfield et al., 2015; Smith et al., 2017; Smit et al., 2018). However, the body mass (Mb) of most species investigated is <100 g, and much less is known about limits to heat tolerance in larger species. Two notable exceptions include the ∼610-g brown-necked raven (Corvus ruficollis), in which Marder (1973) reported Tb = 44.7°C and EHL/MHP = 1.67 at an air temperature (Tair) of 50°C, and the ∼1300-g MacQueen’s bustard (Chlamydotis macqueenii) which maintains Tb < 43°C even at Tair as high as 55°C (Tieleman et al., 2002). In the latter study, bustards showed no discernable increase in RMR above a lower critical limit of thermoneutrality of 28.5°C, but a ∼10-fold increase in evaporative water loss (EWL) above minimum thermoneutral levels.
In light of the limited data available for medium- and large-bodied birds and the negative allometric scaling of variables such as surface area – volume ratio and EWL as a fraction of total body water per unit time, we quantified upper limits to heat tolerance and evaporative cooling capacity in three medium-sized southern African species: Namaqua sandgrouse (Pterocles namaqua; ∼170 g, Pterocliformes), spotted thick-knee (Burhinus capensis; ∼430 g, Charadriiformes) and spotted eagle-owl (Bubo africanus; ∼670 g, Strigiformes). We employed the same standardised methods of a stepped Tair profile and very low chamber humidities used in several recent studies (e.g., Whitfield et al., 2015; Smith et al., 2017; Smit et al., 2018). Because these three orders are all known to employ gular flutter (Bartholomew et al., 1968; Thomas and Robin, 1977; Ward, 1990), we expected that maximum EHL/MHP and heat tolerance limits (HTL: maximum Tair tolerated before onset of severe hyperthermia) are relatively high in these species.
Materials and Methods
Study Site and Species
The thermoregulatory capacity of three species representing three orders was assessed during the 2018–2019 austral summer (2 December – 4 February) at the 76-km2 Black Mountain Mine Conservation Area (29°18′S, 18°51′E) near Aggeneys, Northern Cape, South Africa. The Black Mountain Mine Conservation Area is situated within the Koa River Valley, which consists predominantly of red sand dunes with scattered shrubs (Rhigozum trichotomum) and large-seeded grasses (Brachiaria glomerata, Stipagrostis amabilis, Stipagrostis ciliata, and Stipagrostis brevifolia). In parts of the study site, the dunes are separated by unvegetated gravel plains. The climate is arid with mean annual precipitation of ∼100 mm and daily maximum Tair that ranged from 26.4 to 40.3°C during the study period (Kemp et al., 2020). The study species varied in Mb, as well as foraging behaviour, water dependence and activity phase (Table 1). We captured eight Namaqua sandgrouse (hereafter, sandgrouse), 10 spotted thick-knees (hereafter, thick-knees), and seven spotted eagle-owls (hereafter, eagle-owls). Namaqua sandgrouse were captured at a regularly frequented drinking spot using mist nets. Eagle-owls were captured at night opportunistically using a modified spring trap baited with two live mice. Thick-knees were captured at night using a hand-held net and torch.
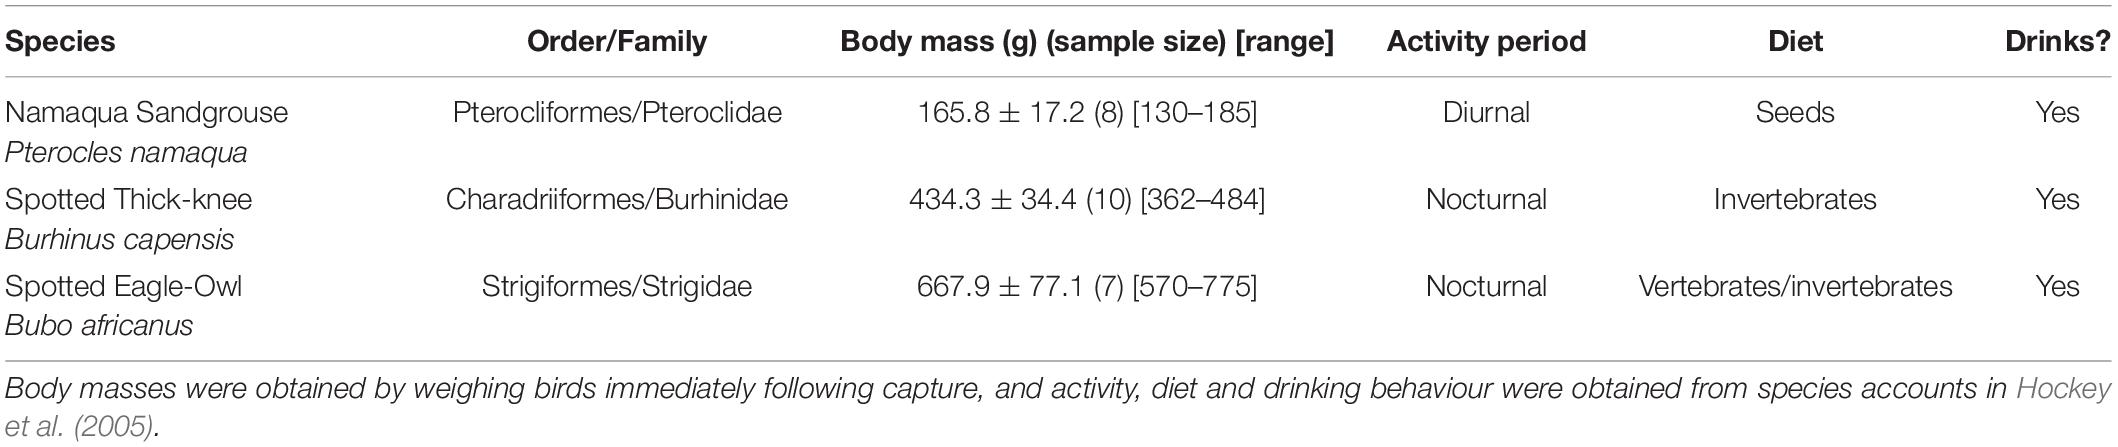
Table 1. Taxonomy, body mass, activity period, major diet and water dependence of the three study species.
Captured birds were placed in clean cloth bags and transported (approximately 45-min trip by vehicle) to an animal holding room where they were kept indoors in individual cages (0.8 m3). Individuals were kept in cages for no more than 12 h and provided with an ad libitum supply of water. In the case of the eagle-owls and thick-knees, experimental procedures took place the morning following capture, ≥10 h after birds last fed. In the case of sandgrouse, the time between capture and being placed in respirometry chambers was ∼ 3 h.
Air and Body Temperature
A temperature-sensitive passive integrated transponder (PIT) tag (BioTherm13, Biomark, Boise, ID, United States) injected into each individual’s abdominal cavity measured Tb. We calibrated these tags in a circulating water bath (model F34; Julabo, Seelbach, Germany) over a 35–50°C range against a thermistor probe (TC-100; Sable Systems, Las Vegas, NV, United States). We placed PIT-tagged individuals in a metabolic chamber placed next to an antenna connected to a transceiver system (HPR+; Biomark). The PIT tags we used for this study were from the same batch as the 23 tags calibrated by Freeman et al. (2020), who found that measured values deviated from actual values by 0.28 ± 0.23°C. We inserted a thermistor probe (TC-100; Sable Systems) sealed with a rubber grommet through the approximate centre of the lid of each metabolic chamber to measure Tair during the gas exchange measurements.
Gas Exchange
We measured EWL and carbon dioxide production () using an open flow-through respirometry system. The metabolic chamber consisted of either a 12.8-L (sandgrouse) or 60-L (eagle owl and thick-knee) air-tight plastic container (previously shown to not adsorb water vapour; Whitfield et al., 2015). Plastic mesh platforms were placed in the metabolic chambers to ensure individuals were elevated at least ∼10 cm above a ∼1 cm layer of mineral oil. These plastic chambers were situated within a temperature-controlled custom-built aluminium box (∼640 L). The Tair within the chamber was controlled via a Peltier device (AC-162 Thermoelectric Air Cooler; TE Technology, Traverse City, MI, United States) connected to a digital controller (TC-36-25-RS485 Temperature Controller; TE Technology) and mounted to the side of the box.
Atmospheric air was supplied by an oil-free compressor and passed through a membrane dryer (Champion CMD3 air dryer and filter; Champion Pneumatic, Princeton, IL, United States) to scrub water vapour before being split into baseline and experimental channels. A needle valve (Swagelok, Solon, OH, United States) regulated flow rate in the baseline channel and a mass flow controller (MC50 SLPM, Alicat Scientific Inc., Tucson, AZ, United States), calibrated using a soap-bubble flow meter (Gilibrator-2; Sensidyne, St. Petersburg, FL, United States), regulated flow rates in the experimental channel. To maximise air mixing, and minimise any potential convective cooling at higher flow rates, we positioned the air inlet near the top of the metabolic chamber with an elbow joint facing upward and the air outlet below the mesh platform. Flow rates (13–65 L min–1) were adjusted to maintain humidity at a dewpoint <−5°C within the chamber, depending on Tair, Mb and individual behaviour, while still allowing for the accurate measurements of differences in water vapour and CO2 between incurrent and excurrent air. A respirometry multiplexer (model MUX3-110118M, Sable Systems) in manual mode and an SS-3 Subsampler (Sable Systems) subsampled excurrent air from the baseline and chamber air. Subsampled air was pulled through a CO2/H2O analyser (model LI-840A; LI-COR, Lincoln, NE, United States). The CO2/H2O analyser was regularly zeroed using nitrogen, and spanned for CO2 using a certified calibration gas (CO2 concentration = 2,000 ppm; Afrox, South Africa). We regularly zeroed the H2O sensor of the LI-840A using nitrogen and spanned it using air with a known dewpoint produced by a dewpoint generator (DG-4; Sable Systems). The system’s tubing was Bev-A-Line IV tubing (Thermoplastic Processes Inc.). An analogue-digital converter (model UI-3; Sable Systems) digitised voltage outputs from the thermistor probes and analysers, which were recorded every 5 s using Expedata software (Sable Systems).
Experimental Protocol
Following Czenze et al. (2020) we placed individuals in chambers prior to measurements to habituate. Before measurements commenced, individuals were held without food for at least 1 h in the metabolic chamber, and together with the preceding period of fasted captivity ensured birds were likely postabsorptive when data collection started (Karasov, 1990).
Measurements took place during the day and individuals were exposed to a stepped series of progressively higher Tair values over which and EWL were recorded. We started measurements with a baseline air subsample until water and CO2 readings were stable (∼5 min). Chamber excurrent air was then subsampled once Tair had stabilised at the target value. We recorded data at this Tair until and H2O traces were stable for at least 10 min, with individuals spending approximately 20–25 min at the target Tair before we switched back to baseline air for another 5 min. Trials began at 28°C with 4°C increases until 40°C and then 2°C increases until a maximum of 60°C (the maximum Tair our thermistors could accurately measure). We monitored individuals continuously using an infrared video camera. Individuals were removed from the chamber when they reached their thermal endpoints [i.e., loss of coordination or balance, sudden and rapid decrease in EWL or resting metabolic rate (RMR), rapid and uncontrolled increase in Tb to values >45°C] or displayed sustained escape behaviours like agitated jumping. In the case of the sandgrouse, measurements were terminated at Tair slightly above 60°C. Once an individual was removed from the chamber we quickly dabbed its underbelly with ethanol to facilitate rapid cooling and held it under chilled air produced by an air conditioner. Once the individual’s Tb was stable (40–42°C), we offered it water using a syringe, and placed it back in its cage to rest, with ad libitum water available. The bird was later released at the site of capture. This experimental protocol has been used previously on birds and bats and individuals recaptured several days or weeks post-release showed no adverse effects (Kemp and McKechnie, 2019; Czenze et al., in press).
Data Analysis
We used the R package segmented (Muggeo, 2008) to perform a broken stick regression analysis in R 3.5.2 (R Core Team, 2018) to identify inflection points for EWL, RMR, Tb, and EHL/MHP. To determine whether a broken-stick regression fit the data better than a simple linear model, we compared broken-stick models against generalised mixed-effect models created in R package nlme (Pinheiro et al., 2009) using ANOVA. If we retained a broken stick regression and significant inflections occurred, we analysed data below and above inflection points separately when estimating slopes for the relationships of EWL, RMR, EHL/MHP, and Tb as functions of Tair. We created general linear mixed-effect models for each species using the R package nlme to test for an effect of Tair on each response variable above inflection points. We accounted for the repeated measures design of our study (i.e., measurements at multiple Tair values per individual) by including individual identity as a random factor in all analyses. Initial models contained Tair, Mb, and the Tair:Mb interaction and model selection was performed using the “dredge” function in the MuMIn package (Bartoń, 2013). We selected the model with the highest rank among competing models using Akaike weights and Akaike information criterion values corrected for small sample size (AICc) (Burnham and Anderson, 2002). Body mass did not emerge as an important predictor for any of the response variables of any species. We assessed significance at α < 0.05 and values are presented as mean ± SD.
Results
Body and Air Temperature
Normothermic Tb at thermoneutrality varied by ∼1.4°C among species, from 39.1 ± 0.4 (°C) in eagle-owls to 40.5 ± 0.4 (°C) in thick-knees (Figure 1 and Table 2). All three species showed significant increases in Tb above normothermic levels when exposed to higher Tair (Figure 1). In thick-knees and eagle-owls, significant inflections above which Tb increased rapidly occurred at Tair = 40.7°C and Tair = 50.9°C, respectively (Table 2 and Figure 1). At Tair values above these inflection points, Tb increased significantly (t = 16.94, P < 0.001 and t = 7.36, P < 0.001, respectively) and in a linear fashion in thick-knees and eagle-owls. In sandgrouse, on the other hand, no inflection was evident and a linear model provided the best fit for the relationship between Tb and Tair ≥ 32.5°C [the value we assumed to represent this species’ lower critical limit of thermoneutrality (Figure 2)]. Over this Tair range, Tb increased significantly (t = 18.53, P < 0.001) to a maximum of 43.2 ± 0.8°C (n = 7). Mean maximum Tb values at very high Tair varied among the three species from 43.2°C to 44.3°C (Table 2). Heat tolerance limits (HTL, i.e., maximum Tair tolerated before thermal endpoints reached) varied from 56°C in thick-knees to 60°C in eagle-owls and Namaqua sandgrouse (Table 2), although HTL for the latter species may be even higher in some individuals.
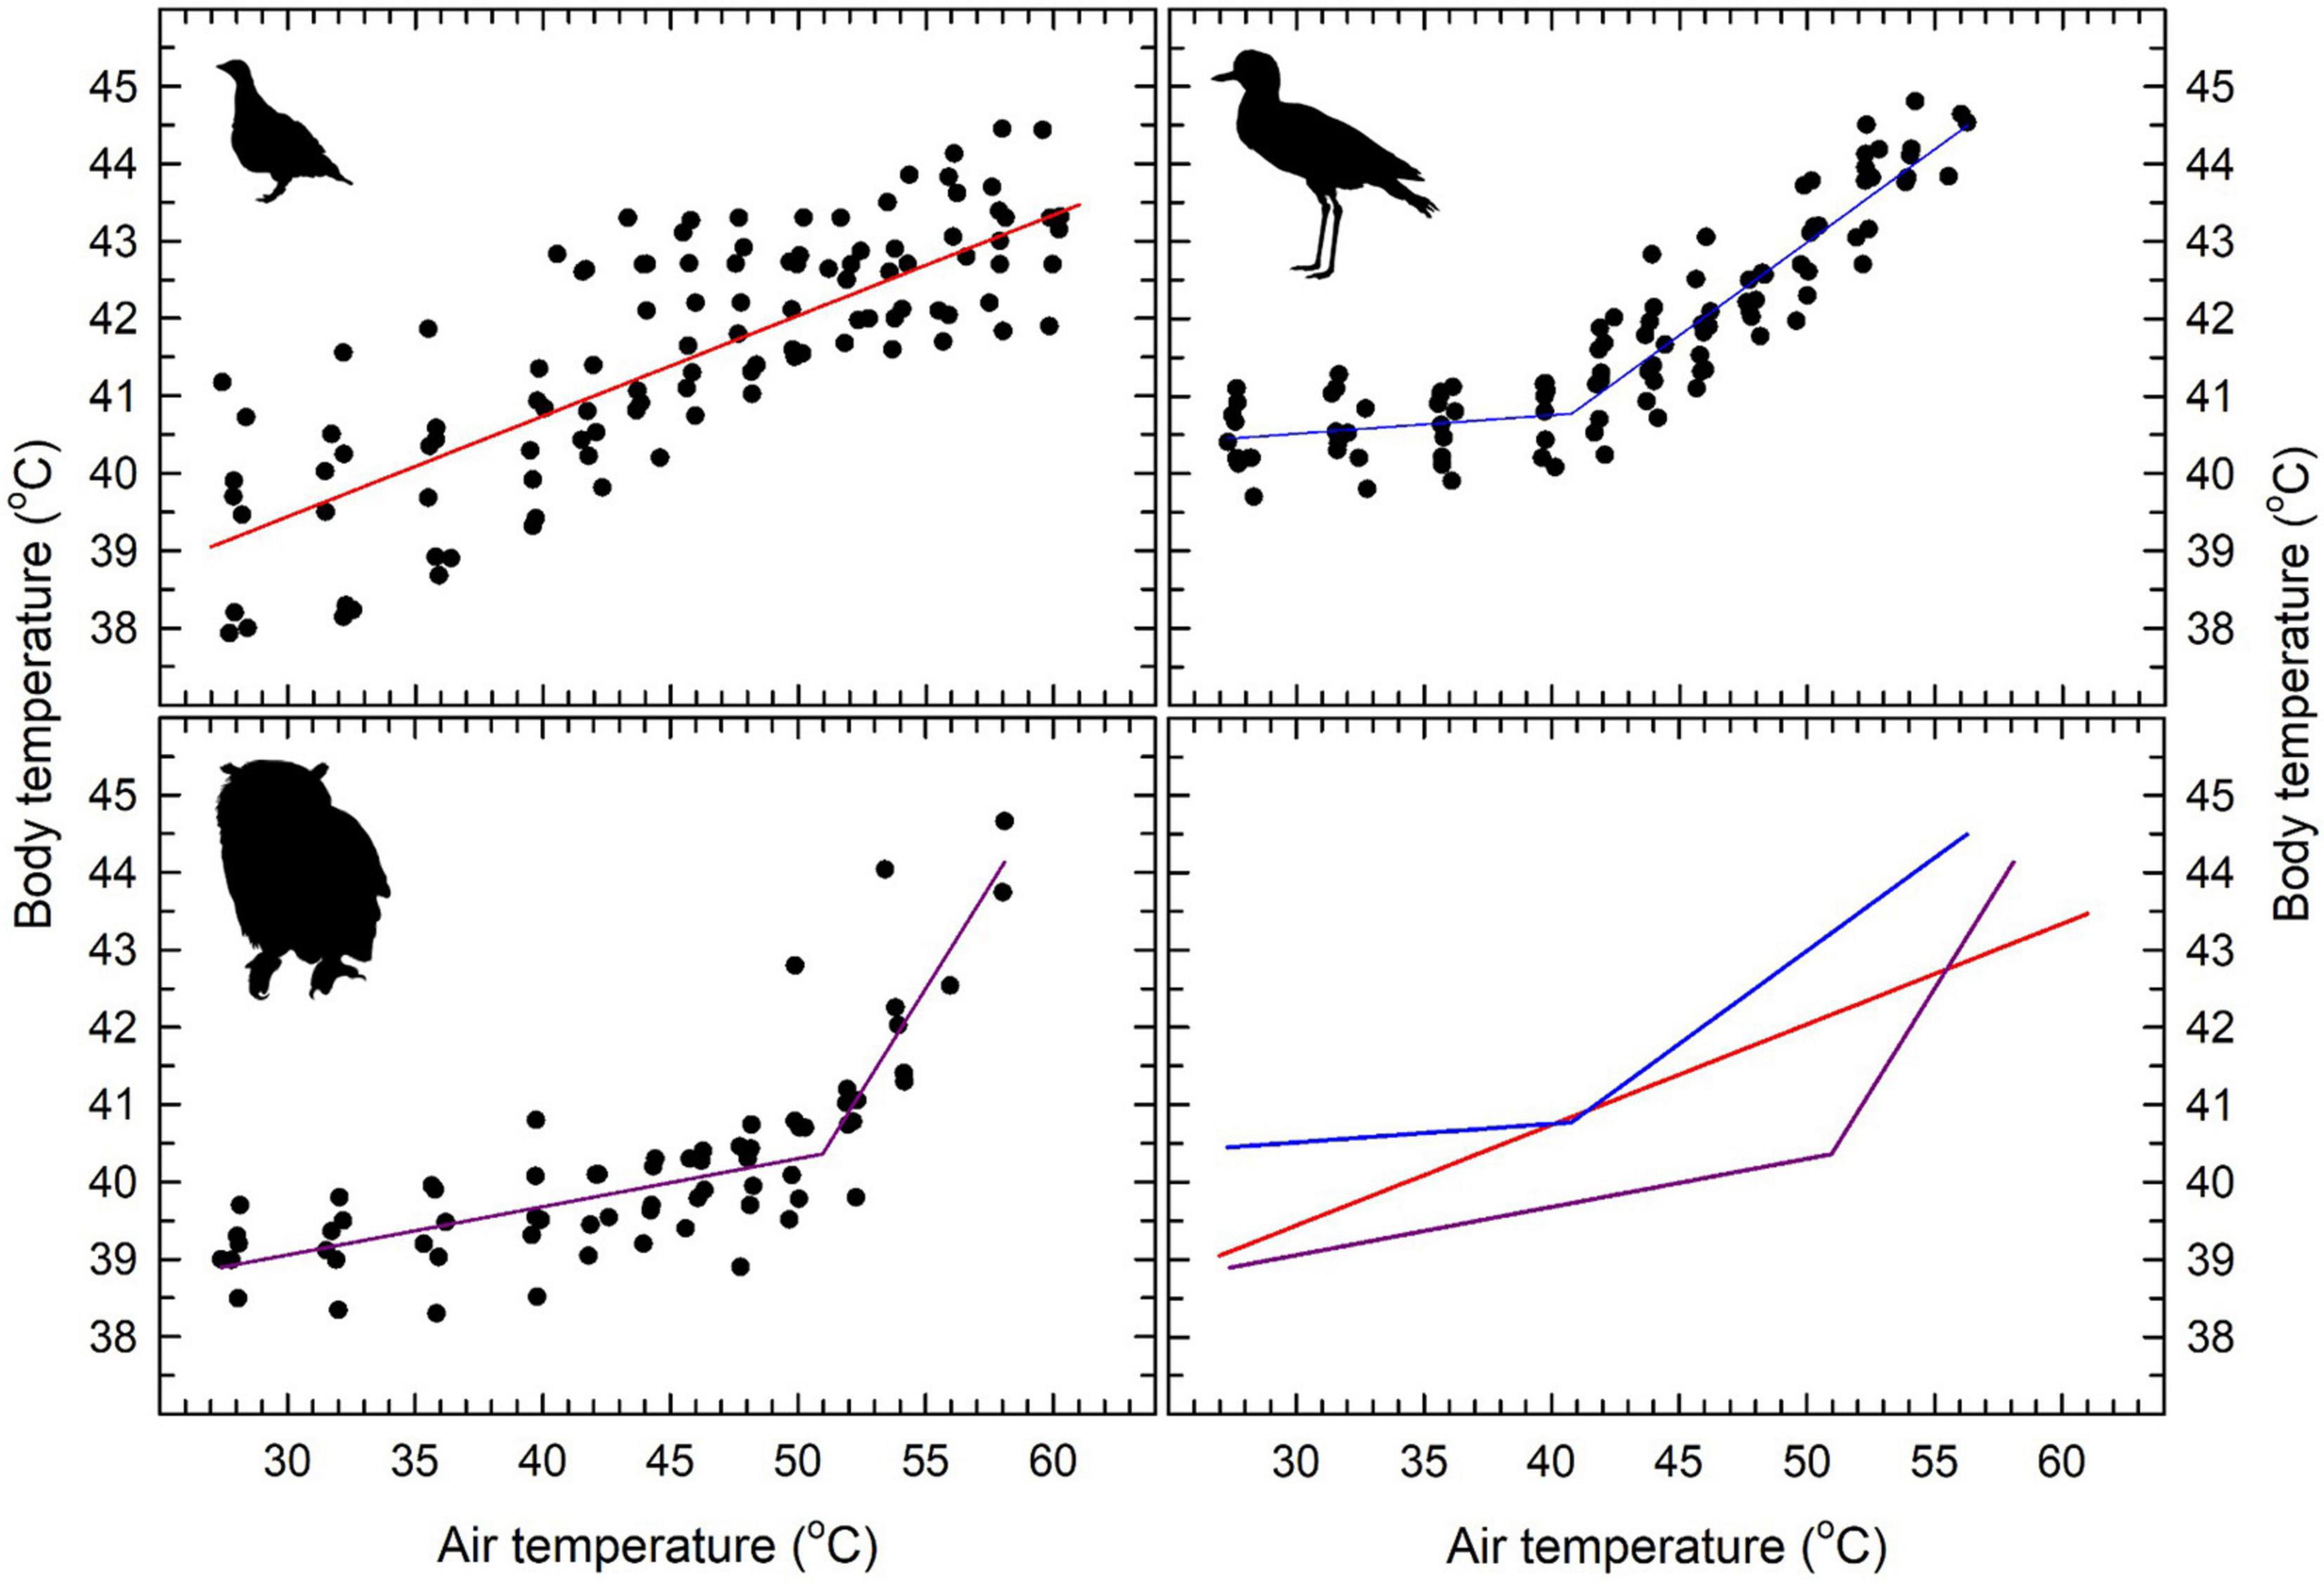
Figure 1. Relationships between body temperature (Tb) and air temperature (Tair) in three species from the southern African arid zone: Namaqua sandgrouse (Pterocles namaqua; top left), spotted thick-knees (Burhinus capensis; top right) and spotted eagle-owls (Bubo africanus; lower left). The solid lines show a linear regression model (sandgrouse) or segmented linear regression model (thick-knees and owls). Inflection Tair values and slopes for relationships between Tb and Tair are provided in Table 2. The lower right panel shows the regression models for all three species for comparative purposes. The bird silhouettes were obtained from http://phylopic.org: Pterocles (Tarique Sani, John E. McCormack, Michael G. Harvey, Brant C. Faircloth, Nicholas G. Crawford, Travis C. Glenn, Robb T. Brumfield and T. Michael Keesey), Burhinus (Auckland Museum) and Bubo (Lukasiniho). They are reproduced here under Creative Commons Licences (sandgrouse and thick-knee: https://creativecommons.org/licenses/by/3.0/; owl: https://creativecommons.org/licenses/by-nc-sa/3.0/).
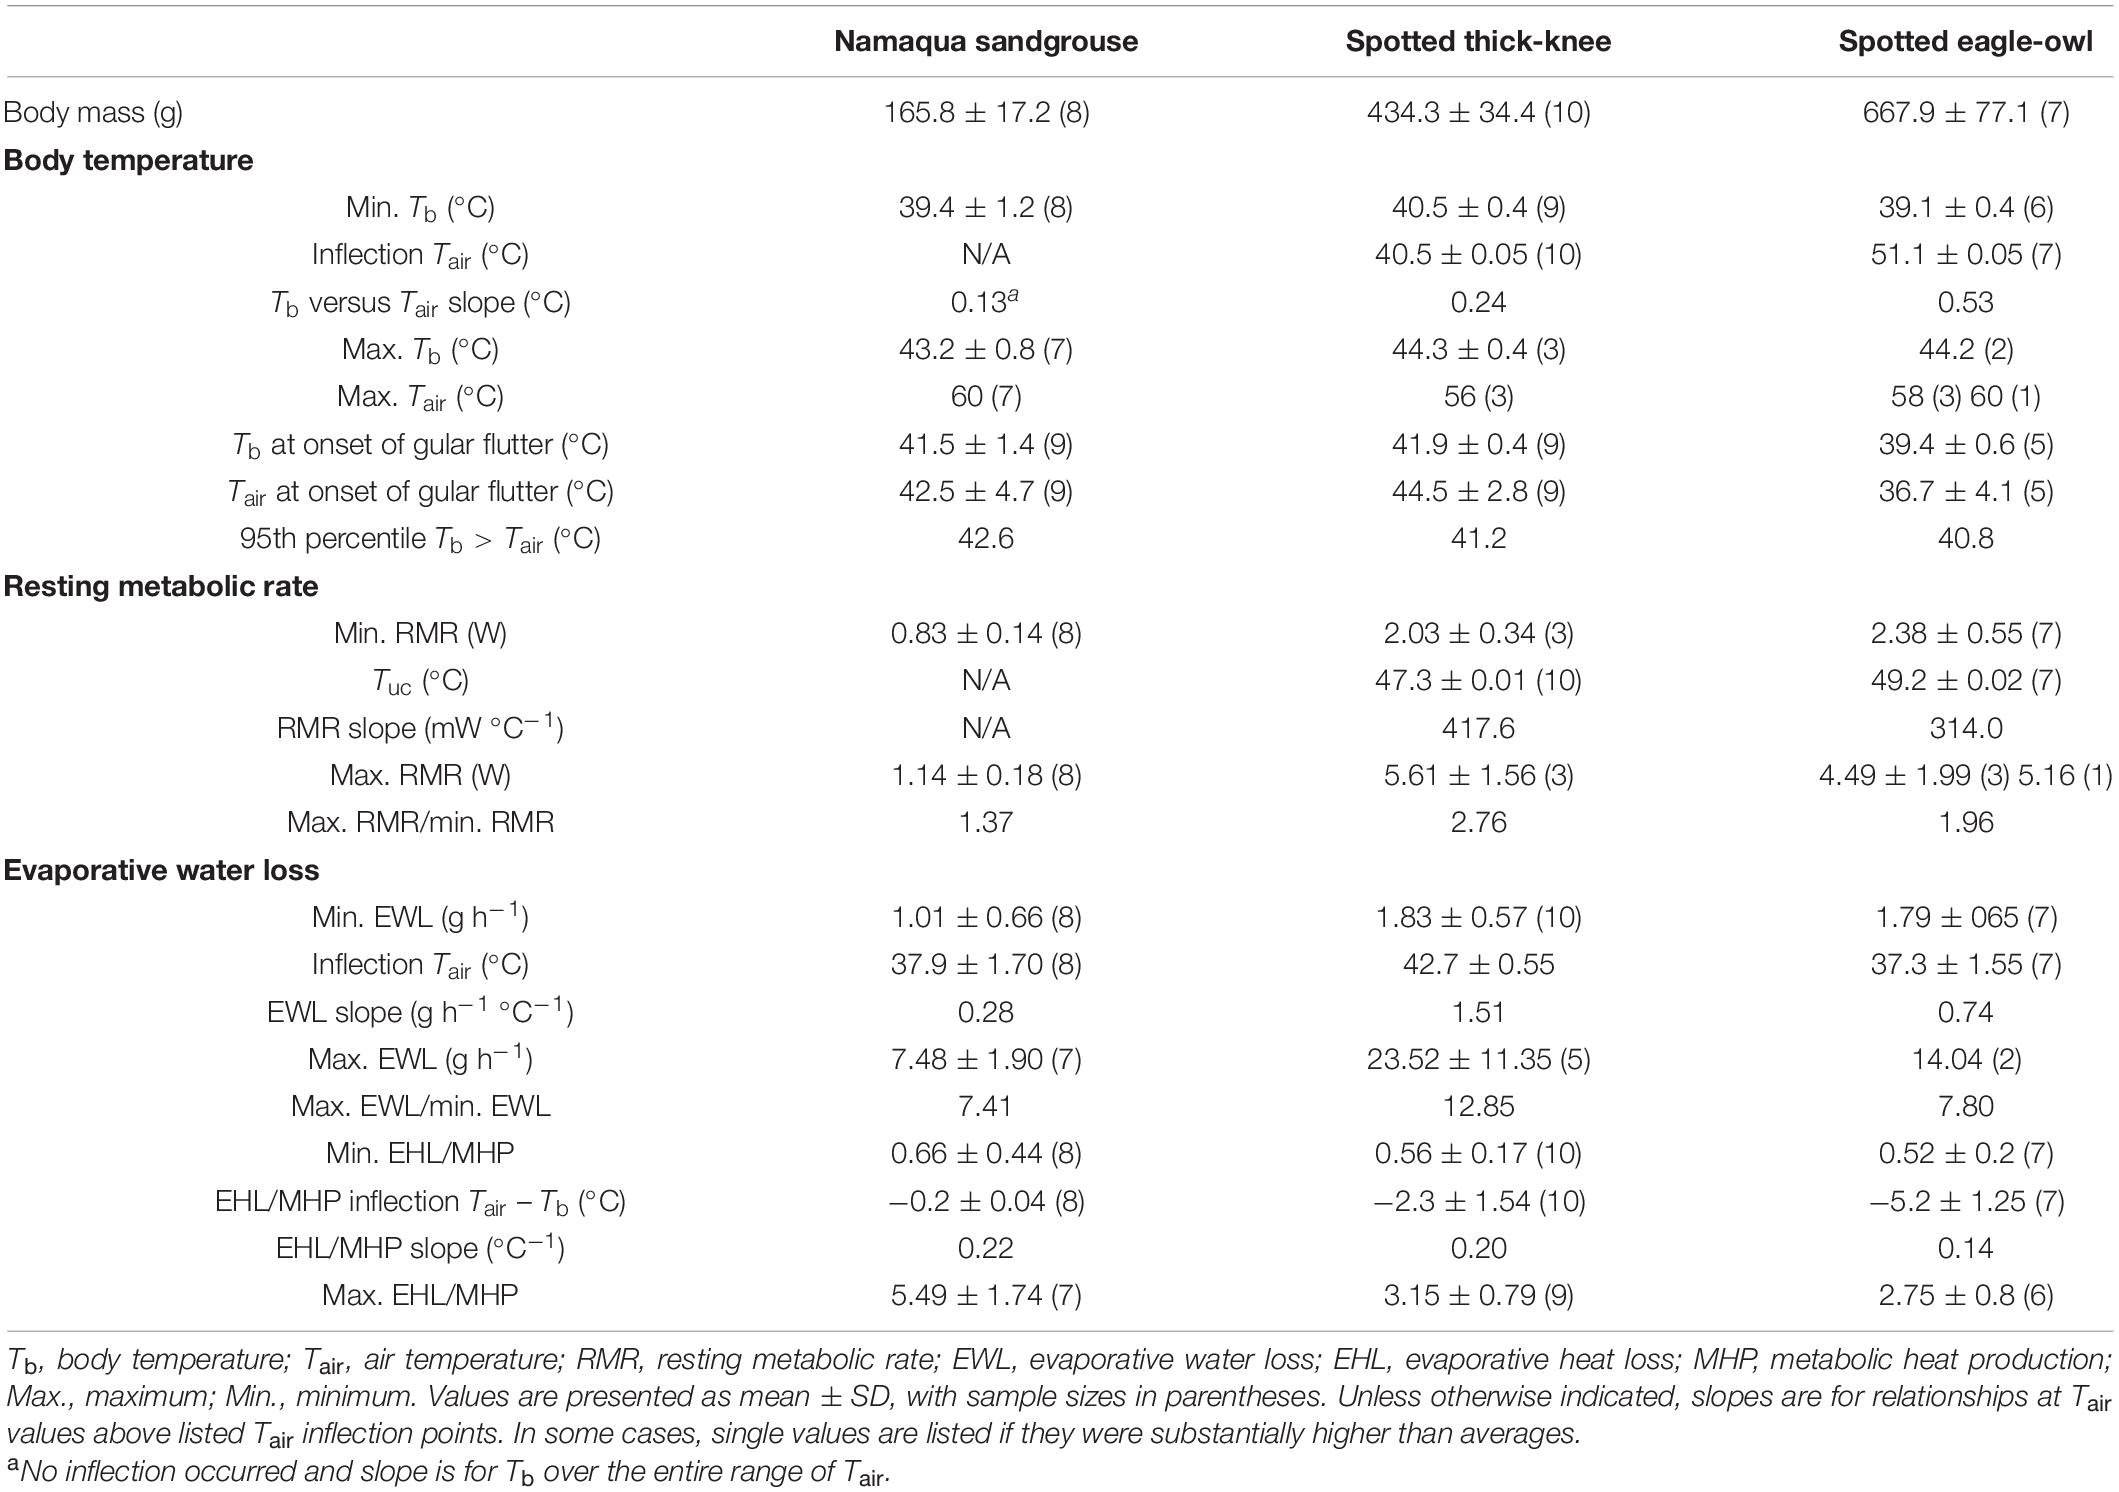
Table 2. Variables related to interactions between body temperature, metabolic heat production and evaporative heat dissipation as functions of air temperature in three species from the arid zone of southern Africa, quantified using flow-through respirometry: Namaqua sandgrouse (Pterocles namaqua), spotted thick-knees (Burhinus capensis) and spotted eagle-owls (Bubo africanus).
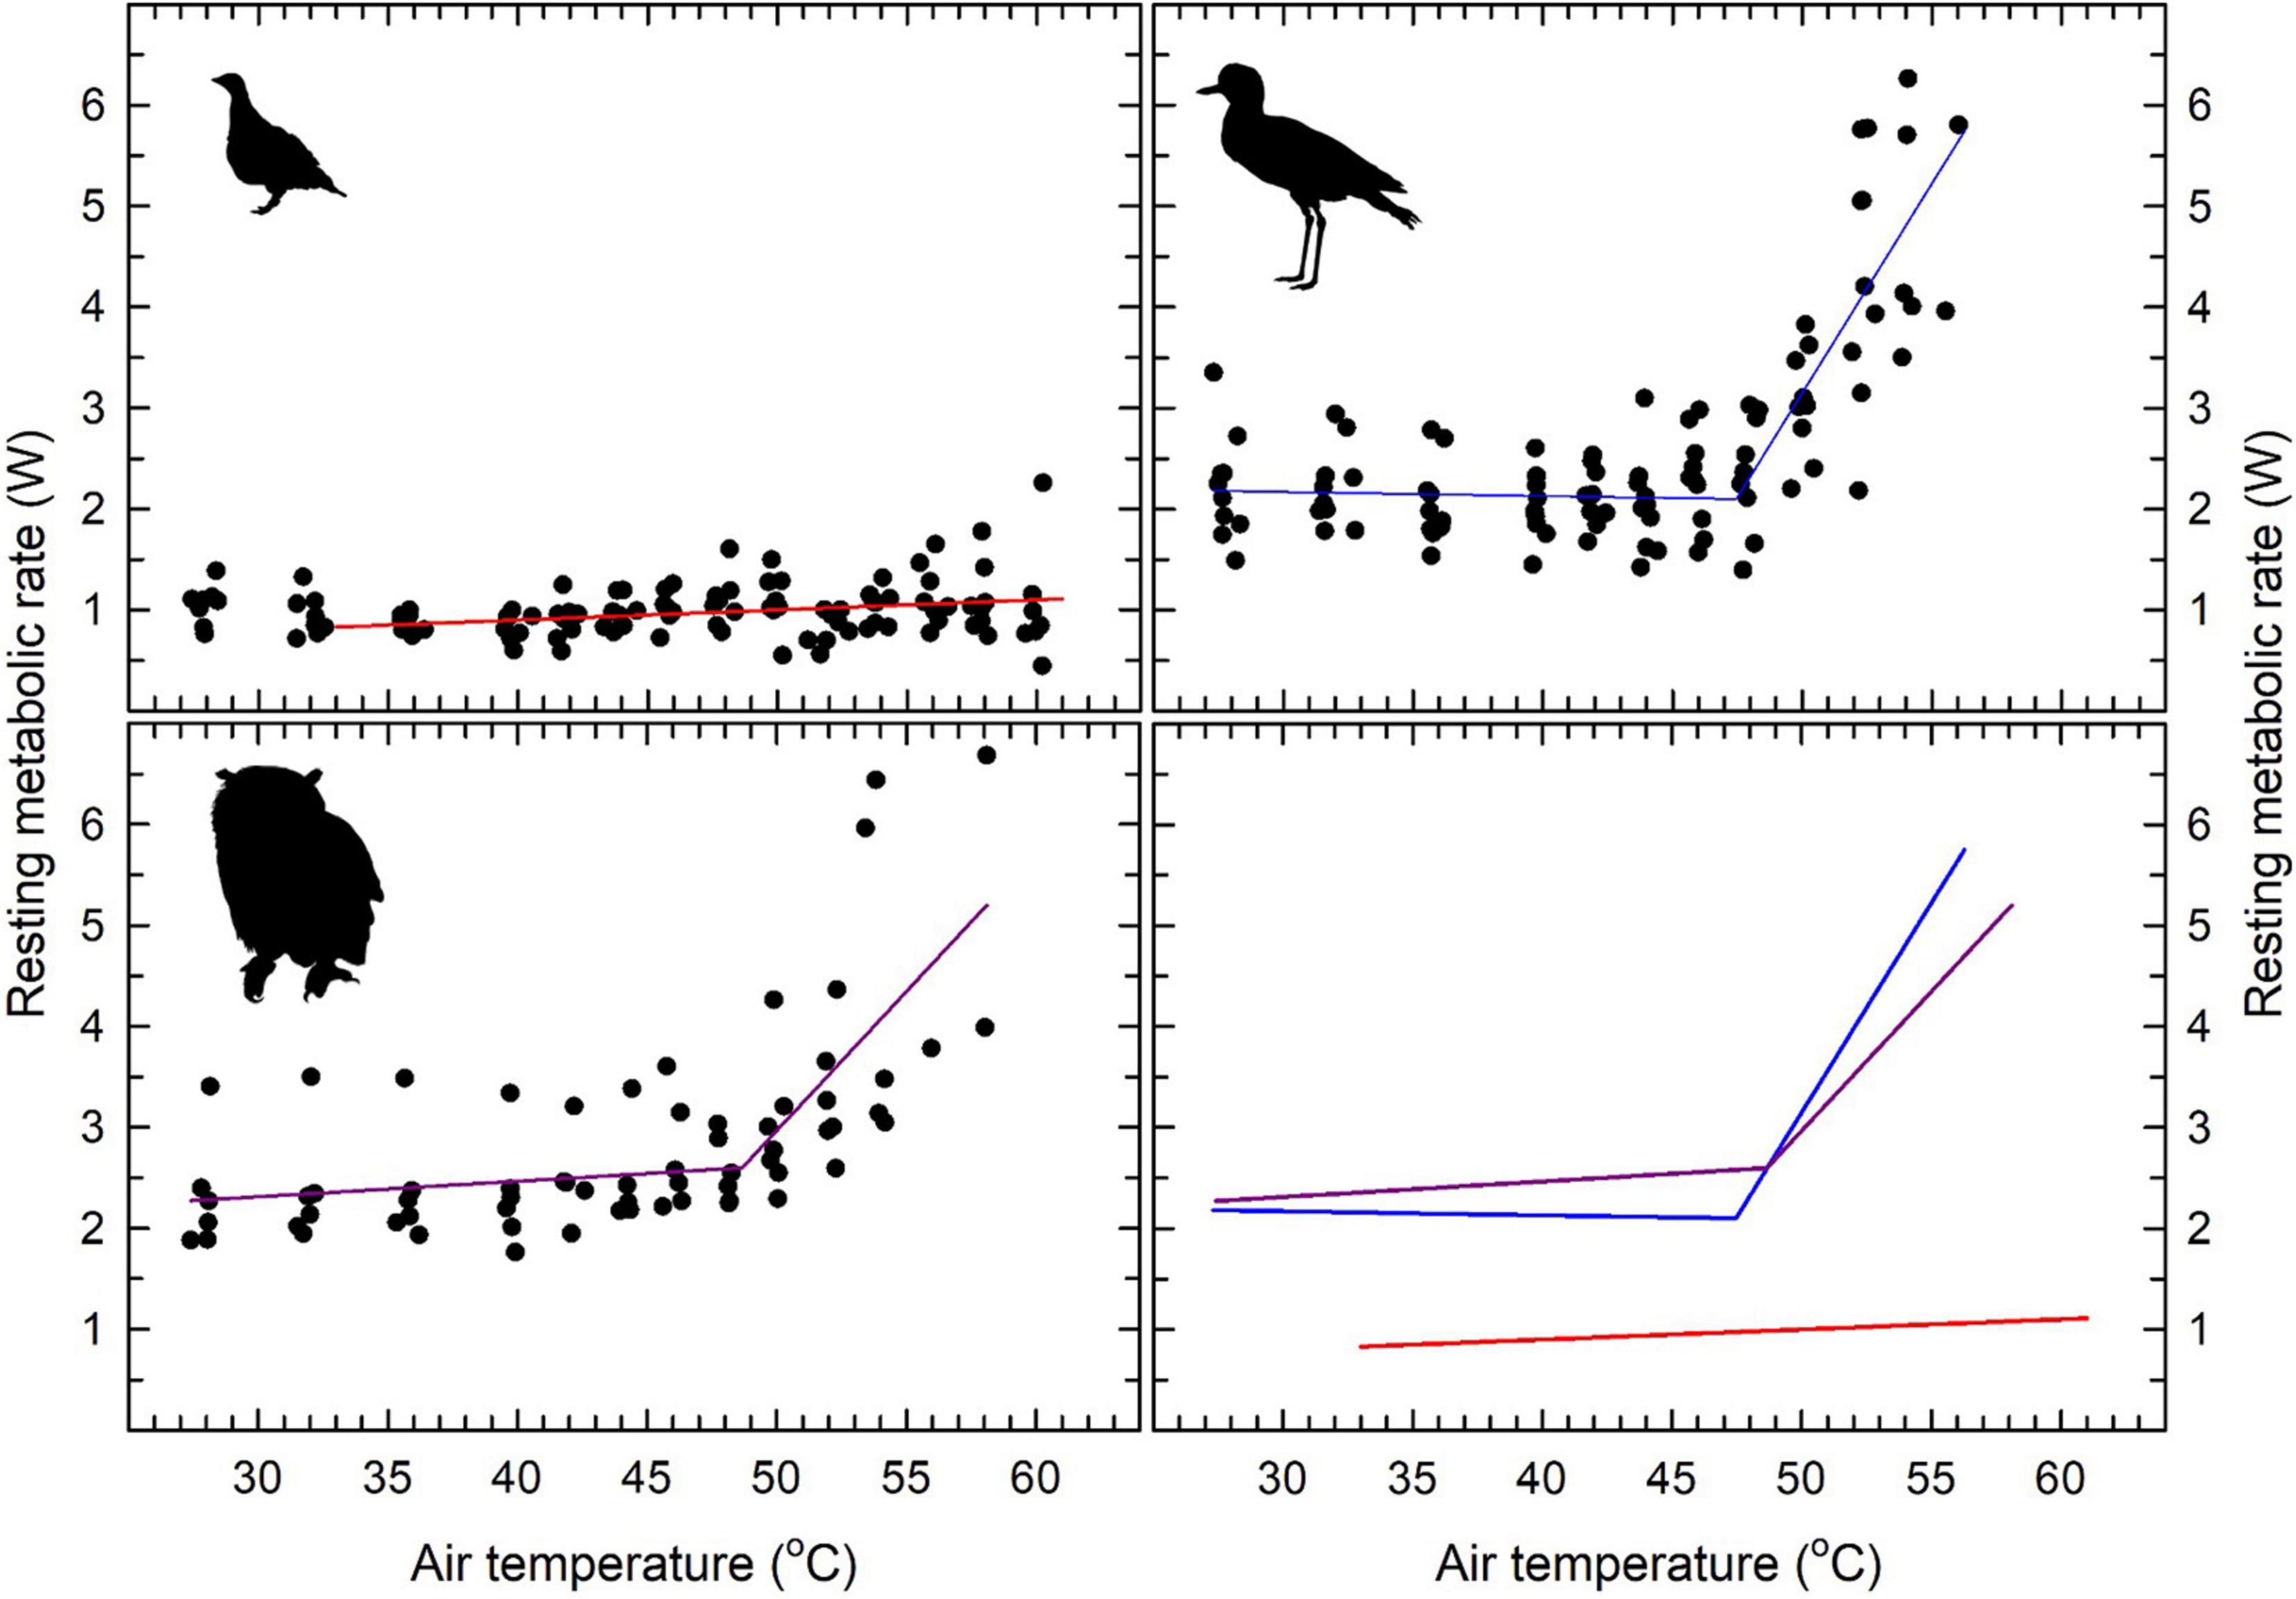
Figure 2. Resting metabolic rate (RMR) showed a clear inflection (i.e., upper critical limit of thermoneutrality; Tuc) in spotted thick-knees (Burhinus capensis; top right) and spotted eagle-owls (Bubo africanus; lower left), but no inflection was evident for Namaqua sandgrouse (Pterocles namaqua; top left). Segmented linear regression models are shown for thick-knees and owls using solid lines, whereas the relationship between Tair and RMR in sandgrouse was non-significant. Inflection Tair values and slopes for relationships between Tb and Tair are provided in Table 2. The lower right panel shows patterns for all three species for comparative purposes. Sources of the bird silhouettes are provided in the Figure 1 legend.
Resting Metabolic Rate
Minimum thermoneutral RMR values varied from 0.83 W in Namaqua sandgrouse to 2.38 W in the eagle-owl (Table 2). Namaqua sandgrouse did not show a significant inflection in RMR, which did not vary significantly with Tair (Figure 2). In contrast, significant inflections in RMR were evident for both thick-knees and eagle owls (Table 2), above which linear increases in RMR were significant (t = 9.15, P < 0.001 and t = 4.1, P < 0.001, respectively; Figure 2). These inflection Tair values, which correspond to the upper critical limits of thermoneutrality (Tuc), were Tair = 47.3°C in thick-knees and Tair = 49.2°C in eagle-owls. Maximum RMR at the highest Tair achieved was equivalent to 137%, 196%, and 276% of minimum thermoneutral values in Namaqua sandgrouse, eagle-owls and thick-knees, respectively (Figure 2). Mass-specific maximum RMR in thick-knees was ∼85% higher compared to sandgrouse or eagle-owls (Table 3).
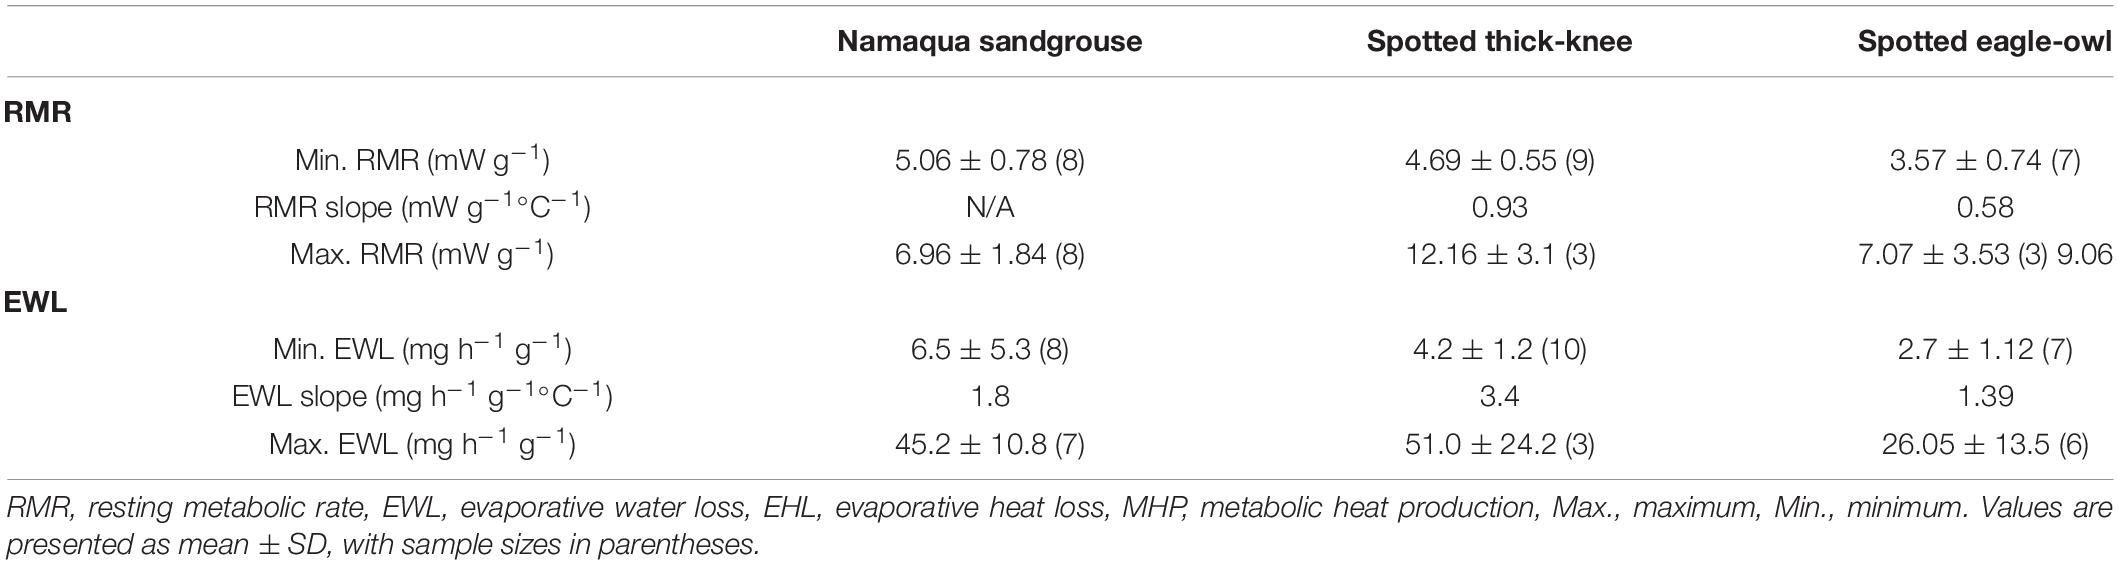
Table 3. Mass-specific resting metabolic rate (RMR) and evaporative water loss (EWL) at high air temperature in three species from the arid zone of southern African: Namaqua sandgrouse (Pterocles namaqua), spotted thick-knees (Burhinus capensis) and spotted eagle-owls (Bubo africanus).
Evaporative Water Loss
Gular flutter commenced at Tair between 36.7°C and 44.5°C and Tb between 39.4°C and 42.4°C (Table 2). Minimum EWL varied nearly 2-fold from 1.01 g h–1 in Namaqua sandgrouse to 1.83 g h–1 in thick-knees (Table 2 and Figure 3). All species showed clear inflection points above which EWL increased rapidly and linearly; these varied from Tair = 33.9°C in Namaqua sandgrouse to Tair = 42.8°C in thick-knees (Table 1 and Figure 3). Increases in EWL were significant for sandgrouse (t = 19.94, P < 0.001), thick knees (t = 13.67, P < 0.001), and eagle owls (t = 19.59, P < 0.01). Maximum rates of EWL ranged from 7.48 g h–1 in Namaqua sandgrouse to 23.52 g h–1 in thick-knees, with the highest mass-specific values in thick-knees (Table 3). The fractional increase in EWL (i.e., the ratio of maximum EWL to minimum EWL) ranged from ∼7.41 for Namaqua sandgrouse to ∼12.85 for thick-knees (Table 2).
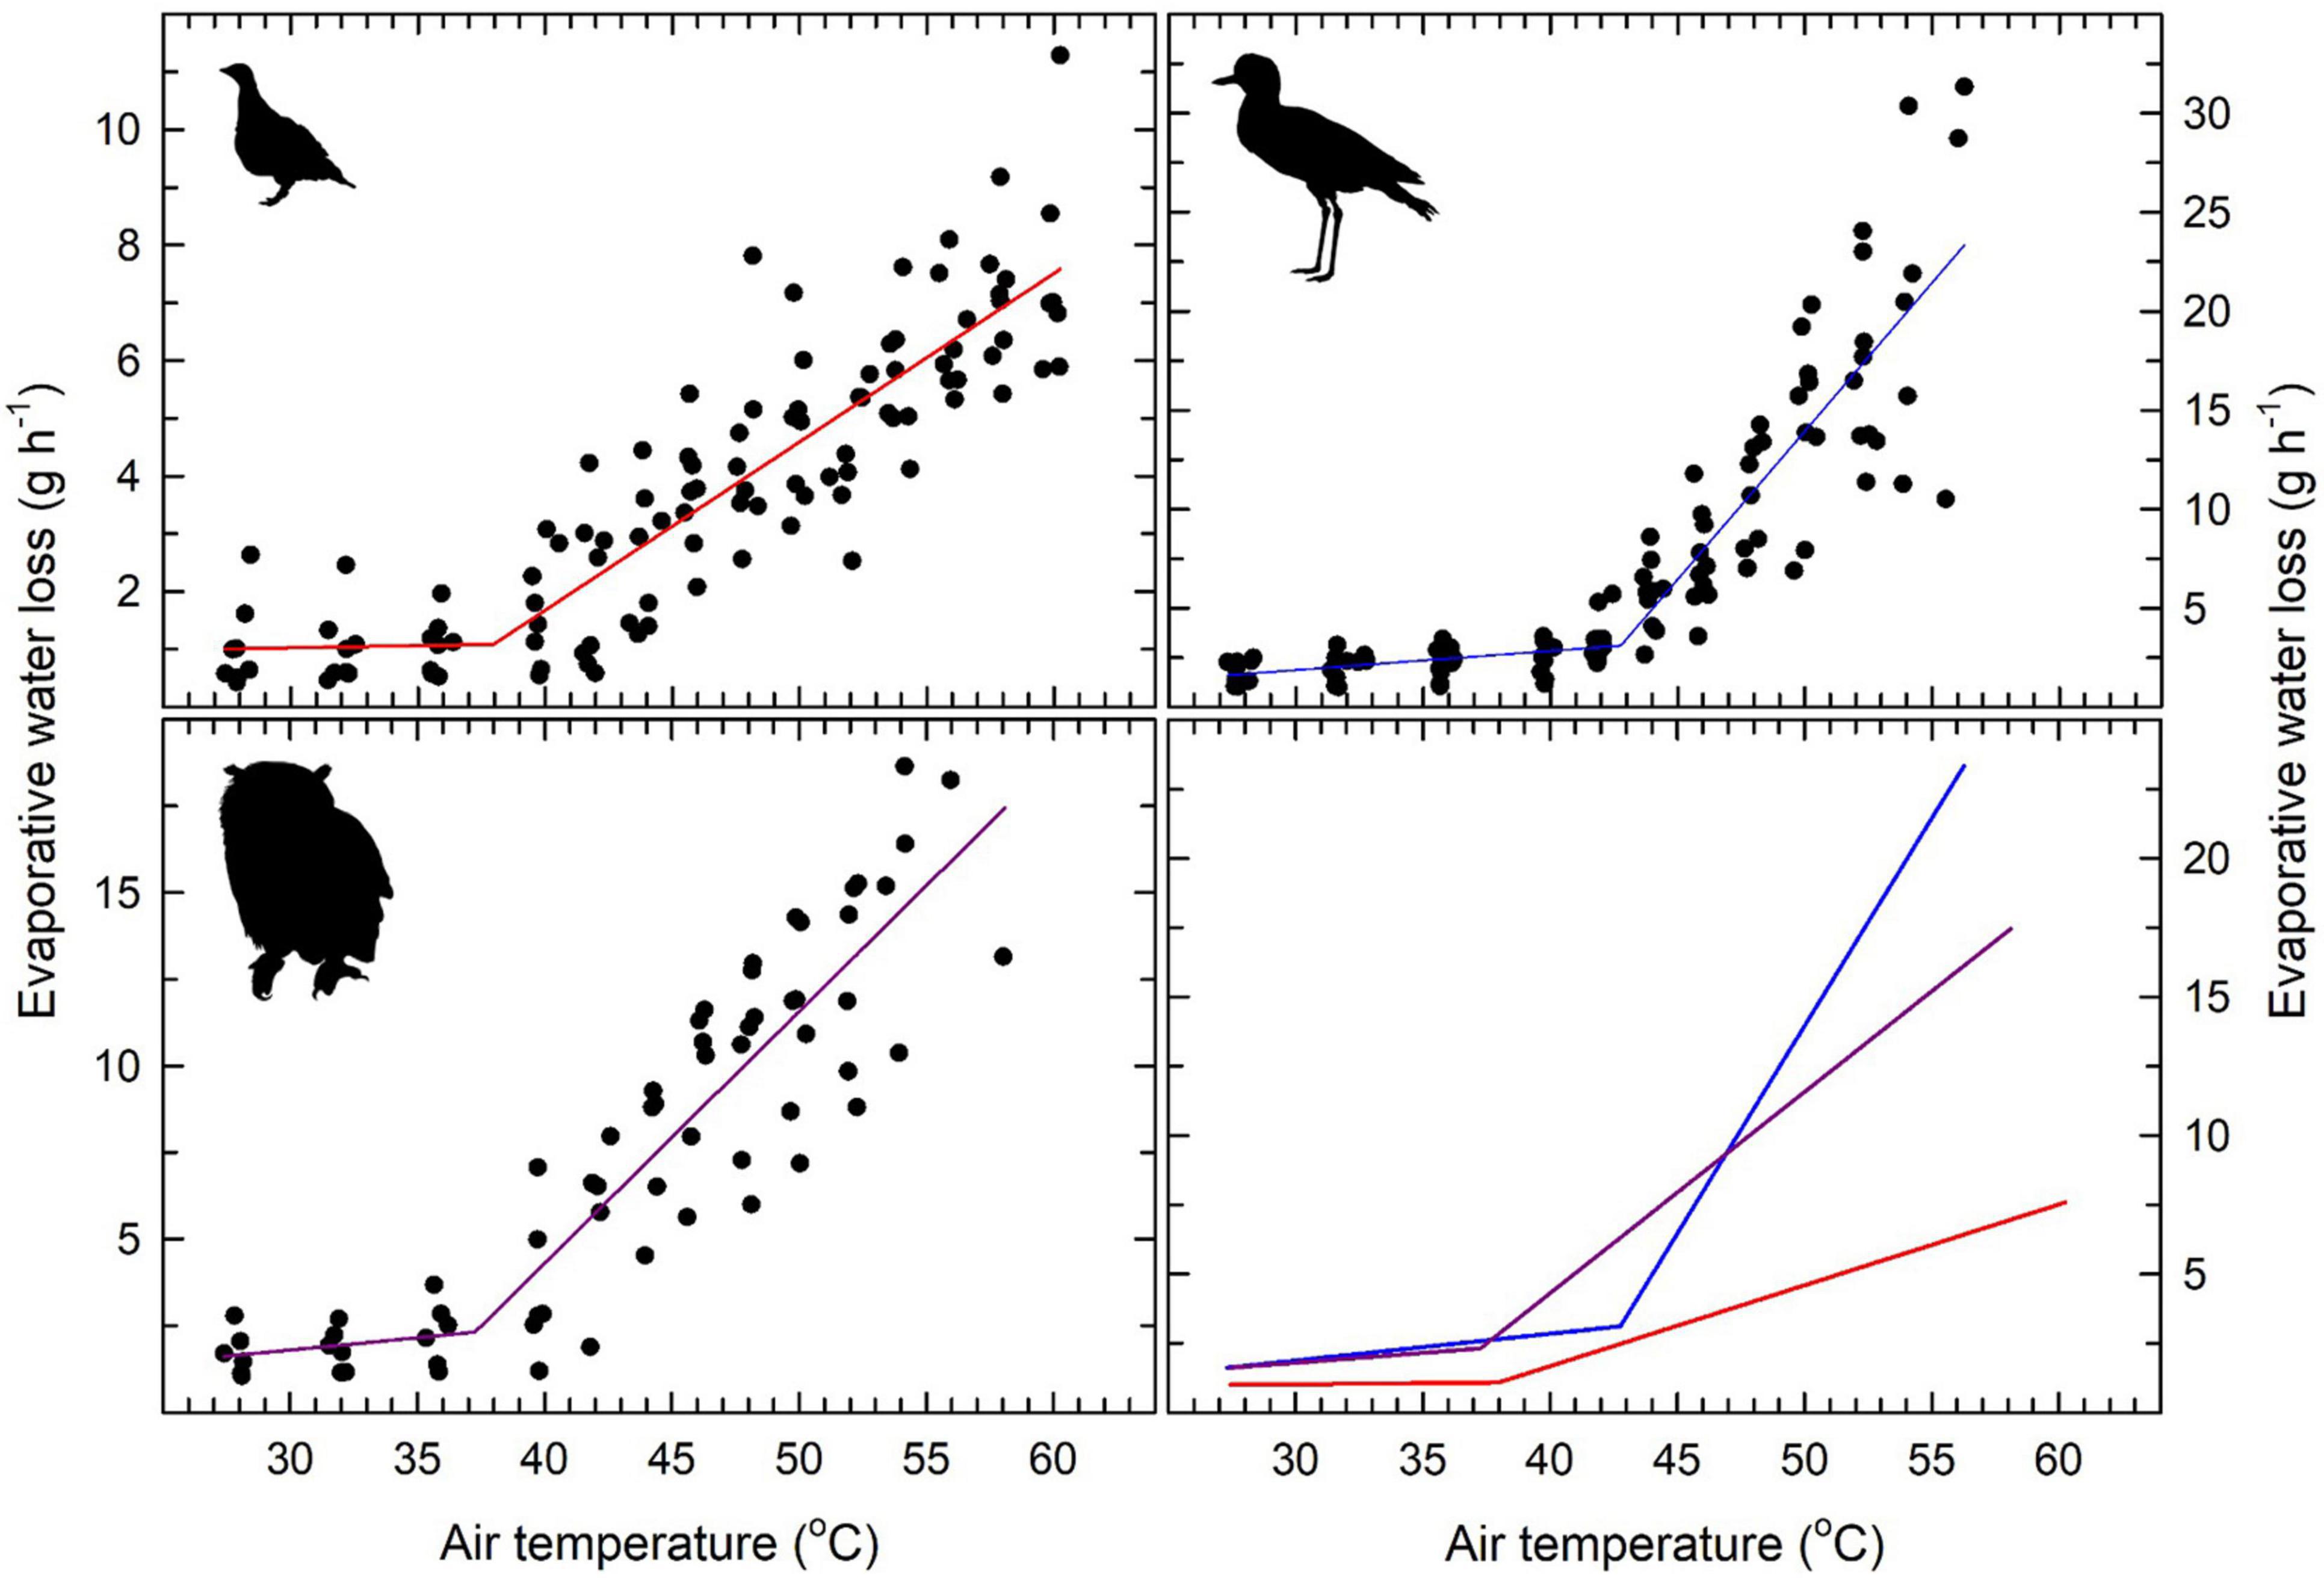
Figure 3. In three medium- to large-sized species from the southern African arid zone, Namaqua sandgrouse (Pterocles namaqua; top left), spotted thick-knees (Burhinus capensis; top right) and spotted eagle-owls (Bubo africanus; lower left), relationships between air temperature (Tair) and evaporative water loss (EWL) were characterised by significant inflections between Tair = 37–43°C. Above these inflections, EWL increased linearly to maximum values equivalent to 7.4, 12.9 and 7.8 X minimum thermoneutral values in Namaqua sandgrouse, thick-knees and eagle-owls, respectively. The solid lines show segmented linear regression models fitted to each data set, with inflection Tair values and slopes for relationships between EWL and Tair provided in Table 2. The lower right panel shows the regression models for all three species plotted on the same axes for comparative purposes. Sources of the bird silhouettes are provided in the Figure 1 legend.
The relationships between evaporative heat loss (EHL)/metabolic heat production (MHP) and Tair–Tb gradients (Figure 4), were characterised by significant inflections for all species (Table 2). Above these inflection points, EHL/MHP increased linearly with increasing Tair–Tb, with relationships significant for sandgrouse (t = 15.63, P < 0.001), thick knees (t = 11.62, P < 0.001) and eagle owls (t = 11.30, P < 0.001). Maximum evaporative cooling efficiency (i.e., maximum EHL/MHP) ranged from 2.75 for eagle-owls to 5.49 in Namaqua sandgrouse (Figure 4). However, these EHL/MHP values were calculated assuming RER = 0.71 (i.e., lipid catabolism), and could be higher if individuals used carbohydrates (i.e., RER = 1.00). In this case, maximum EHL for eagle-owls and Namaqua sandgrouse would shift upward to 3.66 and 7.30, respectively. Visual inspection of the data in Figure 4, however, does not support this possibility. Theoretically, evaporative heat loss and metabolic heat production should be equal (i.e., EHL/MHP = 1.0) when Tair = Tb. Currently EHL/MHP = 1.0 occurs at approximate Tair – Tb values of −1.5, −2.0, and −4.5°C for thick-knees, eagle-owls, and Namaqua sandgrouse, respectively. Recalculating EHL/MHP using RER > 0.71 would shift these values even further below Tair – Tb = 0, suggesting our assumption that RER = 0.71 is likely correct.
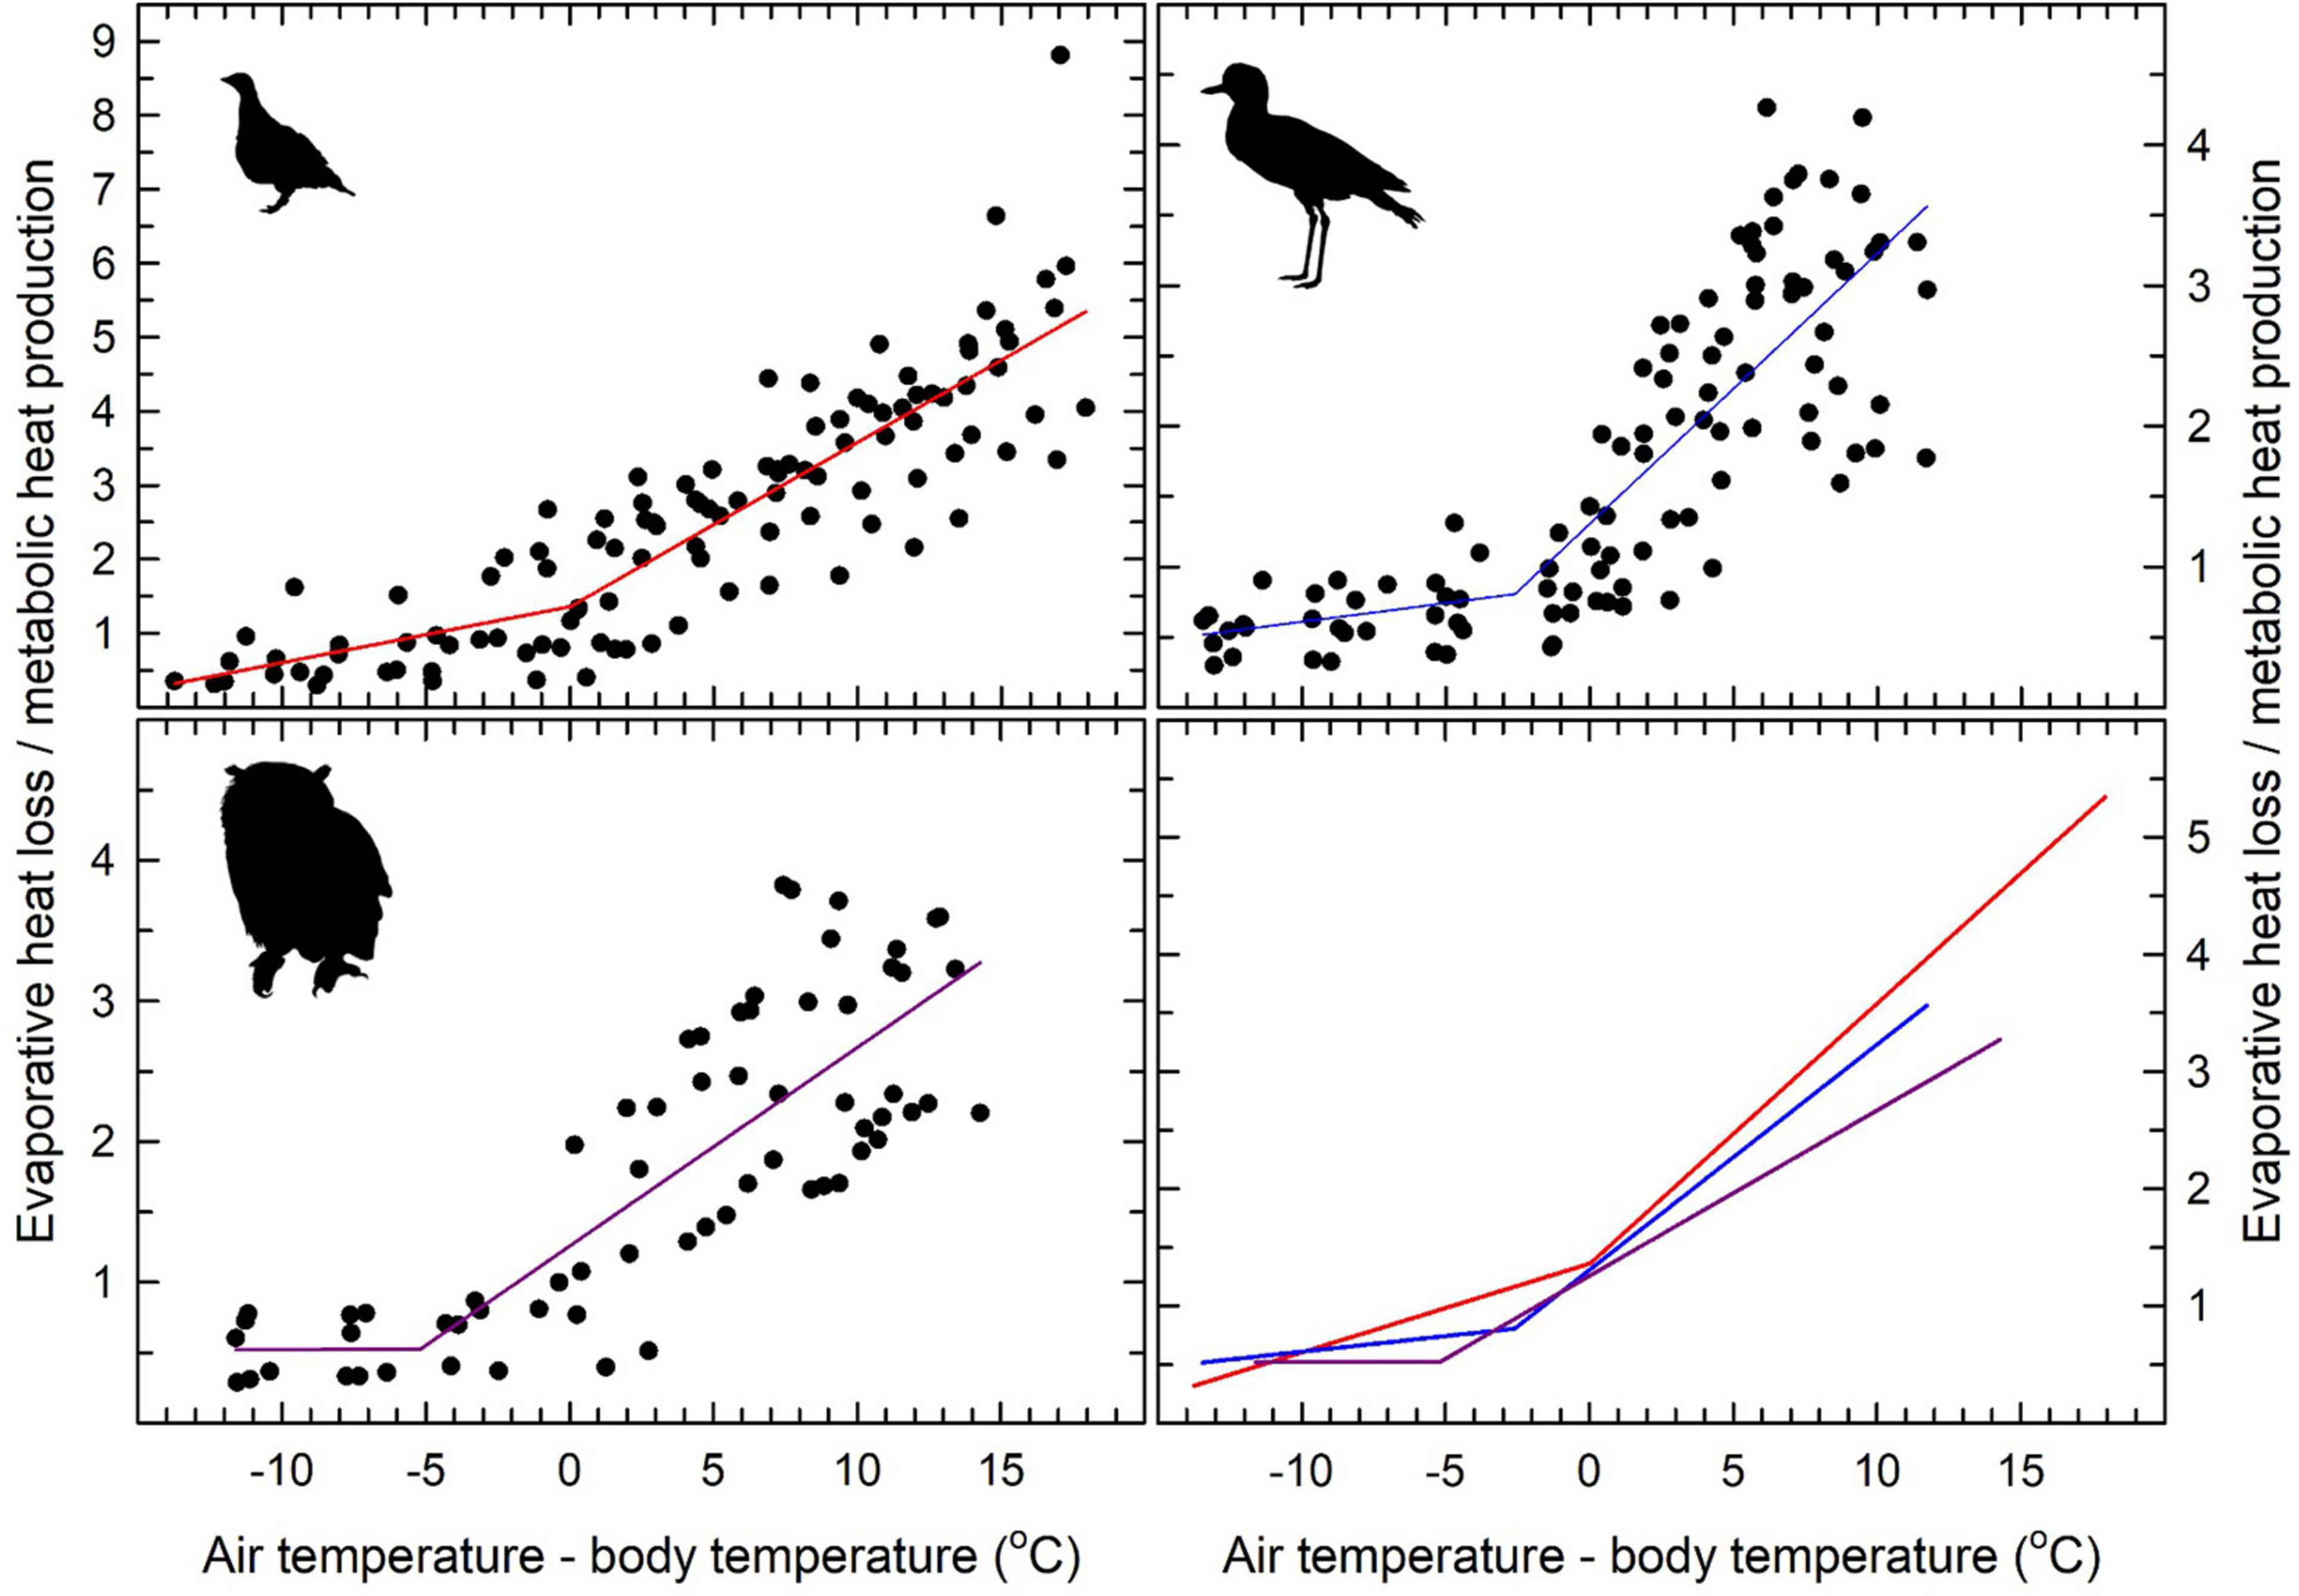
Figure 4. Ratio of evaporative heat loss (EHL) and metabolic heat production (MHP) as a function of the gradient between air temperature (Tair) and body temperature (Tb) in Namaqua sandgrouse (Pterocles namaqua; top left), spotted thick-knees (Burhinus capensis; top right) and spotted eagle-owls (Bubo africanus; lower left). Segmented linear regression models fitted to each data set are shown using solid lines, with inflection Tair values and slopes for relationships between EHL/MHP and Tair – Tb provided in Table 2. The lower right panel shows the regression models for all three species plotted on the same axes for comparative purposes. Sources of the bird silhouettes are provided in the Figure 1 legend.
Discussion
In the three species we examined here, rapid increases in EWL facilitated the defence of Tb below lethal limits even at Tair > 55°C. Although these experimental Tair values are well above the range our study species ever experience naturally, our data provide insights into the avoidance of lethal hyperthermia at midday operative temperatures in unshaded microsites, where intense solar radiation may result in microclimates substantially hotter than Tair alone (Bakken, 1976; Robinson et al., 1976). Together with maximum EHL/MHP values of 2.8–5.5, the high heat tolerance limits of these species support the notion that gular flutter provides the basis for pronounced evaporative cooling and heat tolerance, although quantifying the contribution of gular flutter was precluded here by us not partitioning respiratory and cutaneous EWL. We found less support for the idea that patterns of thermoregulation at high Tair remain similar within genera and families, with patterns of thermoregulation in P. namaqua and B. africanus differing to varying extents from those of previously-studied sandgrouse and owls, respectively. We discuss these differences in more detail below.
Patterns of Thermoregulation
Relationships between Tb and Tair conformed to typical avian patterns in thick-knees and eagle-owls, although the inflection Tair for eagle-owls is well above the range of 30–40°C typical of most species investigated to date (McKechnie et al., 2017; McWhorter et al., 2018; Smit et al., 2018; Czenze et al., 2020). The eagle-owl inflection is also substantially higher than those reported for two smaller owls; Tair = 37.3°C in 101-g western screech-owls (Megascops kennicottii) and Tair < 30°C in 40-g elf owls (Micrathene whitneyi; Talbot et al., 2018). In contrast to the thick-knees and eagle-owls, no significant inflection occurred in the relationship between Tb and Tair in Namaqua sandgrouse, a pattern qualitatively similar to those reported for P. namaqua and double-banded sandgrouse (P. bicinctus) held in outdoor enclosures during summer in the Namib Desert (Thomas and Maclean, 1981), as well as black-bellied sandgrouse (P. orientalis) at Tair between 10 and 45°C (Hinsley et al., 1993).
Maximum Tb at thermal endpoints is within the range documented for non-passerines (McKechnie et al., 2021a), with values >44°C for thick-knees and eagle-owls near the upper end of this range. The heat tolerance limits of all three species are higher than those of most non-passerines and all passerines, with the values of 58°C and 60°C in eagle-owls and Namaqua sandgrouse, respectively, comparable to those of some caprimulgids and columbids, the avian taxa with the highest documented heat tolerances (Marder and Arieli, 1988; O’Connor et al., 2017; Talbot et al., 2017).
The linear increases of EWL with Tair > Tb also followed patterns typical of birds, although evaporative scope (i.e., maximum EWL/minimum EWL) was nearly twice as high in thick-knees (12.9) compared to Namaqua sandgrouse (7.4) or eagle-owls (7.8). Moreover, maximum rates of EWL for thick-knees (23.5 g h–1 at Tair = 56°C) exceed by a substantial margin the highest rates of EWL reported for the much larger (∼3-fold) MacQueen’s bustard (Tieleman et al., 2002). Evaporative water loss rates of thick-knees were equivalent to 5.4% Mb h–1, higher-than-expected fractional values more similar to those typically seen in small passerines (Wolf and Walsberg, 1996; McKechnie et al., 2017; Czenze et al., 2020).
Increases in RMR associated with evaporative heat dissipation at high Tair varied substantially. In Namaqua sandgrouse, maximum RMR at Tair = 60°C was only 37% higher than minimum thermoneutral values, a pattern similar to those observed in some caprimulgids (O’Connor et al., 2017), columbids (McKechnie et al., 2016a,b) and at Tair ≤ 55°C in MacQueen’s bustard (Tieleman et al., 2002). Among other sandgrouse species, no daytime Tuc was evident in P. orientalis nor P. bicinctus at Tair values below ∼43°C (Hinsley, 1992; Hinsley et al., 1993), suggesting measurements may not have reached Tair high enough to elicit a Tuc in either of these species. The very high Tuc of eagle-owls (Tair = 49°C) is similar to the Tuc = 46.4°C reported for western screech owls (Talbot et al., 2018) and other taxa, including lilac-breasted roller (Coracias caudatus: Tuc = 47.5°C; Smit et al., 2018) and several caprimulgids and columbids (Smith et al., 2015; McKechnie et al., 2016a; Talbot et al., 2017).
With the exception of maximum EHL/MHP = 3.4 in lilac-breasted rollers, the values we report here are the highest yet documented among birds other than caprimulgids and columbids (reviewed by McKechnie et al., 2021a). In particular, maximum EHL/MHP = 5.5 in Namaqua sandgrouse is the highest avian value measured to date, exceeding values of 4.7 and 5.2 previously reported for Namaqua doves (Oena capensis; McKechnie et al., 2016a) and Rufous-cheeked nightjars (Caprimulgus rufigena; O’Connor et al., 2017), respectively. We are not aware of published data on maximum EHL/MHP in Charadriiformes, but our value of 3.2 for thick-knees raises the possibility that the capacity for evaporative cooling may also be pronounced in this order (e.g., Grant, 1982).
Interspecific Variation Between Sandgrouse
The data currently available suggest patterns of thermoregulation in the heat are phylogenetically conserved within avian orders. The large differences in patterns of thermoregulation at very high Tair between P. namaqua and the congeneric Burchell’s sandgrouse (P. burchelli, McKechnie et al., 2016b) were, therefore, surprising. Whereas RMR increased sharply to values equivalent to ∼250% of minimum thermoneutral levels in P. burchelli, the RMR of P. namaqua remained within 37% of minimal levels (Figure 5). Consequently, maximum EHL/MHP was substantially higher in P. namaqua (5.5 at Tair = 60°C) compared to P. burchelli (2.0–2.7 at Tair = 56°C). The rapid increases in RMR and modest maximum EHL/MHP of P. burchelli bear a strong resemblance to the pattern typical of passerines, which lack gular flutter or rapid cutaneous water loss and rely on panting for evaporative heat dissipation. In contrast, the corresponding patterns for P. namaqua resemble the extremely efficient cooling characteristic of columbids (Smith et al., 2015; McKechnie et al., 2016a) and caprimulgids (O’Connor et al., 2017; Talbot et al., 2017). The sandgrouse provide the first indication that fundamental differences in evaporative cooling processes can occur within an order, or even a single genus.
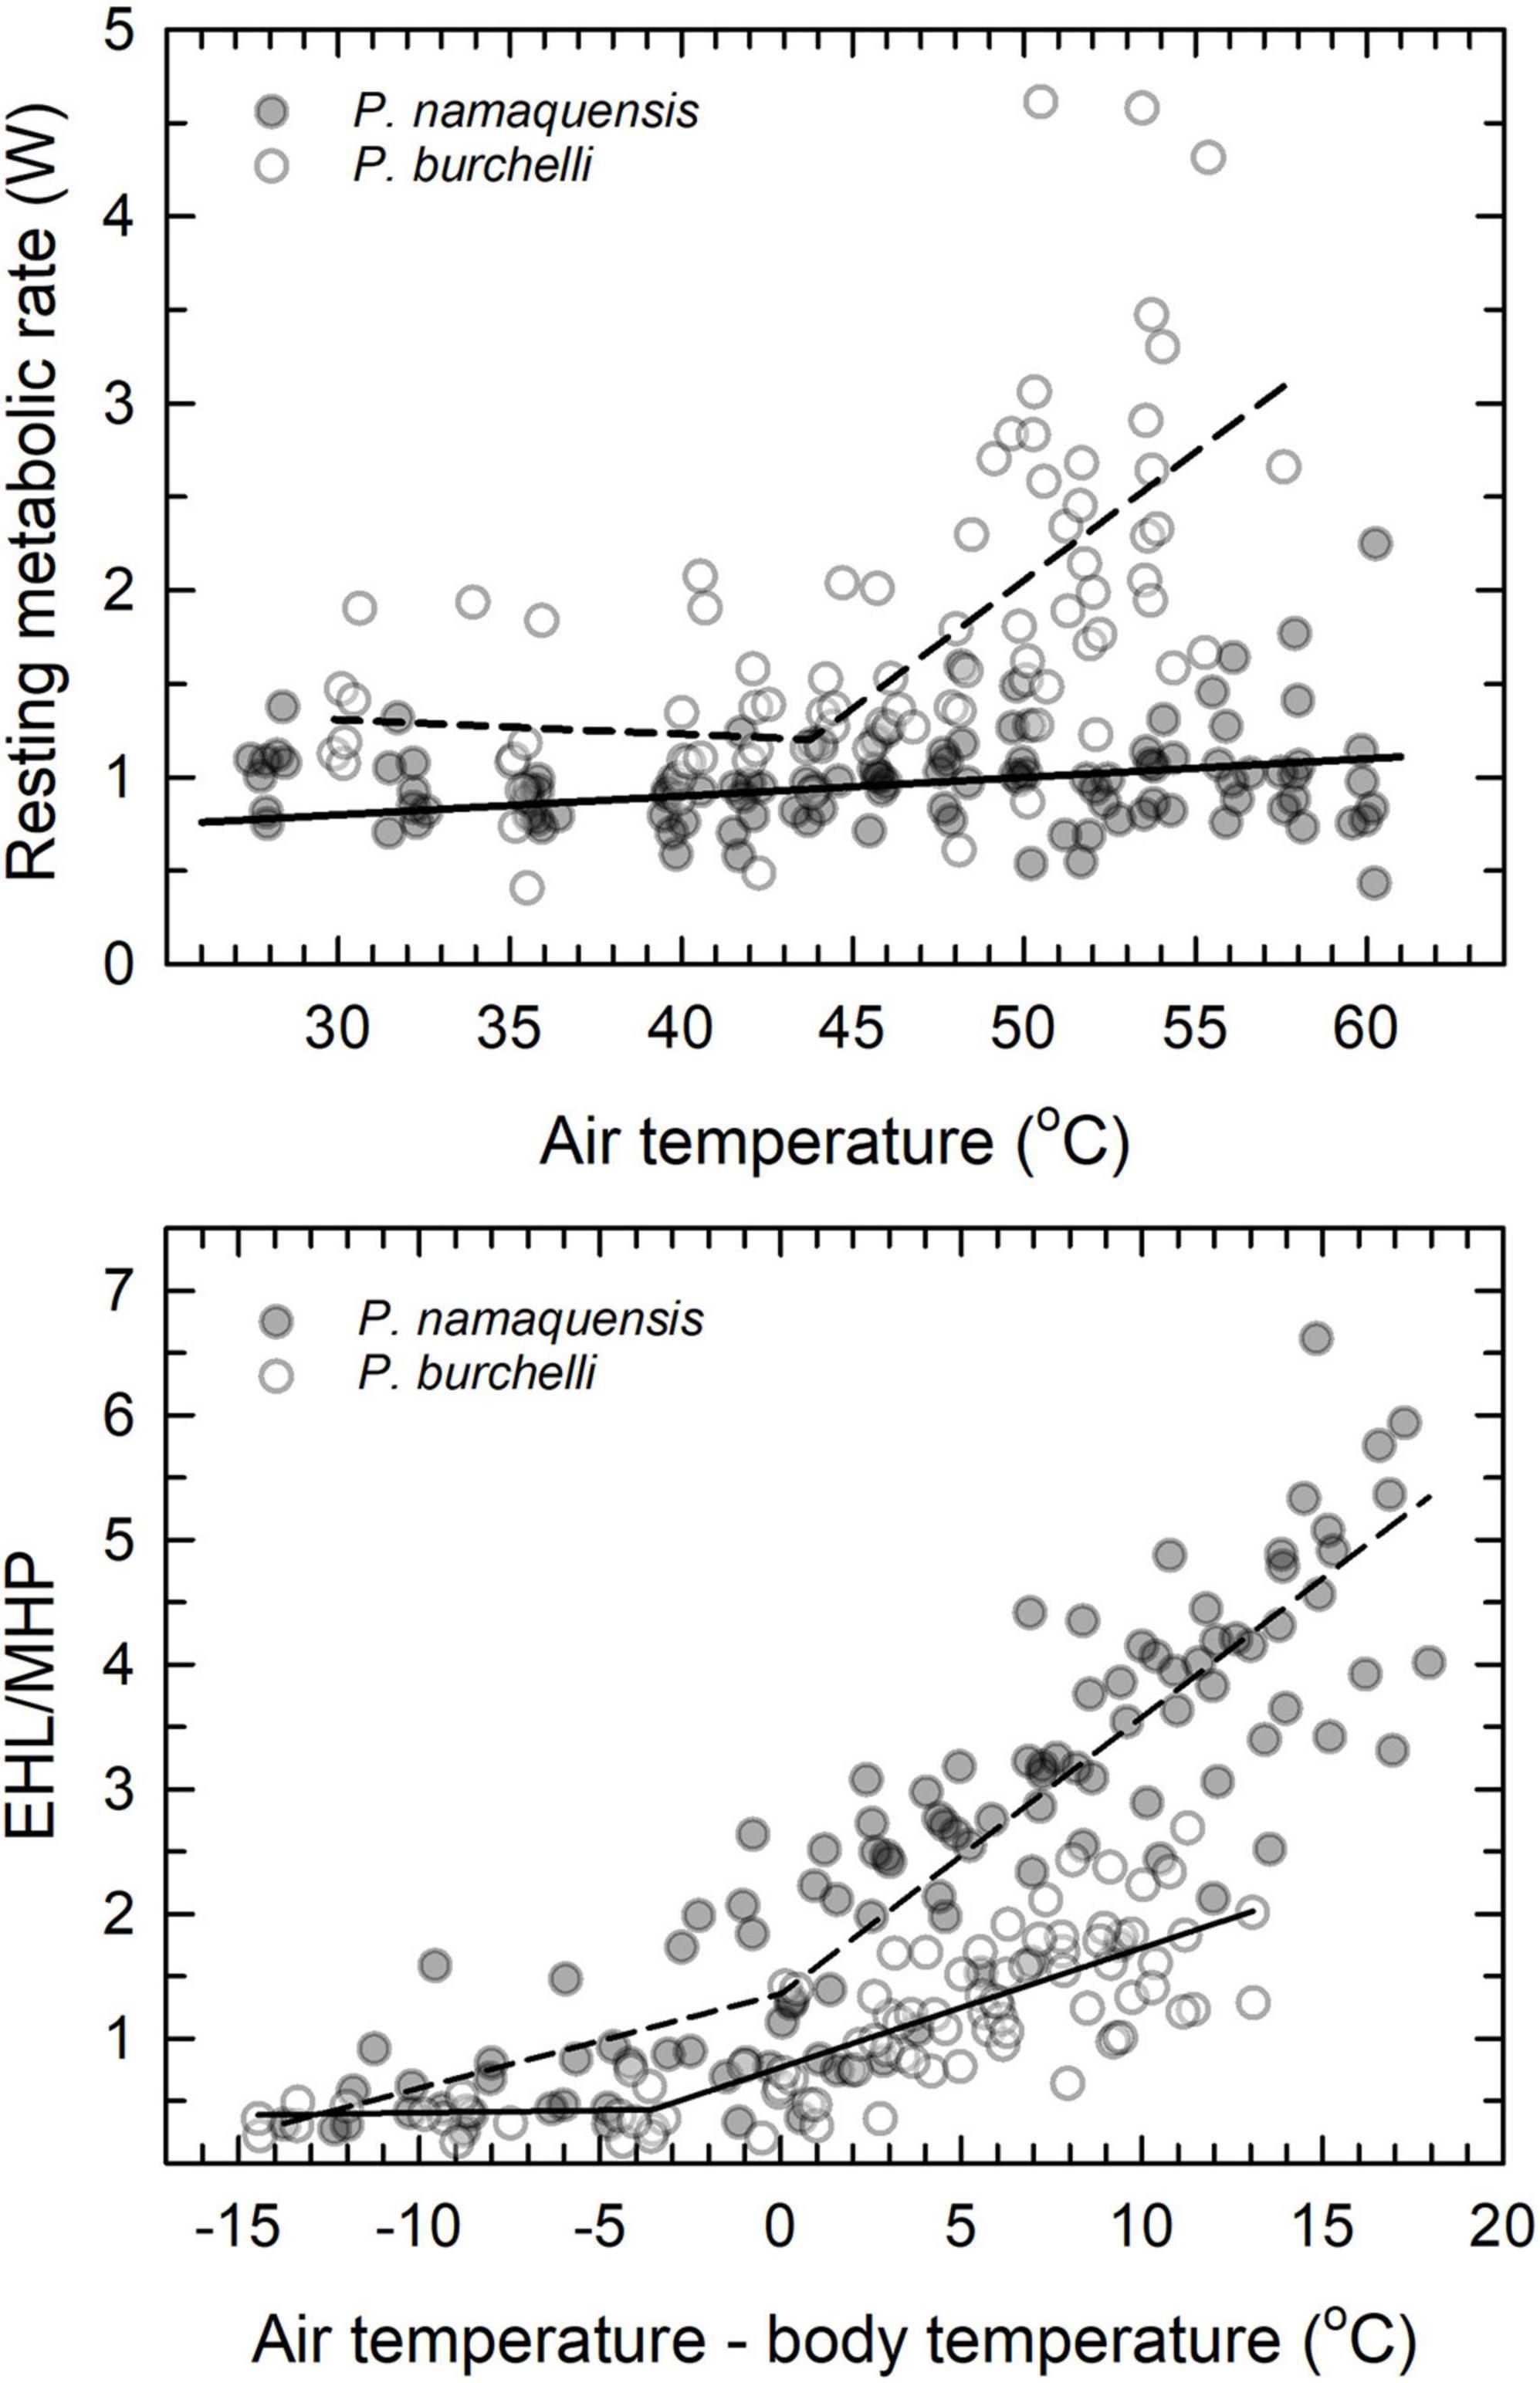
Figure 5. Comparison of relationships between resting metabolic rate (RMR) and air temperature (Tair) (upper panel) and ratio of evaporative heat loss (EHL) to metabolic heat production (MHP) and gradient between air temperature (Tair) and body temperature (Tb) (lower panel) in two congeneric southern African sandgrouse, Namaqua (Pterocles namaqua, this study) and Burchell’s (Pterocles burchelli, McKechnie et al., 2016b). Note the clear upper critical limit thermoneutrality (Tuc) above which RMR increases rapidly in P. burchelli, compared to the lack of a Tuc and RMR that remains within in ∼37% of minimum values in P. namaqua. The relationship between RMR and Tair in P. namaqua was non-significant. Despite the larger evaporative scope (maximum EWL/minimum EWL) of P. burchelli (11.0, McKechnie et al., 2016b) compared to P. namaqua (7.4, this study), the latter species achieves much higher EHL/MHP and tolerates Tair values ∼4°C higher compared with the former (lower panel).
We speculate the differences between these two species reflect the more arid distribution of P. namaqua, which likely experiences stronger selection to minimise energy and water requirements. The distribution of P. burchelli is centred on the Kalahari basin, spanning arid savanna in the south to mopane (Colophospermum mopane) woodlands in the north. Much of the distribution of P. namaqua, on the other hand, is more arid, including the Nama Karoo and hyperarid Namib Desert. With mean annual precipitation of ∼100 mm y–1, our present study site is considerably more arid than any part of the range of P. burchelli (Lloyd, 2005). The methods used to quantify thermoregulatory responses in both species were identical, but we cannot rule out possibilities such as a greater stress response in P. burchelli compared to P. namaqua. However, in this scenario we would expect higher Tb under thermoneutral conditions in P. burchelli on account of stress-induced hyperthermia (Cabanac and Briese, 1992; Cabanac and Aizawa, 2000; Nord and Folkow, 2019). The similarity of both normothermic Tb (P. burchelli: 39.0°C and P. namaqua: 39.4°C) and maximum Tb (P. burchelli: 43.6°C and P. namaqua: 43.2°C) argues against the notion that the divergent responses of these congeners reflect an artefact of stress responses to the experimental conditions.
Functional Links With Nocturnality in Thick-Knees and Owls
The high daytime environmental temperatures nocturnal birds endure in hot habitats, combined with their lack of drinking during the day, led O’Connor et al. (2018) to hypothesise that nocturnal species have evolved more economical evaporative cooling and reduced EWL to minimise dehydration risk during the day. An analysis of data for 32 diurnal and 7 nocturnal species (two owls, four caprimulgids and one owlet-nightjar) provided weak support: slopes of EWL between Tair = 40 and 46°C were significantly lower in nocturnal species, but neither log10 EWL nor EHL/MHP at Tair = 46°C differed significantly with activity period (O’Connor et al., 2018). Our data for thick-knees and eagle-owls generally support O’Connor et al.’s (2018) hypothesised link between nocturnality and more economical evaporative cooling, and specifically the predictions of lower EWL (Figure 6A) and higher EHL/MHP (Figure 6B) in nocturnal species, as well as these authors’ contention that their results reflected a small sample size for nocturnal species.
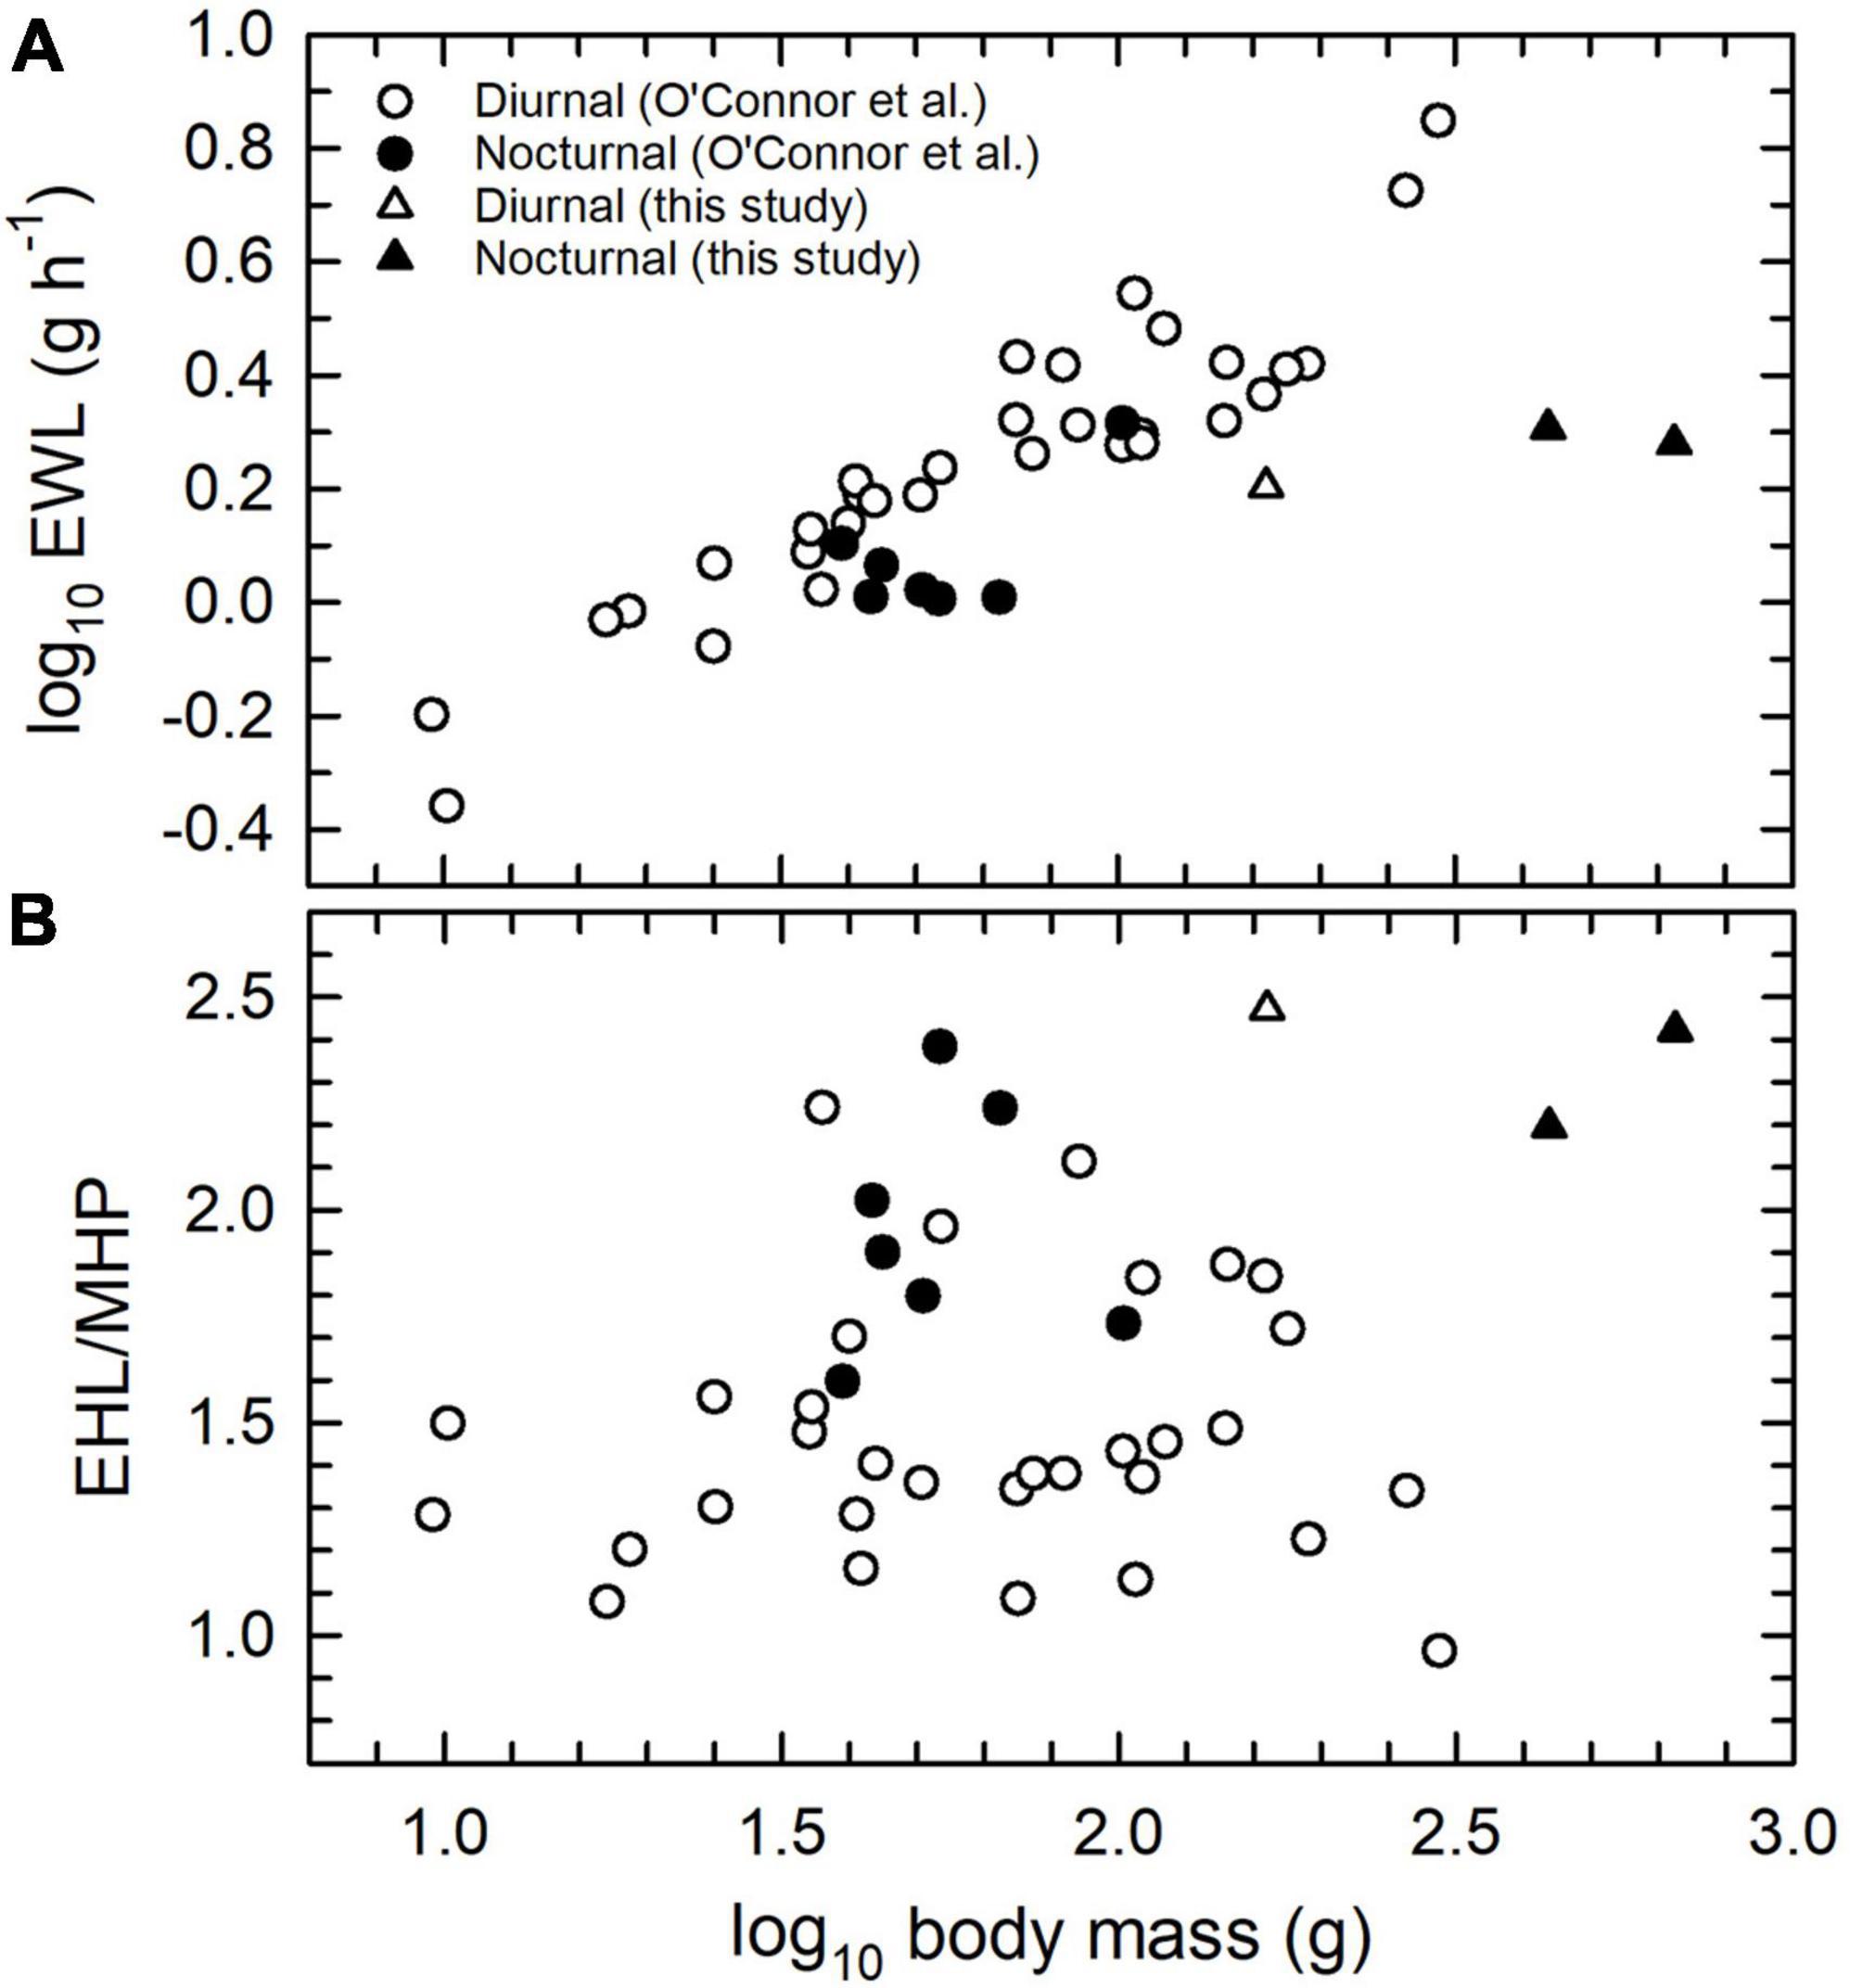
Figure 6. Scaling of log10 evaporative water loss (EWL; A) and the ratio of evaporative heat loss (EHL) to metabolic heat production (MHP; B) at an air temperature (Tair) of 46°C in diurnal and nocturnal birds. Most data are from the sources cited by O’Connor et al. (2018), with additional data from the present study (triangles) for Namaqua sandgrouse (Pterocles Namaqua, diurnal), spotted thick-knee (Burhinus capensis, nocturnal) and spotted eagle-owl (Bubo africanus, nocturnal).
Thermoregulation in the Heat: Interspecific Variation
The data we present here reveal that representatives of three non-passerine orders can achieve rapid evaporative heat dissipation and tolerance of Tair = 55–60°C, similar to the performance of smaller species in highly heat tolerant taxa such as Caprimulgiformes and Columbiformes. Most species in which heat tolerance has been investigated so far are smaller than 100 g, and interspecific variation in interactions between evaporative heat loss and metabolic heat production at Tair > 45°C in larger species has received little attention (Table 4). The contrast between MacQueen’s bustards (Tieleman et al., 2002) and brown-necked ravens (Marder, 1973) is particularly striking (Table 4). Despite being twice as large, bustards’ EWL and RMR were equivalent to <50% of corresponding values in ravens, whereas EHL/MHP was similar and Tb was 3.2°C higher in ravens (Table 4). Although the relative humidity experienced by ravens (<30%, Marder, 1973) may have been higher than for bustards (<22%, Tieleman et al., 2002), we suspect these differences primarily reflect the ravens’ reliance on panting and the constraints imposed by this relatively inefficient avenue of evaporative cooling (McKechnie et al., 2021a). Spotted eagle-owls (present study) maintained the lowest Tb at high Tair of any of the six species, via a combination of intermediate rates of EWL and low RMR (Table 4).
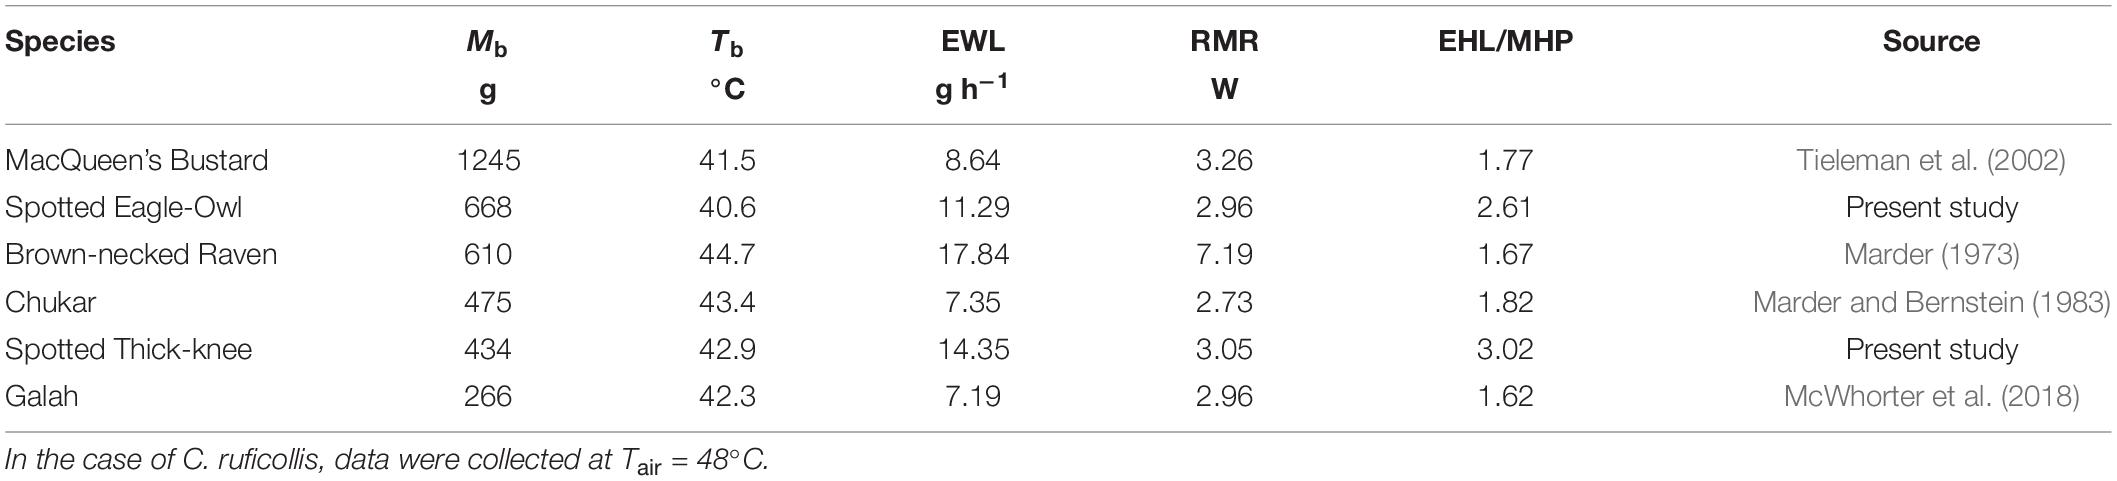
Table 4. Comparison of body temperature (Tb), evaporative water loss (EWL), resting metabolic rate (RMR) and ratio of evaporative heat loss (EHL) to metabolic heat production (MHP) at air temperatures (Tair) of approximately 50°C in six species with body mass (Mb) > 250 g: MacQueen’s bustard (Chlamydotis macqueenii, n = 7), spotted eagle-owl (Bubo africanus), brown-necked raven (Corvus ruficollis, n = 11–16), chukar (Alectoris chukar), spotted thick-knee (Burhinus capensis) and galah (Eolophus roseicapilla, n = 7).
The pronounced interspecific variation in EWL at Tair = 50°C reveals that vulnerability to lethal dehydration during extreme heat events differs considerably among the six species listed in Table 4. Assuming birds can tolerate losing water equivalent to 15% of Mb [following Albright et al. (2017) and others], survival times at Tair = 50°C vary from 4.53 h (spotted thick-knee) and 5.13 h (brown-necked raven) to 8.88 h (spotted eagle-owl) and 21.61 h (MacQueen’s bustard). That estimated survival times for these species are >4 h at this extremely high Tair emphasizes the effect of Mb on the risk of lethal dehydration during extreme heat events; larger birds are at considerably lower risk of mortality via dehydration tolerance limits being exceeded (McKechnie and Wolf, 2010).
Conclusion
Our investigation of heat tolerance in three phylogenetically diverse birds with Mb of 170–680 g reveals pronounced evaporative cooling capacities and tolerance of extremely high Tair during acute heat exposure. These data add to evidence that many non-passerine taxa possess substantially more efficient evaporative cooling and greater heat tolerance compared to passerines (reviewed by McKechnie et al., 2021a). Pronounced heat tolerance in many non-passerines, including the three species in the present study, appears to be functionally linked to the capacity for gular flutter, or in the case of the columbids, rapid cutaneous evaporative cooling. The loss of gular flutter during avian evolution left passerines and several other taxa with much more limited evaporative cooling capacity, which is thought to have contributed to the evolution of passerines’ pronounced use of facultative hyperthermia (Gerson et al., 2019).
Data Availability Statement
The raw data supporting the conclusions of this article will be made available by the authors, without undue reservation.
Ethics Statement
The animal study was reviewed and approved by the Animal Ethics Committee, University of Pretoria (protocol UP: EC057-18) and the Research Ethics and Scientific Committee of the South African National Biodiversity Institute (P18/37).
Author Contributions
RK, ZC, BW, MF, and AM designed the study. ZC, MF, RK, and BvJ collected and analysed the data. ZC, MF, and AM led the writing of the manuscript. All authors contributed to the article and approved the submitted version.
Funding
This work was based on research supported by the National Research Foundation of South Africa (Grant 119754 to AM).
Conflict of Interest
The authors declare that the research was conducted in the absence of any commercial or financial relationships that could be construed as a potential conflict of interest.
Publisher’s Note
All claims expressed in this article are solely those of the authors and do not necessarily represent those of their affiliated organizations, or those of the publisher, the editors and the reviewers. Any product that may be evaluated in this article, or claim that may be made by its manufacturer, is not guaranteed or endorsed by the publisher.
Acknowledgments
We thank Black Mountain Mine for providing access to the conservation area. We are also grateful to A. F. Probert and D. J. Kleynhans for their hard work and dedication in the field and two reviewers for their comments on an earlier version of the manuscript. Any opinions, findings and conclusions, or recommendations expressed in this material are those of the author(s) and do not necessarily reflect the views of the National Research Foundation of South Africa.
References
Albright, T. P., Mutiibwa, D., Gerson, A. R., Smith, E. K., Talbot, W. A., McKechnie, A. E., et al. (2017). Mapping evaporative water loss in desert passerines reveals an expanding threat of lethal dehydration. Proc. Natl. Acad. Sci. U.S.A. 114, 2283–2288. doi: 10.1073/pnas.1613625114
Bakken, G. S. (1976). A heat transfer analysis of animals: unifying concepts and the application of metabolism chamber data to field ecology. J. Theor. Biol. 60, 337–384. doi: 10.1016/0022-5193(76)90063-1
Bartholomew, G. A., Lasiewski, R. C., and Crawford, E. C. (1968). Patterns of panting and gular flutter in cormorants, pelicans, owls, and doves. Condor 70, 31–34.
Burnham, K. P., and Anderson, D. R. (2002). Model Selection and Multimodel Inference. A Practical Information-Theoretic Approach, 2nd Edn. New York, NY: Springer.
Cabanac, A., and Briese, E. (1992). Handling elevates the colonic temperature of mice. Physiol. Behav. 51, 95–98. doi: 10.1016/0031-9384(92)90208-j
Cabanac, M., and Aizawa, S. (2000). Fever and tachycardia in a bird (Gallus domesticus) after simple handling. Physiol. Behav. 69, 541–545. doi: 10.1016/s0031-9384(00)00227-4
Calder, W. A., and Schmidt-Nielsen, K. (1967). Temperature regulation and evaporation in the pigeon and the roadrunner. Am. J. Physiol. 213, 883–889. doi: 10.1152/ajplegacy.1967.213.4.883
Conradie, S. R., Woodborne, S., Wolf, B. O., Pessato, A., Mariette, M. M., and McKechnie, A. E. (2020). Avian mortality risk during heat waves will increase greatly in arid Australia during the 21st Century. Conserv. Physiol. 8:coaa048. doi: 10.1093/conphys/coaa048
Cory Toussaint, D., and McKechnie, A. E. (2012). Interspecific variation in thermoregulation among three sympatric bats inhabiting a hot, semi-arid environment. J. Comp. Physiol. B 182, 1129–1140. doi: 10.1007/s00360-012-0683-6
Czenze, Z. J., Kemp, R., Van Jaarsveld, B., Freeman, M. T., Smit, B., Wolf, B. O., et al. (2020). Regularly drinking desert birds have greater evaporative cooling capacity and higher heat tolerance limits than non-drinking species. Funct. Ecol. 34, 1589–1600.
Czenze, Z. J., Smit, B., van Jaarsveld, B., Freeman, M. T., and McKechnie, A. E. (in press). Caves, crevices, and cooling capacity: roost microclimate predicts heat tolerance in bats. Funct. Ecol.
Dawson, W. R. (1954). “Temperature regulation and water requirements of the brown and Abert towhees, Pipilo fuscus and Pipilo aberti,” in University of California Publications in Zoology, eds G. A. Bartholomew, F. Crescitelli, T. H. Bullock, W. H. Furgason, and A. M. Schechtman (Berkeley, CA: University of California Press).
Dawson, W. R., and Fisher, C. D. (1969). Responses to temperature by the spotted nightjar (Eurostopodus guttatus). Condor 71, 49–53.
Freeman, M. T., Czenze, Z. J., Schoeman, K., and McKechnie, A. E. (2020). Extreme hyperthermia tolerance in the world’s most abundant wild bird. Sci. Rep. 10:13098. doi: 10.1038/s41598-020-69997-7
Gerson, A. R., McKechnie, A. E., Smit, B., Whitfield, M. C., Smith, E. K., Talbot, W. A., et al. (2019). The functional significance of facultative hyperthermia varies with body size and phylogeny in birds. Funct. Ecol. 33, 597–607.
Grant, G. S. (1982). Avian incubation: egg temperature, nest humidity, and behavioral thermoregulation in a hot environment. Ornithol. Monogr. 30, 1–100.
Hinsley, S. A. (1992). Bioenergetics of a desert specialist, the double-banded sandgrouse, and the problems of stress induced by experimental conditions. Comp. Biochem. Physiol. 102A, 433–439.
Hinsley, S. A., Ferns, P. N., Thomas, D. H., and Pinshow, B. (1993). Black-bellied sandgrouse (Pterocles orientalis) and pin-tailed sandgrouse (Pterocles alchata): closely related species with differing bioenergetic adaptations to arid zones. Physiol. Zool. 66, 20–42.
Hockey, P. A. R., Dean, W. R. J., and Ryan, P. G. (2005). Roberts Birds of Southern Africa. Cape Town: John Voelcker Bird Book Fund.
IPCC (2021). Climate Change 2021: The Physical Science Basis. Contribution of Working Group I to the Sixth Assessment Report of the Intergovernmental Panel on Climate Change. Geneva: IPCC.
Karasov, W. H. (1990). “Digestion in birds: chemical and physiological determinants and implications,” in Studies in Avian Biology No. 13, eds M. L. Morrison, C. J. Ralph, J. Verner, and J. R. Jehl (Los Angeles, CA: Cooper Ornithological Society).
Kemp, R., Freeman, M. T., van Jaarsveld, B., Czenze, Z. J., Conradie, S. R., and McKechnie, A. E. (2020). Sublethal fitness costs of chronic exposure to hot weather vary between sexes in a threatened desert lark. Emu 120, 216–229.
Kemp, R., and McKechnie, A. E. (2019). Thermal physiology of a range-restricted desert lark. J. Comp. Physiol. B 189, 131–141. doi: 10.1007/s00360-018-1190-1
Lasiewski, R. C., and Seymour, R. S. (1972). Thermoregulatory responses to heat stress in four species of birds weighing approximately 40 grams. Physiol. Zool. 45, 106–118.
Lloyd, P. (2005). “Burchell’s Sandgrouse,” in Roberts Birds of Southern Africa, eds P. A. R. Hockey, W. R. J. Dean, and P. G. Ryan (Cape Town: John Voelcker Bird Book Fund).
Maloney, S. K., Bronner, G. N., and Buffenstein, R. (1999). Thermoregulation in the Angolan free-tailed bat Mops condylurus: a small mammal that uses hot roosts. Physiol. Biochem. Zool. 72, 385–396. doi: 10.1086/316677
Marder, J. (1973). Body temperature regulation in the brown-necked raven (Corvus corax ruficollis)—I. Metabolic rate, evaporative water loss and body temperature of the raven exposed to heat stress. Comp. Biochem. Physiol. A 45, 421–430. doi: 10.1016/0300-9629(73)90449-0
Marder, J., and Arieli, U. (1988). Heat balance of acclimated pigeons Columba livia exposed to temperatures of up to 60°C Ta. Comp. Biochem. Physiol. 91A, 165–170.
Marder, J., and Bernstein, R. (1983). Heat balance of the partridge Alectoris chukar exposed to moderate, high and extreme thermal stress. Comp. Biochem. Physiol. 74A, 149–154. doi: 10.1016/0300-9629(83)90726-0
McKechnie, A. E., Gerson, A. R., McWhorter, T. J., Smith, E. K., Talbot, W. A., and Wolf, B. O. (2017). Avian thermoregulation in the heat: evaporative cooling in five Australian passerines reveals within-order biogeographic variation in heat tolerance. J. Exp. Biol. 220, 2436–2444. doi: 10.1242/jeb.155507
McKechnie, A. E., Rushworth, I. A., Myburgh, F., and Cunningham, S. J. (2021b). Mortality among birds and bats during an extreme heat event in eastern South Africa. Austr. Ecol. 46, 687–691.
McKechnie, A. E., Gerson, A. R., and Wolf, B. O. (2021a). Thermoregulation in desert birds: scaling and phylogenetic variation in heat tolerance and evaporative cooling. J. Exp. Biol. 224:jeb229211. doi: 10.1242/jeb.229211
McKechnie, A. E., Whitfield, M. C., Smit, B., Gerson, A. R., Smith, E. K., Talbot, W. A., et al. (2016a). Avian thermoregulation in the heat: efficient evaporative cooling allows for extreme heat tolerance in four southern Hemisphere columbids. J. Exp. Biol. 219, 2145–2155. doi: 10.1242/jeb.138776
McKechnie, A. E., Smit, B., Whitfield, M. C., Noakes, M. J., Talbot, W. A., Garcia, M., et al. (2016b). Avian thermoregulation in the heat: evaporative cooling capacity in an archetypal desert specialist, Burchell’s sandgrouse (Pterocles burchelli). J. Exp. Biol. 219, 2137–2144. doi: 10.1242/jeb.146563
McKechnie, A. E., and Wolf, B. O. (2010). Climate change increases the likelihood of catastrophic avian mortality events during extreme heat waves. Biol. Lett. 6, 253–256. doi: 10.1098/rsbl.2009.0702
McWhorter, T. J., Gerson, A. R., Talbot, W. A., Smith, E. K., McKechnie, A. E., and Wolf, B. O. (2018). Avian thermoregulation in the heat: evaporative cooling capacity and thermal tolerance in two Australian parrots. J. Exp. Biol. 221:jeb168930. doi: 10.1242/jeb.168930
Muggeo, V. M. R. (2008). Segmented: an R package to fit regression models with broken-line relationships. R News 8, 20–25.
Nilsson, J. -Å, and Nord, A. (2018). Testing the heat dissipation limit theory in a breeding passerine. Proc. R. Soc. B 285:20180652. doi: 10.1098/rspb.2018.0652
Nord, A., and Folkow, L. P. (2019). Ambient temperature effects on stress-induced hyperthermia in Svalbard ptarmigan. Biol. Open 8:bio043497. doi: 10.1242/bio.043497
O’Connor, R. S., Smit, B., Talbot, W. A., Gerson, A. R., Brigham, R. M., Wolf, B. O., et al. (2018). Avian thermoregulation in the heat: is evaporative cooling more economical in nocturnal birds? J. Exp. Biol. 221:jeb181420. doi: 10.1242/jeb.181420
O’Connor, R. S., Wolf, B. O., Brigham, R. M., and McKechnie, A. E. (2017). Avian thermoregulation in the heat: efficient evaporative cooling in two southern African nightjars. J. Comp. Physiol. B 187, 477–491. doi: 10.1007/s00360-016-1047-4
Pinheiro, J., Bates, D., DebRoy, S., Sarkar, D., and R Development Core Team. (2009). nlme: Linear and Nonlinear Mixed Effects Models. R Package Version 3.57.
Ratnayake, H., Kearney, M. R., Govekar, P., Karoly, D., and Welbergen, J. A. (2019). Forecasting wildlife die-offs from extreme heat events. Anim. Conserv. 22, 386–395.
R Core Team (2018). R: A Language and Environment for Statistical Computing. Vienna: R Foundation for Statistical Computing.
Robinson, D. E., Campbell, G. S., and King, J. R. (1976). An evaluation of heat exchange in small birds. J. Comp. Physiol. B 105, 153–166.
Smit, B., Whitfield, M. C., Talbot, W. A., Gerson, A. R., McKechnie, A. E., and Wolf, B. O. (2018). Avian thermoregulation in the heat: phylogenetic variation among avian orders in evaporative cooling capacity and heat tolerance. J. Exp. Biol. 221:jeb174870. doi: 10.1242/jeb.174870
Smith, E. K., O’Neill, J., Gerson, A. R., and Wolf, B. O. (2015). Avian thermoregulation in the heat: resting metabolism, evaporative cooling and heat tolerance in Sonoran Desert doves and quail. J. Exp. Biol. 218, 3636–3646. doi: 10.1242/jeb.128645
Smith, E. K., O’Neill, J. J., Gerson, A. R., McKechnie, A. E., and Wolf, B. O. (2017). Avian thermoregulation in the heat: resting metabolism, evaporative cooling and heat tolerance in Sonoran Desert songbirds. J. Exp. Biol. 220, 3290–3300. doi: 10.1242/jeb.161141
Talbot, W. A., Gerson, A. R., Smith, E. K., McKechnie, A. E., and Wolf, B. O. (2018). Avian thermoregulation in the heat: metabolism, evaporative cooling and gular flutter in two small owls. J. Exp. Biol. 221:jeb171108. doi: 10.1242/jeb.171108
Talbot, W. A., McWhorter, T. J., Gerson, A. R., McKechnie, A. E., and Wolf, B. O. (2017). Avian thermoregulation in the heat: evaporative cooling capacity of arid-zone Caprimulgiformes from two continents. J. Exp. Biol. 220, 3488–3498. doi: 10.1242/jeb.161653
Thomas, D., and Maclean, G. (1981). Comparison of physiological and behavioral thermoregulation and osmoregulation in two sympatric sandgrouse species (Aves, Pteroclididae). J. Arid Environ. 4, 335–358.
Thomas, D. H., and Robin, A. P. (1977). Comparative studies of thermoregulatory and osmoregulatory behaviour and physiology of five species of sandgrouse (Aves: Pterocliidae) in Morocco. J. Zool. 183, 229–249.
Thompson, M. L., Cunningham, S. J., and McKechnie, A. E. (2018). Interspecific variation in avian thermoregulatory patterns and heat dissipation behaviours in a subtropical desert. Physiol. Behav. 188, 311–323. doi: 10.1016/j.physbeh.2018.02.029
Tieleman, B. I., Williams, J. B., LaCroix, F., and Paillat, P. (2002). Physiological responses of Houbara bustards to high ambient temperatures. J. Exp. Biol. 205, 503–511.
Ward, D. (1990). Incubation temperatures and behavior of crowned, black-winged, and lesser black-winged plovers. Auk 107, 10–17.
Weathers, W. W. (1981). Physiological thermoregulation in heat-stressed birds: consequences of body size. Physiol. Zool. 54, 345–361.
Welbergen, J. A., Klose, S. M., Markus, N., and Eby, P. (2008). Climate change and the effects of temperature extremes on Australian flying-foxes. Proc. R. Soc. B 275, 419–425. doi: 10.1098/rspb.2007.1385
Whitfield, M. C., Smit, B., McKechnie, A. E., and Wolf, B. O. (2015). Avian thermoregulation in the heat: scaling of heat tolerance and evaporative cooling capacity in three southern African arid-zone passerines. J. Exp. Biol. 218, 1705–1714. doi: 10.1242/jeb.121749
Keywords: Charadriiformes, heat tolerance, hyperthermia, Pterocliformes, Strigiformes, thermoregulation
Citation: Czenze ZJ, Freeman MT, Kemp R, van Jaarsveld B, Wolf BO and McKechnie AE (2021) Efficient Evaporative Cooling and Pronounced Heat Tolerance in an Eagle-Owl, a Thick-Knee and a Sandgrouse. Front. Ecol. Evol. 9:799302. doi: 10.3389/fevo.2021.799302
Received: 21 October 2021; Accepted: 22 November 2021;
Published: 24 December 2021.
Edited by:
Todd Jason McWhorter, University of Adelaide, AustraliaReviewed by:
Claus Bech, Norwegian University of Science and Technology, NorwayRaymond Danner, University of North Carolina Wilmington, United States
Copyright © 2021 Czenze, Freeman, Kemp, van Jaarsveld, Wolf and McKechnie. This is an open-access article distributed under the terms of the Creative Commons Attribution License (CC BY). The use, distribution or reproduction in other forums is permitted, provided the original author(s) and the copyright owner(s) are credited and that the original publication in this journal is cited, in accordance with accepted academic practice. No use, distribution or reproduction is permitted which does not comply with these terms.
*Correspondence: Andrew E. McKechnie, YW5kcmV3Lm1ja2VjaG5pZUB1cC5hYy56YQ==
†These authors have contributed equally to this work and share first authorship
‡Present address: Zenon J. Czenze, Centre for Behavioural and Physiological Ecology, University of New England, Armidale, NSW, Australia