 Jiao Fang
 Yangliang Chen1,2
 Guoxiang Liu
 Heroen Verbruggen
 Huan Zhu
- 1Key Laboratory of Algal Biology, Institute of Hydrobiology, Chinese Academy of Sciences, Wuhan, China
- 2University of Chinese Academy of Sciences, Beijing, China
- 3School of BioSciences, University of Melbourne, Melbourne, VIC, Australia
- 4State Key Laboratory of Freshwater Ecology and Biotechnology, Institute of Hydrobiology, Chinese Academy of Sciences, Wuhan, China
A positive relationship between cell size and chloroplast genome size within chloroplast-bearing protists has been hypothesized in the past and shown in some case studies, but other factors influencing chloroplast genome size during the evolution of chlorophyte algae have been less studied. We study chloroplast genome size and GC content as a function of habitats and cell size of chlorophyte algae. The chloroplast genome size of green algae in freshwater, marine and terrestrial habitats was differed significantly, with terrestrial algae having larger chloroplast genome sizes in general. The most important contributor to these enlarged genomes in terrestrial species was the length of intergenic regions. There was no clear difference in the GC content of chloroplast genomes from the three habitats categories. Functional morphological categories also showed differences in chloroplast genome size, with filamentous algae having substantially larger genomes than other forms of algae, and foliose algae had lower GC content than other groups. Chloroplast genome size showed no significant differences among the classes Ulvophyceae, Trebouxiophyceae, and Chlorophyceae, but the GC content of Chlorophyceae chloroplast genomes was significantly lower than that of Ulvophyceae and Trebouxiophyceae. There was a certain positive relationship between chloroplast genome size and cell size for the Chlorophyta as a whole and within each of three major classes. Our data also confirmed previous reports that ancestral quadripartite architecture had been lost many times independently in Chlorophyta. Finally, the comparison of the phenotype of chlorophytes algae harboring plastids uncovered that most of the investigated Chlorophyta algae housed a single plastid per cell.
Introduction
Viridiplantae split into the chlorophytes and streptophyta about a billion years ago (Zimmer et al., 2007; Morris et al., 2018). The streptophyta are comprised of land plants (embryophytes) and streptophyte algae (Fürst-Jansen et al., 2020). The streptophyte algae, one of two great lineages of green algae, was closely related to land plants (Cheng et al., 2019; Jiao et al., 2020). The other lineage of green algae, Chlorophyta, is a species-rich group exhibiting high morphological diversity, including unicellular, colonial, filamentous, foliose and siphonous forms, occurring in freshwater, marine and terrestrial habitats, with several independent transitions between those habitats (Leliaert et al., 2012; Del Cortona et al., 2020). A large number of chloroplast genomes have been sequenced in the past few years. Species of Chlorophyta vary greatly in chloroplast genome size, from 64 to 521 kb (Brouard et al., 2010; Lemieux et al., 2014b). Many green algal chloroplast genomes feature a quadripartite architecture consisting of two inverted repeats and two single copies regions (Turmel et al., 1999, 2009; Lemieux et al., 2000). This structure is particularly common in land plants (Luo et al., 2021) and has been shown in many species of the Chlorophyta as well. However, several Chlorophyta have been shown to have non-canonical chloroplast genome architectures. Some extreme examples are the chloroplast genome of Koshicola, composed of three mini-circles (Watanabe et al., 2016), and that of Cladophorales, comprised of dozens of small hairpin chromosomes (Del Cortona et al., 2017). Quite a few green algae have a more traditional, larger and circular-mapping genome but lacking inverted repeat regions (de Cambiaire et al., 2007; Leliaert and Lopez-Bautista, 2015; Melton et al., 2015; Turmel et al., 2015, 2017; Cremen et al., 2018).
A few studies have shown a positive correlation between organismal size and nuclear genome size in particular groups of eukaryotes (Lemieux et al., 2014a; Smith, 2017), including prasinophytes and Trebouxiophyceae, where pico- and nanoplanktonic taxa tend to have smaller chloroplast genomes (Lemieux et al., 2014b; Turmel et al., 2015). Chloroplast genome size variations within major lineages of Chlorophyta can be attributed to a range of factors (Marcelino et al., 2016; Turmel and Lemieux, 2018). Large numbers of chloroplast genomes have been accumulating in recent years (Sun et al., 2016; Li et al., 2021) from taxa living in all sorts of habitats (e.g., freshwater, marine and terrestrial) and featuring a broad range of functional morphological diversity (unicellular, colonial, filamentous, siphonous, foliose).
The aim of this study is to take advantage of the large number of chloroplast genomes now available to investigate associations between species traits (habitat, functional morphology, taxonomic groupings) and chloroplast genome traits (size, GC content) across Chlorophyta, and to interpret these associations in terms of ecology and evolutionary contexts. Our approach consists of a range of data visualizations and statistical analyses for Chlorophyta as a whole and within each of its major classes Ulvophyceae, Trebouxiophyceae and Chlorophyceae separately.
Materials and Methods
Data Collection and Analysis
To study the relationship between chloroplast genome size and GC content with cell size, forms and diverse habitats of Chlorophyta, a database was compiled. Genome length and GC content were derived from the downloaded genomes. The methods to determine whether an algae strain was from freshwater, marine, or terrestrial habitat was as follows: Firstly, when cpDNA sequences were downloaded from NCBI,1 some algal strains were labeled specimen numbers on the title of sequences, such as SAG 42.85 and UTEX 393. Then, Official websites of algae culture collection where the detail of these algae strains were recorded were found according to the specimen numbers. For example, the detailed information of SAG and UTEX strains including the general habitat, isolated locality, and taxonomic position were recorded in the Culture Collection of Algae at the University of Göttingen, Germany2 and the Culture Collection of Algae at the University of Texas at Austin,3 respectively. The habitats and morphological characteristics of most algal strains could be determined by the above methods. For some algae strains without strain numbers, according to their Latin name, we searched them on AlgaeBase,4 which was a global algal database of taxonomic, nomenclatural and distributional information. The original publication, detailed description, taxonomy status and habitat of these species were also recorded on this website. For the a species that could inhabit both freshwater and terrestrial environments, we found the original article based on the source of the sequence recorded on the NCBI (see text footnote 1), and determined the true habitat of the species based on the collected information recorded in materials and methods of the original article. Cell length was used as a proxy for cell size, and was first looked up on the relevant culture collection website using the strain number of the alga. If not found, the statistics are then searched in the original literature describing the algae strain. If the cell size for the strain could still could not be found, we looked for the cell size information of the same species on Algaebase (see text footnote 4) instead. The habitat, morphological characteristics, and chloroplast genomes size of these algal strains used for this study were summarized in Supplementary Table 1.
Before statistical analysis, normality and homogeneity of variance tests were performed on the data. The results showed that our data conformed to the normal distribution and met the parameter analysis conditions. The differences in chloroplast genome size and GC content between different habitats, different algal classes, and among varying morphological characteristics were visualized as box plots and using one-way ANOVA. Box plots were drawn using the ggplot2 package in R v3.6.0 (R Core Team, 2016). To evaluate the association of genome features with taxonomic classes, we compared only Ulvophyceae, Trebouxiophyceae, Chlorophyceae, as sampling size for the Chlorodendrophyceae and Pedinophyceae is very low. Siphonous macroalgae in the order Bryopsidales were not included in the statistical association of genome features to cell size because of their siphonous nature, consisting of a single giant tubular cell that is much larger than other algae in Chlorophyta.
Phylogenetic Analyses
Phylogenomic analyses were based on complete and partial chloroplast genome data from 67 representative species of Chlorophyta, including 21 Chlorophyceae, 29 Ulvophyceae, 12 Trebouxiophyceae, three Pedinophyceae, two Chlorodendrophyceae. Prasinophyte algae were used as the outgroup taxa. Each branch contains as much as possible the algae strains from freshwater, terrestrial, and marine habitats.
In order to derive a phylogenetic tree for the species included in the analysis, we extracted sequence data for 31 protein-coding genes (atpA, atpB, atpF, atpH, clpP, petB, petD, petG, psaB, psaC, psbA, psbB, psbJ, psbK, psbM, psbN, psbZ, rbcL, rpl14, rpl16, rpl20, rpl2, rpl5, rps11, rps18, rps19, rps7, rps8, rps9, tufA, ycf3) following Zhu et al. (2019). PhyloSuite v1.2.2 (Zhang et al., 2020) was used to prepare data for analysis. The 31 genes were aligned with MAFFT v 7.2 (Katoh and Standley, 2014) using codon alignment mode and ambiguously aligned regions were removed with Gblocks (Talavera and Castresana, 2007). The alignments were refined using the codon-aware program MACSE v2.03 (Ranwez et al., 2018), which preserves reading frame and allows incorporation of sequencing errors or sequences with frameshifts. Data concatenation used the “Concatenate Sequence” function of PhyloSuite v1.2.2. ML analyses were carried out using IQ-TREE (Lam-Tung et al., 2015) with the best-fit partition model determined using the BIC criterion (Supplementary Table 2). The phylogenetic tree was visualized using the software Figtree v1.4.4.5
Results
General Features
The compiled genomic, habitat and morphological data is available as Supplementary Table 1. The variation in chloroplast genome size across Chlorophyta and how it breaks down into different types of genome content is shown in Figure 1. Most Ulvophyceae chloroplast genome do not have quadripartite structure and it appears to be the intergenic regions that contribute most to chloroplast genome size variation, followed by introns content and coding regions (Figure 1). Among the Ulvophyceae, chloroplast genomes of Bryopsidales and Ulvales are all smaller than 150 kb and at the other extreme are the Trentepohliales, with 6 of 7 chloroplast genomes exceeding 250 kb (Figure 2). The Trebouxiophyceae chloroplast genomes are found to be of intermediate size, nearly all in the 100–200 kb range (Figure 2). The Chlorophyceae chloroplast genome are relatively large, generally in the range of 150–250 kb but with some exceptions (Figures 1, 2). IR size variation in Chlorophyceae is remarkable, with the IRs of Colemanosphaera angeleri (3.4 kb) and Oedogonium cardiacum (35.5 kb) showing about 10-fold size difference. At 521,168 bp, Floydiella terrestris is a larger chloroplast genome than other members in Chlorophyta, with nearly all of the “excess” size accounted for by intergenic regions (Figure 1). Compared with other IR-containing chloroplast genomes in Ulvophyceae, Trentepohlia odorata possessed a larger SSC region, which was caused by a long intergenic regions in SSC, and intergenic regions account for 69.2% of the SSC region (Figure 1). The GC content in investigated Chlorophyta chloroplast genomes ranges from 23.9% (for Aphanochaete elegans, Chlorophyceae) to 50.6% (for Paradoxia multiseta, Trebouxiophyceae) (Supplementary Table 1).
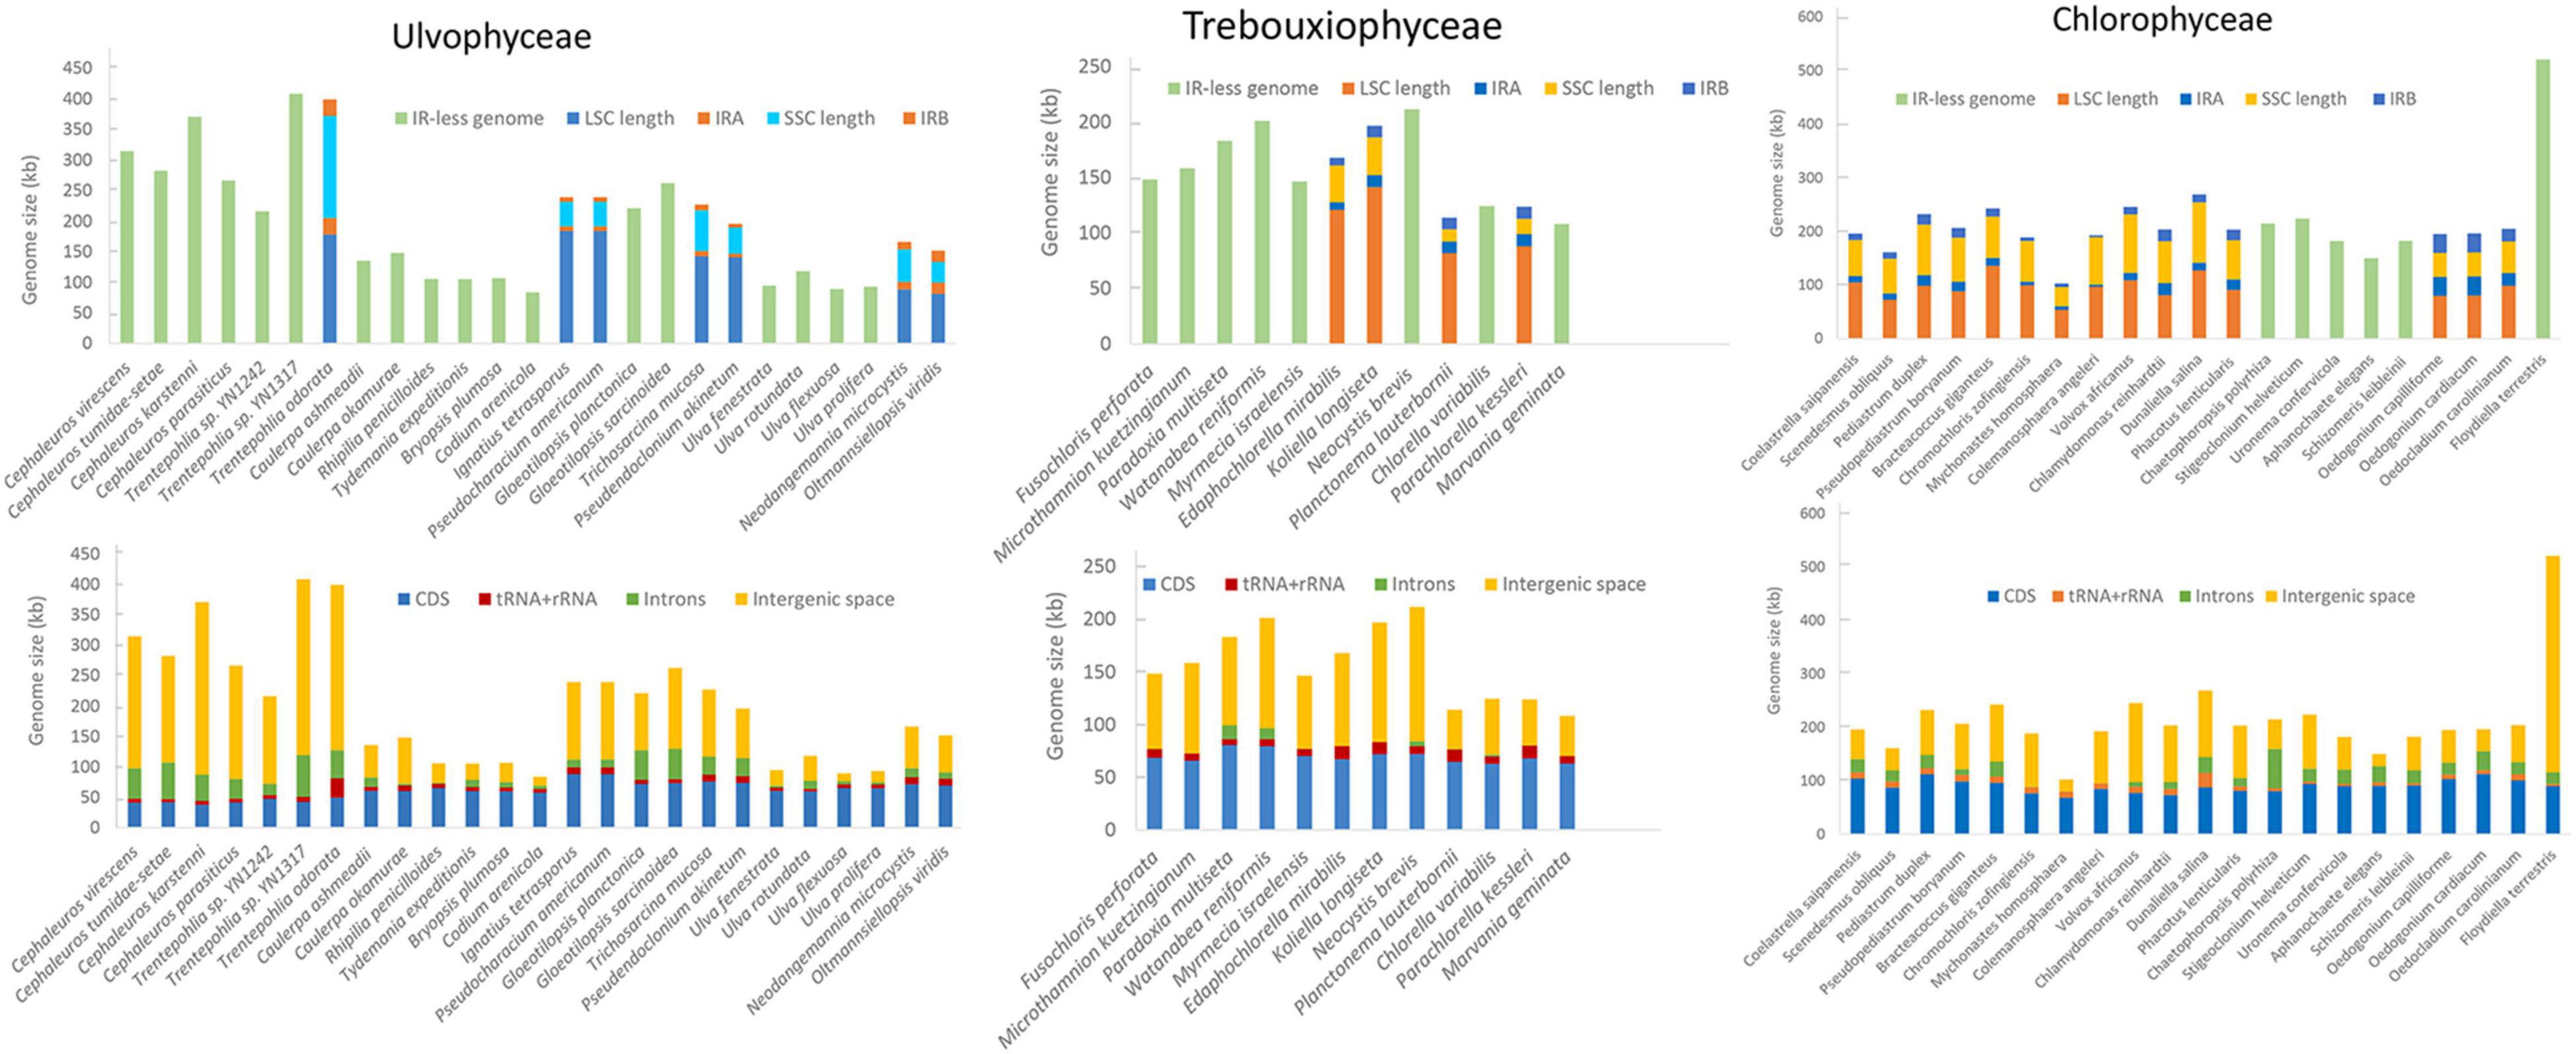
Figure 1. Chloroplast genomes size compared Ulvophyceae, Trebouxiophyceae, Chlorophyceae.
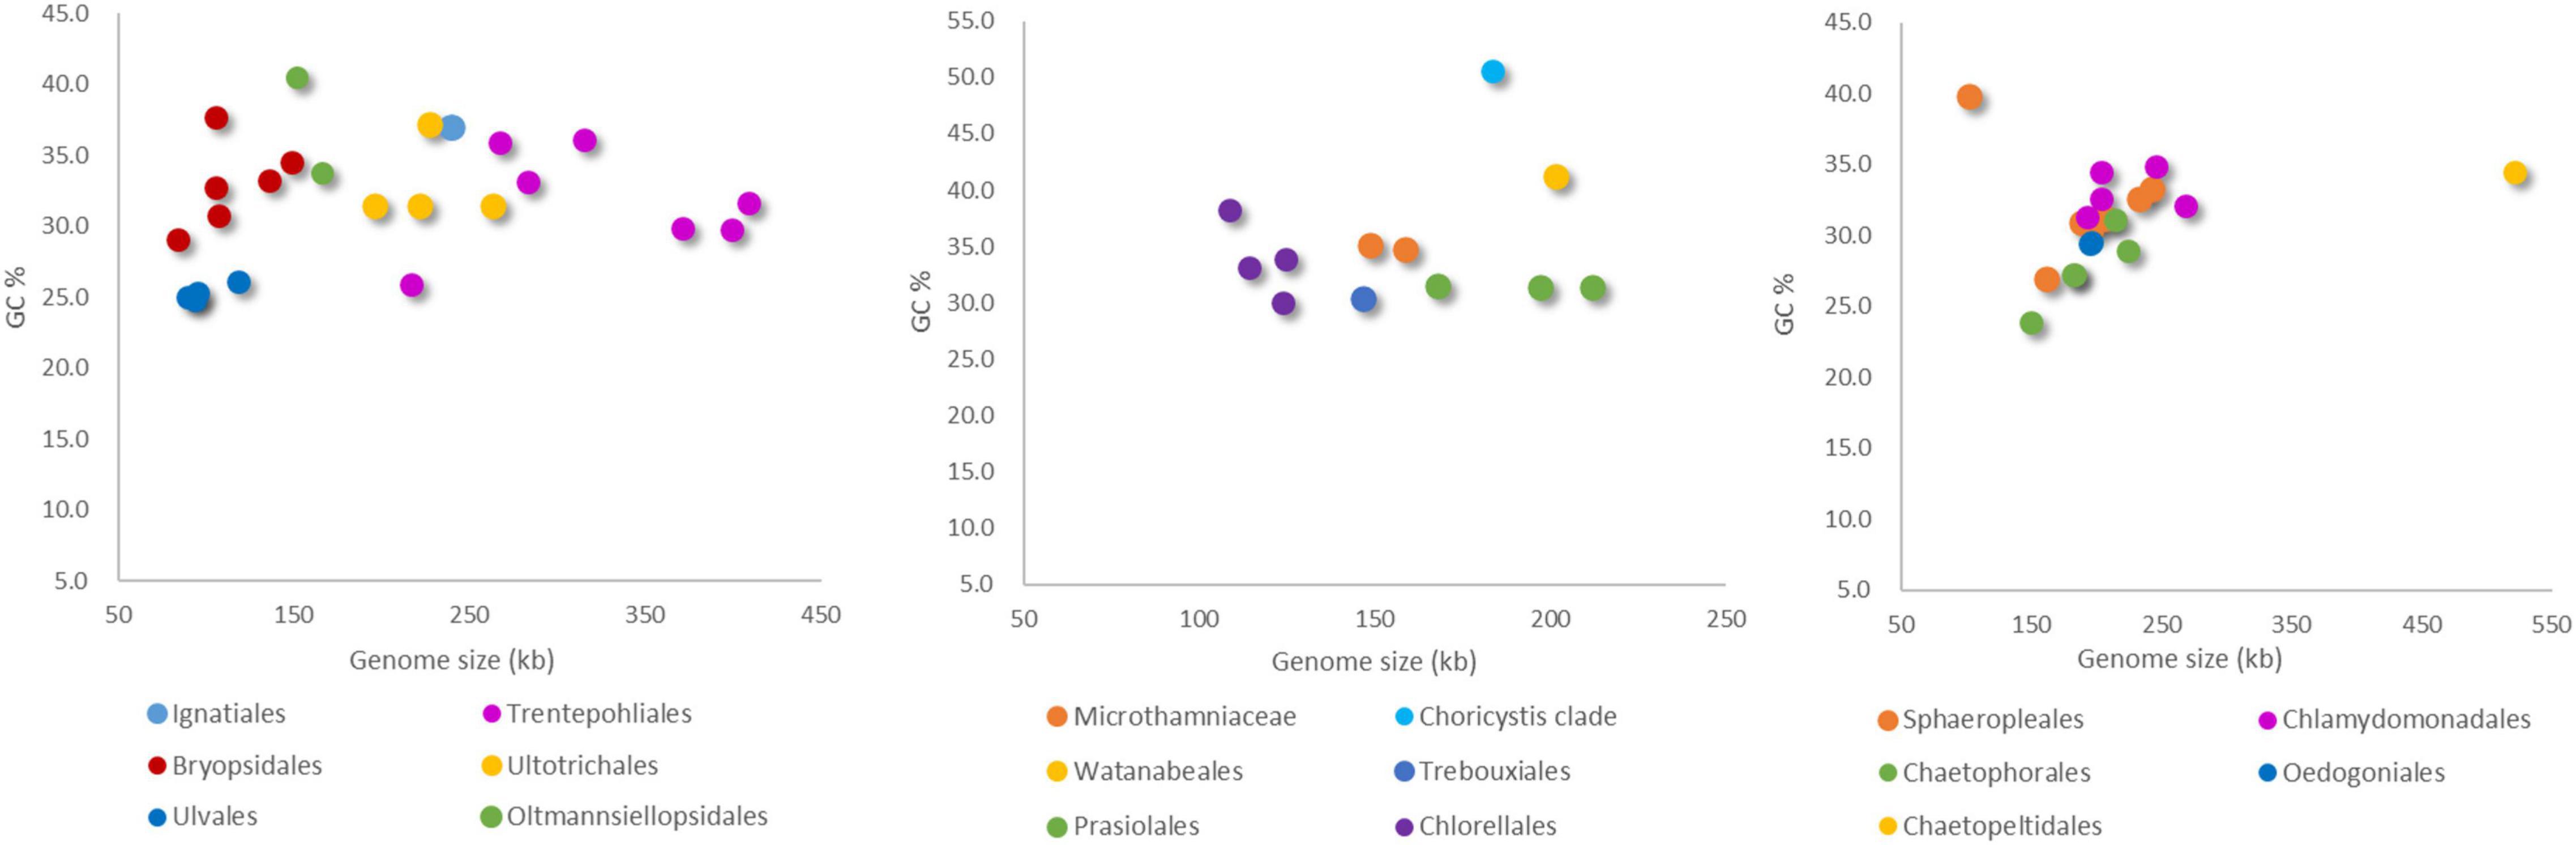
Figure 2. Comparison of chloroplast genome size and GC content in Ulvophyceae (left), Trebouxiophyceae (middle), and Chlorophyceae (right).
Correlates of Chloroplast Genome Features
The boxplots in Figure 3 show some apparent associations between chloroplast genome size and habitat, functional morphological groups and taxonomic groupings. The chloroplast genome of terrestrial algae is generally larger than that of freshwater and marine habitats, and this difference was statistically significant. The most important contributor to these enlarged genomes in terrestrial species is the length of intergenic regions (Figure 4). There was no clear difference in the GC content of chloroplast genomes from the three habitats categories (Figure 3).
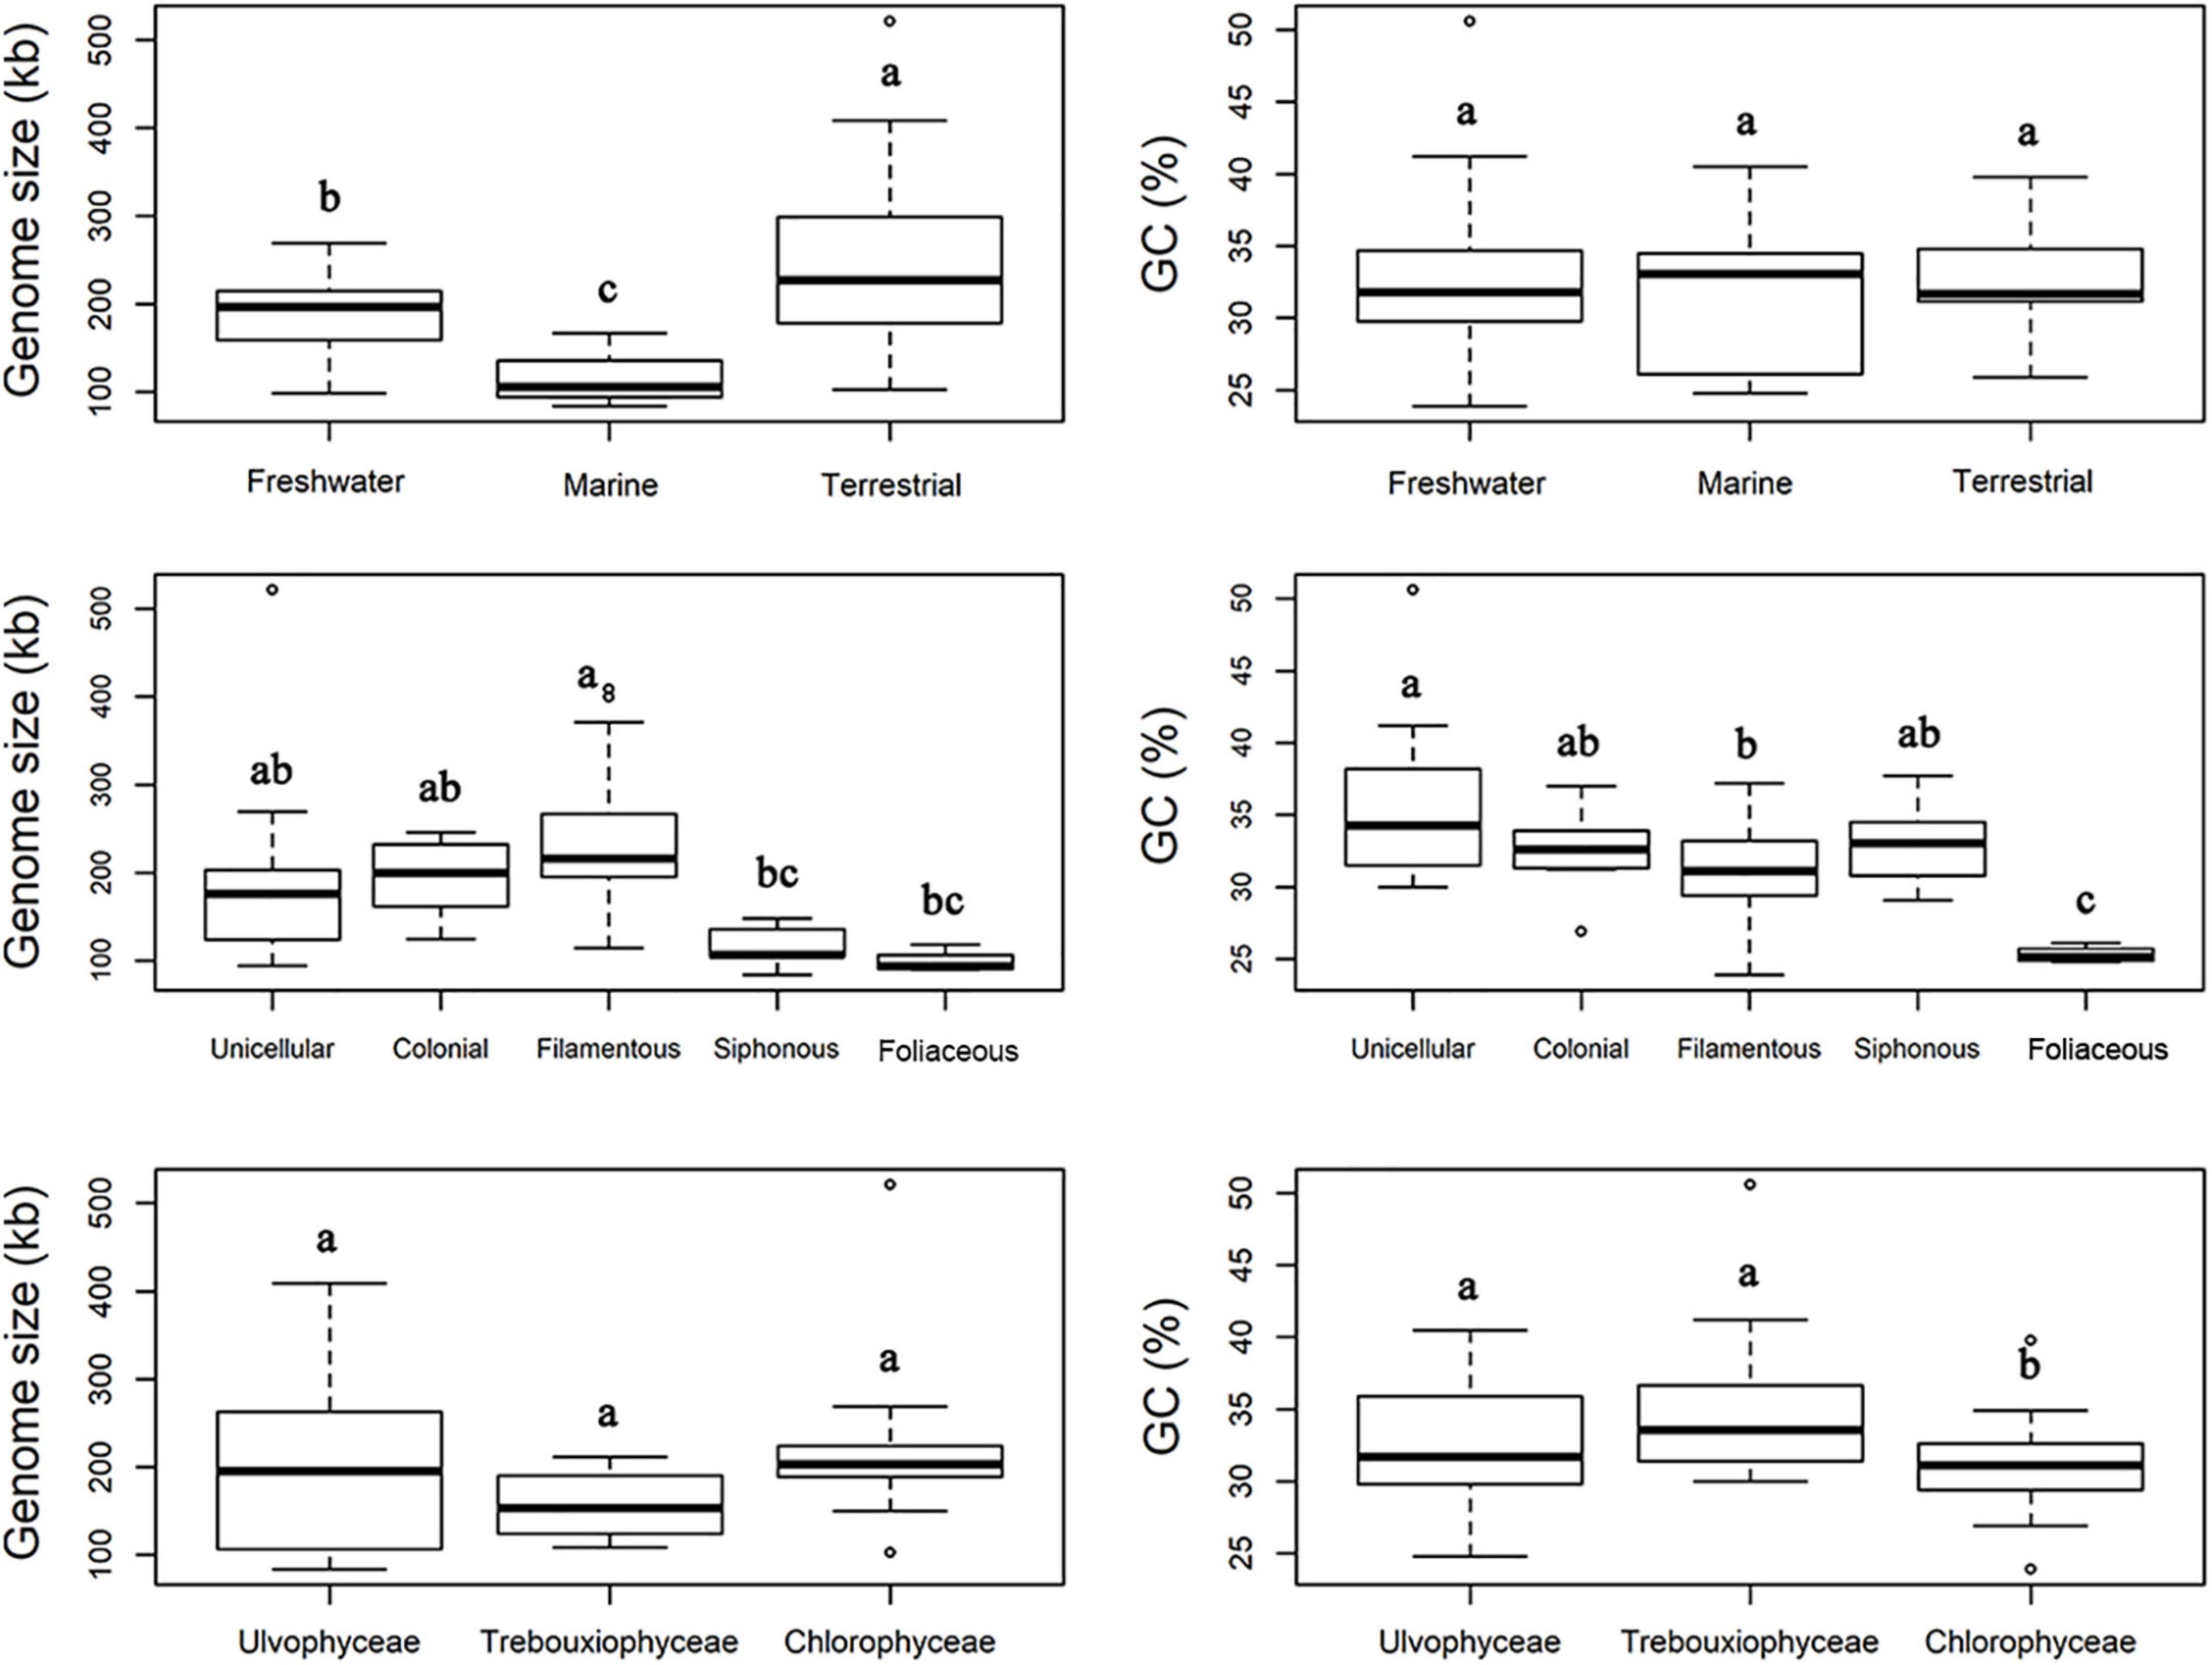
Figure 3. Comparison of chloroplast genome size and GC content of Chlorophyta from different habitats (top), diverse functional morphology (middle), and taxonomic classes (bottom). The common letters above boxplots represent insignificant differences of variables (e.g., a and ab; ab and b), the different letters above boxplots represent significant differences variables (e.g., a and b; b and c).
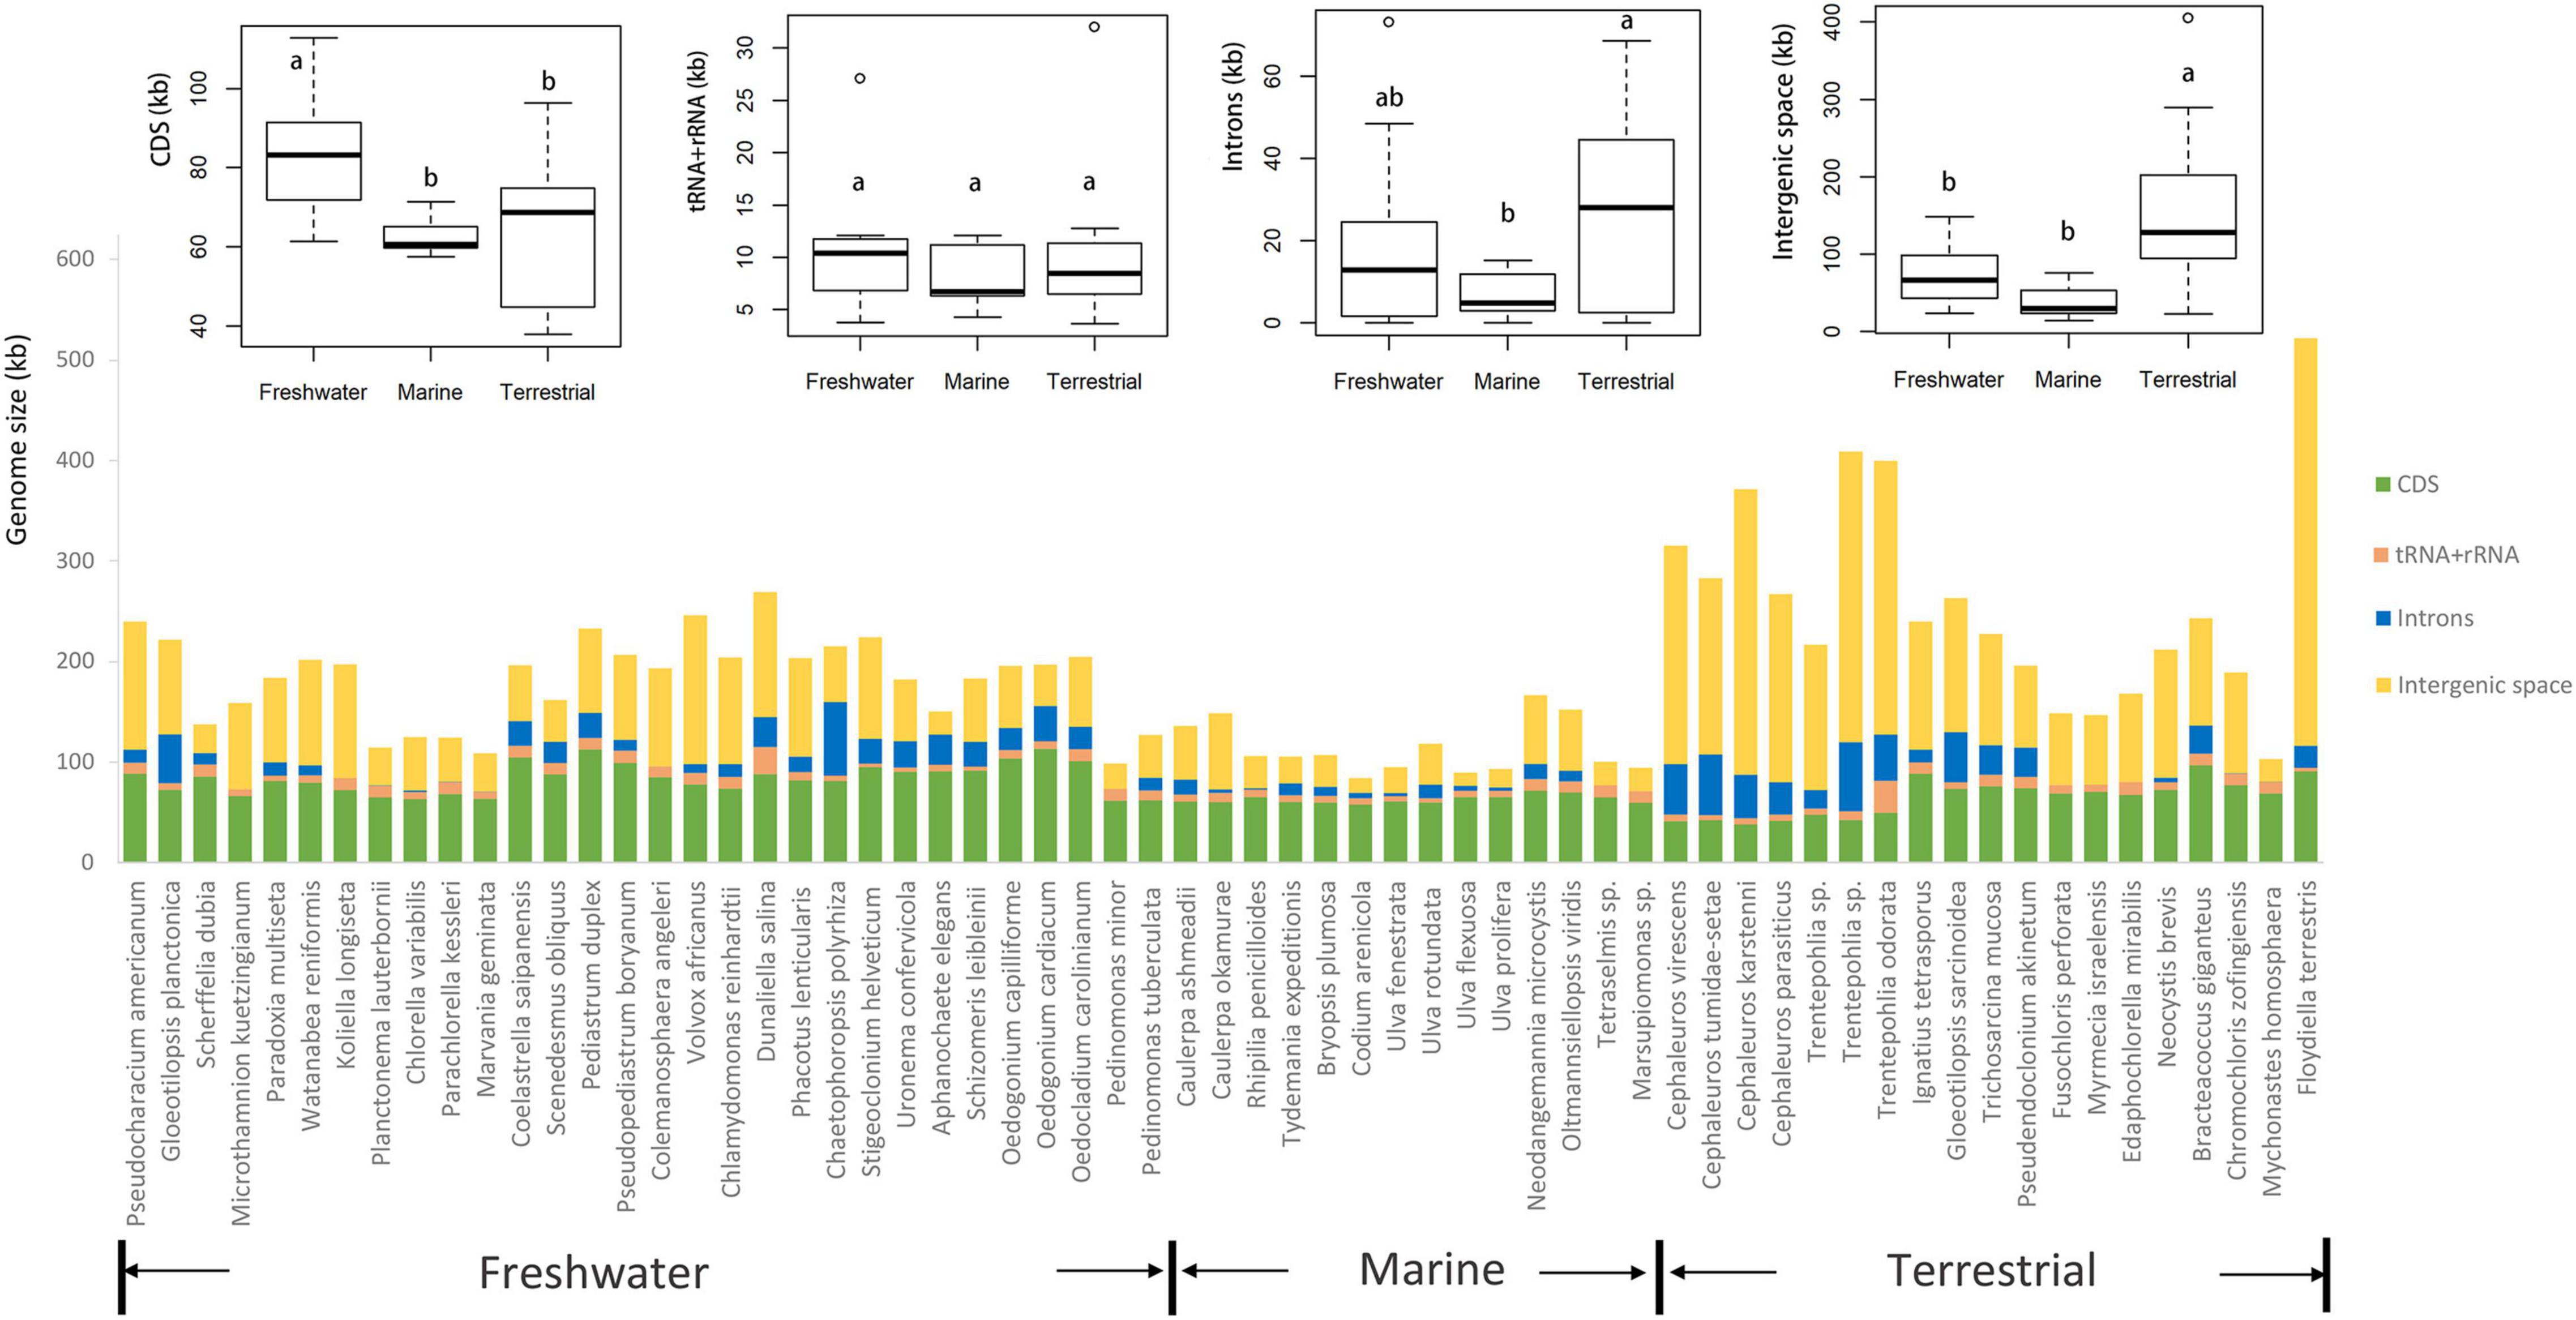
Figure 4. Comparison of chloroplast genome size ordered by habitat (freshwater, marine, and terrestrial). Comparison of CDS, tRNA + rRNA, introns, and intergenic region from freshwater, marine and terrestrial habitats was shown on the top of the graph. The common letters above boxplots represent insignificant differences of variables (e.g., a and ab; ab and b), the different letters above boxplots represent significant differences variables (e.g., a and b; b and c).
Functional morphological categories also showed differences in chloroplast genome size, with filamentous algae having substantially larger genomes than other forms of algae (Figure 3), and a statistically significant differences observes with siphonous and foliose algae. The GC content in the chloroplast genome of the foliose algae was significantly lower than that of the other forms of algae, the GC content in chloroplast genomes of unicellular algae was higher as a whole.
Figure 3 clearly shows the broader variation in genome size among Ulvophyceae than within the other classes that could already be gleaned from Figure 1. It also shows that Chlorophyceae tended to have larger chloroplast genomes on average than Trebouxiophyceae, but none of the differences between classes was significant. The GC content of Chlorophyceae chloroplast genomes is significantly lower than that of Ulvophyceae and Trebouxiophyceae (Figure 3).
A positive relationship was found between chloroplast genome size and cell size for the Chlorophyta as a whole and within each of the major classes (Supplementary Figure 1). The spread of residuals around the fitted regression model was large, with R2-values ranging from 0.015 in the Chlorophyceae to 0.1944 for the Trebouxiophyceae. A positive relation was also found between GC content and genome size for all classes individually, with R2-values in the 0.043–0.106 range, but this positive association disappeared when data from all classes were combined (Supplementary Figure 1).
Evolution Traits Along Phylogenetic Tree
Our phylogenetic analysis based on 31 protein-coding genes was shown in Figure 5. It was clear shown that Ulvophyceae features highly morphological and ecological diversity, ubiquitous in marine, freshwater and terrestrial habitats, ranging from unicellular, colonial to siphonous forms. The algae strains of Trebouxiophyceae we investigated were mainly from terrestrial and freshwater habitats, and most of them were unicellular. In the surveyed Chlorophyceae taxon, most are from freshwater habitat. At the base of the phylogenetic tree is Pedinophyceae, all of them are unicellular and have typical quadripartite structure. In addition, except for a few algae, the GC content of Chlorophyta is concentrated at about 30%. The order Trentepohliales in Ulvophyceae and Chaetopeltidales in Chlorophyceae have relatively large chloroplast genomes, and genome size varies greatly in Ulvophyceae.
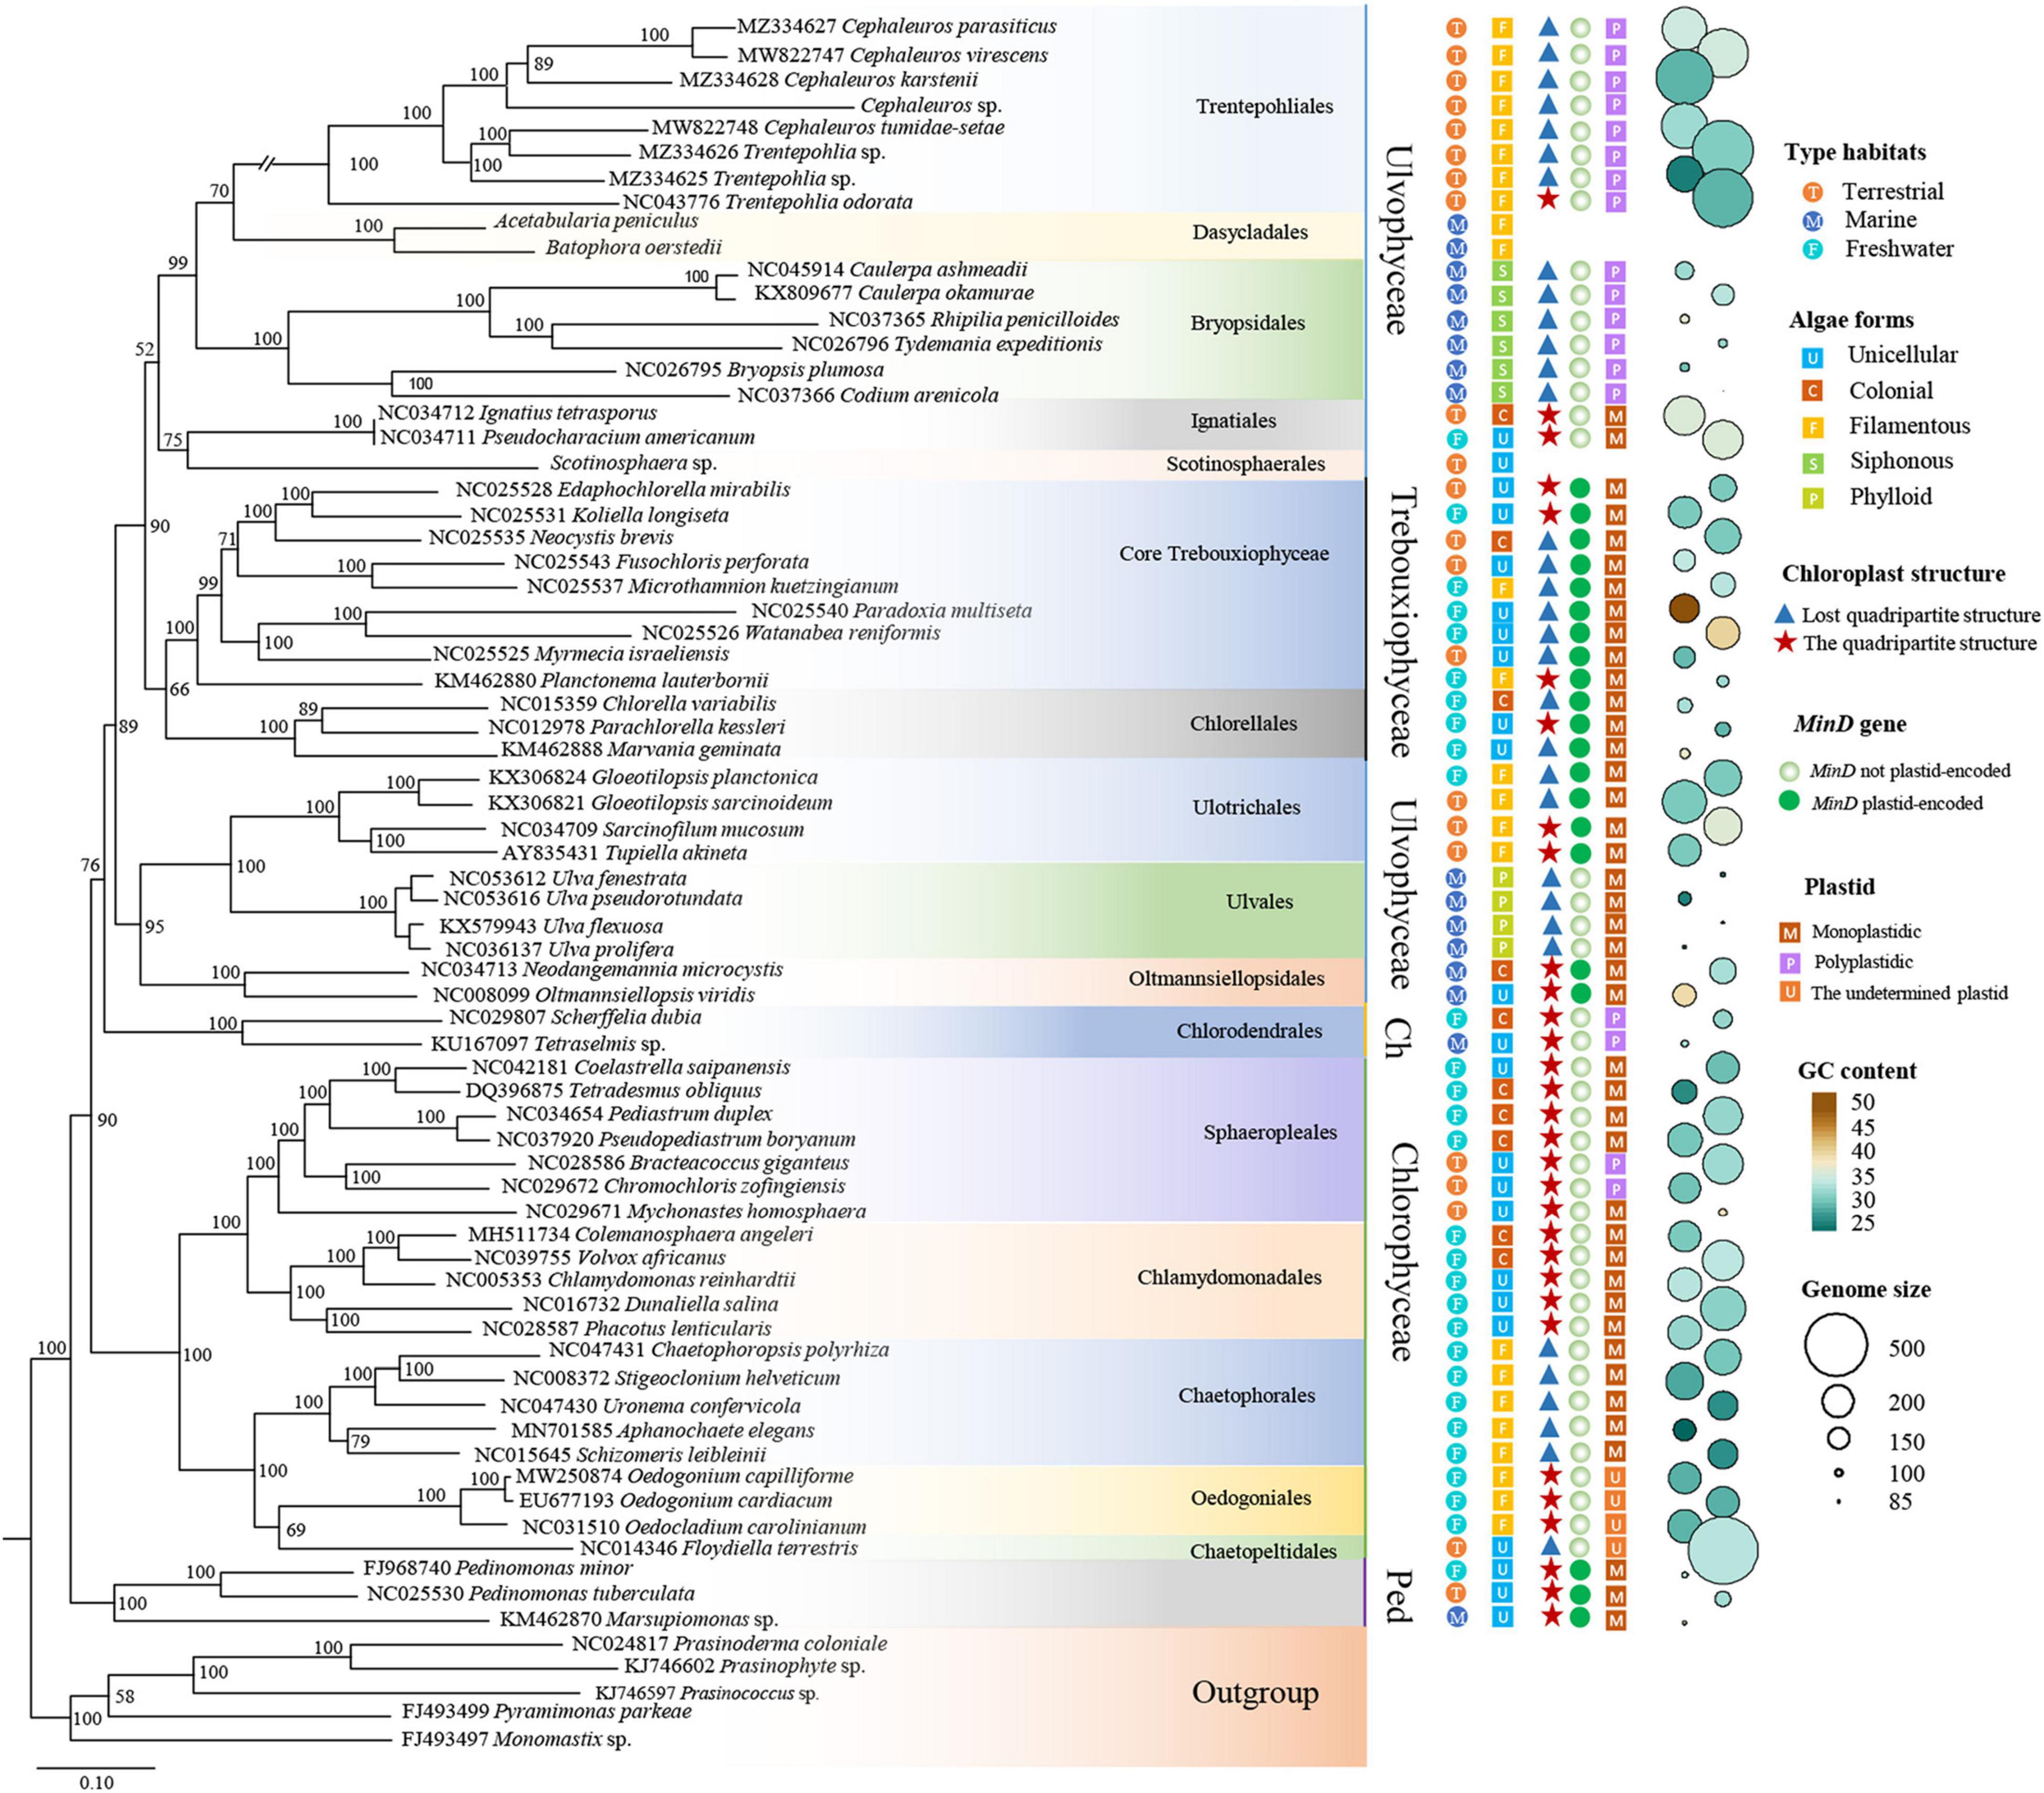
Figure 5. ML phylogenetic tree inferred from 31 common protein coding genes. Maximum likelihood bootstrap values (1,000 replicates) are given near the nodes. Scale bar indicates substitutions per site. Chlorodendrophyceae and Pedinophyceae represented by the abbreviations Ch and Ped, respectively. On the right of the figure, from left to right, the first column of circles with different colors indicates that the algae strains come from different habitats. The second column of squares with different colors represents different morphology of green algae. The triangles in the third column represent that algae strains lack quadripartite structure, the pentacles represent algae strains have quadripartite structure. The fourth column represents whether the minD gene is present in chlorophytes algae. The five column represents the number of plastids per cell. The size and color of the circle on the right of the graph represent the genome size and GC content, respectively.
The Distribution of MinD in Chlorophyta
Previous research speculated that there might be a connection between the loss of MinD/MinE genes from plastid genomes and the emergence of polyplastidy (de Vries et al., 2016). In other words, the absence of minD and minE from the plastid genomes could be a prerequisite for the evolution of polyplastidy. In view of these, the number of plastids per cell and the distribution of minD gene in Chlorophyta were investigated in present study. Most of the investigated Chlorophyta algae housed a single plastid per cell. Only minD gene was found in Chlorophyta, minE was not found. All investigated algae of Trebouxiophyceae and Pedinophyceae contained minD in their plastid genome were monoplastidic, which was consistent with previous study (de Vries and Gould, 2018). The algae in order Trentepohliales and Bryopsidales of Ulvophyceae were multiple plastids per cell, and minD gene were absent from their plastid genomes. Ulotrichales and Oltmannsiellopsidales both housed a single plastid per cell, minD gene was present in their plastid genomes. The aforementioned four orders of Ulvophyceae, Chlorodendrophyceae and a few Chlorophyceae were consistent with the speculation reported by de Vries and Gould (2018). This speculation did not work in the order Ulvales, which housed only one plastid per cell, but lost the minD gene from their plastids. This situation also existed in most algae of the Chlorophyceae (Figure 5).
Discussion
Our data compilation confirms that the quadripartite structure of chloroplast genomes is by no means universal across Chlorophyta, with 18 of the 25 Ulvophyceae, 8 of the 12 Trebouxiophyceae and 6 of the 21 surveyed Chlorophyceae chloroplast genomes not possessing inverted repeats (Figure 1). Chloroplast genome size variation could largely be attributed to the length of intergenic regions, followed by intron content and coding regions (Figure 1), consistent with previous observations (Turmel et al., 2017; Cremen et al., 2018).
The quadripartite structure of plastid genomes—with a large single copy region, a small single copy region and two inverted repeat regions—is thought to be ancestral in Viridiplantae, and our data compilation confirms previous reports that this architecture has been lost many times independently. Losses appear to have happened at least 4 times in Ulvophyceae, 7 times in Trebouxiophyceae and twice in the Chlorophyceae (this study; Brouard et al., 2010; Turmel et al., 2015, 2017; Turmel and Lemieux, 2018). Other special example of changes in the architecture of chloroplast genomes are found in the Cladophorales, whose chloroplast genome are fragmented into multiple linear hairpin chromosomes (Del Cortona et al., 2017) and Koshicola spirodelophila, whose which chloroplast genome assembled into three circular chromosomes (Watanabe et al., 2016).
The comparison of chloroplast genome size and GC content across habitats and functional form groups revealed several trends, including terrestrial algae having large genomes, filamentous algae having large genomes, foliose algae having small and GC-poor genomes, and a positive correlation between cell size and genome size as well as GC content. We must caution here about the interpretation of these correlations. An important consideration to make is that there is autocorrelation between traits and phylogenetic lineages. For example, all foliose algae in our dataset are in a single genus (Ulva), so we cannot be certain whether the association of foliose algae with small and GC-poor genomes is due to them being foliose, or results from their shared ancestry in the genus Ulva.
Some other correlations are more robust and span across taxon boundaries, for instance the tendency of terrestrial algae to have larger chloroplast genomes. Terrestrial algae are found in many branches of the green algal tree (Figure 5) and yet the correlation with genome size is significant. The expansions of these genomes is largely attributable to inflation of the intergenic regions. One example of a terrestrial green alga with a large chloroplast genome is Floydiella terrestris, which has 521,168 bp cpDNA sequence, with intergenic regions accounting for 77.8% of the total chloroplast genome (Brouard et al., 2010). In the Ulvophyceae, the terrestrial Trentepohliales and Ulotrichales also tend to have relatively large genomes (Fang et al., 2021). A range of reasons could underly this trend. One hypothesis is that the increased UV in terrestrial habitats may lead to higher levels of DNA damage. If this DNA is repaired with error-prone mechanisms, especially those based on non-homologous end joining or break-induced replication which can cause genomic expansion and rearrangements (Christensen, 2013, 2014). A more adaptationist hypothesis could center around the extra intergenic DNA having a beneficial function in terrestrial algae, but how this would work is unclear to us.
Among morphological traits, we also found filamentous thalli had significantly larger genome sizes than siphonous and foliose forms. That said, the chloroplast genome size of the filamentous thalli is not significantly different from that of unicellular and colonial algae, so the observed trend may rather be a consequence of genome reduction in the foliose and siphonous algae rather than an increase in filamentous algae. Both the siphonous algae (Bryopsidales) and foliose algae (Ulva) lack inverted repeats and have a tendency toward reduced intergenic spaces (Melton et al., 2015; Marcelino et al., 2016).
Our survey shows a clear association between chloroplast genome features and cell dimensions: both genome size and GC content are positively correlated with cell size. The association between cell and genome size had previously been shown in particular groups of green algae (Lemieux et al., 2014b; Turmel et al., 2015) but is here confirmed at larger taxonomic scale, and shown to be consistent across the 3 largest classes of Chlorophyta. Pico- and nanoplanktonic taxa in particular tend to have the smallest genomes in the group including Trebouxiophyceae and prasinophytes (Lemieux et al., 2014b; Smith, 2017). The causes for the relationship between chloroplast genome size and cell size have been discussed to some length (Smith, 2017), but there is no consensus on how important adaptive vs. non-adaptive processes are, or whether it simply depends on the group under study. Regardless of the causes, our results suggest that there was a certain correlation between cell size and chloroplast genome size across the Chlorophyta. This result comes with an important caveat though, being that we restricted our analysis to species in which cell size could be easily determined. In doing so, we excluded several siphonous or multicellular coenocytic groups including the Bryopsidales, Cladophorales and Dasycladales. These coenocytes are giants compared to the single-celled green algae in our data, so if the observed trend extrapolates to these organisms we would expect them to have enormous chloroplast genomes. This is certainly the case for Dasycladales, that have genomes of several megabases, but most certainly not for the Bryopsidales that have some of the smallest genomes among Ulvophyceae (Figure 1) and the Cladophorales that have tiny genomes encoded on DNA hairpins (Del Cortona et al., 2017). We also observed a positive association of GC content with genome size, and a lower GC content in Chlorophyceae compared to Ulvophyceae and Trebouxiophyceae. It has been argued that the forces tending nucleotide composition to G and C are largely non-adaptive, including biased mutation pressure and biased gene conversion (Smith et al., 2011; Smith, 2012).
By analyzing publicly available chloroplast genomes of Chlorophyta, we detected minD plastid-encoded genes and the number of plastids per cell in Chlorophyta (Figure 5) as reported by de Vries and Gould (2018), and de Vries et al. (2016). However, these authors sampled the mainly Trebouxiophyceae and streptophyte algae. In our study, we sampled in a wide range of Chlorophyta. Algae that contain minD and/or minE in their plastid genome tend to be monoplastidic (de Vries and Gould, 2018). the situation was in line with TB clade (Trentepohliales and Bryopsidales) and UO (Ulotrichales and Oltmannsiellopsidales) clade of Ulvophyceae, Trebouxiophyceae, Chlorodendrophyceae, a few Chlorophyceae, and Pedinophyceae. However, the remaining groups including the order Ignatiales, Ulvales, and most Chlorophyceae, was inconsistent. For example, the members of the order Ignatiales and Ulvales lost minD gene in their plastid genome, according to speculation by de Vries and Gould (2018), the cells should be polyplastidic, but the cells are predominantly monoplastidic. Of course, plastid division was complex process, involved in the interplay of the plastid and the nucleus. Endosymbiotic gene transfer (EGT) could be essential to gain more control over plastid function and division (de Vries and Gould, 2018). We cannot rule out the possibility that EGT of minD to the nucleus is occurring in the order Ignatiales and Ulvales. Another possibility is that the it could be considered as an intermediate stage between housing strictly one or multiple plastids per cell in plastids of the order Ignatiales and Ulvales. As more molecular data become available, further research is needed to clarify this evolutionary mechanism.
Data Availability Statement
The datasets presented in this study can be found in online repositories. The names of the repository/repositories and accession number(s) can be found in the article/Supplementary Material.
Author Contributions
JF: data analysis and drafting manuscript. YC: data collection. GL: resources. HV: contributions to concepts, data analysis, and manuscript editing. HZ: original concept, data analysis, and manuscript. All authors contributed to the article and approved the submitted version.
Funding
This work was supported by National Natural Science Foundation of China under (Grant No. 31600168), the China Agriculture Research System under (Grant No. CARS-50), and the Australian Biological Resources Study (Grant No. 4-G046WSD).
Conflict of Interest
The authors declare that the research was conducted in the absence of any commercial or financial relationships that could be construed as a potential conflict of interest.
Publisher’s Note
All claims expressed in this article are solely those of the authors and do not necessarily represent those of their affiliated organizations, or those of the publisher, the editors and the reviewers. Any product that may be evaluated in this article, or claim that may be made by its manufacturer, is not guaranteed or endorsed by the publisher.
Supplementary Material
The Supplementary Material for this article can be found online at: https://www.frontiersin.org/articles/10.3389/fevo.2021.791166/full#supplementary-material
Supplementary Figure 1 | The relationship between chloroplast genome size, GC content and cell size.
Supplementary Table 1 | GenBank accession numbers and features of Chlorophyta used in this study.
Footnotes
- ^ https://www.ncbi.nlm.nih.gov/
- ^ http://sagdb.uni-goettingen.de
- ^ http://www.utex.org
- ^ https://www.algaebase.org/
- ^ http://tree.bio.ed.ac.uk/software/figtree/
References
Brouard, J. S., Otis, C., Lemieux, C., and Turmel, M. (2010). The exceptionally large chloroplast genome of the green alga floydiella terrestris illuminates the evolutionary history of the chlorophyceae. Genome Biol. Evol. 2, 240–256. doi: 10.1093/gbe/evq014
Cheng, S. F., Xian, W. F., Fu, Y., Marin, B., Keller, J., Wu, T., et al. (2019). Genomes of subaerial Zygnematophyceae provide insights into land plant evolution. Cell 179, 1057–1067. doi: 10.1016/j.cell.2019.10.019
Christensen, A. C. (2013). Plant mitochondrial genome evolution can be explained by DNA repair mechanisms. Genome Biol. Evol. 5, 1079–1086. doi: 10.1093/gbe/evt069
Christensen, A. C. (2014). Genes and junk in plant mitochondria—repair mechanisms and selection. Genome Biol. Evol. 6, 1448–1453. doi: 10.1093/gbe/evu115
Cremen, M. C. M., Leliaert, F., Marcelino, V. R., and Verbruggen, H. (2018). Large diversity of nonstandard genes and dynamic evolution of chloroplast genomes in siphonous green algae (Bryopsidales, Chlorophyta). Genome Biol. Evol. 10, 1048–1061. doi: 10.1093/gbe/evy063
de Cambiaire, J. C., Otis, C., Turmel, M., and Lemieux, C. (2007). The chloroplast genome sequence of the green alga Leptosira terrestris: multiple losses of the inverted repeat and extensive genome rearrangements within the Trebouxiophyceae. BMC Genomics 8:213. doi: 10.1186/1471-2164-8-213
de Vries, J., and Gould, S. B. (2018). The monoplastidic bottleneck in algae and plant evolution. J. Cell Sci. 131:jcs203414. doi: 10.1242/jcs.203414
de Vries, J., Stanton, A., Archibald, J. M., and Gould, S. B. (2016). Streptophyte terrestrialization in light of plastid evolution. Trends Plant Sci. 21, 467–476. doi: 10.1016/j.tplants.2016.01.021
Del Cortona, A., Jackson, C. J., Bucchini, F., Van Bel, M., D’hondt, S., Škaloud, P., et al. (2020). Neoproterozoic origin and multiple transitions to macroscopic growth in green seaweeds. Proc. Nat. Acad. Sci. U. S. A. 117, 2551–2559. doi: 10.1073/pnas.1910060117
Del Cortona, A., Leliaert, F., Bogaert, K. A., Turmel, M., Boedeker, C., Janouškovec, J., et al. (2017). The plastid genome in Cladophorales green algae is encoded by hairpin chromosomes. Curr. Biol. 27, 3771–3782. doi: 10.1016/j.cub.2017.11.004
Fang, J., Liu, G. X., Verbruggen, H., Zhu, H., et al. (2021). Six newly sequenced chloroplast genomes from Trentepohliales:the inflated genomes, alternative genetic code and dynamic evolution. Front. Plant Sci. 12:780054. doi: 10.3389/fpls.2021.780054
Fürst-Jansen, J. M. R., de Vries, S., and de Vries, J. (2020). Evo-physio: on stress responses and the earliest land plants. J. Exp. Bot. 71, 3254–3269. doi: 10.1093/jxb/eraa007
Jiao, C., Sorensen, I., Sun, X. P., Sun, H. H., Behar, H., Alseekh, S., et al. (2020). The Penium margaritaceum genome: hallmarks of the origins of land plants. Cell 181, 1097–1111. doi: 10.1016/j.cell.2020.04.019
Katoh, K., and Standley, D. M. (2014). MAFFT: iterative refinement and additional methods. Mol. Biol. Evol. 1079, 131–146. doi: 10.1007/978-1-62703-646-7_8
Lam-Tung, N., Schmidt, H. A., Von Haeseler, A., and Bui Quang, M. (2015). IQ-TREE: a fast and effective stochastic algorithm for estimating maximum-likelihood phylogenies. Mol. Biol. Evol. 32, 268–274. doi: 10.1093/molbev/msu300
Leliaert, F., and Lopez-Bautista, J. M. (2015). The chloroplast genomes of Bryopsis plumosa and Tydemania expeditiones (Bryopsidales, Chlorophyta): compact genomes and genes of bacterial origin. BMC Genomics 16:204. doi: 10.1186/s12864-015-1418-3
Leliaert, F., Smith, D. R., Moreau, H., Herron, M. D., Verbruggen, H., Delwiche, C. F., et al. (2012). Phylogeny and molecular evolution of the green algae. Crit. Rev. Plant Sci. 31, 1–46. doi: 10.1080/07352689.2011.615705
Lemieux, C., Otis, C., and Turmel, M. (2000). Ancestral chloroplast genome in Mesostigma viride reveals an early branch of green plant evolution. Nature 403, 649–652. doi: 10.1038/35001059
Lemieux, C., Otis, C., and Turmel, M. (2014b). Six newly sequenced chloroplast genomes from prasinophyte green algae provide insights into the relationships among prasinophyte lineages and the diversity of streamlined genome architecture in picoplanktonic species. BMC Genomics 15:857. doi: 10.1186/1471-2164-15-857
Lemieux, C., Otis, C., and Turmel, M. (2014a). Chloroplast phylogenomic analysis resolves deep-level relationships within the green algal class Trebouxiophyceae. BMC Evol. Biol. 14:211. doi: 10.1186/s12862-014-0211-2
Li, X., Hou, Z., Xu, C., Shi, X., Yang, L., Lewis, L. A., et al. (2021). Large phylogenomic datasets reveal deep relationships and trait evolution in chlorophyte green algae. Genome Biol. Evol 13:evab101. doi: 10.1093/gbe/evab101
Luo, C., Huang, W., Sun, H., Yer, H., Li, X., Li, Y., et al. (2021). Comparative chloroplast genome analysis of Impatiens species (Balsaminaceae) in the karst area of China: insights into genome evolution and phylogenomic implications. BMC Genomics 22:571. doi: 10.1186/s12864-021-07807-8
Marcelino, V. R., Cremen, M. C. M., Jackson, C. J., Larkum, A., and Verbruggen, H. (2016). Evolutionary dynamics of chloroplast genomes in low light: a case study of the endolithic green alga Ostreobium quekettii. Genome Biol. Evol. 8, 2939–2951. doi: 10.1093/gbe/evw206
Melton, J. T., Leliaert, F., Tronholm, A., and Lopez-Bautista, J. M. (2015). The complete chloroplast and mitochondrial genomes of the green macroalga Ulva sp UNA00071828 (Ulvophyceae, Chlorophyta). PLoS One 10:e0121020. doi: 10.1371/journal.pone.0121020
Morris, J. L., Puttick, M. N., Clark, J. W., Edwards, D., Kenrick, P., Pressel, S., et al. (2018). The timescale of early land plant evolution. Proc. Natl. Acad. Sci. U. S. A. 115, E2274–E2283. doi: 10.1073/pnas.1719588115
R Core Team (2016). R: a Language and Environment for Statistical Computing. Vienna, Austria: R Foundation for Statistical Computing.
Ranwez, V., Douzery, E. J. P., Cambon, C., Chantret, N., and Delsuc, F. (2018). MACSE v2: toolkit for the alignment of coding sequences accounting for frameshifts and stop codons. Mol. Biol. Evol. 35, 2582–2584. doi: 10.1093/molbev/msy159
Smith, D. R. (2012). Updating our view of organelle genome nucleotide landscape. Front. Genet. 3:175. doi: 10.3389/fgene.2012.00175
Smith, D. R. (2017). Does cell size impact chloroplast genome size? Front. Plant Sci. 8:2116. doi: 10.3389/fpls.2017.02116
Smith, D. R., Burki, F., Yamada, T., Grimwood, J., Grigoriev, I. V., Van Etten, J. L., et al. (2011). The GC-rich mitochondrial and plastid genomes of the green alga Coccomyxa give insight into the evolution of organelle DNA nucleotide landscape. PLoS One 6:e23624. doi: 10.1371/journal.pone.0023624
Sun, L., Fang, L., Zhang, Z. H., Chang, X., Penny, D., and Zhong, B. J. (2016). Chloroplast phylogenomic inference of green algae relationships. Sci. Rep. 6:20528. doi: 10.1038/srep20528
Talavera, G., and Castresana, J. (2007). Improvement of phylogenies after removing divergent and ambiguously aligned blocks from protein sequence alignments. Syst. Biol. 56, 564–577. doi: 10.1080/10635150701472164
Turmel, M., Gagnon, M. C., Okelly, C. J., Otis, C., and Lemieux, C. (2009). The chloroplast genomes of the green algae Pyramimonas, Monomastix, and Pycnococcus shed new light on the evolutionary history of Prasinophytes and the origin of the secondary chloroplasts of euglenids. Mol. Biol. Evol. 26, 631–648. doi: 10.1093/molbev/msn285
Turmel, M., and Lemieux, C. (2018). Evolution of the plastid genome in green algae. Adv. Bot. Res. 85, 157–193. doi: 10.1016/bs.abr.2017.11.010
Turmel, M., Otis, C., and Lemieux, C. (1999). The complete chloroplast DNA sequence of the green alga Nephroselmis olivacea: insights into the architecture of ancestral chloroplast genomes. Proc. Natl. Acad. Sci. U. S. A. 96, 10248–10253. doi: 10.1073/pnas.96.18.10248
Turmel, M., Otis, C., and Lemieux, C. (2015). Dynamic evolution of the chloroplast genome in the green algal classes Pedinophyceae and Trebouxiophyceae. Genome Biol. Evol. 7, 2062–2082. doi: 10.1093/gbe/evv130
Turmel, M., Otis, C., and Lemieux, C. (2017). Divergent copies of the large inverted repeat in the chloroplast genomes of Ulvophycean green algae. Sci. Rep. 7:994. doi: 10.1038/s41598-017-01144-1
Watanabe, S., Fucikova, K., Lewis, L. A., and Lewis, P. O. (2016). Hiding in plain sight: koshicola spirodelophila gen. et sp nov (Chaetopeltidales, Chlorophyceae), a novel green alga associated with the aquatic angiosperm Spirodela polyrhiza. Am. J. Bot. 103, 865–875. doi: 10.3732/ajb.1500481
Zhang, D., Gao, F., Jakovlic, I., Zou, H., Zhang, J., Li, W. X., et al. (2020). PhyloSuite: an integrated and scalable desktop platform for streamlined molecular sequence data management and evolutionary phylogenetics studies. Mol. Ecol. Resour. 20, 348–355. doi: 10.1111/1755-0998.13096
Zhu, H., Hu, Y. X., Liu, F., Hu, Z. Y., and Liu, G. X. (2019). Characterization of the chloroplast genome of Trentepohlia odorata (Trentepohliales, Chlorophyta), and discussion of its taxonomy. Int. J. Mol. Sci. 20:1774. doi: 10.3390/ijms20071774
Keywords: chloroplast genomes, comparative analysis, green algae, terrestrial algae, cell size, habitats
Citation: Fang J, Chen Y, Liu G, Verbruggen H and Zhu H (2021) Chloroplast Genome Traits Correlate With Organismal Complexity and Ecological Traits in Chlorophyta. Front. Ecol. Evol. 9:791166. doi: 10.3389/fevo.2021.791166
Received: 08 October 2021; Accepted: 15 November 2021;
Published: 08 December 2021.
Edited by:
Xiaofan Zhou, South China Agricultural University, ChinaReviewed by:
Jan de Vries, University of Göttingen, GermanyTatiana Arias, Tecnológico de Antioquia, Colombia
Copyright © 2021 Fang, Chen, Liu, Verbruggen and Zhu. This is an open-access article distributed under the terms of the Creative Commons Attribution License (CC BY). The use, distribution or reproduction in other forums is permitted, provided the original author(s) and the copyright owner(s) are credited and that the original publication in this journal is cited, in accordance with accepted academic practice. No use, distribution or reproduction is permitted which does not comply with these terms.
*Correspondence: Huan Zhu, aHVhbnpodUBpaGIuYWMuY24=