 Francesco Martini
 Chaobo Zou1,2
 Xiaoyang Song
 Uromi Manage Goodale
- 1Guangxi Key Laboratory of Forest Ecology and Conservation, College of Forestry, Guangxi University, Nanning, China
- 2State Key Laboratory of Conservation and Utilization of Subtropical Agro-Bioresources, College of Forestry, Guangxi University, Nanning, China
- 3CAS Key Laboratory of Tropical Forest Ecology, Xishuangbanna Tropical Botanical Garden, Chinese Academy of Sciences, Mengla, China
- 4Center of Conservation Biology, Core Botanical Gardens, Chinese Academy of Sciences, Mengla, China
- 5Seed Conservation Specialist Group, Species Survival Commission, International Union for Conservation of Nature (IUCN), Gland, Switzerland
Abiotic factors are important to shape plant community composition and diversity through processes described as environmental filtering. Most studies on plant diversity in forests focus on adult trees, while the abiotic drivers of forest seedling community characteristics are less understood. Here, we studied seedling banks’ composition, richness, diversity, and abundance, and investigated their relationships with microsite abiotic conditions along a wide elevational gradient. We sampled seedling communities in 312 1-m2 quadrats, distributed in 13 one-ha plots in four subtropical forests in south China, covering an elevation gradient of 1500 m, for 2 years. We measured light availability, slope, and 11 soil nutrients for each seedling quadrat. We used analysis of similarities and multivariate analysis of variance to compare the composition and abiotic drivers of the four forests’ seedling communities. We then used mixed models and structural equation modeling to test the direct and indirect effects of abiotic factors on seedling species richness, diversity, and abundance. The differences in seedling community composition among these forests were mostly explained by differences in elevations and soil nutrients. Seedling diversity as Shannon and Simpson diversity index decreased with increasing elevation and increased with increasing slope, but seedling abundance and species richness did not. Elevation had an indirect effect on Simpson’s diversity index through modulating the direct effects of soil properties. Our findings show that soil properties play a prominent role in favoring differentiation in species composition among the four forests we studied and provide additional evidence to decreasing species diversity with elevation. However, this was reflected in decreasing Shannon and Simpson indices rather than species richness, which is more commonly studied. Whether and to what extent future environmental changes in climate and soil acidification will alter future forest composition and diversity needs to be investigated.
Introduction
An important goal in plant community ecology is to understand what factors drive species composition and the diversity of communities. The processes that influence community assembly belongs to two major groups: those that focus on the effect of biotic interactions, and those that emphasize the abiotic conditions. The first mostly concerns the effects of species pool, dispersal and the interactions with neighboring plants and natural enemies, while the second studies the abiotic environment that critically contributes to form and maintain plant communities through processes described as environmental filtering (Kraft et al., 2015). These two groups of mechanisms are not mutually exclusive, but act in combination to form and maintain plant communities (Myers and Harms, 2009).
A regional species pool is defined as the sum of all species found at the regional scale. As such, we expect species richness of a community to be a subset of the regional pool. In short, if the regional pool is represented by high number of species, a given local community should have higher species richness compared to a community originating from a species-poor regional pool (Zobel, 1997). A second mechanism linking biotic interactions to species diversity concerns the interactions among conspecific and heterospecific neighboring plants and plant-animal interactions. One of the most important theories is the Janzen-Connell hypothesis, which predicts that plants found at higher density of or at closer distance to conspecifics suffer lower survival (Janzen, 1970; Connell, 1971). This hypothesis mostly applies to younger life stages such as the seed-to-seedling transition, and although its strength is debated, it is widely considered a relevant mechanism to explain species coexistence (Song et al., 2020; Hülsmann et al., 2021; LaManna et al., 2021).
In addition to biotic factors, the abiotic environment strongly contributes to explain patterns of species diversity and community structure (Myers and Harms, 2009). Each and every species is best suited to colonize an area or microsite matching its fundamental niche, and spatial variation in environmental conditions at different scales allow different species to coexist (Silvertown, 2004). It follows that community composition and diversity can vary along environmental axes, with implications for species distribution and coexistence. Among many abiotic factors, plant communities are influenced by elevation, soil properties, topography, and light availability.
At larger spatial scale, elevation has long been studied for its prominent role in gradients of species richness (McCain and Grytnes, 2010; Laiolo et al., 2018). Species richness is most often found to decrease with increasing elevation (Mohandass et al., 2017; Song et al., 2021a), but patterns such as mid-altitude peaks are also common (Rahbek, 1995; Vetaas and Grytnes, 2002) and for some taxa (e.g., lichens) an increase in species with elevation has been reported [Bässler et al., 2016, but see also Baniya et al., 2010 for an example of humped relationships]. Commonly, lower richness found at higher elevation is linked to smaller land area available in mountain tops or climatic variation, with elevation being a proxy of temperature, precipitation, and productivity (McCain and Grytnes, 2010). Other mechanisms that can explain the relationship between elevation and species richness include the variation in local abiotic conditions such as light and soil nutrients (Ediriweera et al., 2008; Homeier et al., 2010).
There is a clear association between species distribution and soil properties in species rich forests (Sollins, 1998; John et al., 2007; Condit et al., 2013). This can be explained by the variation in tree growth and survival rates with soil type or with changing availability of soil nutrients (Zemunik et al., 2018). Thus, the composition and diversity of plant communities can change along gradients of soil resource availability (Ricklefs, 1977). If adult individual trees distribution patterns are at least in part explained by soil properties, seedlings should experience similar environmental filters that would allow them to successfully grow into reproductive individuals. Indeed, evidence suggests that seedling growth and survival and spatial distribution can be strongly influenced by soil nutrients (Holste et al., 2011; Andersen et al., 2014; Xia et al., 2019), including previous work in the forests studied here (Martini et al., 2020). However, to what extent seedling bank diversity is affected by soil nutrients is less known compared to more established patterns for adult trees.
Topographical features are an important component of mountain forest ecosystems, and species show some degree of specialization to favorable topographical microsites. For instance, topography was a major determinant of species composition in tropical and subtropical forests in Sri Lanka and China (Gunatilleke et al., 2006; Wang et al., 2009), and many tree seedlings showed significant habitat association to topography in a subtropical forest in China (Song et al., 2018). This species-habitat association is then reflected in gradients of species richness and diversity that change with topographical characteristics (Homeier et al., 2010). However, patterns are not consistent and can vastly depend on local flora and evolutionary history (Irl et al., 2015).
The availability of light is a critical requirement for plant growth and survival (Kobe, 1999; Beckage and Clark, 2003). Similar to soil conditions and topography, increasing light heterogeneity can increase species diversity, for example through gap dynamics generated by falling trees (Hubbell et al., 1999). Light is especially important at the earlier life stages, when individual seedlings strongly rely on external resources for their growth and survival and unfavorable conditions can lead to increased mortality (Kobe, 1999) or could filter species sensitive to unsuitable light conditions (Goodale et al., 2012; Song et al., 2021b). Further, greater light availability could allow the coexistence of tree seedlings from different ecological groups resulting in high species diversity (Song et al., 2018).
In this study, we investigated the relationship between several abiotic factors and seedling community characteristics, measured as seedling species composition, abundance, species richness, and diversity. We decided to study seedlings because they represent a critical bottleneck in plant recruitment and understanding their regeneration dynamics in relation to their environment is important to better comprehend forest community structure (Grubb, 1977; Queenborough et al., 2007). Further, recent studies in this region provided initial evidence on the important role of environmental filtering in shaping seedling emergence and tree diversity in these forests (Castillo-Díaz et al., 2021; Shi et al., 2021). Using data from four subtropical forests distributed along an elevation gradient of 1500 m, our goal was to elucidate the main abiotic drivers that determine seedling bank composition, abundance, and diversity, by investigating both direct and indirect relationships. We expected seedling communities of the four forests to show high dissimilarity, and that elevation and soil nutrients would drive the variation in community composition (hypothesis 1). We hypothesized that more diverse seedling banks will be found at lower elevation and in sites with higher light availability, where we also expected greater seedling abundance due to greater abundance of pioneer species. We also expected that local soil conditions would play a role in shaping seedling communities’ diversity (hypothesis 2). Finally, we expected to find elevation and local topographic conditions to indirectly influence seedling banks characteristics by affecting soil conditions (hypothesis 3).
Materials and Methods
Study Sites
We conducted this study in four natural forests in Guangxi Zhuang Autonomous Region in south China. We used a network of 1-ha plots established for monitoring long-term forest dynamics and distributed among four National Nature Reserves (Supplementary Figure 1): (1) Cenwanglaoshan (24°21′ N, 106°27′ E) is classified as a deciduous broad-leaf mixed forests, with mean annual temperature (MAT) of 14°C and total annual precipitation (TAP) of 1857 mm; (2) Dayaoshan (23°52′ N, 110°01′ E), is defined as a broadleaf evergreen and broadleaf evergreen monsoon forest with MAT of 17°C and TAP of 1824 mm; (3) Mulun (25°07′ N, 107°54′ E), is a subtropical mixed evergreen deciduous broadleaf forest located in a karst region al low elevation, and has a MAT of 19°C and a TAP of 1500 mm; (4) Huaping (25°36′ N, 109°50′ E), is the northernmost site and presents a deciduous broad-leaf mixed forest with MAT of 13°C and TAP of 2100 mm. All plots were placed in areas containing intact forest cover and minimum anthropogenic disturbance. We selected 13 one-ha plots located within these four forest sites, representing a broad elevation gradient of approximately 1500 m. Cenwanglaoshan included five 1-ha plots positioned at 1400, 1500, 1550, 1750, and 1850 m asl, Dayaoshan had four 1-ha plots found at 500, 650 1200, and 1300 m asl, while for Mulun and Huaping we had two 1-ha plots in each forest, located at 400 and 650 m asl and 820 and 900 m asl, respectively.
Data Collection
Surrounding each 1-ha plot we set up eight census stations consisting of a central seed trap and three 1-m2 seedling quadrats. Each station was located 2 m outside the perimeter of the plot, at each corner and in the middle of each side (Supplementary Figure 2). Thus, our study counted 312 seedling quadrats (13 1-ha plots × eight census stations per plot × three seedling quadrats per census station). Within each 1-m2 quadrat, we tagged all tree and shrub seedlings at the beginning of the study in November 2017 and monitored the seedling dynamics for the following 2 years, until November 2019. We recorded all free-standing woody plants ≤ 50 cm in height at the first census (defined as seedlings), and then recorded all new recruits for 14 total censuses over the 2-year period. For the first 1.5 year we visited the plots at monthly or bimonthly intervals, and we conducted a final visit 6 months thereafter. When possible, we collected voucher specimens of all species from individuals found in the vicinity of the monitored seedling quadrats and we prepared herbarium specimens that we used for identification by taxonomists from the College of Forestry of Guangxi University and the Guilin Institute of Botany. Additionally, we took digital photographs of all seedlings, which were used for the morpho-species classification of non-identified individuals (9% of the individuals belonging to the rarest species).
We measured several abiotic variables that are known to drive plant species distribution and community composition. For analysis of soil nutrients, we collected four samples outside the perimeter of each seedling quadrat between September and October 2017 using a soil core with a 5-cm-diameter and 10-cm-depth. We removed the litter before sampling, and the samples were mixed and stored together in labeled bags. When we could not sample the soil immediately next to the seedling quadrats due to stony or rocky terrain, we collected the samples in the closest nearest area within 2 m from the quadrat. If that was also not possible, we did not collect any samples. We air dried the samples in the field station from the collection date until transportation for further processing. At Guangxi University we removed roots, stones and other materials, hand broke larger pieces into smaller pieces and air dried them at room temperature for 1 month. When the samples were dried, we sieved them using two sieves of 0.25 and 2 mm mesh size. For each mesh size, we extracted 100 g of soil, and stored them in labeled plastic bags. The soil analyses were conducted at the Xishuangbanna Tropical Botanical Garden Central Laboratory (Yunnan, China) for the following soil nutrients: total nitrogen (N), total carbon (C), available phosphorus (P), available potassium (K), calcium (Ca), iron (Fe), magnesium (Mg), manganese (Mn), and sulfur (S), as well as soil pH. We measured soil pH in water using 2.5 units of water per unit of soil with a pH meter (PHS-3C, Shanghai Precision Scientific Instrument Co., Ltd, China). For total N, total C, available P, and available K we followed the same methods employed by Xia et al. (2015), and other nutrients (Ca, Fe, Mg, Mn, and S) were measured following the same method used for available P and K. We calculated the carbon to nitrogen ratio (C:N) from the values of C and N.
We measured canopy openness using a spherical densitometer and calculated the average from four measurements taken at the four cardinal directions. We took measurements in January 2018 and August 2018 to account for possible differences in seasonality due to the presence of deciduous species. One observer (F.M.) collected all data to avoid potential differences between observers. We calculated slope for each seedling quadrat using a clinometer and we extracted the elevation data at the census station level using a GPS.
Statistical Analyses
For all the analyses we used the R programming language (v. 4.03, R Core Team, 2021). To derive basic descriptive information at the forest level, we summarized the seedling data collected over the two-year period as a matrix where each row is a forest (n = 4) and each column is a species. Each observation represents the total number of individuals for each species in each plot monitored during the 2 years of investigation. From this matrix we calculated Shannon diversity index, Simpson diversity index, singletons (i.e., number of species with only one individual) and Jaccard dissimilarity index using the vegan and betapart packages (Baselga et al., 2020; Oksanen et al., 2020).
For the following analyses we summarized our data at the census station level (n = 104). To test our first hypothesis, we used non-metric multidimensional scaling (NMDS) on the abundance matrix to compare the species composition between sites using the function “metaMDS” (k = 2, trymax = 50). We removed one station because it did not have any seedlings over the entire study period. To test whether the seedling community composition was significantly different among the four forests, we conducted an analysis of similarities through the “anosim” function on a dissimilarity matrix generated from the “vegdist” function. Further, we evaluated the significance of our abiotic variables in affecting species composition. We performed a multivariate analysis of variance using the “adonis2” function and we assessed the marginal effect of all terms. We included all measured abiotic variables. We conducted all the above analyses with the package vegan and we used the package ggplot2 for visualization (Wickham, 2016; Oksanen et al., 2020).
We calculated species richness, Shannon diversity index, Simpson diversity index, singletons, Chao2 index, and seedling abundance for each census station as our response variables. Indices of species diversity, such as Shannon or Simpson indices, that emphasize evenness or dominance, respectively, are less biased by density than simple species counts per unit area. Although both indices emphasize the richness, having both adds to the more complex information of the diversity in ecosystems. The effect of the sample size is generally considered negligible for both of them. The Chao 2 index is a richness estimator based on incidence of sampled population and allows us to estimate the asymptotic richness of the seedling bank dataset accounting for additional species that remain undetected. The use of several species diversity indices is a common practice as each index can provide unique information, thus allowing greater insights on the studied communities (Morris et al., 2014).
To test our second hypothesis, we tested the relationships between measured community indices and environmental variables using (generalized) linear mixed models (GLMM) in the lme4 package (Bates et al., 2015). For each response our explanatory variables included elevation, canopy openness, slope, and soil nutrients. Because soil variables were highly correlated, we used the base “prcomp” function for principal component analysis (PCA) to summarize our 11 soil properties. This is a common method used to summarize variables that are correlated, especially for soil properties (Johnson et al., 2017; Umaña et al., 2017). The first three PCA axes loadings explained 77.7% of the variation and we used them as comprehensive variables to represent the combined soil nutrient properties. We used GLMM with negative binomial distribution for species richness, seedling abundance, and singletons as recommended compared to applying transformation on count data (Warton et al., 2016). For the other response variables (Shannon, Simpson, and Chao2 estimator) we used linear mixed models. We included a nested random effect in each model as “1| forest/plot”, where forest indicates one of the four forest sites, and plot indicate the 1-ha plot. We calculated the marginal and conditional R2 as recommended by Nakagawa et al. (2017) using the MuMIn package (Bartoń, 2020) as a measure of the amount of variance of the data explained by our models. For all models, we checked model fit by (1) plotting the residuals, (2) calculating the variance inflation factor (VIF) using the “vif” function in the car package (Fox and Weisberg, 2019), and (3) checking for the presence of spatial autocorrelation using the Moran’s I test with the ape package (Paradis and Schliep, 2019). The models performed well, all VIFs were < 2.5 (Supplementary Table 3) which we considered sufficiently low although slightly higher than what recommended by some authors (Zuur et al., 2010), and we did not detect any sign of spatial autocorrelation (all p > 0.05). We log transformed the response variable Chao2 to improve the assumptions of linear models.
To test whether elevation and slope indirectly influence seedling community characteristics by mediating soil conditions (hypothesis 3), we used piecewise structural equation modeling (SEM) using the piecewiseSEM package (Lefcheck, 2016), which allows to model both direct and indirect causal relationships. To improve the fit of the model to the data, we included circular relationships between the three PCA axes. This allowed us to develop a model that fitted the data well by Shipley’s test of directed separation (p > 0.05). We conducted one SEM for each response variable: species richness, seedling abundance, Shannon diversity index, Simpson diversity index, Chao2 index, and singletons.
Results
We counted 2552 individual seedlings belonging to 169 species or morpho-species over the 2 years of our study. Our sampling effort based on species accumulation was generally adequate (Supplementary Figure 3). Seedling density was higher in Cenwanglaoshan, mostly due to the masting event of Acer campbellii subs. sinense in 2018 that saw the recruitment of 698 individuals in a single census. However, most of them only persisted for a short time (Martini et al., 2019) and at the end of the study period seedling density was similar to the beginning of our monitoring study in all forests (Supplementary Figure 4). Dayaoshan was the most diverse community among these four forests (Shannon = 3.01, Simpson = 0.92; Supplementary Table 1), while Mulun was the least diverse (Shannon = 1.92, Simpson = 0.64; Supplementary Table 1). Beta diversity measured by the Jaccard’s dissimilarity index was high (mean = 0.91, range 0.82–0.97).
As we expected (hypothesis 1), the four forests show distinct seedling communities, whose composition was significantly different based on analysis of similarities (p < 0.001, R = 0.48; Figure 2). Specifically, Mulun presented a separate community compared to the other three forests. Mulun is characterized by soil with higher concentrations of base cations such as Ca, Mg, and Mn. Huaping is located in more acidic soils, while Cenwanglaoshan has soils with higher concentrations of P, K, and Fe. Dayaoshan has a more heterogeneous environment (Figure 1). According to our expectations (hypothesis 1), the most important variables characterizing the distinction of the four forest communities were soil properties (as pH, Fe, Mn) and elevation (p < 0.05; Figure 2 and Table 1). Totally, our explanatory variables explained 16.9% of the variation in community composition.
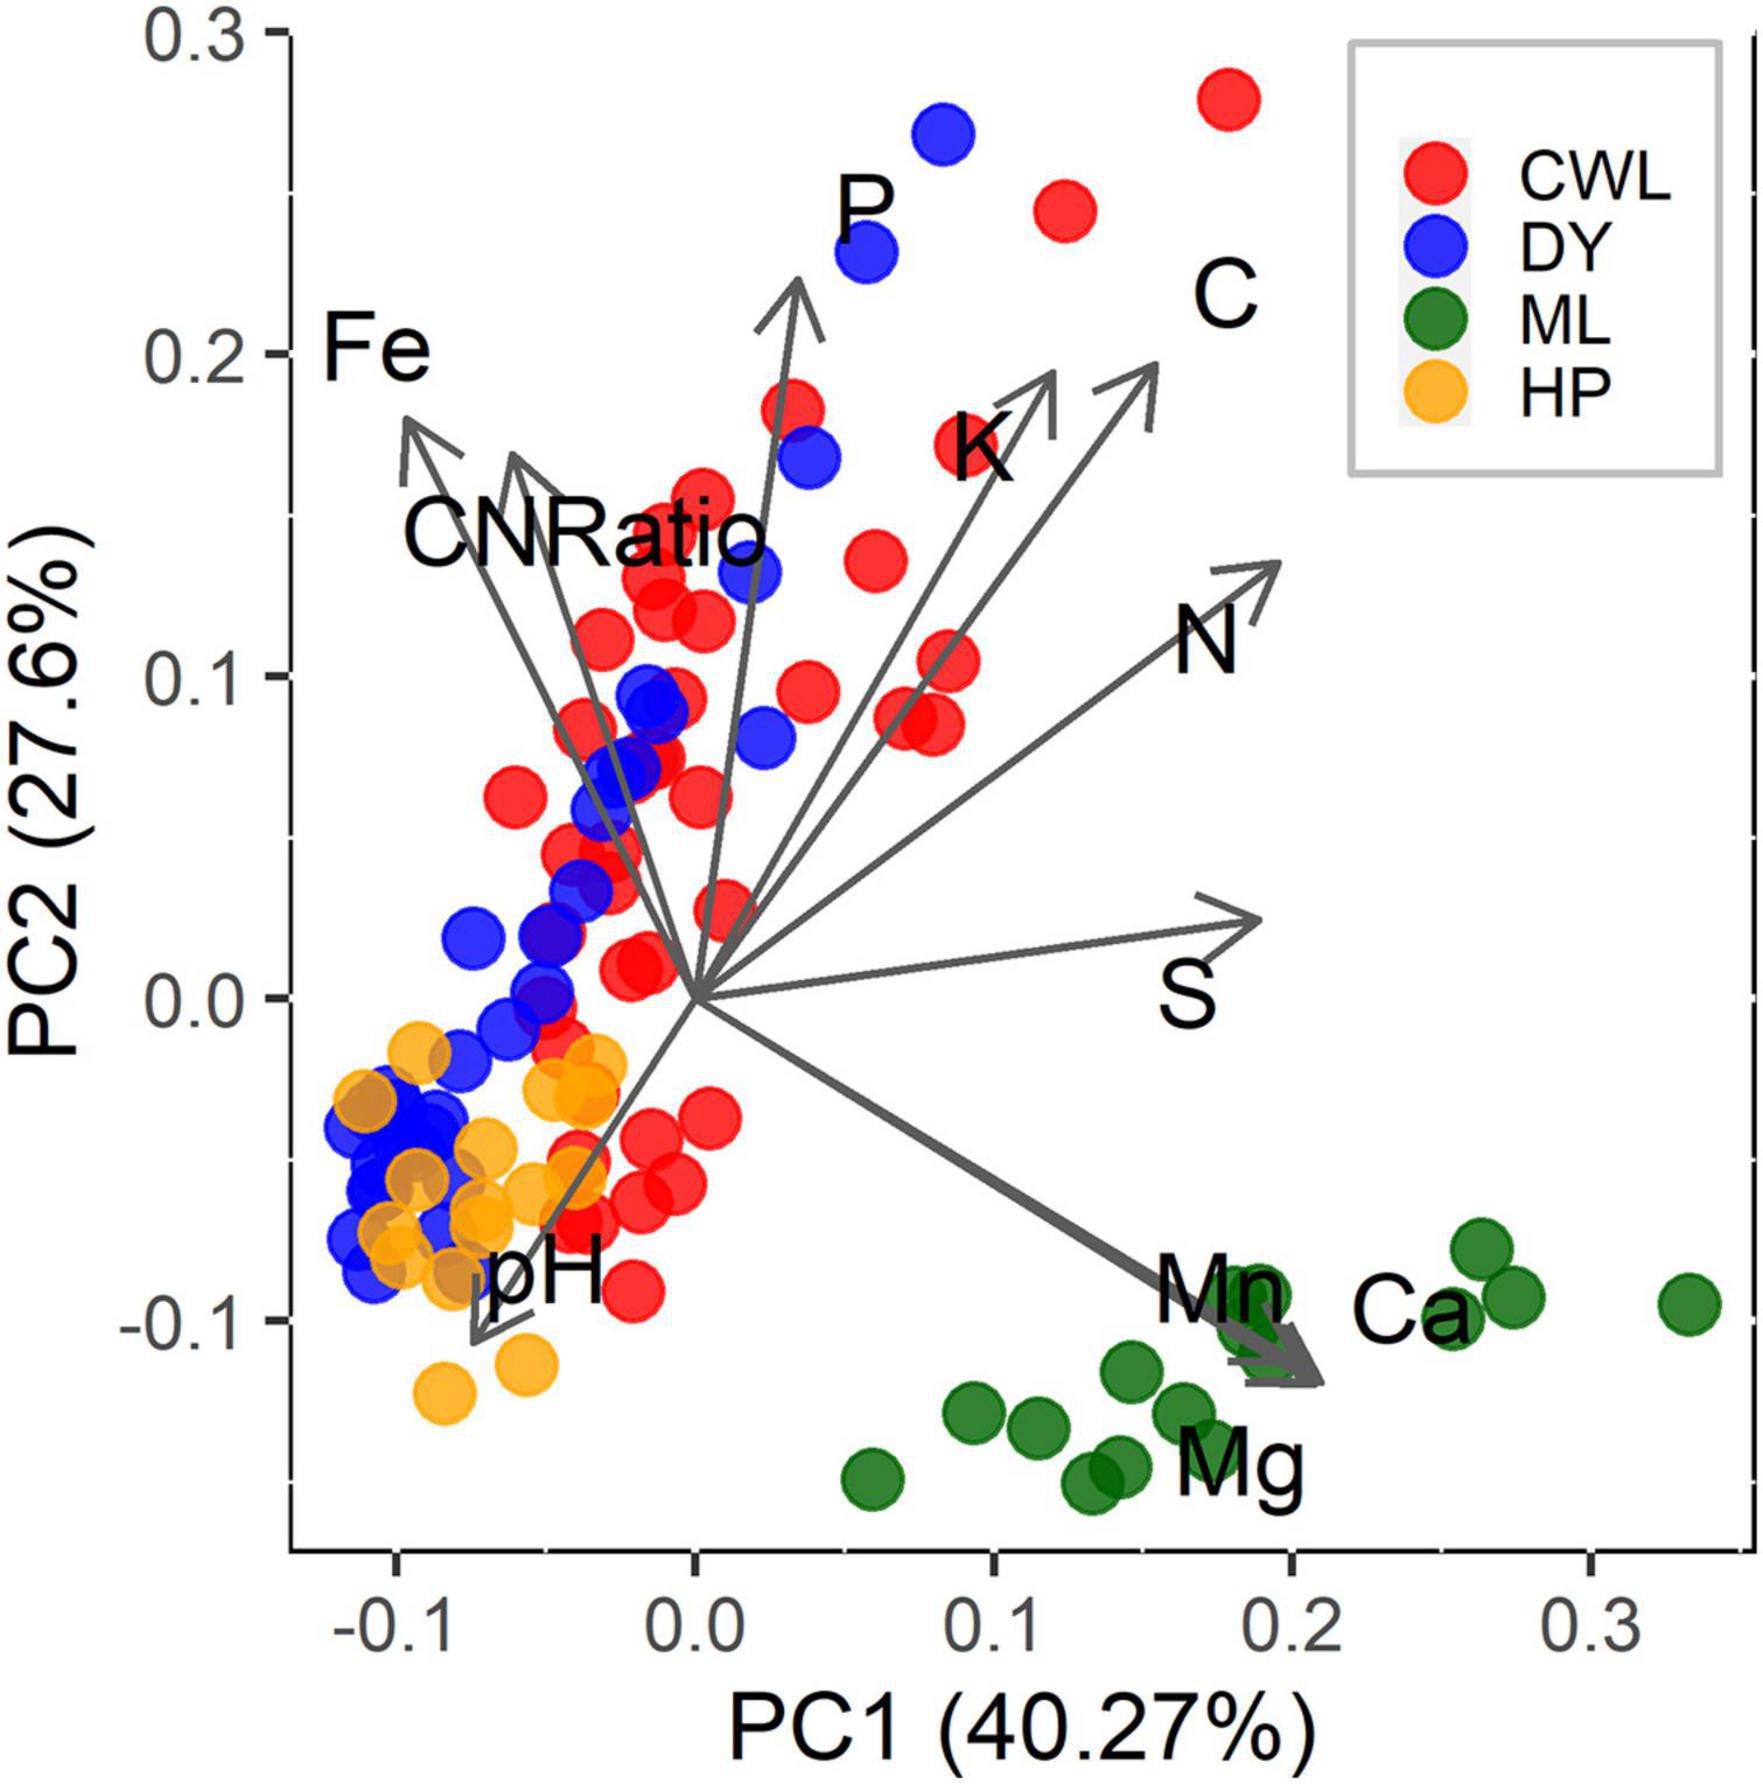
Figure 1. Principal component analysis (PCA) of the first two PCA axes of the soil properties in our study sites. Point with different colors represent census stations located in different forests: CWL = Cenwanglaoshan (red color), DY = Dayaoshan (blue color), HP = Huaping (orange color), ML = Mulun (green color).
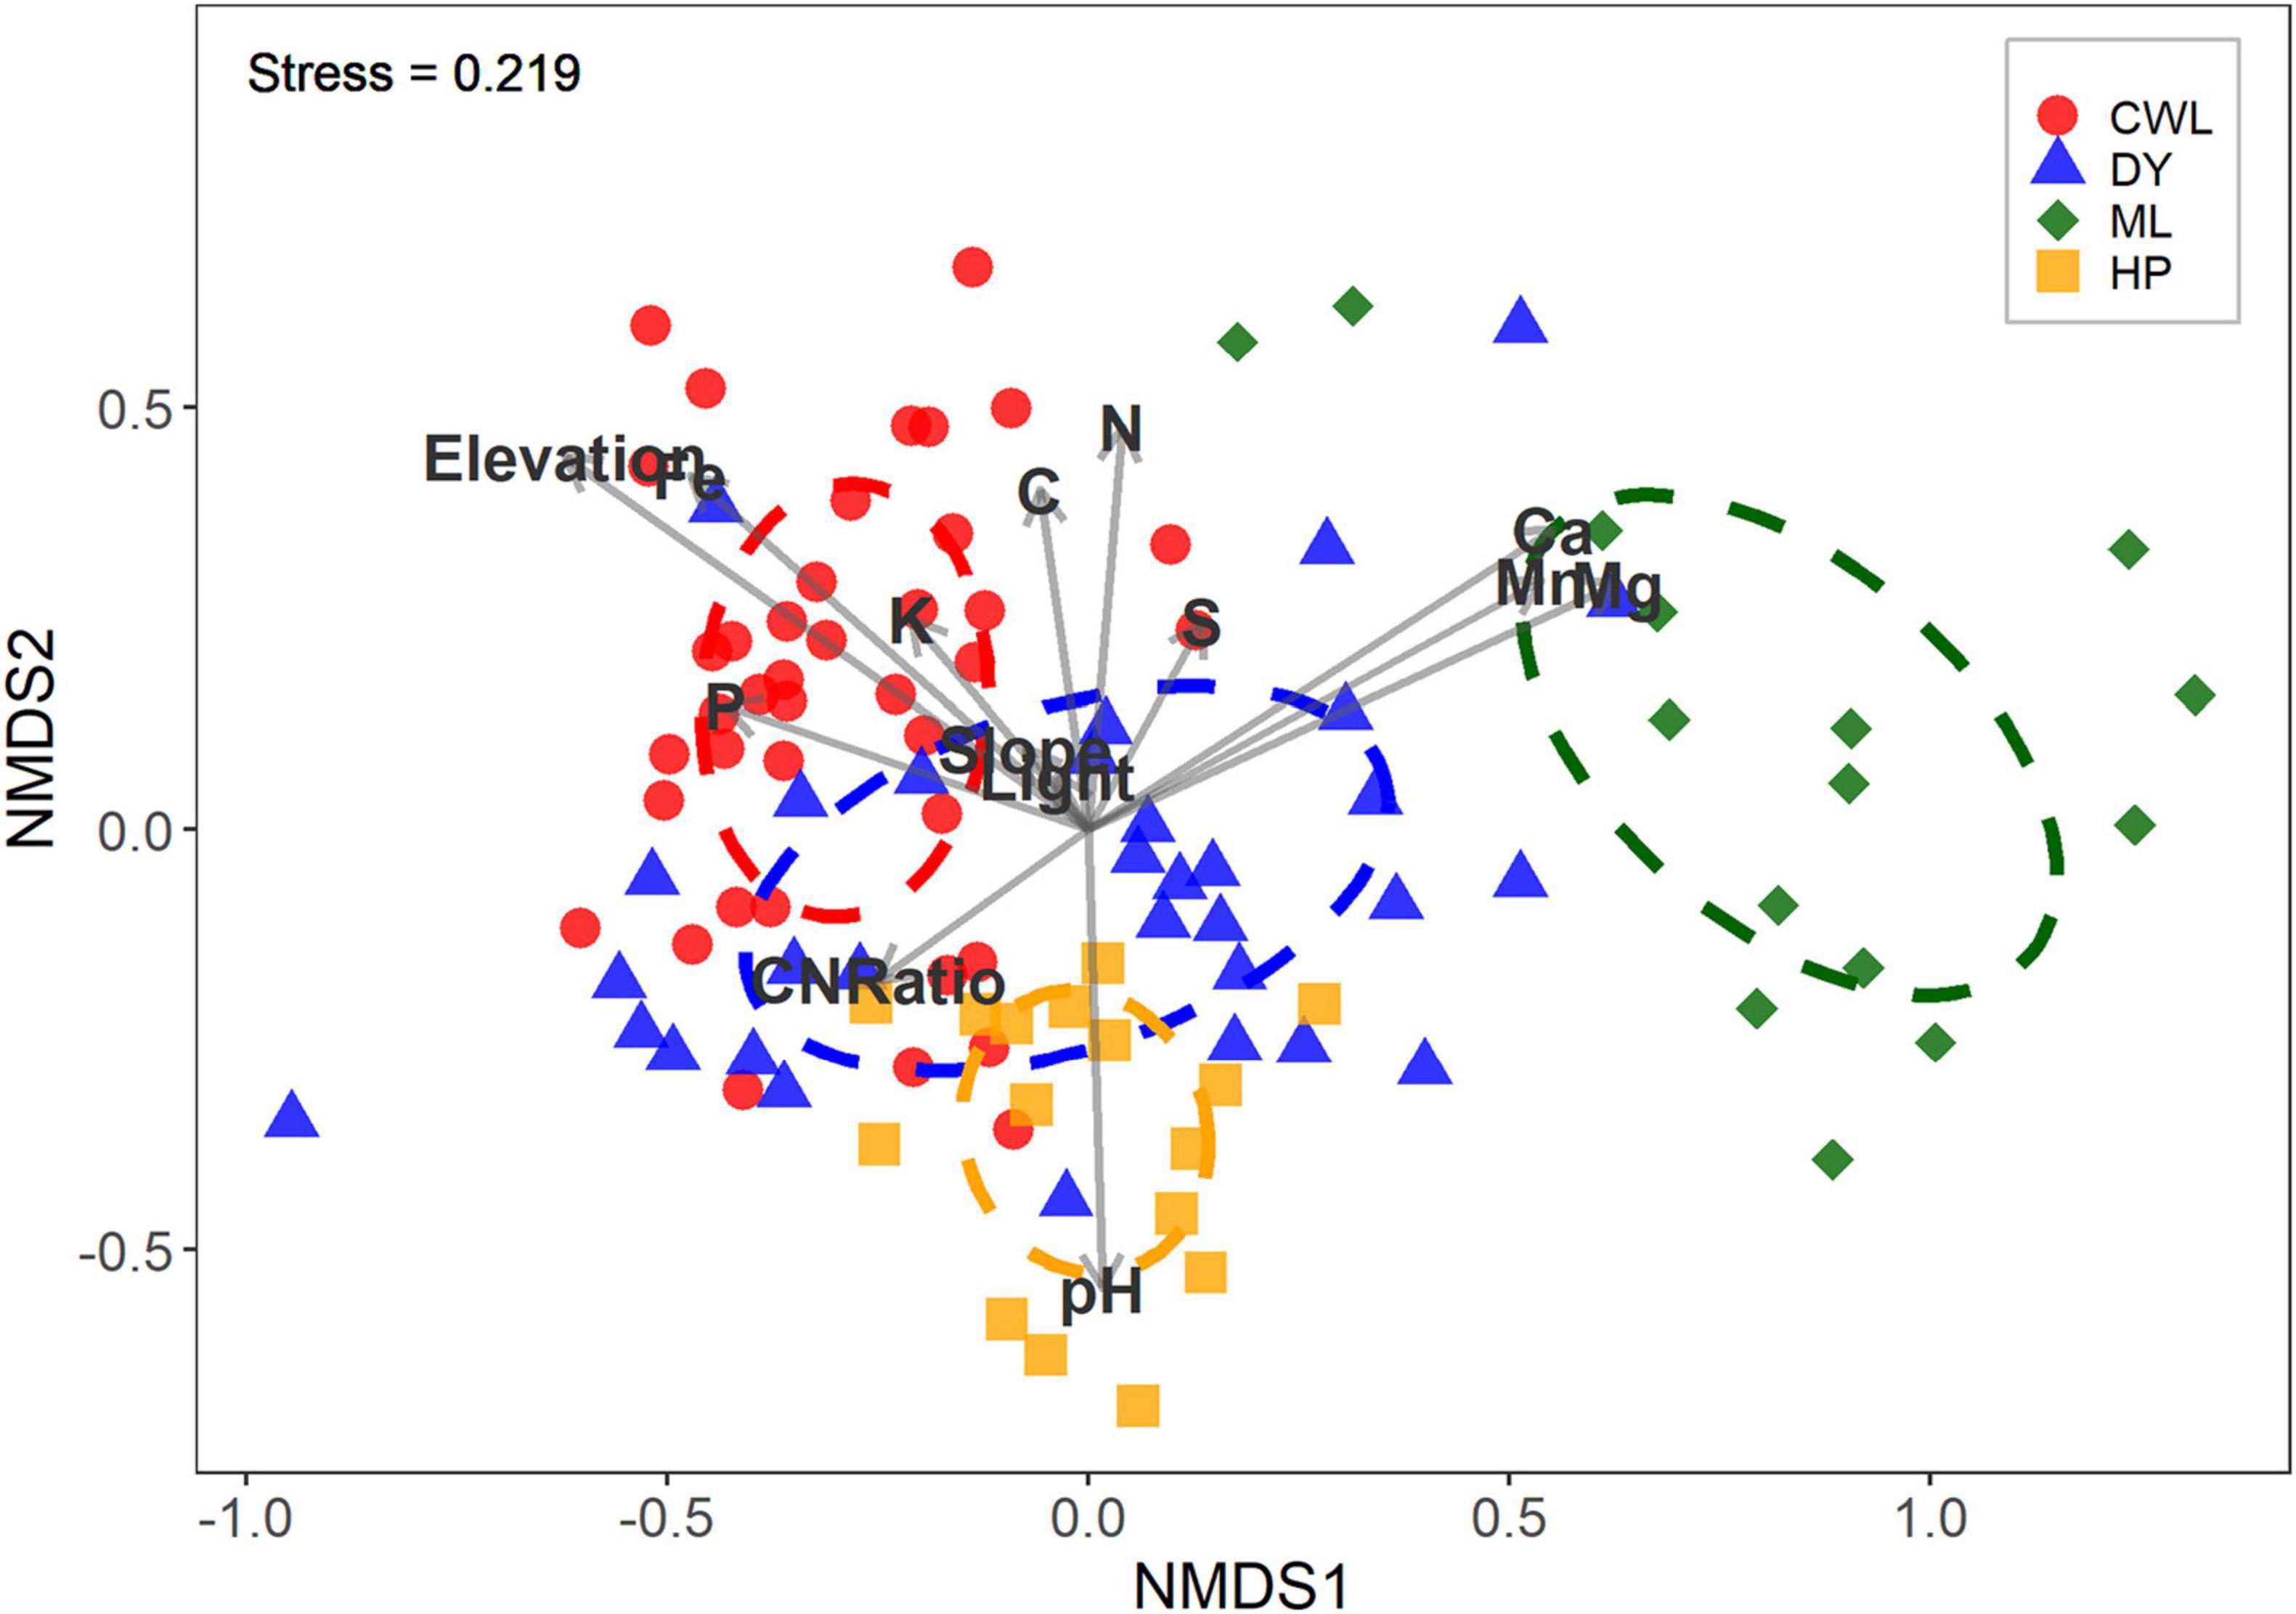
Figure 2. Non-metric multidimensional scaling (NMDS) of the four forests: CWL = Cenwanglaoshan, DY = Dayaoshan, ML = Mulun, HP = Huaping. The correlation between the environmental variables and the forests composition is also shown.
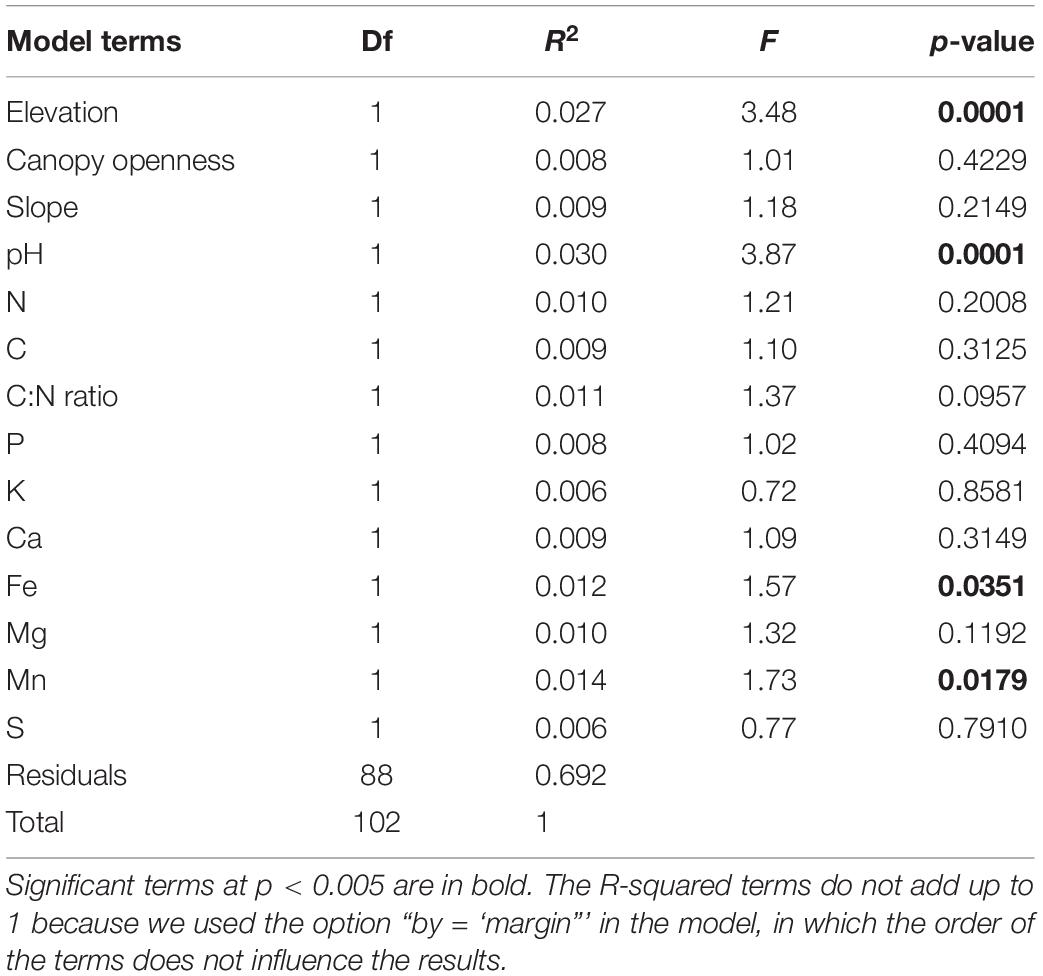
Table 1. Results of permutational ANOVA on the impact of the abiotic variables on seedling community composition.
Direct Effects of Environmental Variables
We found that α-diversity measured as Shannon and Simpson diversity indices was negatively related to elevation and positively related to slope. In other words, there was greater diversity at lower elevation and in steeper microsites (Figures 3C,D and Supplementary Table 3). The relationship with elevation confirms our expectation that more diverse seedling banks are found at lower elevations (hypothesis 2). However, seedling species richness and seedling abundance were not clearly explained by any of the abiotic variables that we measured here (Figures 3A,B and Supplementary Table 3). Contrary to our predictions (hypothesis 2), light availability did not directly influence any of the community attributes assessed here. Soil composition as soil PC1 was marginally significant for Simpson index (p = 0.066). The amount of variance explained by the fixed effects in our models was higher for Shannon and Simpson with a marginal R2 of 0.22 in both cases, but it was lower for richness and abundance with 0.06 and 0.18, respectively. The results for Chao2 richness estimator and singletons were also not significant (Supplementary Figure 5 and Supplementary Table 3).
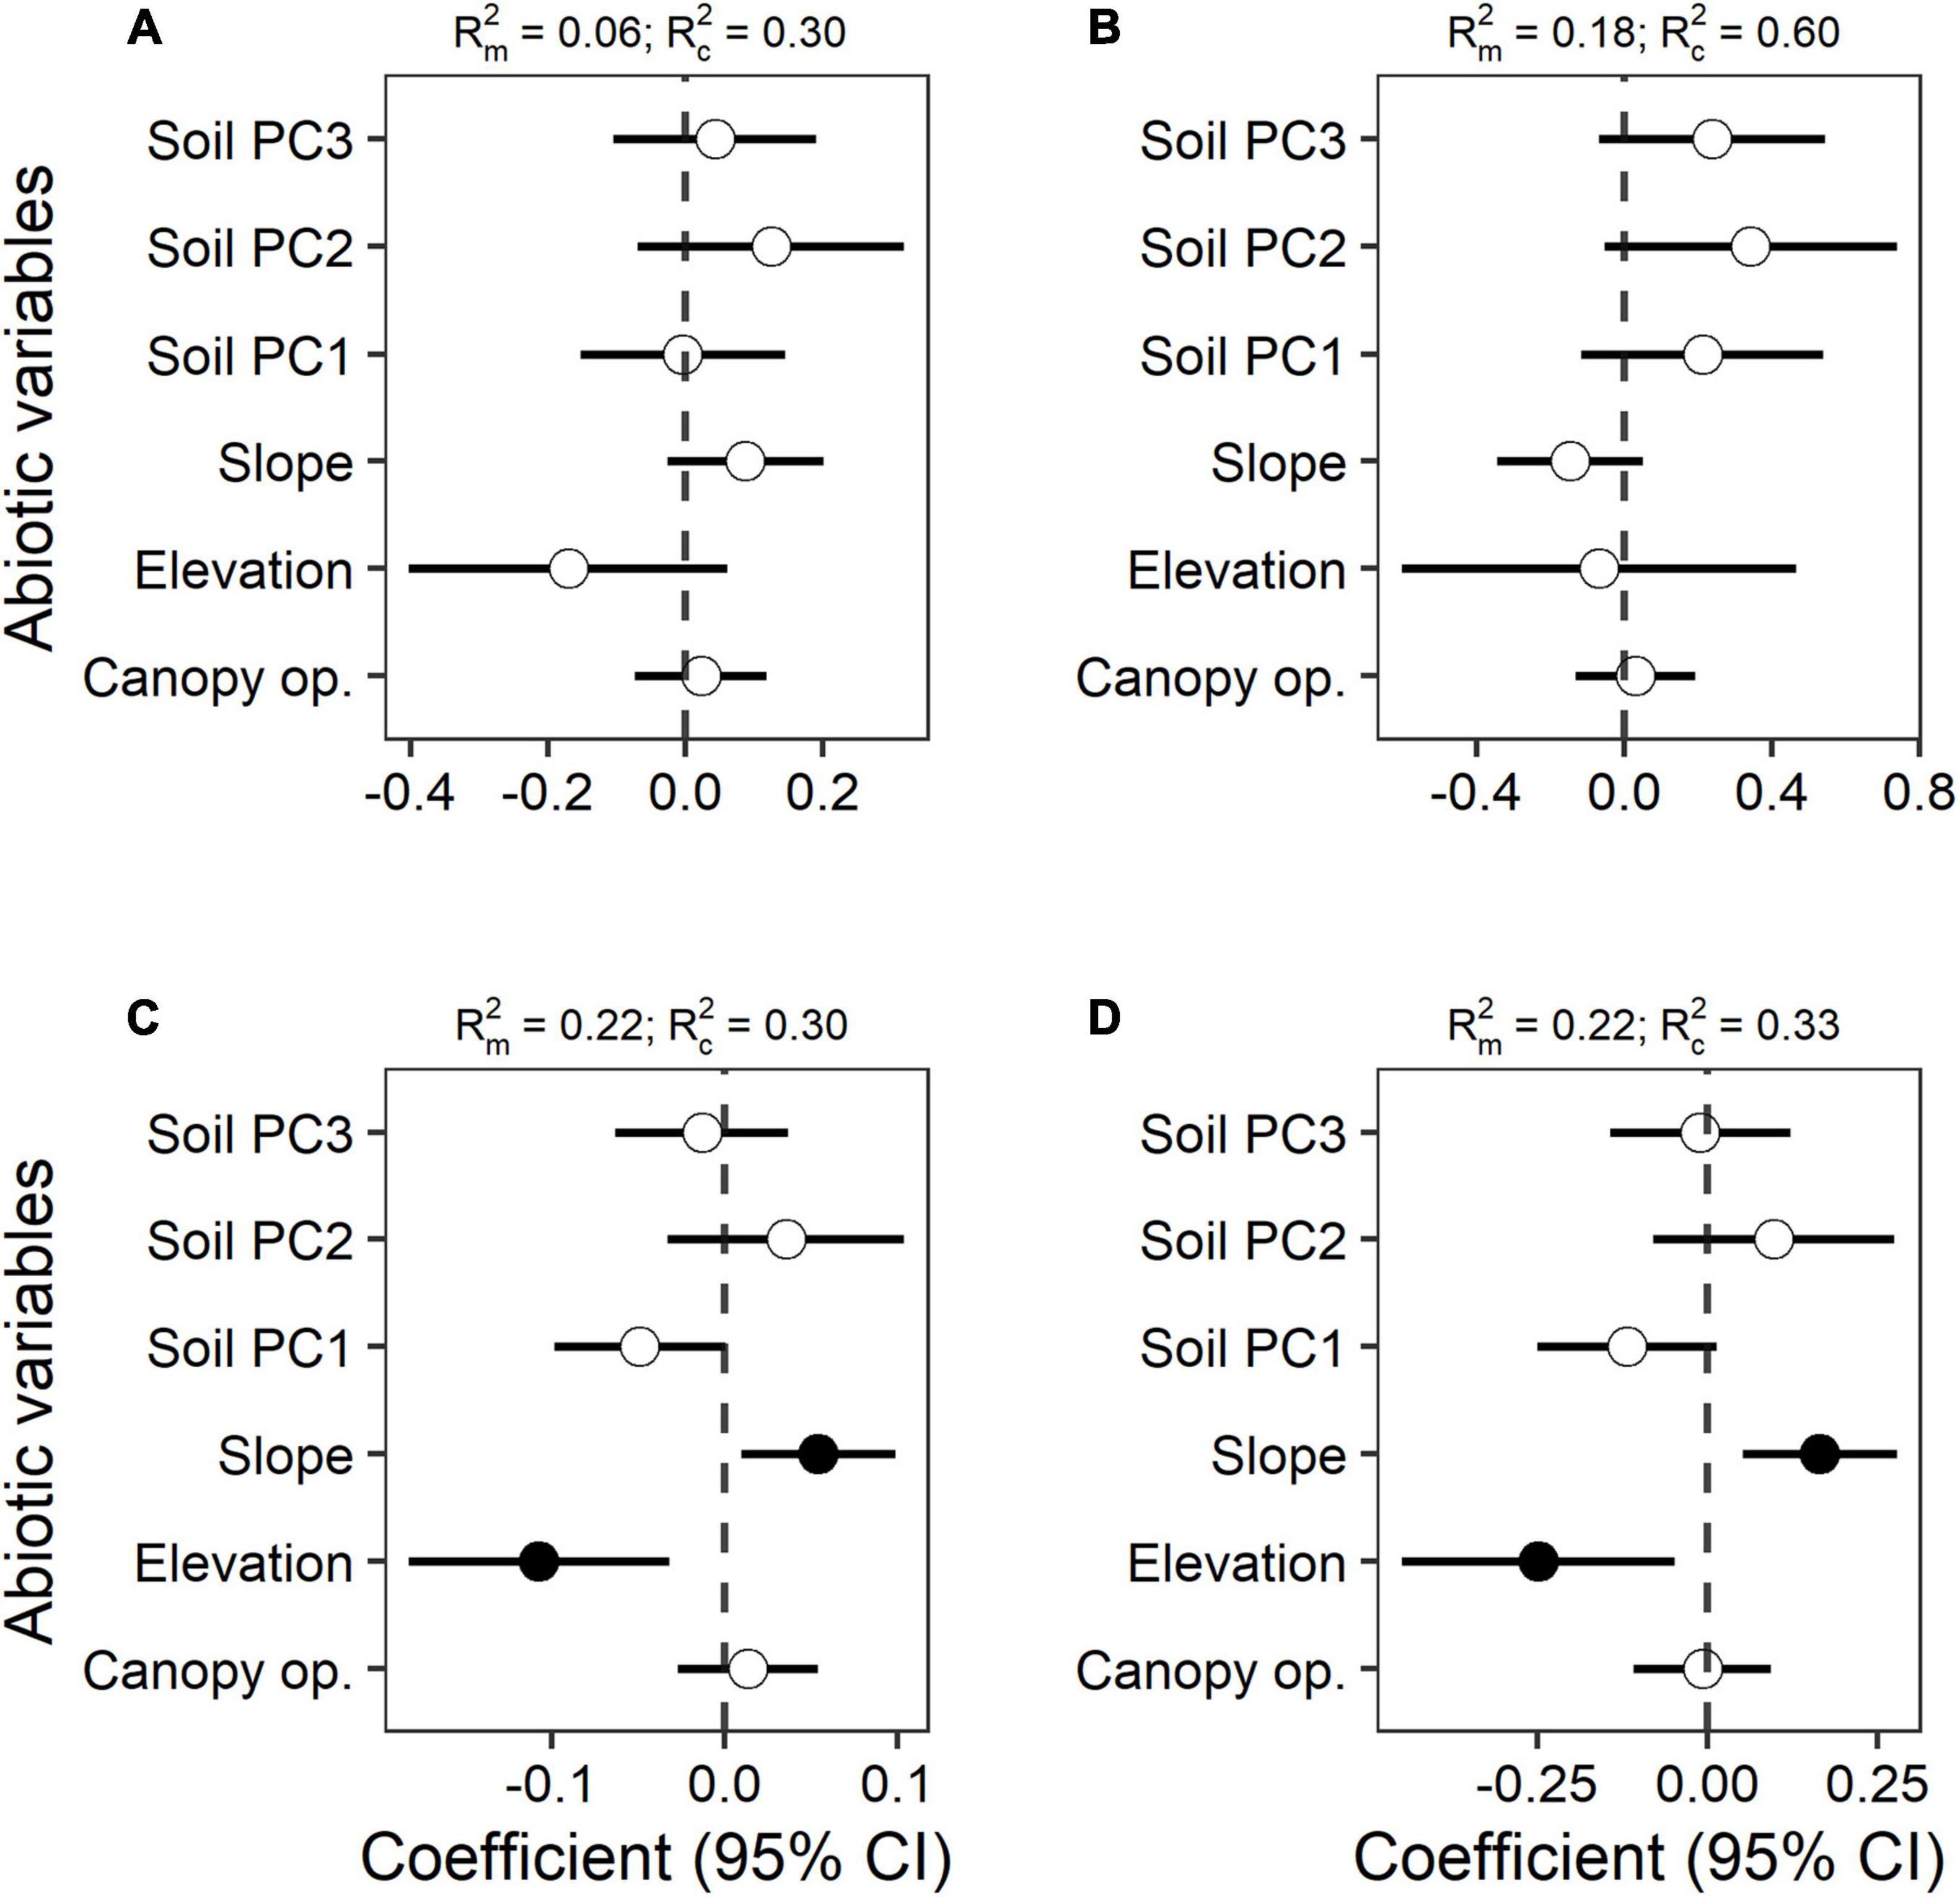
Figure 3. Effects of the measured abiotic variables on (A) species richness, (B) seedling abundance, (C) Simpson diversity index, and (D) Shannon diversity index. Significant relationships at p < 0.05 are shown with filled points, while empty points are for non-significant relationships (p > 0.05). Estimated full coefficients and 95% confidence intervals (CIs) are shown for each model. On top of each figure are the marginal R2 (R2m) and the conditional R2 (R2c).
Indirect Relationships Through Path Analysis
Results from the piecewise SEM mostly resembled those from the GLMM in terms of linear relationships (Figure 4 and Supplementary Table 4). However, here, the negative effect of soil PC1 on Simpson diversity index was significant (Figure 4C and Supplementary Table 4), which relates to the loadings from soil base cations explaining most of the first axis of the PCA (Figure 1). Additionally, soil PC1 was positively and significantly related to elevation, in accordance with our hypothesis of a potential indirect effect of elevation (hypothesis 3). Therefore, elevation not only has a negative effect on seedling diversity as measured by the Simpson index, but it also increased soil PC1 which in turn negatively affected species the response variable. The richness estimator Chao2 was directly and negatively related to elevation in the piecewise SEM, while the number of singletons was not significantly explained by any of the variables tested here (Supplementary Figures 6A,B and Supplementary Table 4).
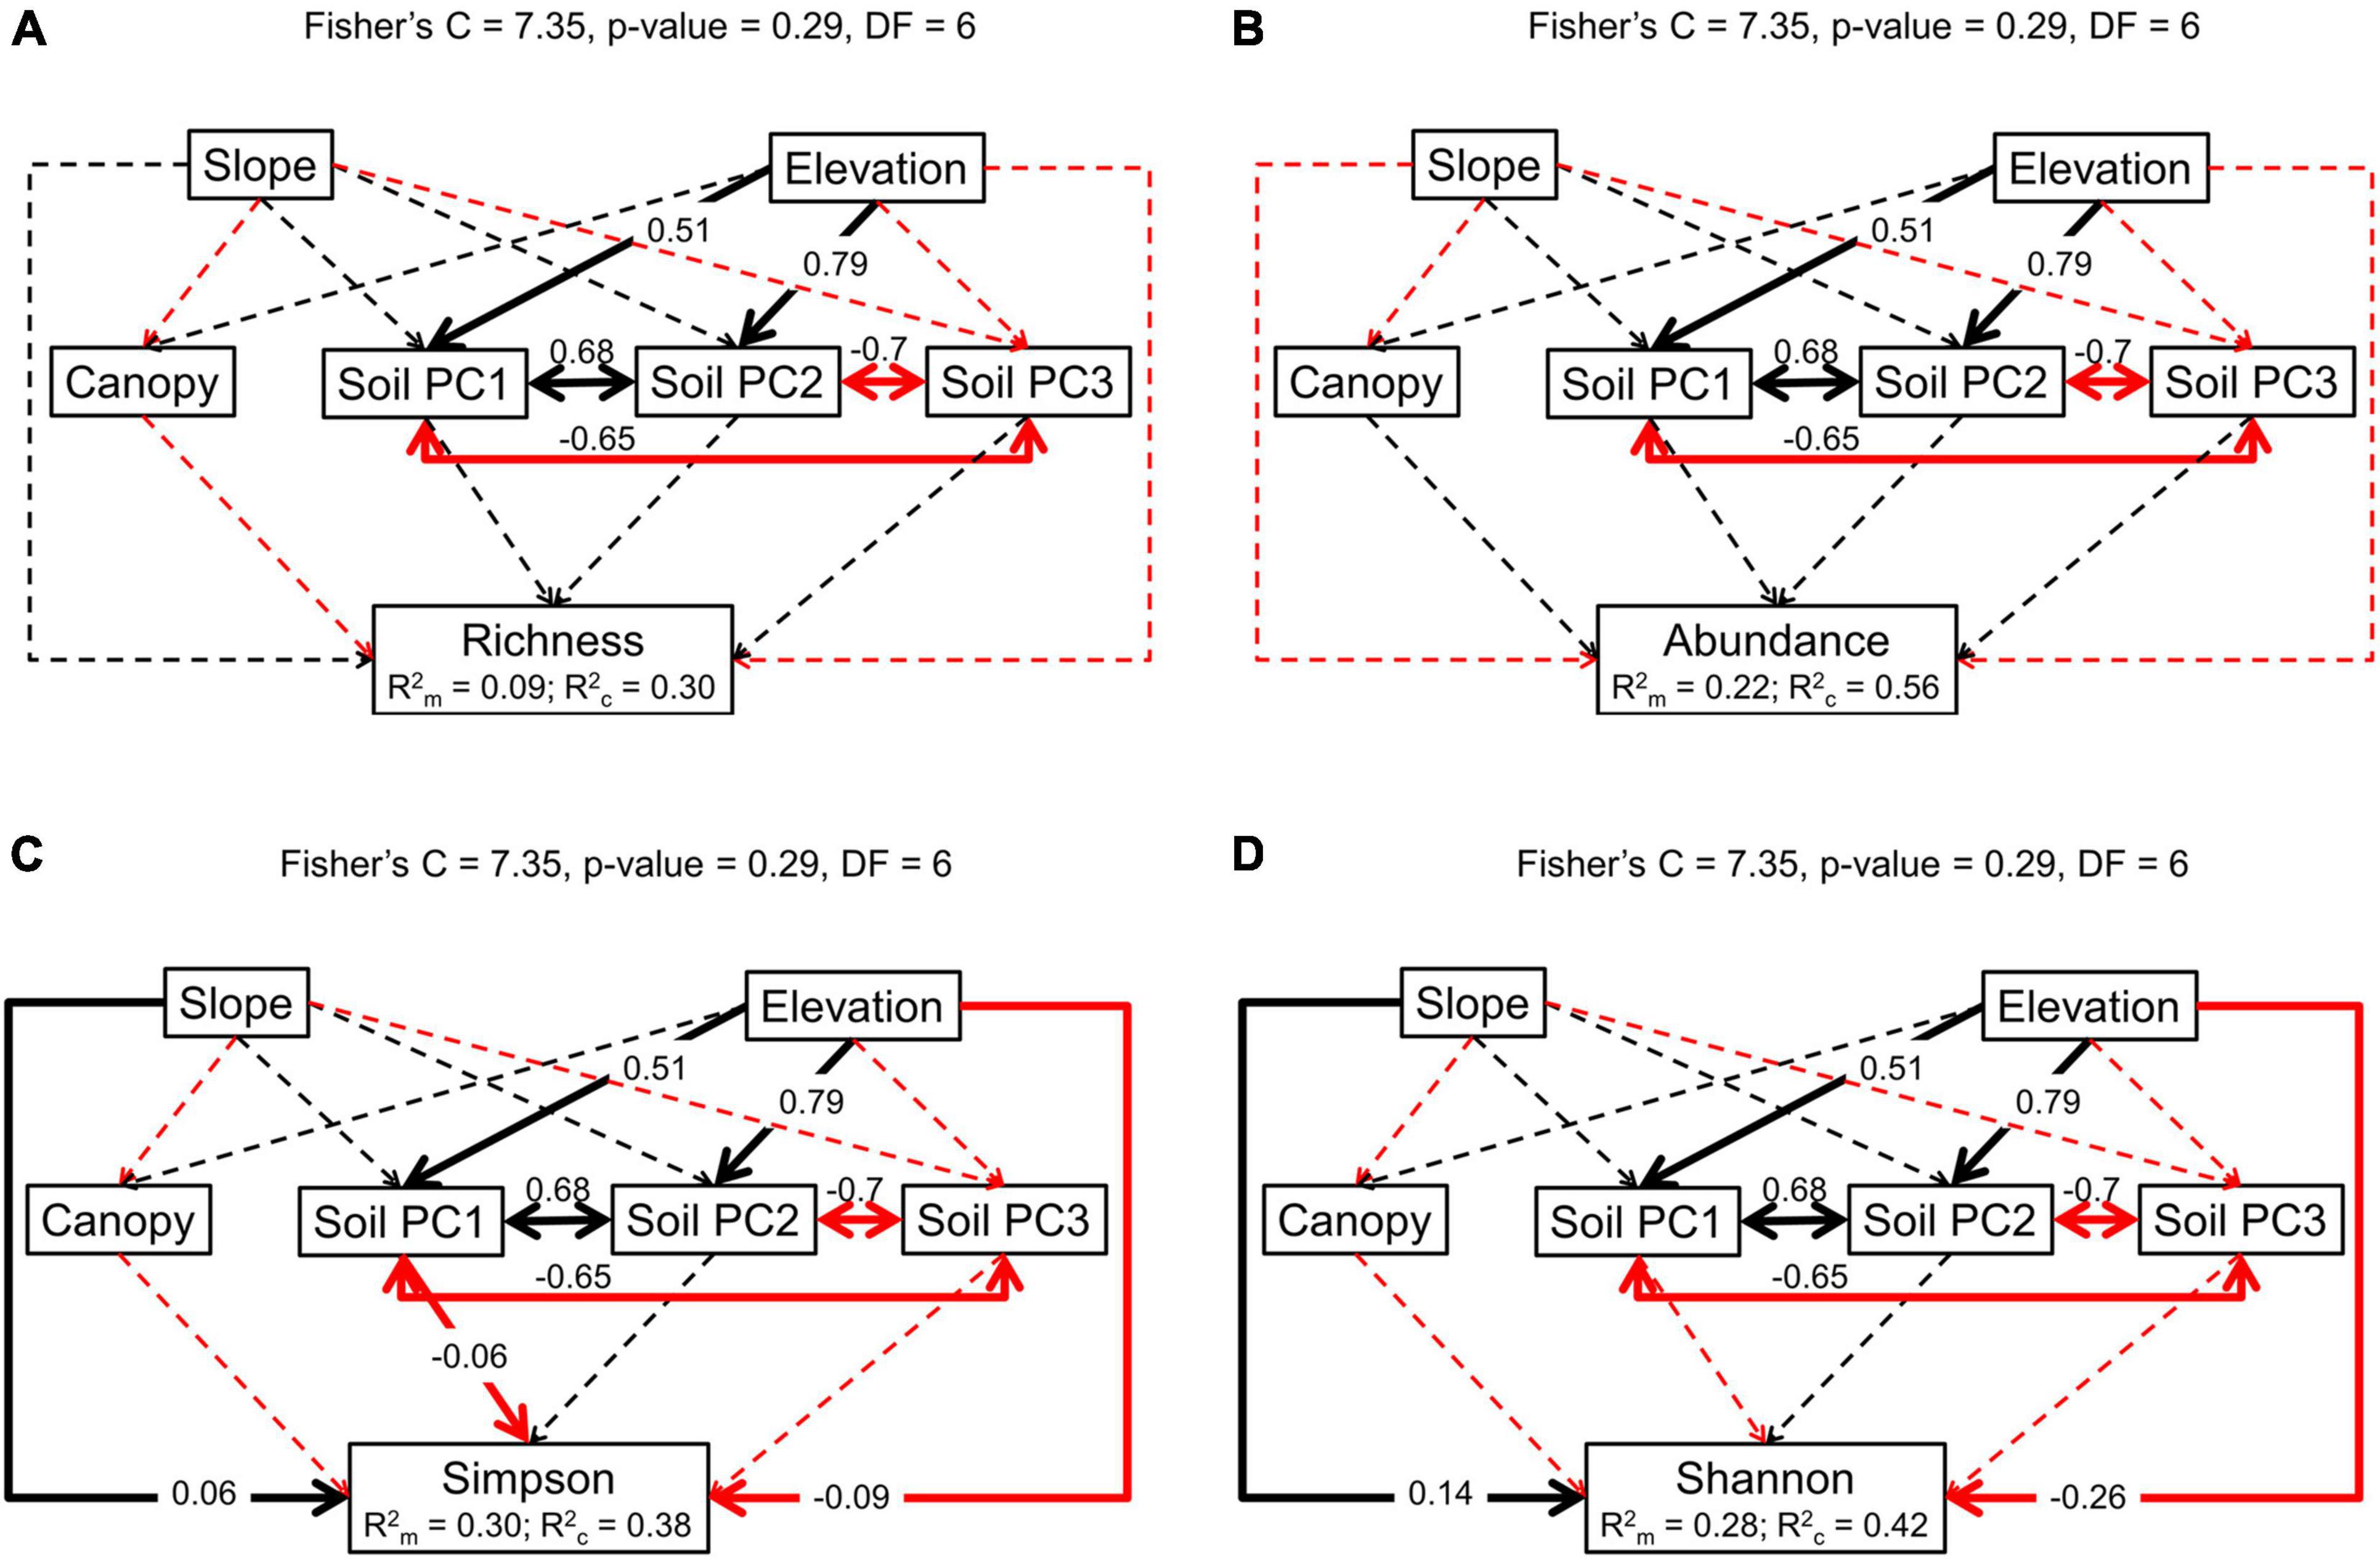
Figure 4. Piecewise structural equation modeling of (A) species richness, (B) seedling abundance, (C), Simpson diversity index, and (D) Shannon diversity index. Solid black lines represent positive significant relationship (p < 0.05) and solid red lines negative significant relationship (p < 0.05). Dashed lines indicate non-significant relationships (p > 0.05). The arrow indicates the direction of the relationship. The value of the significant relationships is over imposed on the arrow.
Discussion
Abiotic factors are important environmental filters that can influence the distribution of species and therefore the composition of plant communities. We analyzed the abiotic drivers of seedling banks composition and diversity in four subtropical forests in south China. We found that the species composition of the seedling banks was significantly different among the four forests, and this was mainly explained by differences in soil pH, Fe, Mn, and elevation. We also found that the diversity of the seedling community, measured as Simpson and Shannon diversity indices, decreased with elevation and increased with the slope of the microsites. Finally, we reported an indirect effect of elevation on Simpson’s diversity index via influencing soil nutrients.
The decreasing species diversity with elevation in our study support results from other studies of greater diversity at lower elevations (Vázquez and Givnish, 1998; Mohandass et al., 2017; Song et al., 2021a). In our study, we did not find any significant decrease of species richness in the seedling bank with increasing elevation, but the Shannon and Simpson diversity indices did decrease (Figure 3). A possible reason might be that we did not capture the elevation limit where species richness might start to decrease. However, the region that we studied only include few mountain peaks above little over 2000 m asl, and therefore our data offer a good representation of the elevation range of this region in south China. Our findings suggest that while the number of species might be fairly constant along the studied elevation gradient, the relative abundance of the species in the community might shift toward communities where a limited number of species dominates.
Several studies reported an association between soil nutrients and species distribution (John et al., 2007; Condit et al., 2013), including at the seedling level and at small spatial scale (Xia et al., 2019). We additionally report that among abiotic factors differences in soil conditions explain more of the variation in species community composition compared to light availability or topography (Figure 2 and Table 1). Specifically, the karst forest of Mulun presents a much more distinct community, as it would be expected given the peculiar landscape features and species adaptations to this environment (Geekiyanage et al., 2019). Greater beta-diversity between karst and non-karst adult tree communities compared to non-karst forests was also recently reported in the same region (Shi et al., 2021). Variation in soil nutrients availability has also been linked to gradients of species richness and diversity in different forest ecosystems (Huston, 1980; Cornwell and Grubb, 2003; Nadeau and Sullivan, 2015). However, we found only weak support for these relationships in our data. The only hint was given by the structural equation model with Simpson diversity index as the response variable, where soil PC1 showed a negative effect (Figure 4C). Soil PC1was mostly driven by soil S, and in part by soil N, Mn, Mg, and Ca (Figure 1). This result suggests that greater availability of these nutrients is reflected in lower diversity, and it was explained by the greater concentration of Mg, Mn, and Ca in Mulun, which is also the site with the lower diversity (Supplementary Table 1). However, studies that related multiple soil nutrients to species diversity are scarce, and results are likely to be highly site-dependent (Huston, 1980; Sollins, 1998). In addition, it is not only resource quantity that influence species diversity, but also the heterogeneity of resource availability at small spatial scales (Bartels and Chen, 2010; Homeier et al., 2010). Our study brings some support to the role of soil nutrients as drivers of species diversity but not as much as drivers of species richness, and more studies are needed to better understand these relationships. This would be especially valuable given global widespread soil acidification, including in subtropical China, which has the potential to influence patterns of species composition and richness (Azevedo et al., 2013; Yu et al., 2020).
We found that seedling diversity increased with increasing slope, providing additional evidence to the role of topographic variables in shaping forest communities (Wang et al., 2009, 2015). Most studies looking at the relationship between topography and species diversity focused on the distribution of adult trees and reported common species-habitat associations (Wang et al., 2009; Guo et al., 2016). However, there is less evidence for the seedling stage and results are mixed; some report no effects of slope position (e.g., Bentos et al., 2017). One reason might be that most studies model slope as a categorical variable, for example comparing valley vs. ridge positions (Homeier et al., 2010; Bentos et al., 2017), while here we treated slope as a continuous variable.
Light availability in forest understories is considered an important factor that favors species coexistence, especially through gap dynamics (Hubbell et al., 1999). Many studies reported that light influence seedling performance directly and indirectly through mediating biotic interactions (Montgomery and Chazdon, 2002; Comita et al., 2009; Goodale et al., 2014; Liu et al., 2015; Holík et al., 2021). However, whether greater light availability is also reflected in greater seedling abundance, species richness, or diversity is not as clear. We could imagine that microsites with more light (measured as canopy openness in this study) reaching the understory might show more abundant and diverse seedling communities due to greater recruitment of pioneer species that would join seedlings of shade-tolerant species growing before the opening. Yet, in our study we did not detect any effects of canopy openness neither on species composition nor on the diversity indices assessed. One reason might be that we did not specifically target gap and non-gap microsites, which are the main source of light variability in forests (Muscolo et al., 2014), and therefore the values of light availability were rather homogeneous (Supplementary Table 2). Further, canopy openness was similar at the forest level, which might explain why it did not contribute explain differences in species composition in our study. Yet, even minor differences of the amount of light reaching the forest floor can contribute to seedling dynamics (Montgomery and Chazdon, 2002), but this was not the case in our study sites where other factors emerged as more important.
We analyzed the abiotic drivers of seedling community composition and diversity and provided support for their variation along elevation gradients as well as with slope and soil nutrients, generally defined as environmental filters. We use this term in its broad meaning, although we acknowledge that we did not assess the effects of the abiotic factors on each species’ tolerance to a specific environment (environmental filtering sensu stricto in Kraft et al., 2015), but at a community level consideration. However, a pivotal role in shaping plant communities’ structure and diversity is also played by biotic interactions. Community composition and diversity at the seedling stage are linked to the composition of reproductive individuals found in the area investigated, both at local scale but also as the species pool at large spatial scales that can act as a species source (Zobel, 1997). Dispersal limitation was highlighted as a source of variation in beta diversity in this region (Shi et al., 2021). In addition, the strength of negative density dependence is considered a major reason for the higher diversity in tropical compared to temperate forests (Bagchi et al., 2014). Although less studied, changes in the strength of biotic interactions (e.g., competition vs. facilitation) between and within species along elevation gradients might also occur, driven by different levels of environmental stress (Pugnaire and Luque, 2001; Raath-Krüger et al., 2021). We were not able to test these processes in our study and we decided to focus on the effect of abiotic factors only. In this study, we specifically focused on the abiotic factors due to several significant challenges in obtaining relevant data. First of all, collecting a complete taxonomic data for the seedlings of this study system, where we are the first to systematically obtain seedling bank species information, to link to canopy diversity is very challenging and is an ongoing effort. Second, and lack of time sensitive methodology for accurately capture and measure the impacts from herbivores precluded us from gaining sufficient insights into the impact of biotic factors on these seedling banks. Third, one of the most important biotic factors for seedlings would be their association with soil fungal and bacterial biota, which requires significant resources to fully quantify. Hence, we did not feel that we had enough information to assess the biotic impacts on seedling bank diversity at this time. We recommend future studies to incorporate biotic data, including but not limited to community structure, species diversity of reproductive trees, herbivory and soil biota, in the assessment of factors that impact seedling bank formation and maintenance. Despite lack of biotic data being a limitation in our study, our findings are valuable to provide insights into the drivers of seedling banks diversity in subtropical forests.
Our results highlight the importance of both soil properties and elevation, which could see increasing variability in the coming decades due to changing climate leading to species migration and increasing soil acidification (Yu et al., 2020), on the diversity and composition of seedling banks. Whether and to what extent such changes will alter future forest composition and diversity, incorporating biotic factors needs to be investigated.
Data Availability Statement
The datasets presented in this study can be found in online repositories. The names of the repository/repositories and accession number(s) can be found below: https://doi.org/10.6084/m9.figshare.16592801.v1.
Author Contributions
FM and UG conceived the idea. FM and CZ collected the data. FM, CZ, XS, and UG analyzed the data. FM wrote the manuscript with contributions from all the authors. All authors contributed to the article and approved the submitted version.
Funding
This work was funded by National Natural Science Foundation of China (31660125) and the Guangxi Overseas High-level Talent “Hundred People Program” to UG, and by the Bagui Scholarship (C33600992001) to Kunfang Cao.
Conflict of Interest
The authors declare that the research was conducted in the absence of any commercial or financial relationships that could be construed as a potential conflict of interest.
Publisher’s Note
All claims expressed in this article are solely those of the authors and do not necessarily represent those of their affiliated organizations, or those of the publisher, the editors and the reviewers. Any product that may be evaluated in this article, or claim that may be made by its manufacturer, is not guaranteed or endorsed by the publisher.
Acknowledgments
We are thankful to Jiaolong Yan and many students for help in the field. We are grateful to the Xishuangbanna Tropical Botanical Garden Central Laboratory for conducting the soil analysis. We appreciate the Department of Forestry of Guangxi Zhuang Autonomous Region, and the administrations of the Cenwanglaoshan, Dayaoshan, Mulun, and Huaping National Nature Reserves for allowing us permission to access the field sites.
Supplementary Material
The Supplementary Material for this article can be found online at: https://www.frontiersin.org/articles/10.3389/fevo.2021.784036/full#supplementary-material
References
Andersen, K. M., Turner, B. L., and Dalling, J. W. (2014). Seedling performance trade-offs influencing habitat filtering along a soil nutrient gradient in a tropical forest. Ecology 95, 3399–3413. doi: 10.1890/13-1688.1
Azevedo, L. B., Van Zelm, R., Hendriks, A. J., Bobbink, R., and Huijbregts, M. A. J. (2013). Global assessment of the effects of terrestrial acidification on plant species richness. Environ. Pollut. 174, 10–15. doi: 10.1016/j.envpol.2012.11.001
Bagchi, R., Gallery, R. E., Gripenberg, S., Gurr, S. J., Narayan, L., Addis, C. E., et al. (2014). Pathogens and insect herbivores drive rainforest plant diversity and composition. Nature 506, 85–88. doi: 10.1038/nature12911
Baniya, C. B., Solhøy, T., Gauslaa, Y., and Palmer, M. W. (2010). The elevation gradient of lichen species richness in Nepal. Lichenologist 42, 83–96. doi: 10.1017/S0024282909008627
Bartels, S. F., and Chen, H. Y. H. (2010). Is understory plant species diversity driven by resource quantity or resource heterogeneity? Ecology 91, 1931–1938. doi: 10.1890/09-1376.1
Baselga, M. A., Orme, D., Villeger, S., Bortoli, J., De Leprieur, F., and Logez, M. (2020). Package ‘ betapart ’: Partitioning beta diversity into turnover and nestedness components. R package version 1.5.2.
Bässler, C., Cadotte, M. W., Beudert, B., Heibl, C., Blaschke, M., Bradtka, J. H., et al. (2016). Contrasting patterns of lichen functional diversity and species richness across an elevation gradient. Ecography 39, 689–698. doi: 10.1111/ecog.01789
Bates, D., Mächler, M., Bolker, B. M., and Walker, S. C. (2015). Fitting Linear Mixed-Effects Models Using lme4. J. Stat. Softw. 67, 1–48. doi: 10.18637/jss.v067.i01
Beckage, B., and Clark, S. (2003). Seedling survival and growth of three forest tree species: the role of spatial heterogeneity. Ecology 84, 1849–1861. doi: 10.1890/0012-96582003084[1849:SSAGOT]2.0.CO;2
Bentos, T. V., Nascimento, H. E. M., Vizcarra, M., dos, A., and Williamson, G. B. (2017). Effects of lightgaps and topography on Amazon secondary forest: Changes in species richness and community composition. For. Ecol. Manage 396, 124–131. doi: 10.1016/j.foreco.2017.04.018
Castillo-Díaz, D., Chen, H., Harrison, R. D., Wen, B., and Goodale, U. M. (2021). Seedling emergence and environmental filters determine Ficus recruitment in a subtropical landscape. For. Ecol. Manage 497, 119536. doi: 10.1016/j.foreco.2021.119536
Comita, L. S., Uriarte, M., Thompson, J., Jonckheere, I., Canham, C. D., and Zimmerman, J. K. (2009). Abiotic and biotic drivers of seedling survival in a hurricane-impacted tropical forest. J. Ecol. 97, 1346–1359. doi: 10.1111/j.1365-2745.2009.01551.x
Condit, R., Engelbrecht, B. M. J., Pino, D., Pérez, R., and Turner, B. L. (2013). Species distributions in response to individual soil nutrients and seasonal drought across a community of tropical trees. Proc. Natl. Acad. Sci. U S A 110, 5064–5068. doi: 10.1073/pnas.1218042110
Connell, J. H. (1971). “On the role of natural enemies in preventing competitive exclusion in some marine animals and in rain forest trees,” in Dynamics of Populations. PUDOC, eds P. J. D. Boer and G. R. Gradwell (The Netherlands: Wageningen), 298–312.
Cornwell, W. K., and Grubb, P. J. (2003). Regional and local patterns in plant species richness with respect to resource availability. Oikos 100, 417–428. doi: 10.1034/j.1600-0706.2003.11697.x
Ediriweera, S., Singhakumara, B. M. P., and Ashton, M. S. (2008). Variation in canopy structure, light and soil nutrition across elevation of a Sri Lankan tropical rain forest. For. Ecol. Manage 256, 1339–1349. doi: 10.1016/j.foreco.2008.06.035
Fox, J., and Weisberg, S. (2019). An {R} Companion to Applied Regression, Third. Thousand Oaks CA: Sage.
Geekiyanage, N., Kitajima, K., Goodale, U. M., and Cao, K. (2019). Plant ecology of tropical and subtropical karst ecosystems. Biotropica 51, 626–640. doi: 10.1111/btp.12696
Goodale, U. M., Ashton, M. S., Berlyn, G. P., Gregoire, T. G., Singhakumara, B. M. P., and Tennakoon, K. U. (2012). Disturbance and tropical pioneer species: Patterns of association across life history stages. For. Ecol. Manage 277, 54–66. doi: 10.1016/j.foreco.2012.04.020
Goodale, U. M., Berlyn, G. P., Gregoire, T. G., Tennakoon, K. U., and Ashton, M. S. (2014). Differences in survival and growth among tropical rain forest pioneer tree seedlings in relation to canopy openness and herbivory. Biotropica 46, 183–193. doi: 10.1111/btp.12088
Grubb, P. J. (1977). The maintenance of species-richness in plant communities: the importance of the regeneration niche. Biol. Rev. 52, 107–145. doi: 10.1111/j.1469-185X.1977.tb01347.x
Gunatilleke, C. V. S., Gunatilleke, I. A. U. N., Esufali, S., Harms, K. E., Ashton, P. M. S., Burslem, D. F. R. P., et al. (2006). Species-habitat associations in a Sri Lankan dipterocarp forest. J. Trop. Ecol. 22, 371–384. doi: 10.1017/S0266467406003282
Guo, Y., Wang, B., Mallik, A. U., Huang, F., Xiang, W., Ding, T., et al. (2016). Topographic species-habitat associations of tree species in a heterogeneous tropical karst seasonal rain forest, China. J. Plant Ecol. 2016, 1–11. doi: 10.1093/jpe/rtw057
Holík, J., Janík, D., and Adam, D. (2021). Light can modify density-dependent seedling mortality in a temperate forest. J. Veg. Sci. 32, 1–12. doi: 10.1111/jvs.12992
Holste, E. K., Kobe, R. K., and Vriesendorp, C. F. (2011). Seedling growth responses to soil resources in the understory of a wet tropical forest. Ecology 92, 1828–1838. doi: 10.1890/10-1697.1
Homeier, J., Breckle, S. W., Günter, S., Rollenbeck, R. T., and Leuschner, C. (2010). Tree diversity, forest structure and productivity along altitudinal and topographical gradients in a species-rich Ecuadorian montane rain forest. Biotropica 42, 140–148. doi: 10.1111/j.1744-7429.2009.00547.x
Hubbell, S. P., Foster, R. B., Harms, K. E., Condit, R., Wechsler, B., Wright, S. J., et al. (1999). Light-gap disturbances, recruitment limitation, and tree diversity in a Neotropical forest. Science 283, 554–557. doi: 10.1126/science.283.5401.554
Hülsmann, L., Chisholm, R. A., and Hartig, F. (2021). Is Variation in Conspecific Negative Density Dependence Driving Tree Diversity Patterns at Large Scales? Trends Ecol. Evol. 36, 151–163. doi: 10.1016/j.tree.2020.10.003
Huston, M. (1980). Soil Nutrients and Tree Species Richness in Costa Rican Forests. J. Biogeogr. 7, 147–157. doi: 10.2307/2844707
Irl, S. D. H., Harter, D. E. V., Steinbauer, M. J., Gallego Puyol, D., Fernández-Palacios, J. M., Jentsch, A., et al. (2015). Climate vs. topography - spatial patterns of plant species diversity and endemism on a high-elevation island. J. Ecol. 103, 1621–1633. doi: 10.1111/1365-2745.12463
Janzen, D. H. (1970). Herbivores and the number of tree species in tropical forests. Am. Nat. 140, 501–528. doi: 10.1086/282687
John, R., Dalling, J. W., Harms, K. E., Yavitt, J. B., Stallard, R. F., Mirabello, M., et al. (2007). Soil nutrients influence spatial distributions of tropical tree species. Proc. Natl. Acad. Sci. U S A 104, 864–869. doi: 10.1073/pnas.0604666104
Johnson, D. J., Condit, R., Hubbell, S. P., Comita, L. S., and Johnson, D. J. (2017). Abiotic niche partitioning and negative density dependence drive tree seedling survival in a tropical forest. Proc. R. Soc. B 284, 20172210. doi: 10.1098/rspb.2017.2210
Kobe, R. K. (1999). Light gradient partitioning among tropical tree species through differential seedling mortality and growth. Ecology 80, 187–201. doi: 10.1890/0012-96581999080[0187:LGPATT]2.0.CO;2
Kraft, N. J. B. B., Adler, P. B., Godoy, O., James, E. C., Fuller, S., and Levine, J. M. (2015). Community assembly, coexistence and the environmental filtering metaphor. Funct. Ecol. 29, 592–599. doi: 10.1111/1365-2435.12345
Laiolo, P., Pato, J., and Obeso, J. R. (2018). Ecological and evolutionary drivers of the elevational gradient of diversity. Ecol. Lett. 2018, 1022–1032. doi: 10.1111/ele.12967
LaManna, J. A., Mangan, S. A., and Myers, J. A. (2021). Conspecific negative density dependence and why its study should not be abandoned. Ecosphere 12:e03322. doi: 10.1002/ecs2.3322
Lefcheck, J. S. (2016). PiecewiseSEM: Piecewise structural equation modelling in R for ecology, evolution, and systematics. Methods Ecol. Evol. 7, 573–579. doi: 10.1111/2041-210X.12512
Liu, T.-Y., Lin, K.-C., Vadeboncoeur, M. A., Chen, M.-Z., Huang, M.-Y., and Lin, T.-C. (2015). Understorey plant community and light availability in conifer plantations and natural hardwood forests in Taiwan. Appl. Veg. Sci. 18, 591–602. doi: 10.1111/avsc.12178
Martini, F., Xia, S.-W., Zou, C., and Goodale, U. M. (2020). Seedling growth and survival responses to multiple soil properties in subtropical forests of south China. For. Ecol. Manage 474:118382. doi: 10.1016/j.foreco.2020.118382
Martini, F., Zou, C., and Goodale, U. M. (2019). Intrinsic biotic factors and microsite conditions drive seedling survival in a species with masting reproduction. Ecol. Evol. 9, 14261–14272. doi: 10.1002/ece3.5861
McCain, C. M., and Grytnes, J.-A. (2010). Elevational gradients in species richness. Encyclop. Life Sci. 2010, 1–10.
Mohandass, D., Campbell, M. J., Hughes, A. C., Mammides, C., and Davidar, P. (2017). The effect of altitude, patch size and disturbance on species richness and density of lianas in montane forest patches. Acta Oecologica 83, 1–14. doi: 10.1016/j.actao.2017.06.004
Montgomery, R. A., and Chazdon, R. L. (2002). Light gradient partitioning by tropical tree seedlings in the absence of canopy gaps. Oecologia 131, 165–174. doi: 10.1007/s00442-002-0872-1
Morris, E. K., Caruso, T., Fischer, M., Hancock, C., Obermaier, E., Prati, D., et al. (2014). Choosing and using diversity indices: insights for ecological applications from the German Biodiversity Exploratories. Ecol. Evol. 4, 3514–3524. doi: 10.1002/ece3.1155
Muscolo, A., Bagnato, S., Sidari, M., and Mercurio, R. (2014). A review of the roles of forest canopy gaps. J. For. Res. 25, 725–736. doi: 10.1007/s11676-014-0521-7
Myers, J. A., and Harms, K. E. (2009). Seed arrival, ecological filters, and plant species richness: A meta-analysis. Ecol. Lett. 12, 1250–1260. doi: 10.1111/j.1461-0248.2009.01373.x
Nadeau, M. B., and Sullivan, T. P. (2015). Relationships between Plant Biodiversity and Soil Fertility in a Mature Tropical Forest, Costa Rica. Int. J. For. Res. 2015:13. doi: 10.1155/2015/732946
Nakagawa, S., Johnson, P. C. D., and Schielzeth, H. (2017). The coefficient of determination R2 and intra-class correlation coefficient from generalized linear mixed-effects models revisited and expanded. J. R. Soc. Interface 14:20170213. doi: 10.1098/rsif.2017.0213
Oksanen, A. J., Blanchet, F. G., Friendly, M., Kindt, R., Legendre, P., Mcglinn, D., et al. (2020). vegan: Community Ecology Package. R package version 2.5-7.
Paradis, E., and Schliep, K. (2019). ape 5.0: an environment for modern phylogenetics and evolutionary analyses in R. Bioinformatics 35, 526–528. doi: 10.1093/bioinformatics/bty633
Pugnaire, F. I., and Luque, M. T. (2001). Changes in plant interactions along a gradient of environmental stress. Oikos 93, 42–49. doi: 10.1034/j.1600-0706.2001.930104.x
Queenborough, S. A., Burslem, D. F. R. P., Garwood, N. C., and Valencia, R. (2007). Neighbourhood and community interactions determine the spatial pattern of tropical tree seedling survival. Ecology 88, 2248–2258. doi: 10.1890/06-0737.1
Raath-Krüger, M. J., Schob, C., McGeoch, M. A., and Le Roux, P. C. (2021). Interspecific facilitation mediates the outcome of intraspecific interactions across an elevational gradient. Ecology 102, 1–11. doi: 10.1002/ecy.3200
Rahbek, C. (1995). The elevational gradient of species richness: a uniform pattern? Ecography 18, 200–205. doi: 10.1111/j.1600-0587.1995.tb00341.x
Ricklefs, R. E. (1977). Environmental Heterogeneity and Plant Species Diversity: A Hypothesis. Am. Nat. 111, 376–381. doi: 10.1086/283169
Shi, W., Wang, Y. Q., Xiang, W. S., Li, X. K., and Cao, K. F. (2021). Environmental filtering and dispersal limitation jointly shaped the taxonomic and phylogenetic beta diversity of natural forests in southern China. Ecol. Evol. 11, 8783–8794. doi: 10.1002/ece3.7711
Silvertown, J. (2004). Plant coexistence and the niche. Trends Ecol. Evol. 19, 605–611. doi: 10.1016/j.tree.2004.09.003
Sollins, P. (1998). Factors influencing species composition in tropical lowland rain forest: Does soil matter? Ecology 79, 23–30. doi: 10.1890/0012-96581998079[0023:FISCIT]2.0.CO;2
Song, X., Hogan, J. A., Lin, L., Wen, H., Cao, M., and Yang, J. (2018). Canopy openness and topographic habitat drive tree seedling recruitment after snow damage in an old-growth subtropical forest. For. Ecol. Manage 429, 493–502. doi: 10.1016/j.foreco.2018.07.038
Song, X., Lim, J. Y., Yang, J., and Luskin, M. S. (2020). When do Janzen – Connell effects matter? A phylogenetic meta-analysis of conspecific negative distance and density dependence experiments. Ecol. Lett. 24, 608–620. doi: 10.1111/ele.13665
Song, X., Cao, M., Li, J., Kitching, R. L., Nakamura, A., Laidlaw, M. J., et al. (2021a). Different environmental factors drive tree species diversity along elevation gradients in three climatic zones in Yunnan, southern China. Plant Divers. 2021:6. doi: 10.1016/j.pld.2021.04.006
Song, X., Yang, J., Cao, M., Lin, L., Sun, Z., Wen, H., et al. (2021b). Traits mediate a tradeoff in seedling growth response to light and conspecific density in a diverse subtropical forest. J. Ecol. 109, 703–713. doi: 10.1111/1365-2745.13497
Umaña, M. N., Zhang, C., Cao, M., Lin, L., and Swenson, N. G. (2017). A core-transient framework for trait-based community ecology: an example from a tropical tree seedling community. Ecol. Lett. 20, 619–628. doi: 10.1111/ele.12760
Vázquez, G. J. A., and Givnish, T. J. (1998). Altitudinal gradients in tropical forest composition, structure, and diversity in the Sierra de Manantlan. J. Ecol. 86, 999–1020. doi: 10.1046/j.1365-2745.1998.00325.x
Vetaas, O. R., and Grytnes, J. A. (2002). Distribution of vascular plant species richness and endemic richness along the Himalayan elevation gradient in Nepal. Glob. Ecol. Biogeogr. 11, 291–301. doi: 10.1046/j.1466-822X.2002.00297.x
Wang, B., Zhang, G., and Duan, J. (2015). Relationship between topography and the distribution of understory vegetation in a Pinus massoniana forest in Southern China. Int. Soil Water Conserv. Res. 3, 291–304. doi: 10.1016/j.iswcr.2015.10.002
Wang, Z., Ye, W., Cao, H., Huang, Z., Lian, J., Li, L., et al. (2009). Species – topography association in a species-rich subtropical forest of China. Basic Appl. Ecol. 10, 648–655. doi: 10.1016/j.baae.2009.03.002
Warton, D. I., Lyons, M., Stoklosa, J., and Ives, A. R. (2016). Three points to consider when choosing a LM or GLM test for count data. Methods Ecol. Evol. 7, 882–890. doi: 10.1111/2041-210X.12552
Xia, S.-W., Cao, M., Yang, X., Chen, J., and Goodale, U. M. (2019). Fine scale heterogeneity of soil properties causes seedling spatial niche separation in a tropical rainforest. Plant Soil. 438, 435–445. doi: 10.1007/s11104-019-04027-8
Xia, S.-W., Chen, J., Schaefer, D., and Detto, M. (2015). Scale-dependent soil macronutrient heterogeneity reveals effects of litterfall in a tropical rainforest. Plant Soil 391, 51–61. doi: 10.1007/s11104-015-2402-z
Yu, Z., Chen, H. Y. H., Searle, E. B., Sardans, J., Ciais, P., Peñuelas, J., et al. (2020). Whole soil acidification and base cation reduction across subtropical China. Geoderma 361:114107. doi: 10.1016/j.geoderma.2019.114107
Zemunik, G., Davies, S. J., and Turner, B. L. (2018). Soil drivers of local-scale tree growth in a lowland tropical forest. Ecology 99, 2844–2852. doi: 10.1002/ecy.2532
Zobel, M. (1997). The relative role of species pools in determining plant species richness: An alternative explanation of species coexistence? Trends Ecol. Evol. 12, 266–269. doi: 10.1016/S0169-5347(97)01096-3
Keywords: community assembly, elevation, environmental filtering, plant diversity, seedling dynamics, soil nutrients, topography
Citation: Martini F, Zou C, Song X and Goodale UM (2021) Abiotic Drivers of Seedling Bank Diversity in Subtropical Forests of Southern China. Front. Ecol. Evol. 9:784036. doi: 10.3389/fevo.2021.784036
Received: 27 September 2021; Accepted: 24 November 2021;
Published: 20 December 2021.
Edited by:
Zuoqiang Yuan, Institute of Applied Ecology, Chinese Academy of Sciences (CAS), ChinaReviewed by:
Yi Ding‘, Chinese Academy of Forestry, ChinaChitra Bahadur Baniya Tribhuvan University, Nepal
Copyright © 2021 Martini, Zou, Song and Goodale. This is an open-access article distributed under the terms of the Creative Commons Attribution License (CC BY). The use, distribution or reproduction in other forums is permitted, provided the original author(s) and the copyright owner(s) are credited and that the original publication in this journal is cited, in accordance with accepted academic practice. No use, distribution or reproduction is permitted which does not comply with these terms.
*Correspondence: Francesco Martini, ZnJhbm1hcnQxMkBob3RtYWlsLml0; Uromi Manage Goodale, dXJvbWkubWFuYWdlLmdvb2RhbGVAb3V0bG9vay5jb20=; dXJvbWkuZ29vZGFsZUBheWEueWFsZS5lZHU=
†Present address: Francesco Martini, Department of Forest Ecology, Faculty of Forestry and Wood Science, Czech University of Life Science, Prague, Czechia