 Yu-xuan Zheng1†
 Ying Wang1†Bo-ya Dai1Zheng Li2Qi-run Huo2
 Jian-xin Cui3Hao Liu3Xin-hai Li4
 Alice C. Hughes5
 Ai-bing Zhang1*
- 1College of Life Sciences, Capital Normal University, Beijing, China
- 2College of Information Engineering, Capital Normal University, Beijing, China
- 3Breeding Center of Natural Insect Enemies for Pests, Henan Institute of Science and Technology, Xinxiang, China
- 4Institute of Zoology, Chinese Academy of Sciences, Beijing, China
- 5Landscape Ecology Group, Center for Integrative Conservation, Xishuangbanna Tropical Botanical Garden, Chinese Academy of Sciences, Mengla, China
Understanding the traits related to species colonization and invasion, is a key question for both pest management and evolution. One of the key components is flight, which has been measured for a number of insect species through radar and tethered flight mill systems, but a general understanding of insect flight at a community level is lacking. In this study, we used flight mill experiments to quantify flight abilities of moth species, and simulation experiments to study which moths in mainland China have the potential for cross-island dispersal. We found that moths from superfamily Geometroidea (family Geometridae) have the weakest flight ability among the seven Lepidoptera superfamilies, which is characterized by the shortest longest single flight (LSF), the shortest time corresponding to the longest single flight (TLSF) (timecorrespondingtothelongestsingleflight), the lowest total distance flown (TDF), and the lowest average speed during the flight (VTDF). Surprisingly, the family Pyralidae (superfamily Pyraloidea) has the highest flight endurance of all 186 species of 12 families in this study, which is unexpected, given its small size and morphological traits yet it shows the longest LSF and TLSF. The comparison between species common to mainland and islands shows that flight distance (LSF) may be more important for species spread than flight speed. The results of mainland-island simulations show that when P(LSF>CD) (the proportion of individuals whose LSF is greater than the closest distance (CD) between mainland and island to the total number of individuals in the population) is less than 0.004, it is difficult for moth species to disperse to across islands without relying on external factors such as airflow. Over extended periods, with the immigration of species with strong flight abilities, islands are more likely to recruit species with stronger flight abilities.
Introduction
Insecta first evolved around 400 million years ago and was the first animal class to evolve the ability to fly over 325MYA (Panian and Wiltschko, 2004; Ross, 2017). It is also the taxa with the largest number of described species, currently estimated at around 5.5 million species (Stork, 2018). A major evolutionary advantage of flight is the ability to disperse, and flight is thought to have enabled rapid diversification within the group (Tihelka et al., 2021). Lepidoptera and Coleoptera are the two largest orders within the class Insecta (Stork, 2018; Zhuang et al., 2018). As well as high diversity, both Lepidoptera and Coleoptera have important ecological roles, for example, larvae and adults provide prey for various predators, such as birds and bats, and adults can be important pollinators for flowering plants. However, some species have negative impacts on agricultural production, for example, every year more than 40 billion dollars are expended on chemical pesticides to control lepidopteran pests. Even single species can have huge economic implications, for instance, diamondback moth (Plutella xylostella) control in Brassica crops alone costs approximately US$1.4 billion annually (Furlong et al., 2013; Chattopadhyay et al., 2017). A clearer understanding of flight ability or niche characters can be used to predict where potentially invasive species may appear in the future and used to help develop and apply preventative countermeasures (Hudgins et al., 2017; Menchetti et al., 2019). Consequently, a large number of studies were conducted on the dispersal and migration of insects through radar observation methods (Chapman et al., 2008a,b) and tethered flight mill systems (Hashiyama et al., 2013; Hoddle et al., 2015; Jones et al., 2016).
Flight mills are widely used to study the flight abilities of various insects. However most studies focus on the flight ability of a single species (Ávalos et al., 2014; Hoddle and Hoddle, 2016; Fu et al., 2017a,b; Lopez et al., 2017; Jyothi et al., 2021), and there are few studies, which provide descriptions of the flight ability of multiple species (Jones et al., 2016) or a certain group. Some species of Lepidoptera have migratory behavior, which can be detected by radar-based methods. Such as the famous monarch butterfly (Danaus plexippus), which exhibits seasonal intergenerational migration across the continent (Gustafsson et al., 2015). Bogong moths of Australia (Agrotis infusa) travel 1,000 km from eastern Australia to a few caves in the Australian Alps to escape seasonally high temperatures (Common, 1954; Warrant et al., 2016). Compared to a few known species that have evolved relatively fixed long-distance migration behaviors, short-distance dispersal is likely to be more common (Nathan et al., 2008). In view of this short-distance dispersal, it is important to clarify the basic traits related to spread ability, such as the flight distance and flight speed of each species.
It remains a challenge to determine which traits are related to dispersal adaptation in island biogeography (Whittaker et al., 2017). Lepidopteran insects provide an ideal model to solve this problem, because of its high species diversity and convenience of flight ability measurement. At present, the research on the flight ability of Lepidoptera is usually limited to a few specific species and does not provide a general understanding of other Lepidopteran species, especially to understand the behavior of species dispersal and migration between mainland and islands at the community level. In this study, we aimed to: (1) investigate whether there are differences in flight capability of species between mainland and islands moth communities; and (2) explore mechanisms of island recruitment of more capable flyers of moths by dispersal simulations.
Materials and Methods
Collecting Samples of Lepidoptera Adult
A total of 1,531 moth samples were collected in summers of 2017 (Chang, 2018; Jiang, 2018), 2018 (Jia, 2019), and 2020 from the Dongling Mountain (∼39°51′07″N, 115°29′13″ E) in Beijing, Zhoushan Island (∼30°5′22″N, 122°3′15″E) in Zhejiang Province, and Weihui city (∼35°39′18″ N, 113°59′2″E) in Henan Province, China, respectively(Figure 1A). In the following, samples collected from Beijing, Zhejiang, and Henan are represented by BJDLS, ZSDXG, and HNYHG, respectively. All adult moths were captured at night by setting light traps between 8 and 12 p.m. (Yang et al., 2012).
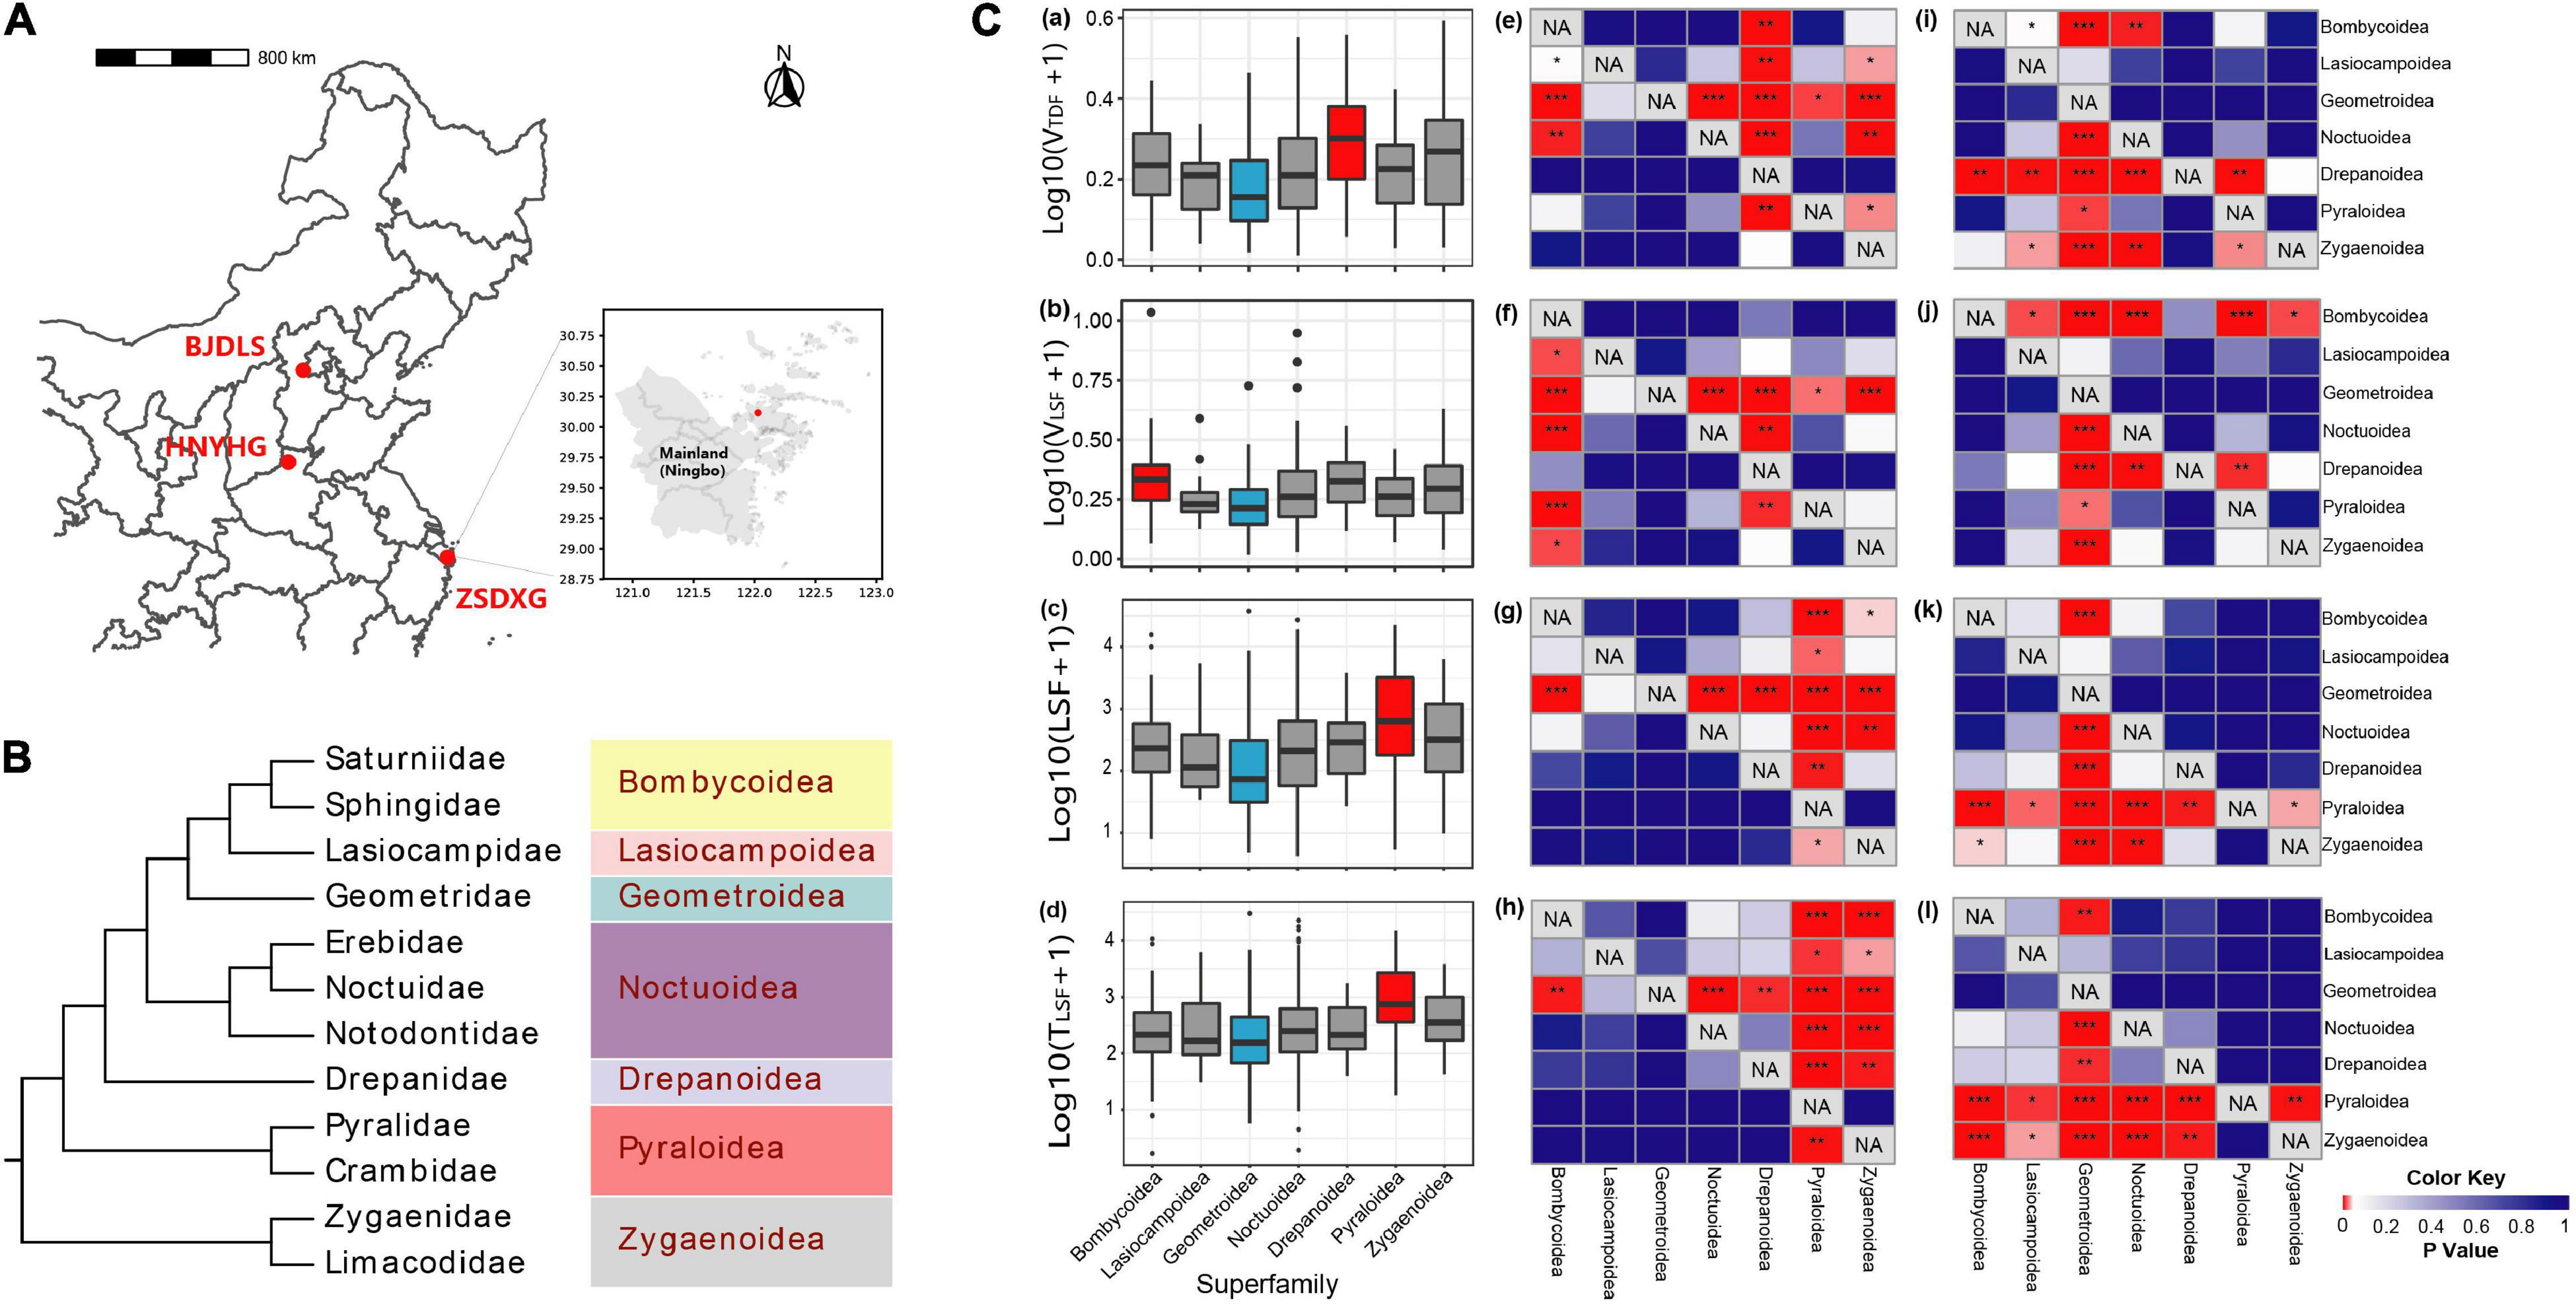
Figure 1. Phylogenetic relationships above the family level and the differences of flight ability among the superfamilies were analyzed in this study. (A) Sample sites in this study. BJDLS, HNYHG, and ZSDXG samples were collected in 2017, 2018, and 2020, respectively; (B) the phylogenetic tree of all Lepidoptera samples in this study, redrawn according to Triant et al. (2018); (C) comparison of flight abilities among moths from different superfamilies and heat maps of p-value for Wilcoxon rank-sum test of the one-tailed hypothesis of the difference in flight ability between certain superfamilies (row) and other superfamilies (column). (Ca–d) The X-axis are indicators from all filtered data, and the Y-axis gives logarithmic conversion result of flight capabilities (VTDF,VLSF,LSF, TLSF), respectively. The color of the box represents the strength of the flight ability, red represents the strongest, blue represents the weakest, and gray represents the medium level. (Ce–h) P-value of Wilcoxon rank-sum test of the one-tailed hypothesis (less) (*:0.01 ≤ p < 0.05, **: 0.001 ≤ p < 0.01, ***: p < 0.001), respectively, the results corresponding to (Ca–d). (Ci–l) P-value of Wilcoxon rank-sum test of the one-tailed hypothesis (greater) (*:0.01 ≤ p < 0.05, **: 0.001 ≤ p < 0.01, ***: p < 0.001), respectively, corresponding to (Ca–d).
Tethered Flight Experiments
SUN-FL tethered flight mills (Beijing Taichi Pengcheng Electronics Company, China) were used to perform hanging flight experiments. This device records: total distance flown (TDF), total flight duration (T), the average speed during flight ( longest single flight (LSF), the time corresponding to the longest single flight (TLSF), and average speed corresponding to the longest single flight () (Ávalos et al., 2014). The captured moths were subjected to a hanging flight experiment in a closed dark room. In the 2017 and 2018 experiments, each moth was included in a continuous 24-h hanging flight experiment without energy supplementation, while in the 2020 experiment, each experiment lasted under 10 h (moths generally became inactive before the end of the 10-h experimental period in all cases). We chose four parameters; VTDF, LSF, TLSF, and VLSF, which may be less affected by hanging flight times (though in the subsequent analysis since we found most moths become inactive in less than 10-h hanging flight, thus experiment durations over this do not impact results).
Identification of Lepidopteran Specimens
All specimens collected from BJDLS (2017) and ZSDXG (2018) were transported at 0°C to the laboratory in Capital Normal University for DNA extraction and PCR amplification for subsequent DNA barcode identification (Hao et al., 2020). Experimental samples from HNYHG were identified based on morphology by Associate Professor Jianxin Cui of the School of Resources and Environment, Henan Institute of Science and Technology.
For all samples collected from BJDLS and ZSDXG, total genomic DNA was extracted individually from 2 to 3 legs, using QIAamp DNA Mini kit (Qiagen, Venlo, the Netherlands) following the protocol of manufacturer. PCR amplification was performed using standard DNA barcoding primers LCO1490 (GGTCA ACAAA TCATAA AGATA TTGG) and HCO2198 (TAAAC TTCAG GGTGA CCAAA AAATCA) (Folmer et al., 1994). The PCR products were bidirectionally sequenced at Beijing Zhongkexilin Biotechnology Co., Ltd., using an ABI 3730XL analyzer. All sequences of samples ∼658 bp were submitted to the BOLD system1 for taxonomic identification (Ratnasingham and Hebert, 2007).
Data Analysis
We removed the total flight distance parameter below the lower quartile. One of the reasons for these data could be that the wings of some moths are glued in the process of experiment, reducing their willingness or ability to fly. If these data were included, we would underestimate the fly ability of moths (Jantzen and Eisner, 2008; Combes et al., 2010). All calculations and statistical tests involved in this article are implemented by R (v4.0.4) (R Core Team, 2013). For the flight parameters of species level, family level, and superfamily level, the shapiro.test function in R was used to check for the normal distribution of the data, and the Wilcox.test function in the stats package to compare the differences among species, families, and superfamilies. The lm and predict functions in R were used for fitting and prediction of unary linear regression, respectively.
Simulation of Species Spread Between Mainland and Island
After obtaining the flight data of 36 (n ≥ 10) moth species from 10 different families, we simulated the migration of different species between mainland and island (see below) in R. In the simulation, we approximate Zhoushan Island and its adjacent mainland (Ningbo) into two circular regions, and the minimum distance between the two circles (e.g., the shortest distance between Ningbo and Zhoushan Island) is about 8.3 km measured based on Map World on National Platform for Common Geospatial Information Services2.
Basic Assumptions of the Dispersal Model
We assume that the initial moth population consists of a male and a female, and that they exist in an environment with evenly distributed resources. The female lays eggs somewhere after mating, and the larvae will only feed near the hatching place due to limited dispersal ability, so on a large spatial scale, we believe that the offspring produced by the same female moth will not spread during the larval and pupal stage, that is, the position where the female moth lays eggs is the initial position of the progeny adult’s spread (Considering natural enemies, climate, and other factors, it is assumed that only rmax (assuming rmax = 10) individual offspring produced by each female moth can successfully emerge, and the sex ratio is 1:1; Supplementary Figure 1). The offspring will spontaneously spread to the surrounding environment in random directions following metamorphosis into the adults and form an extended second-generation distribution range with an area of S. The mating females in this population lay eggs nearby, to produce the second generation, and the offspring continue to circulate this process. According to the logistic population growth model (Pearl and Slobodkin, 1976), the density of species is limited by the carrying ability K (assuming K = 30, that is, 30 adults per square kilometer, though of course, it may be higher than this for many species). The number of offspring produced by each female in the population is restricted by the population density of the current generation, and all adults can mate with a sex ratio of 1:1. Supposing the number of fertile females in this generation is Nff and regardless of limitation in species spawning ability, females can produce the largest number of individuals r, so the number of fertile offspring (adult offspring) produced by fertile females in each generation (r) should satisfy the following inequality:
Its ecological meaning is that the females are restricted by density during the larval stage, leading to a difference in the amount of food, then changing the number of eggs produced after emergence and mating (Rivero et al., 2001; Telang et al., 2006).
Key Parameters Implemented in R Program
The population dispersal simulation is analyzed using several steps in R: (a) Determination of population distribution area. Theoretically, the distribution range of a population is composed of the largest convex polygon formed by all individuals in the population; however, it is a challenge to determine the actual distribution range of a certain population under natural conditions. The R function boxplot.stats (package grDevices) was used to determine the outliers of all the individual abscissas and ordinates (R Core Team, 2013). According to the outliers, irregular population distribution is simplified into an area composed of two concentric rectangles. The core rectangle is the population core distribution area and is recorded as Score. The rectangular area at the edge of the population distribution is recorded as Sedge. (b) Determination of the fertile females of the population. Supposing that the female moth mates with only one male moth in its lifetime, and the male does the same. Therefore, the number of fertile females in the population is the minimum number of males and females, and fertile females are determined without repeated sampling among all females according to this minimum. If the minimum value is 0, the population will be extinct in the next generation. (c) The production of offspring. The new individuals are generated from the locations of fertile females of the previous generation. The dispersal angle is random, and dispersal distance is the LSF of each species measured in the actual experiment (see above), and its value is determined to conform to the logarithmic normal distribution. The number of offspring produced by a female (R) is controlled by an inequality . When r > rmax, R = rmax; when 1 < r ≤ rmax, ; and when r < 1, R = 1. The distribution area of the core population and the marginal population is calculated independently. If the population distribution is a point or a straight line, the number of adult offspring that a female can produce is calculated by rmax.
Simulation of Species Spread Across Islands
We assume that the ability of moths to cross the strait to complete the spread between the mainland (island) and the island depends on the LSF. Regardless of airflow, human factors, and more stochastic natural factors, species can complete migration only when the LSF is greater than the shortest distance between the islands (but the stepping stones that exist between the islands reduce the difficulty of crossing the islands.
According to the LSF of the wild populations of the moth species that we measured, we simulated the spread of each species from the center of the area through computer simulations and observed the spread of offspring individuals across islands within 500 generations (two generations per year (Hao et al., 2020), it will take about 250 years). In our data, there are a total of 36 species with at least 10 individuals (Supplementary Table 1), of which the LSF data of 34 species (94.4%) had a log-normal distribution, thus the LSF data of all moths are assumed to correspond with log-normal distribution in the simulation. We simplified Ningbo (with an area of about 9,816 km2) and Zhoushan Island (with an area of about 502 km2) into two circular areas with radius of 56 and 12 km, and the closest distance (CD) between the two circles is 8.3 km. Here we defined a new concept P_(LSF > CD) to explain the dispersal ability of species, and its specific definition is that the proportion of the number of individual that LSF is longer than the closest distance (CD) between mainland and island to the population size.
Results
Data Filtering and Taxonomy Identification
A total of 1,142 (∼74.4%) experimental flight data samples were analyzed, i.e., including 222 samples from BJDLS (the minimum TDF is 18.84 m), 409 samples from ZSDXG (the minimum TDF is 67.23 m), and 511 samples from HNYHG (the minimum TDF is 33.91 m). Filtered data were collected from seven Lepidoptera superfamilies (Noctuoidea, Bombycoidea, Zygaenoidea, Geometroidea, Drepanoidea, Lasiocampoidea, and Pyraloidea), 12 families (Erebidae, Noctuidae, Notodontidae, Saturniidae, Sphingidae, Zygaenidae, Limacodidae, Geometridae, Drepanidae, Lasiocampidae, Crambidae, and Pyralidae), and 186 species, and among them, 81 species with at least 3 individuals and 36 species with at least 10 individuals. A total of 631 individuals from BJDLS and ZSDXG were identified by comparison with the BOLD system database. Among them, 547 individuals had best hits with similarity scores of at least 98 (part 1), and the remaining individuals had similarity scores between 90.43 and 97.99% (part 2). The remaining 511 individuals from HNYHG were identified using morphology (part 3). Part 1 contains 134 species, part 2 contains 40 species, and part 3 contains 39 species. There are 13 common species in parts 1 and 3, but only one common species, Catocala kaki (Noctuidae) in parts 2 and 3.
Comparison of Flight Capabilities at Different Taxon Levels
We compared the difference in flight abilities (VTDF, LSF, TLSF,and VLSF) at different taxon levels in all filtered data. First, we checked whether the flight data at different taxon levels conformed to a normal distribution and found that only a small proportion of the data conformed (at the superfamily level, only 0–42.9% data of the above four parameters conform to a normal distribution; at the family level, only 8.3–41.7% data of the above four parameters conform to a normal distribution; only 12.5–55.6% of the flight capability data at family level captured from different sampling sites show a normal distribution. Therefore, the Wilcoxon rank-sum test of the one-tailed hypothesis is selected to compare the sample differences between different classification levels and different sampling sites.
The lowest VTDF, VLSF, LSF, and TLSF were found in moths from superfamily Geometroidea, which were lower than those in the other five superfamilies except for no significant difference with superfamily Lasiocampoidea (Figure 1C). Superfamily Drepanoidea is significantly higher than the other five superfamilies (p < 0.05) on the flight parameter VTDF except that it does not show any significant difference from superfamily Zygaenoidea. In VLSF. Bombycoidea is significantly higher than the other five superfamilies (p < 0.05) with the exception of Drepanoidea. While superfamily Pyraloidea has the longest LSF and VLSF among seven superfamilies in our study (p < 0.05).
Correlation analysis between flight parameters and moth morphological data showed that VTDF and VLSF had a significant positive correlation with the increase in moth body size [body length (BL), total wing area (TWA), forewing area (FA), and hind-wing area (HA)], while TLSF had a weak negative correlation with moth TWA and HA (Supplementary Figure 2), highlighting the importance of individual wing-traits in determining flight performance and ability.
Comparison of Flight Capabilities of Species at Different Taxon Levels and Captured From Different Sampling Sites
Comparison of Common Families of Flight Capabilities of Mainland and Island Samples
A total of six families of species appeared in the three sampling sites (BJDLS, HNYHG, and ZSDXG). We selected samples from three families (Geometridae, Erebidae, and Notodontidae) for flight ability comparison. The data collected from BJDLS and HNYHG were combined into Mainland Dataset and that from ZSDXG was used as an Island Dataset. These three families satisfy that the number of samples collected on the island is more than 20. The three families on the mainland and island are composed of more than 10 species, but there are few overlapping species between different sites (Figure 2E). The speed parameters (VTDF and VLSF) of the mainland and the island samples did not show a consistent pattern. Our results suggested that only the Erebidae showed significant differences between mainland and island in the term of speed, and island individuals were significantly faster (p < 0.05) than mainland individuals. Notodontidae is only in the VTDF parameter showing that the mainland is significantly stronger (p < 0.05) than the island samples (Figures 2A,B). The average values of LSF and TLSF of Geometridae and Notodontidae show that the islands are higher than the mainland samples, but only Geometridae shows significant differences (p < 0.05) in the TLSF (Figures 2C,D). The LSF and TLSF of Erebidae are stronger than those of island samples and only one parameter, TLSF, has statistical significance.
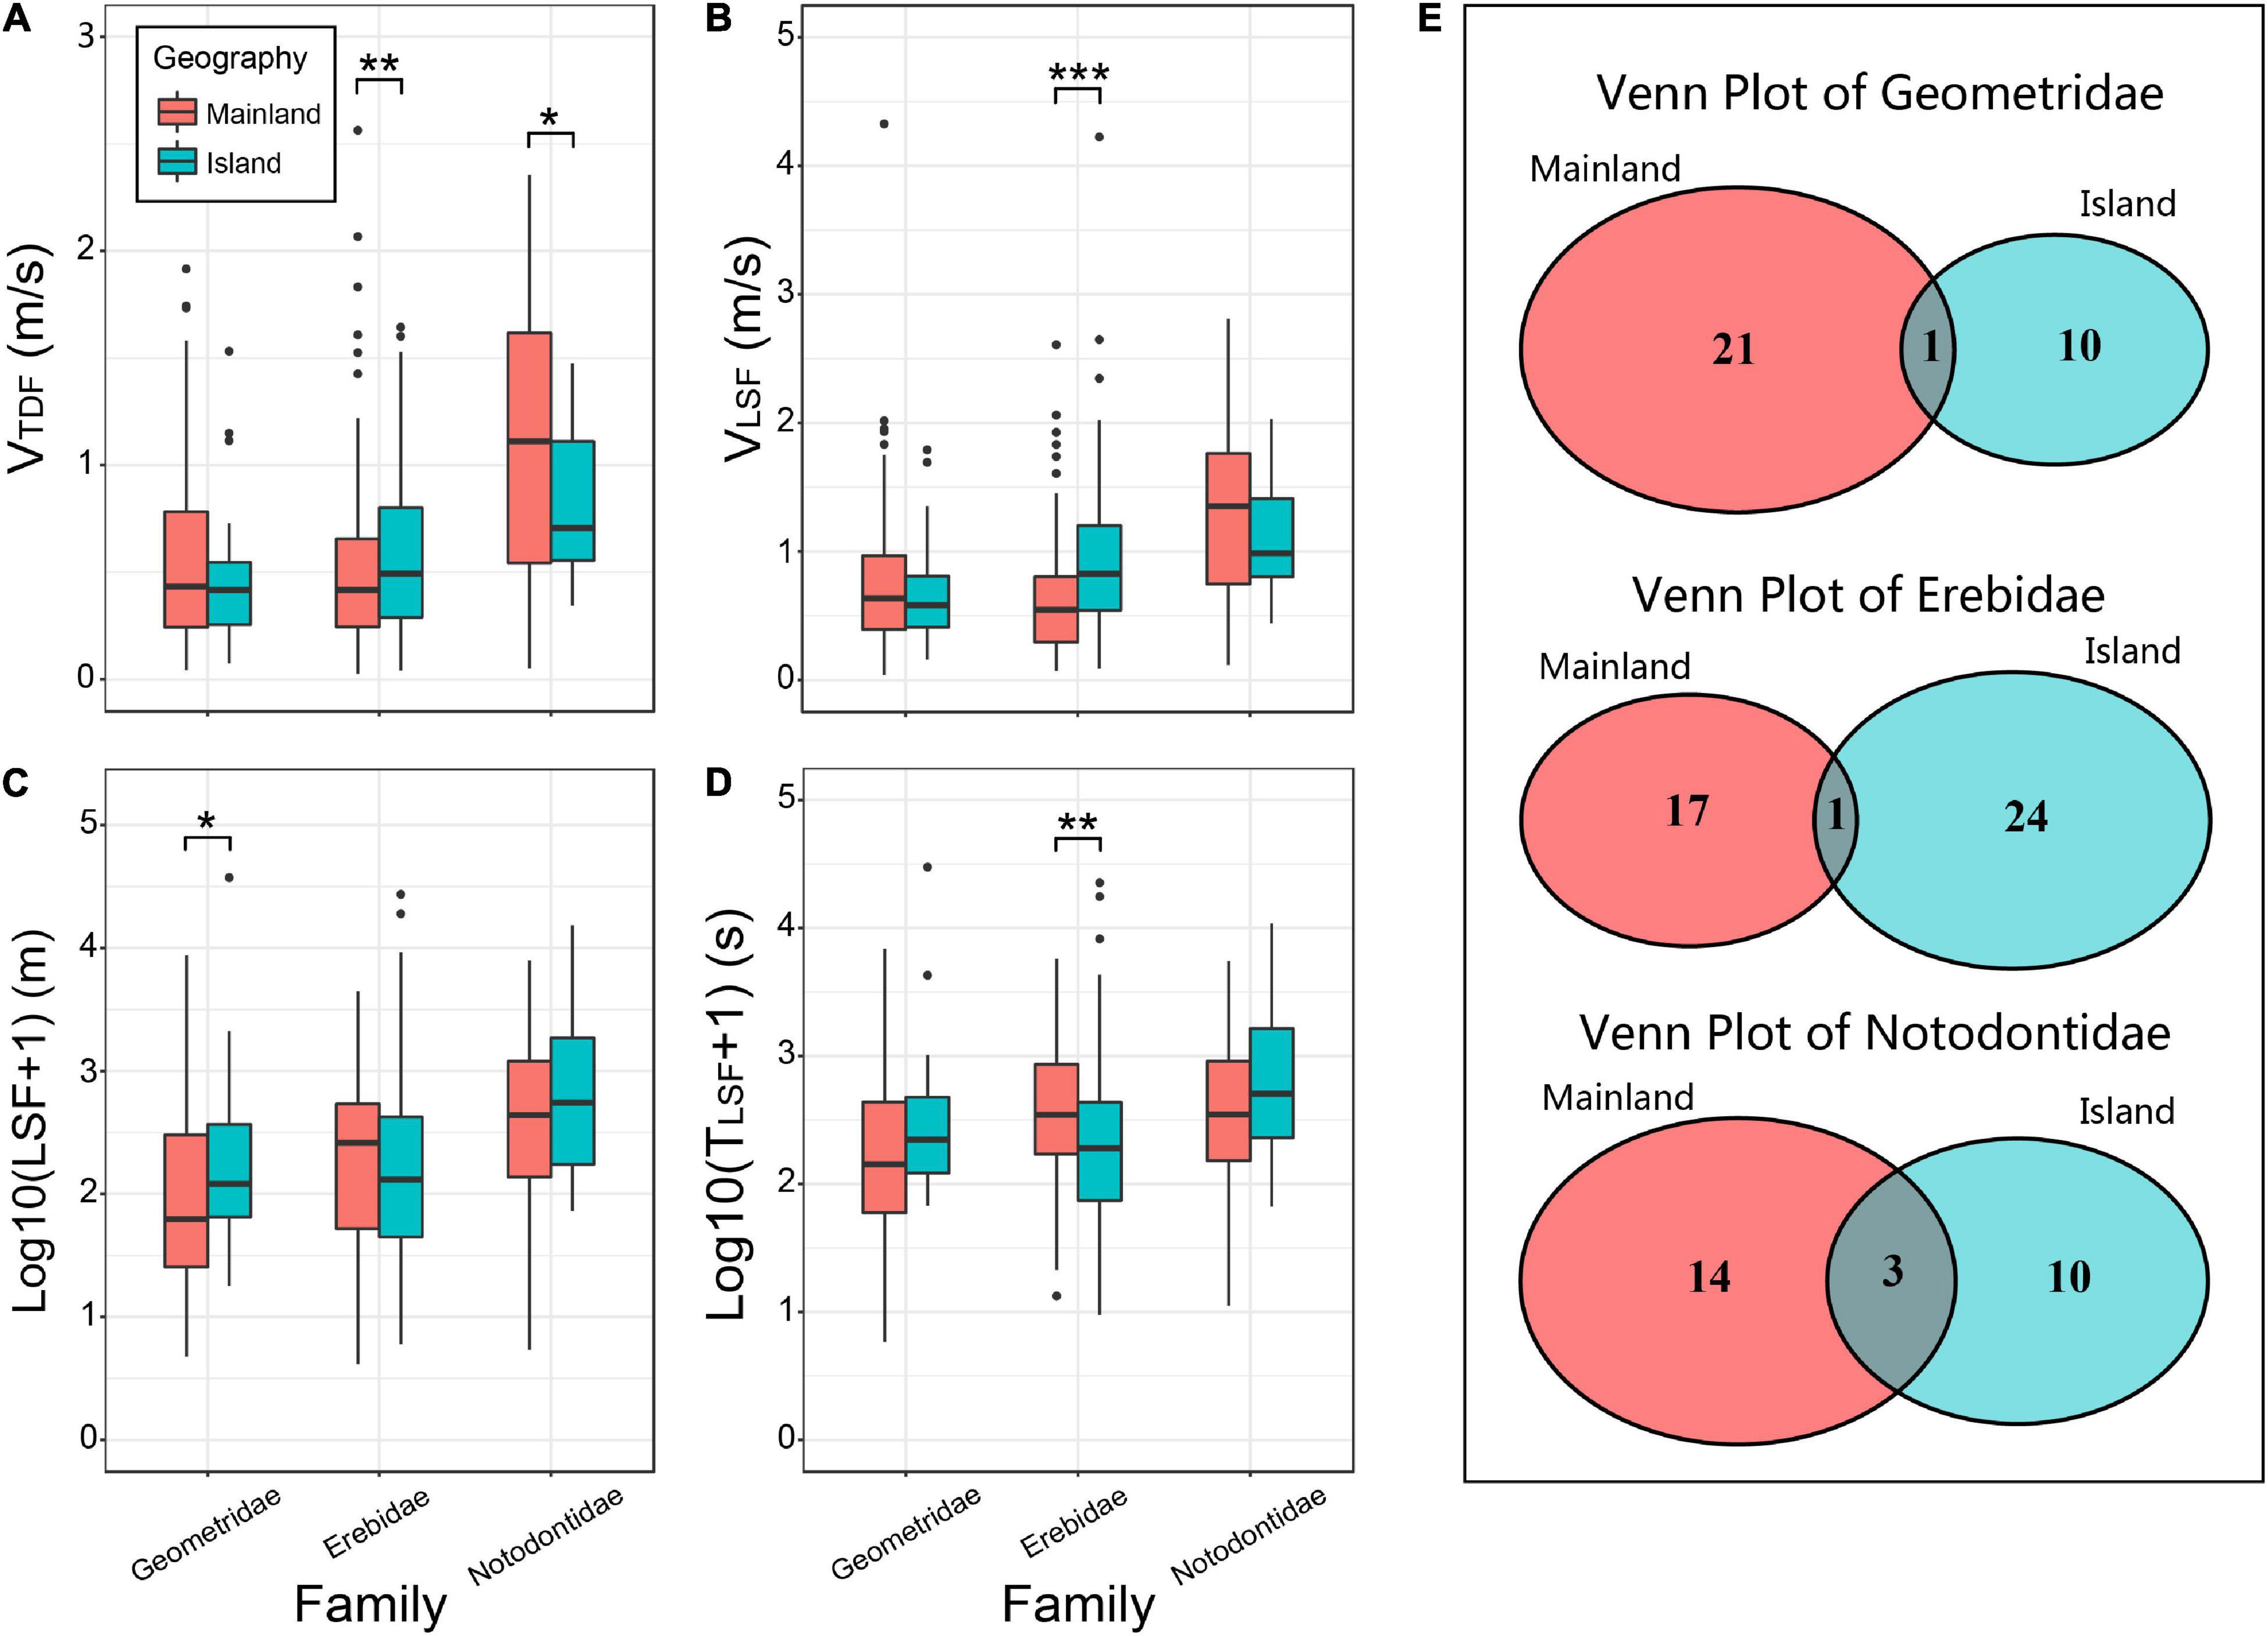
Figure 2. Comparison of flight capabilities between mainland and island (Geometridae, Erebidae, and Notodontidae). (A–D) Box plot of comparing the flight capabilities of mainland and island samples. The difference between the samples is calculated by the Wilcoxon rank-sum test of the two-tailed hypothesis (*:0.01 ≤ p < 0.05, **:0.001 ≤ p < 0.01, ***:p < 0.001),only the samples with significant differences between Mainland and Island are marked with *, ** or *** in this figure. (E) Venn diagram of species in three families captured from mainland and island.
Comparison of the Flying Ability of Common Species Captured From HNYHG and ZSDXG
Among the sampling sites in the three regions, only Henan (HNYHG) and Zhejiang (ZSDXG) samples have more than three individuals shared (Figure 3E), and the common species data of Beijing (BJDLS) and Zhejiang (ZSDXG) do not meet the minimum requirement of at least three individuals. These three species are Biston panterinaria (B. panterinaria; Geometridae), Thyas juno (T. juno; Erebidae), and Uropyia meticulodina (U. meticulodina; Notodontidae). Our results showed that only the VTDF of T. juno showed significant differences (p < 0.05) between the two sampling sites (Figure 3A), and the mean values of VLSF, TLSF, and LSF of the three species between the two sampling sites were relatively close, and no significant differences were detected (Figures 3B–D). The mean values LSF and TLSF of species B. panterinaria and T. juno collected from ZSDXG were higher than those from HNYHG, while the opposite results were observed for U. meticulodina collected from the two sites (Figures 3C,D).
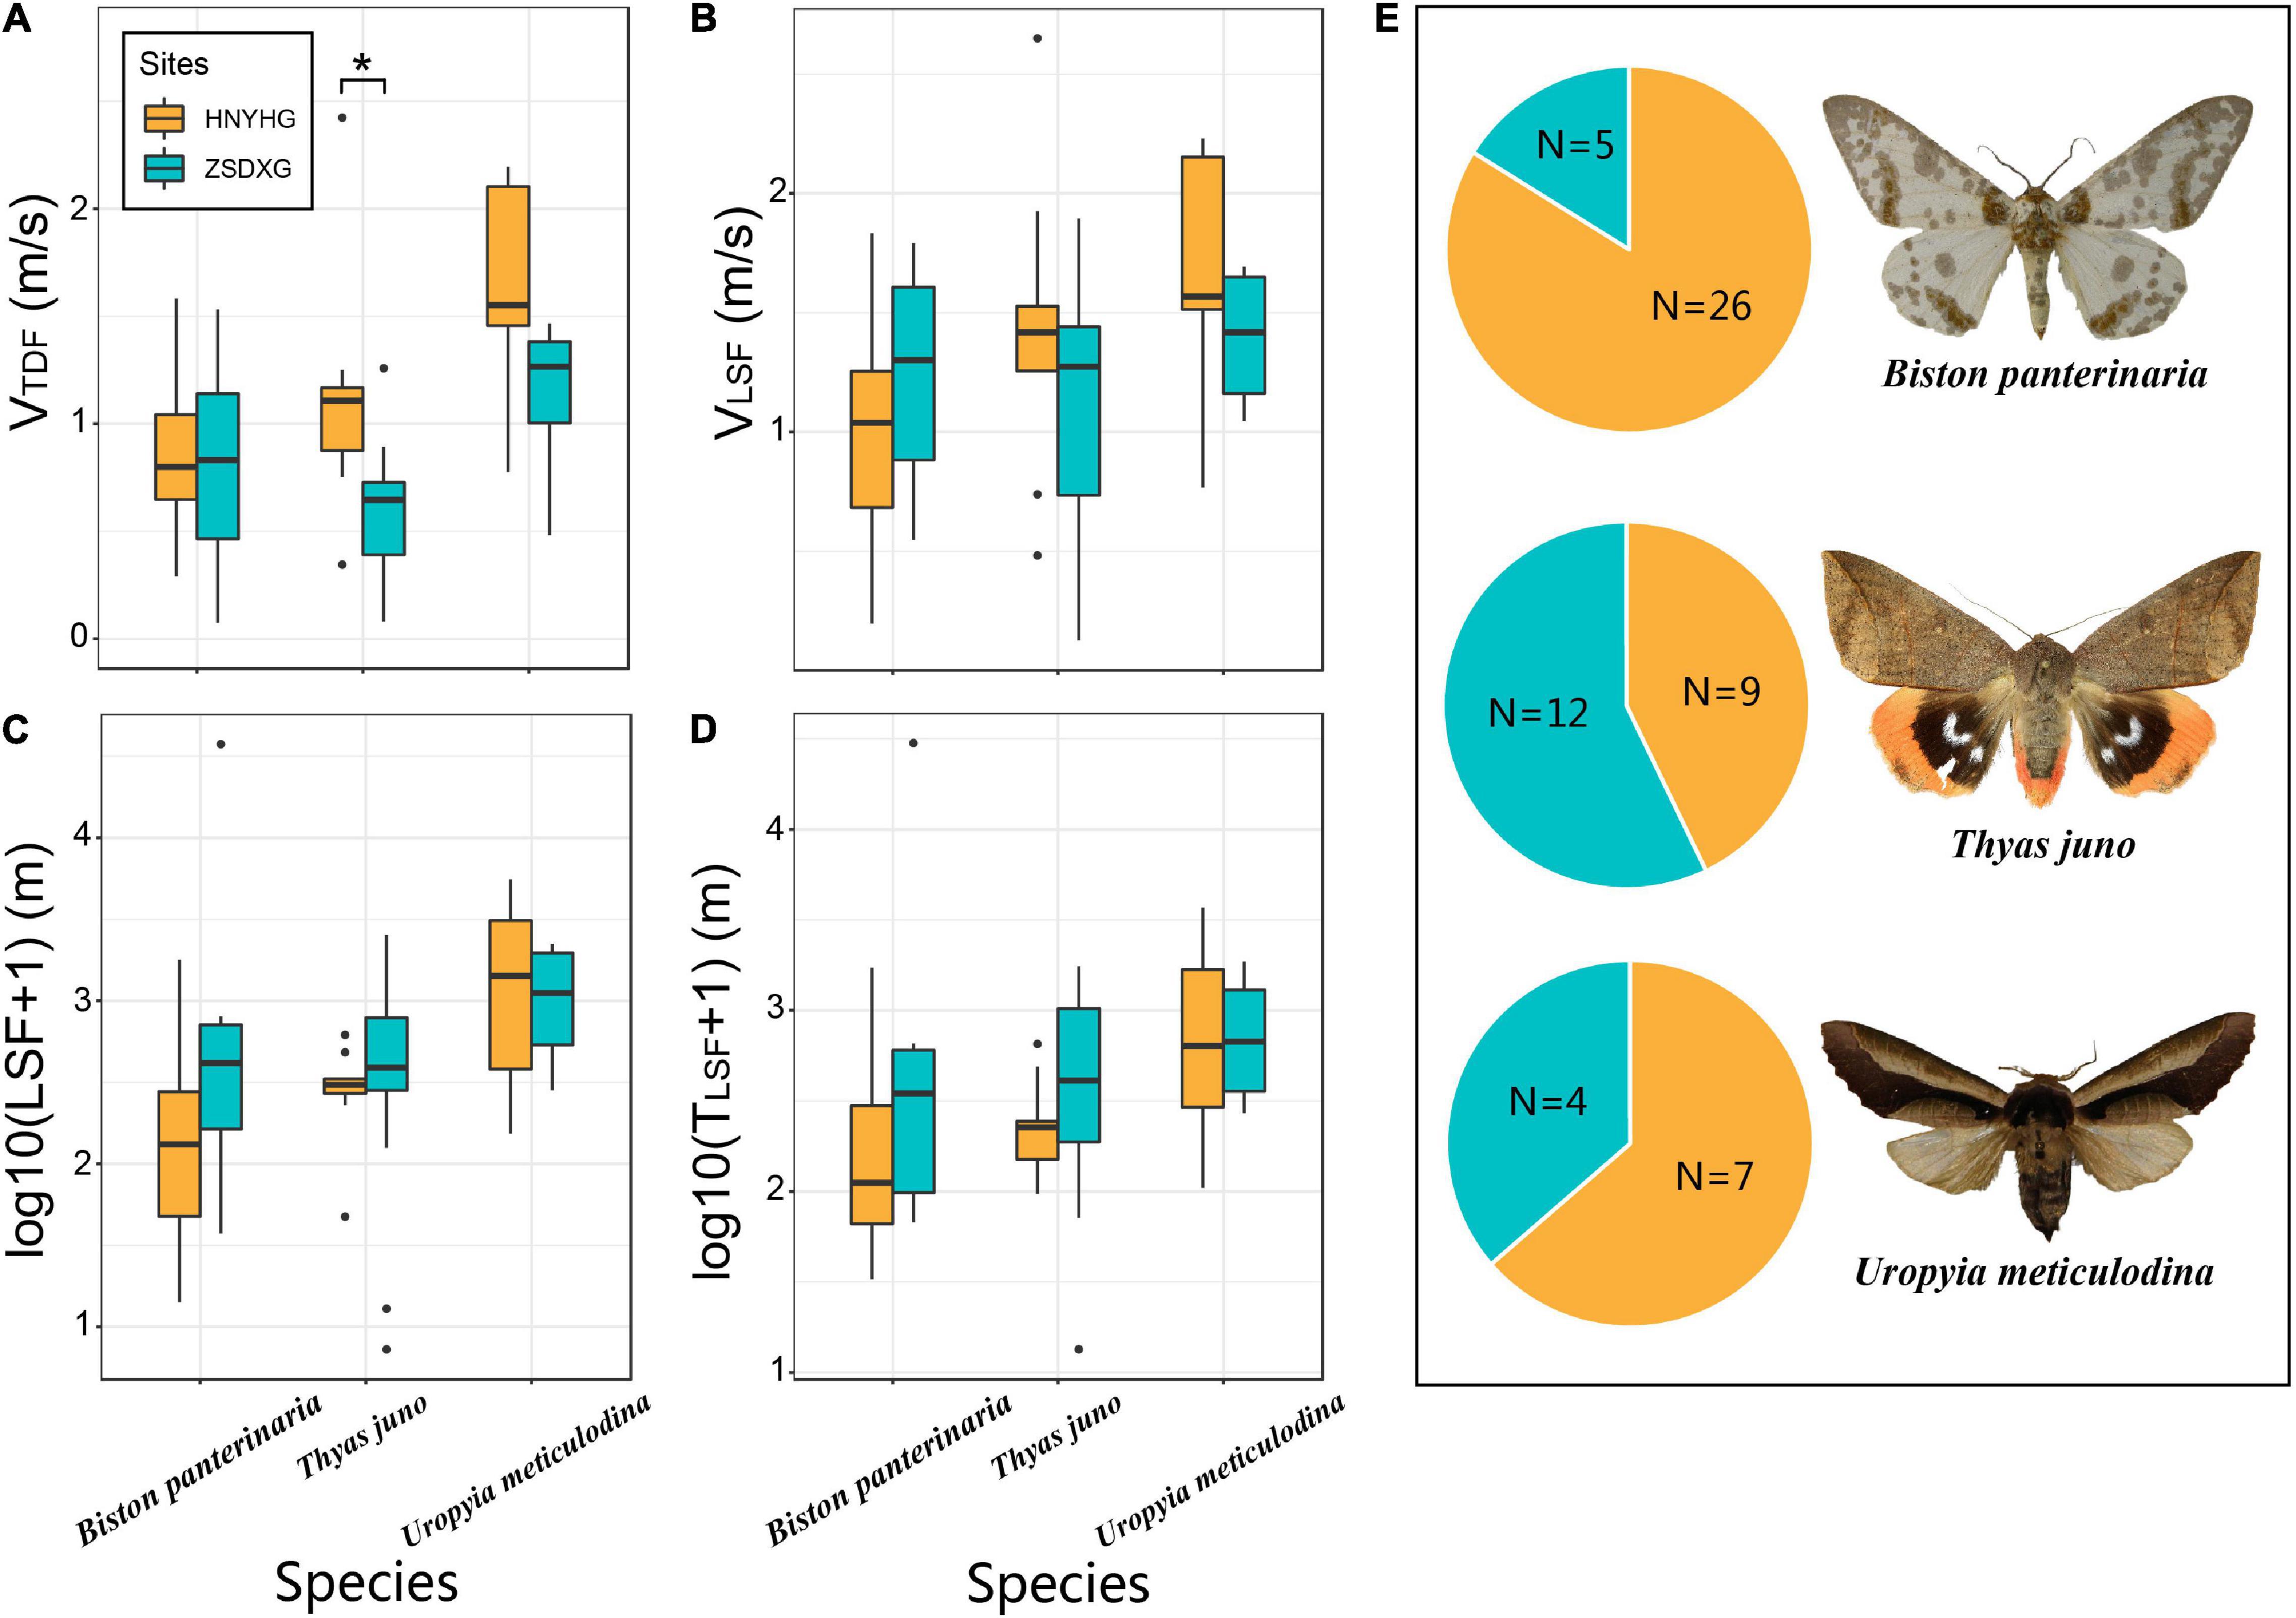
Figure 3. Comparison of flight ability of common species (Biston panterinaria, Thyas juno, and Uropyia meticulodina) between HNYHG and ZSDXG. (A–D) Box plot of comparing the flight capabilities of common species captured from HNYHG and ZSDXG. The difference between the samples is calculated by the Wilcoxon rank-sum test of the two-tailed hypothesis (*:0.01 ≤ p < 0.05, **:0.001 ≤ p < 0.01, ***:p < 0.001), only the samples with significant differences between HNYHG and ZSDXG are marked with *, ** or *** in this figure. (E) Sample size of three species between two sampling sites [species photo source: T. juno (license holder: Unspecified, University of Oslo, Natural History Museum), U. meticulodina (license holder: Unspecified), and Biston panterinaria (license holder: Axel Hausmann, SNSB, Zoologische Staatssammlung Muenchen)].
Simulation Results of Species Spread Across Islands
Cross Island Simulation Results of Species Within a Limited Generation
We selected 14 species from the above 36 species according to the LSF gradient from high to low for simulations. The results showed that as the LSF of the species decreases, the number of cross-island migrations (from the mainland to island) in the offspring will decrease significantly. Locastra muscosalis (L. muscosalis) has the strongest dispersal ability, P(LSF>CD) = 0.1516, and an average of 166.7 individuals in each generation have successfully spread (Figure 4A). Cydalima perspectalis (C. perspectalis) with the second strongest dispersal ability, P(LSF > CD) = 0.0415, and an average of 38.3 individuals in each generation have successfully spread. When the P(LSF > CD) is between 0.0127 and 0.0021 (from high to low), the average number of cross-island individuals per generation drops from 6.6 to 1.1. When the P(LSF > CD) of the species ≤0.0012, almost no offspring individuals can complete cross-island migration.
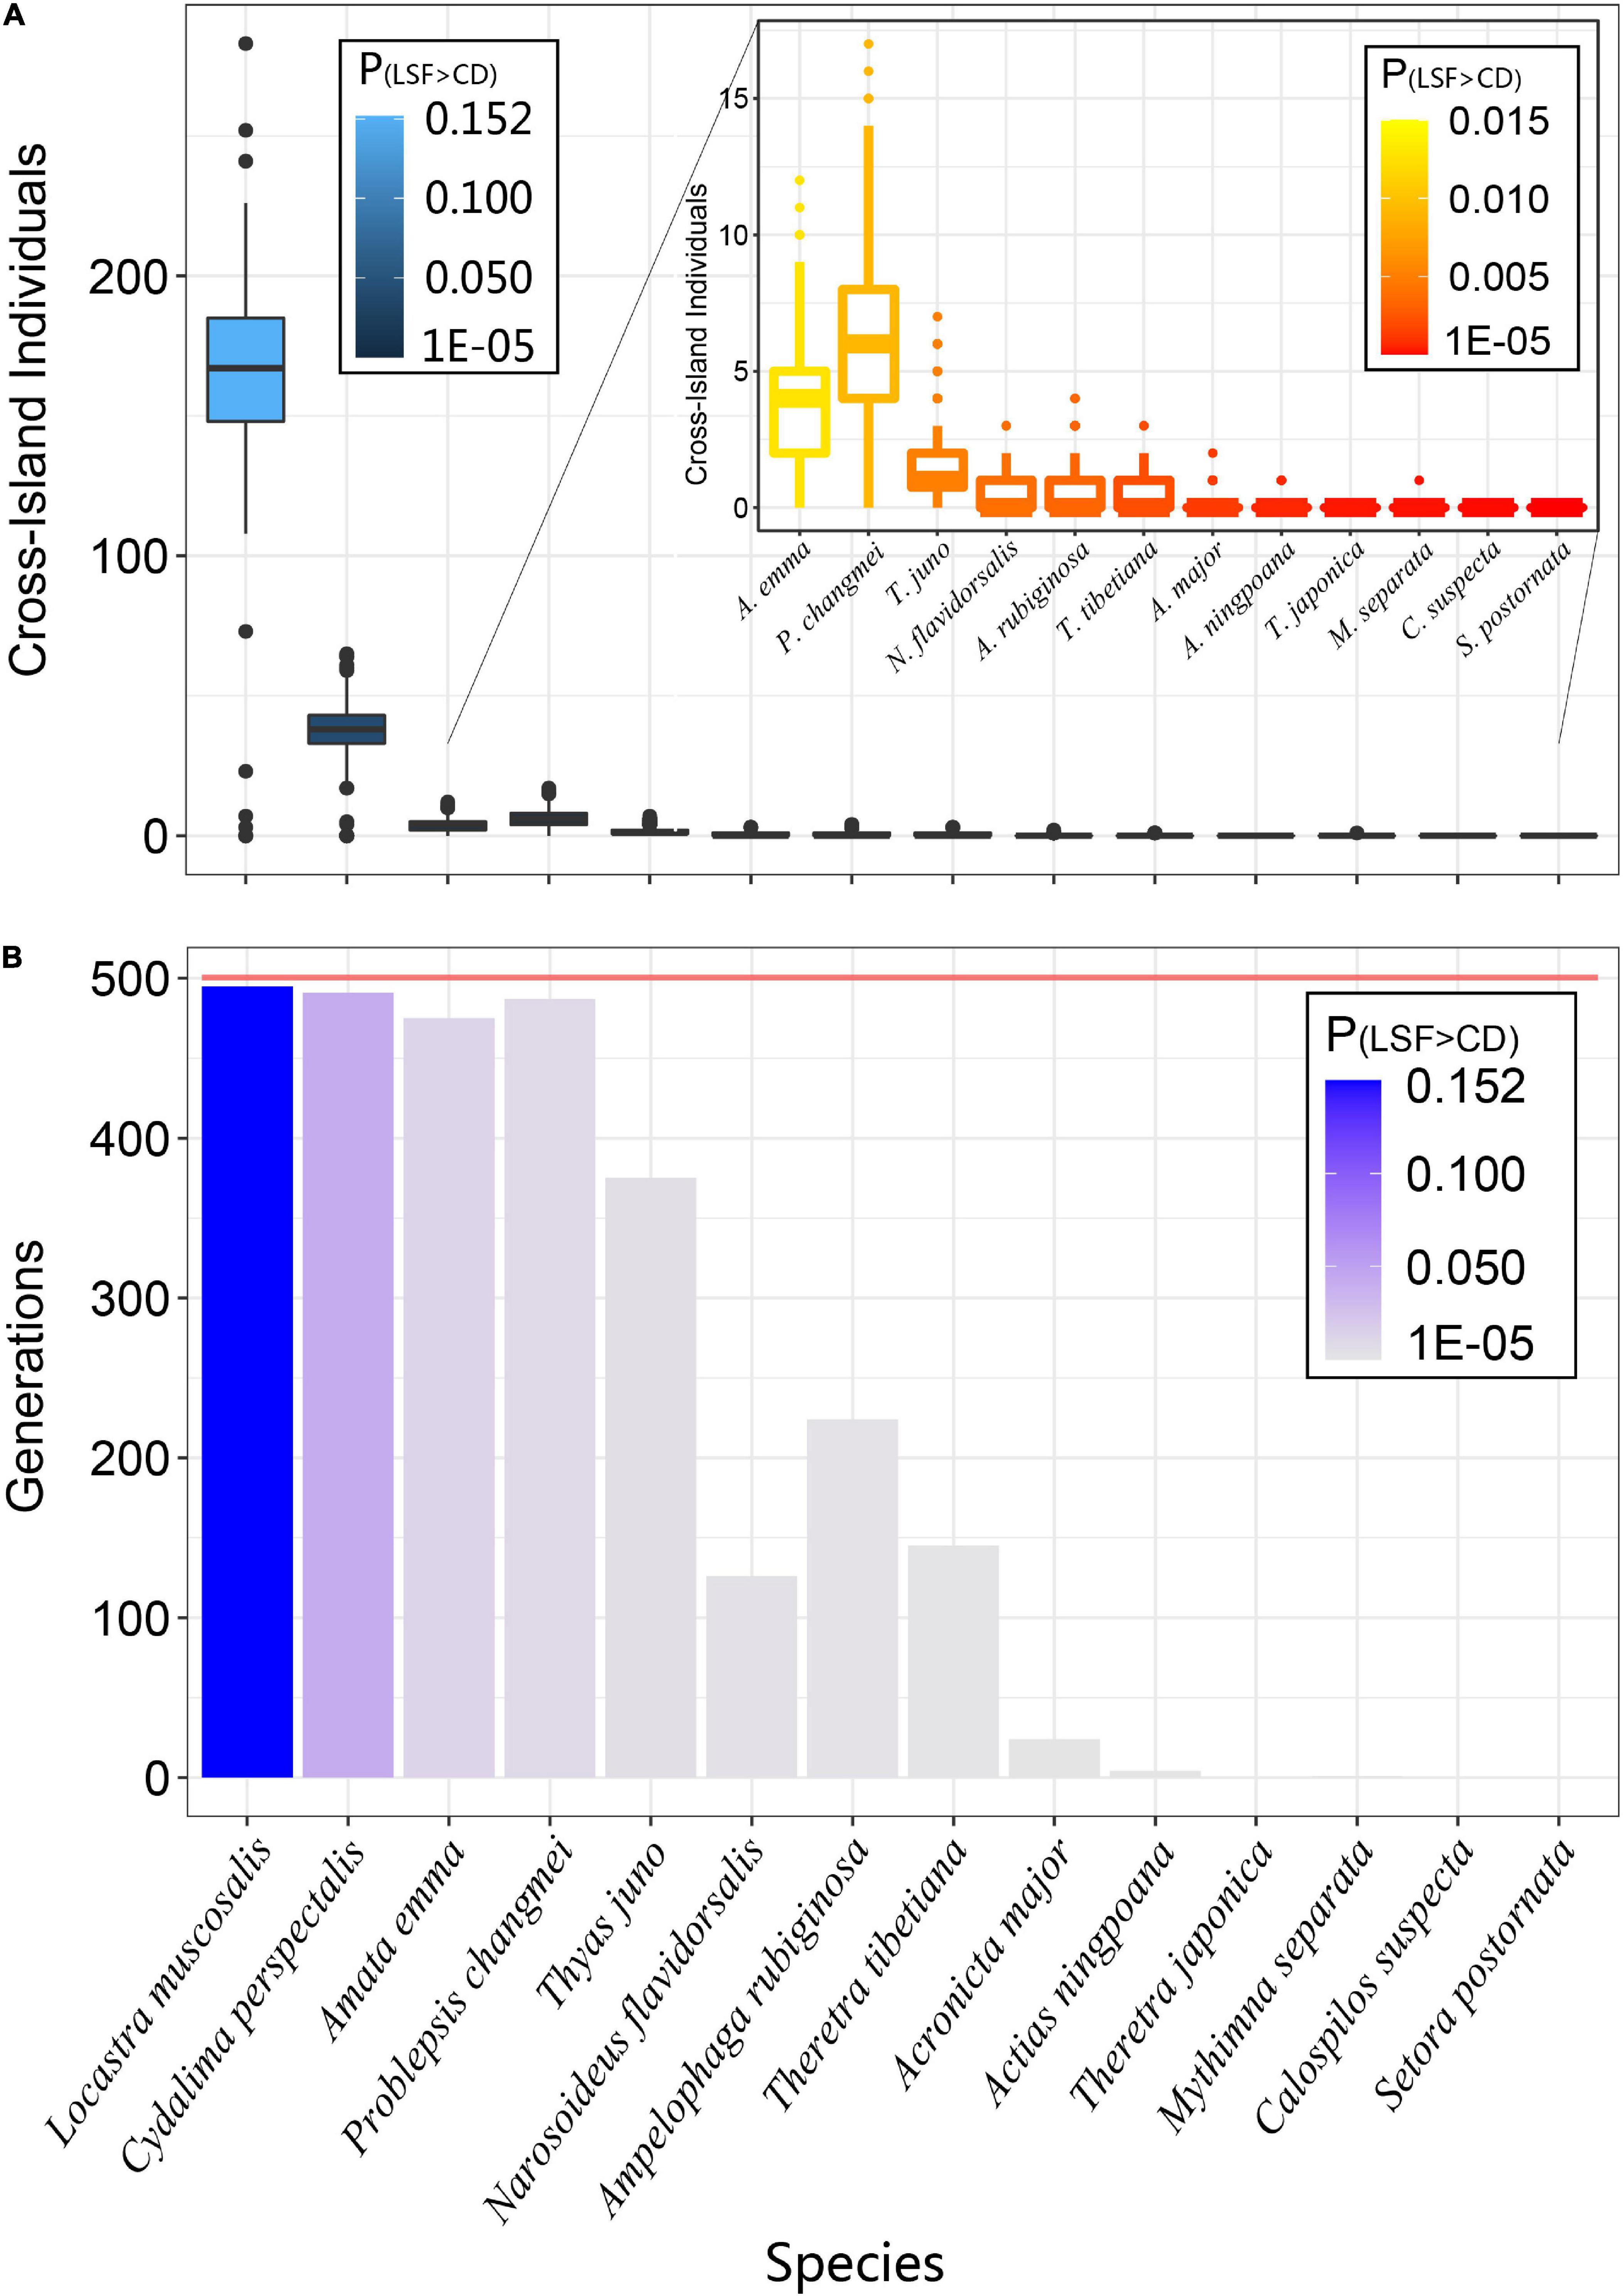
Figure 4. The average number of individuals with different LSF levels of species dispersal from the mainland to island (A) and the number of generations (B) within 500 generations. LSF, longest single flight. P(LSF > CD) refers to the proportion of individuals with LSF greater than the CD between the two islands in the offspring of a species in the total population.
When the P(LSF > CD) is greater than 0.05, in the 500-generation expansion of the simulated population, far more than half of the generations (∼75–99%) will occur cross-island migration of individuals in the population (Figure 4B). When the P(LSF > CD) is between 0.002 and 0.05, the ratio will increase from 25.2 to 44.8%. When the P(LSF > CD) is lower than about 0.001, at most only 24 generations (4.8% of all generations) have individuals which perform cross-island migration.
Comparison of the Flying Ability (LSF) of Cross-Island Individuals and Stranded Mainland Populations
We selected the 50th generation of cross-island dispersal data from eight species with strong flight abilities and compared the difference in flight ability between populations composed of cross-island individuals (the number of individuals in each species population is 160, 34, 1, 7, 2, 1, 1, and 1) and populations stranded on the mainland (random sampling is used to select data of 5,000 individuals from the mainland population; Figure 5). Our results show that the flying ability of the cross-island populations of each species is significantly stronger than that of the mainland populations. Among them, the LSF of the cross-island populations of L. muscosalis, C. perspectalis, and P. changmei in particular is significantly higher (p < 0.001) than that of the mainland stranded populations. The other five species also showed the same pattern with significant differences between mainland and island populations in each (p < 0.05).
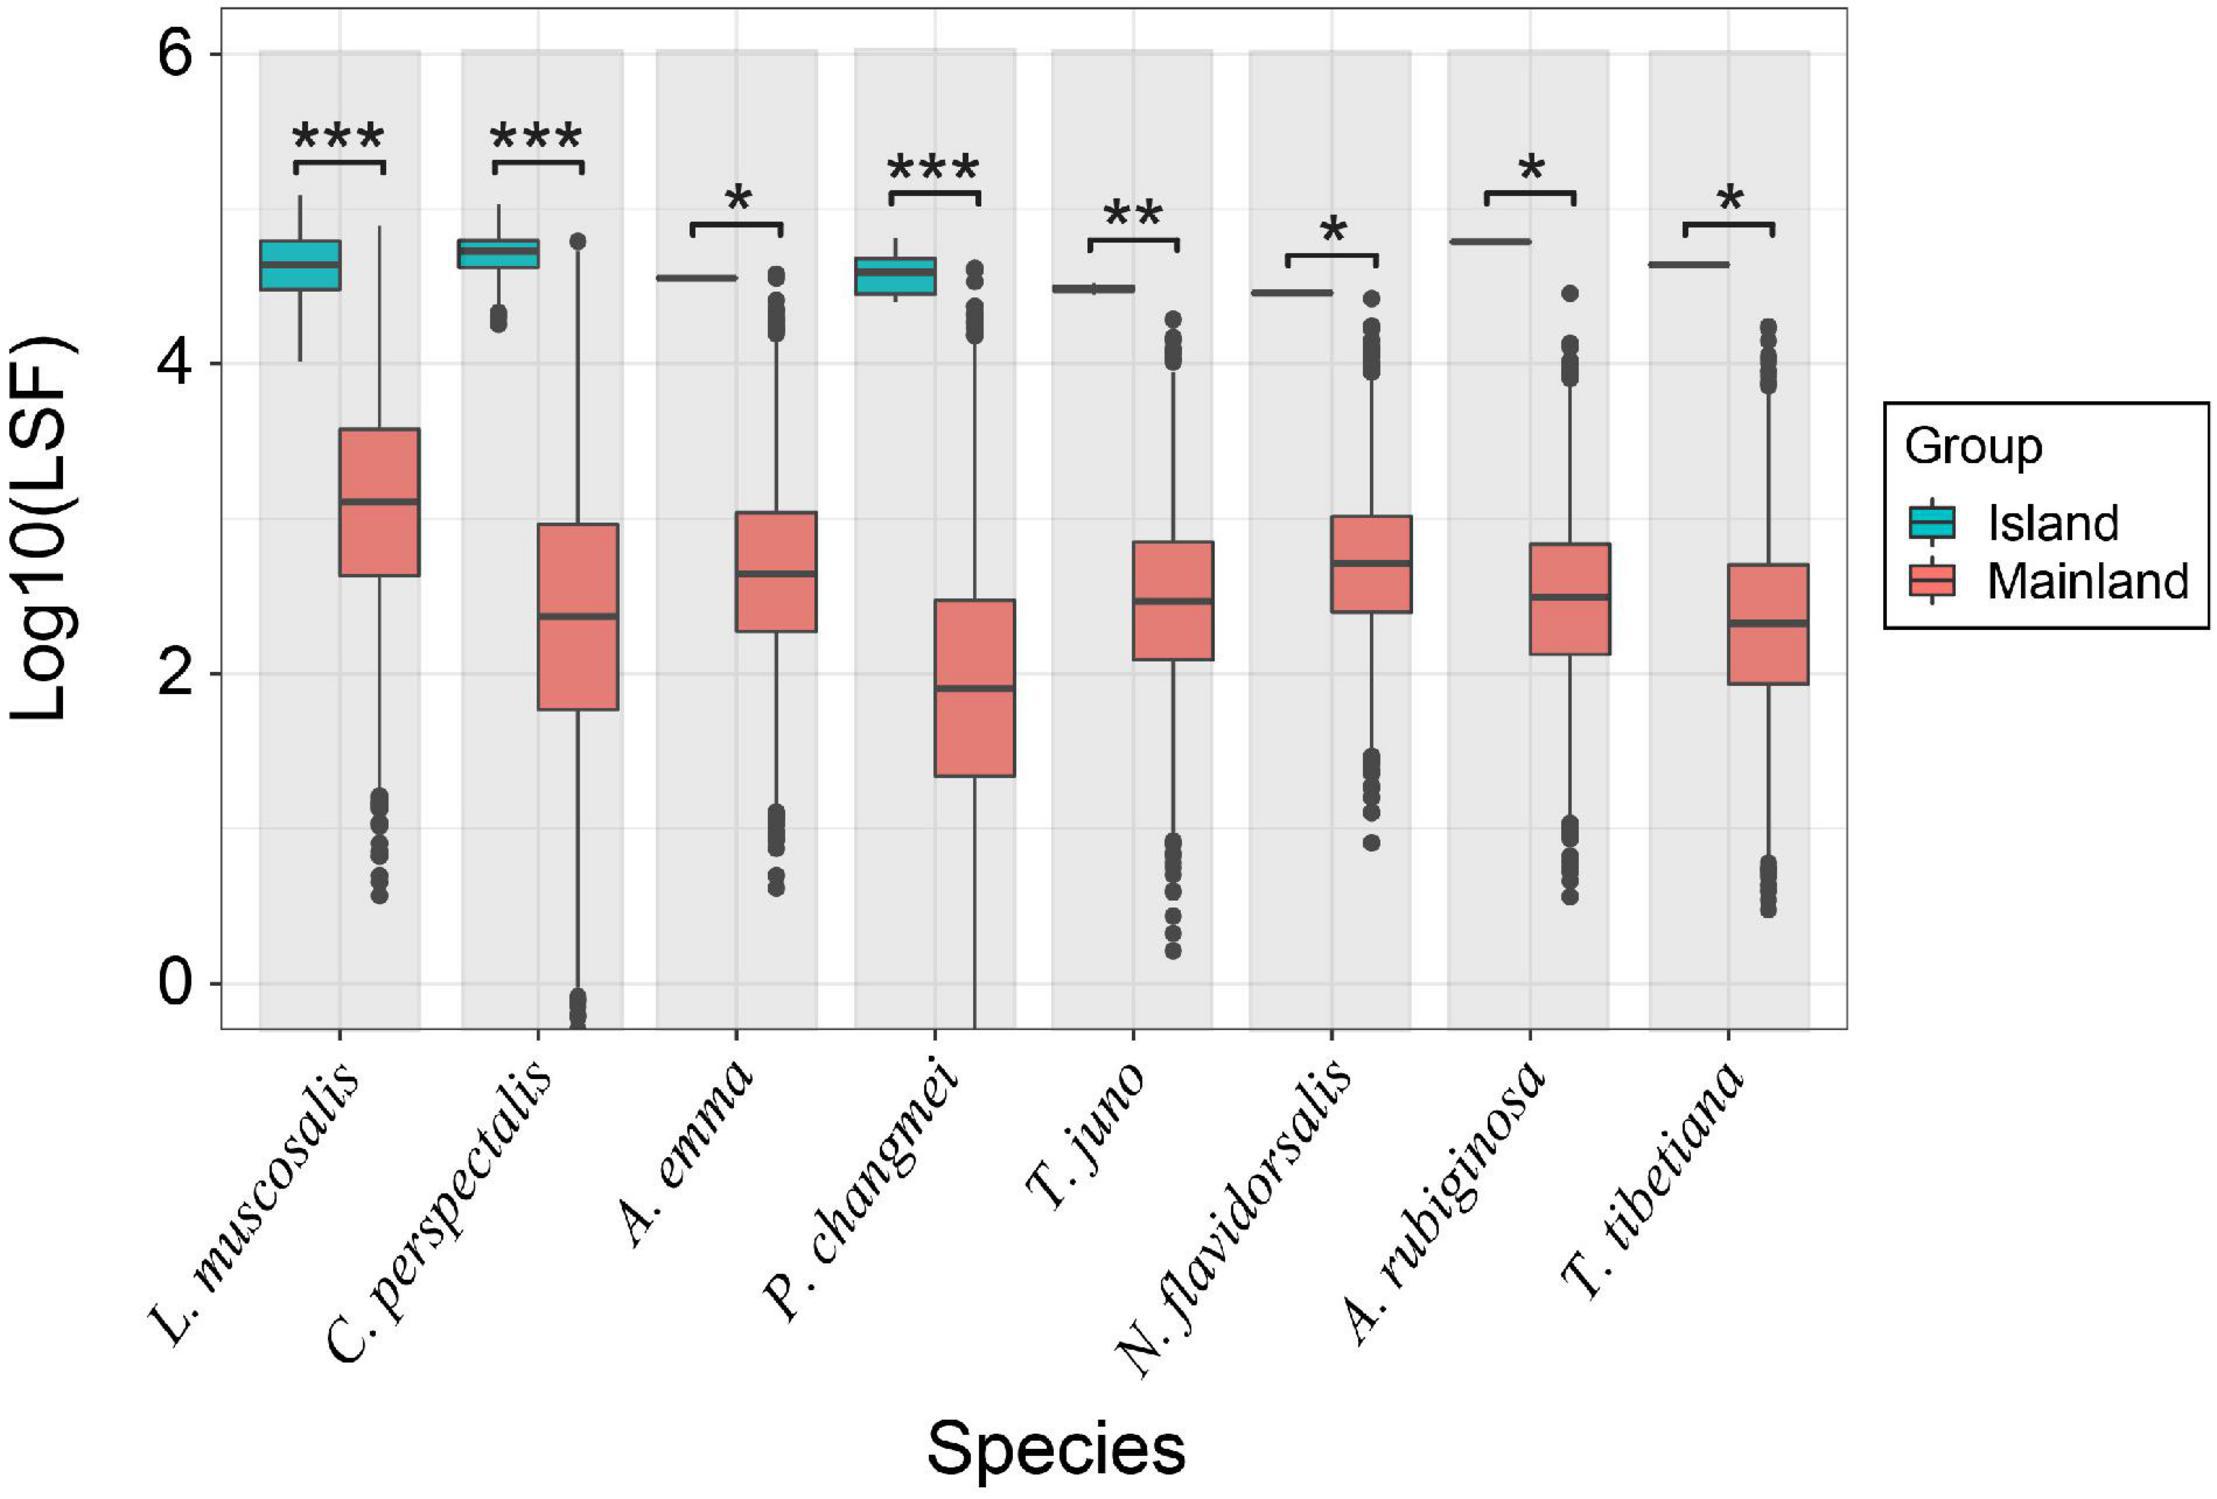
Figure 5. Comparison of the flight ability of the trans-island populations of each species and the mainland stranded population (species dispersal from the mainland to island). The eight selected species are displayed on the x-axis, and the y-axis is the log10 conversion value of the LSF parameters of the different populations of each species. The difference between different populations is calculated by the Wilcoxon rank sum-test of the one-tailed hypothesis (*: 0.01 ≤ p < 0.05, **: 0.001 ≤ p < 0.01, ***p < 0.001). LSF, longest single flight.
Simulate the Relationship Between P(LSF>CD) and Cross-Island Individuals per Generation in the Process of Species Spreading From Mainland to Island
By establishing the direct relationship between the species ability to spread P(LSF>CD) and the average number of successful cross-island (spreading from mainland to island) individuals per generation (Figure 6), we found that when P(LSF > CD)< 0.004, almost no cross-island individuals would appear [When P(LSF>CD) = 0.004, the number of cross-island individuals per generation is predicted to be around 0.47, and the prediction lower and upper limit is (−16.8, 17.7); When P(LSF>CD) = 0.003, the predicted value is −0.53, and the prediction lower and upper limit is (−17.8, 16.7)]. Considering that the area of the habitat may directly affects the size of the species population and finally affect the dispersal efficiency of the species, we also performed the same regression analysis on data which species spreading from the island to the mainland (Supplementary Figure 6). The regression equation obtained is y = −3.73 + 1330x (p < 0.001 = 0.98). When P(LSF > CD)< 0.003, almost no cross-island individuals are generated. [When P(LSF>CD) = 0.003, the predicted value of the number of cross-island individuals is −0.26, and the prediction lower and upper limit is (−15.7, 16.2). When P(LSF>CD) = 0.002, the predicted value of the number of cross-island individuals is −1.07, and the prediction lower and upper limit is (−17.0, 14.9)].
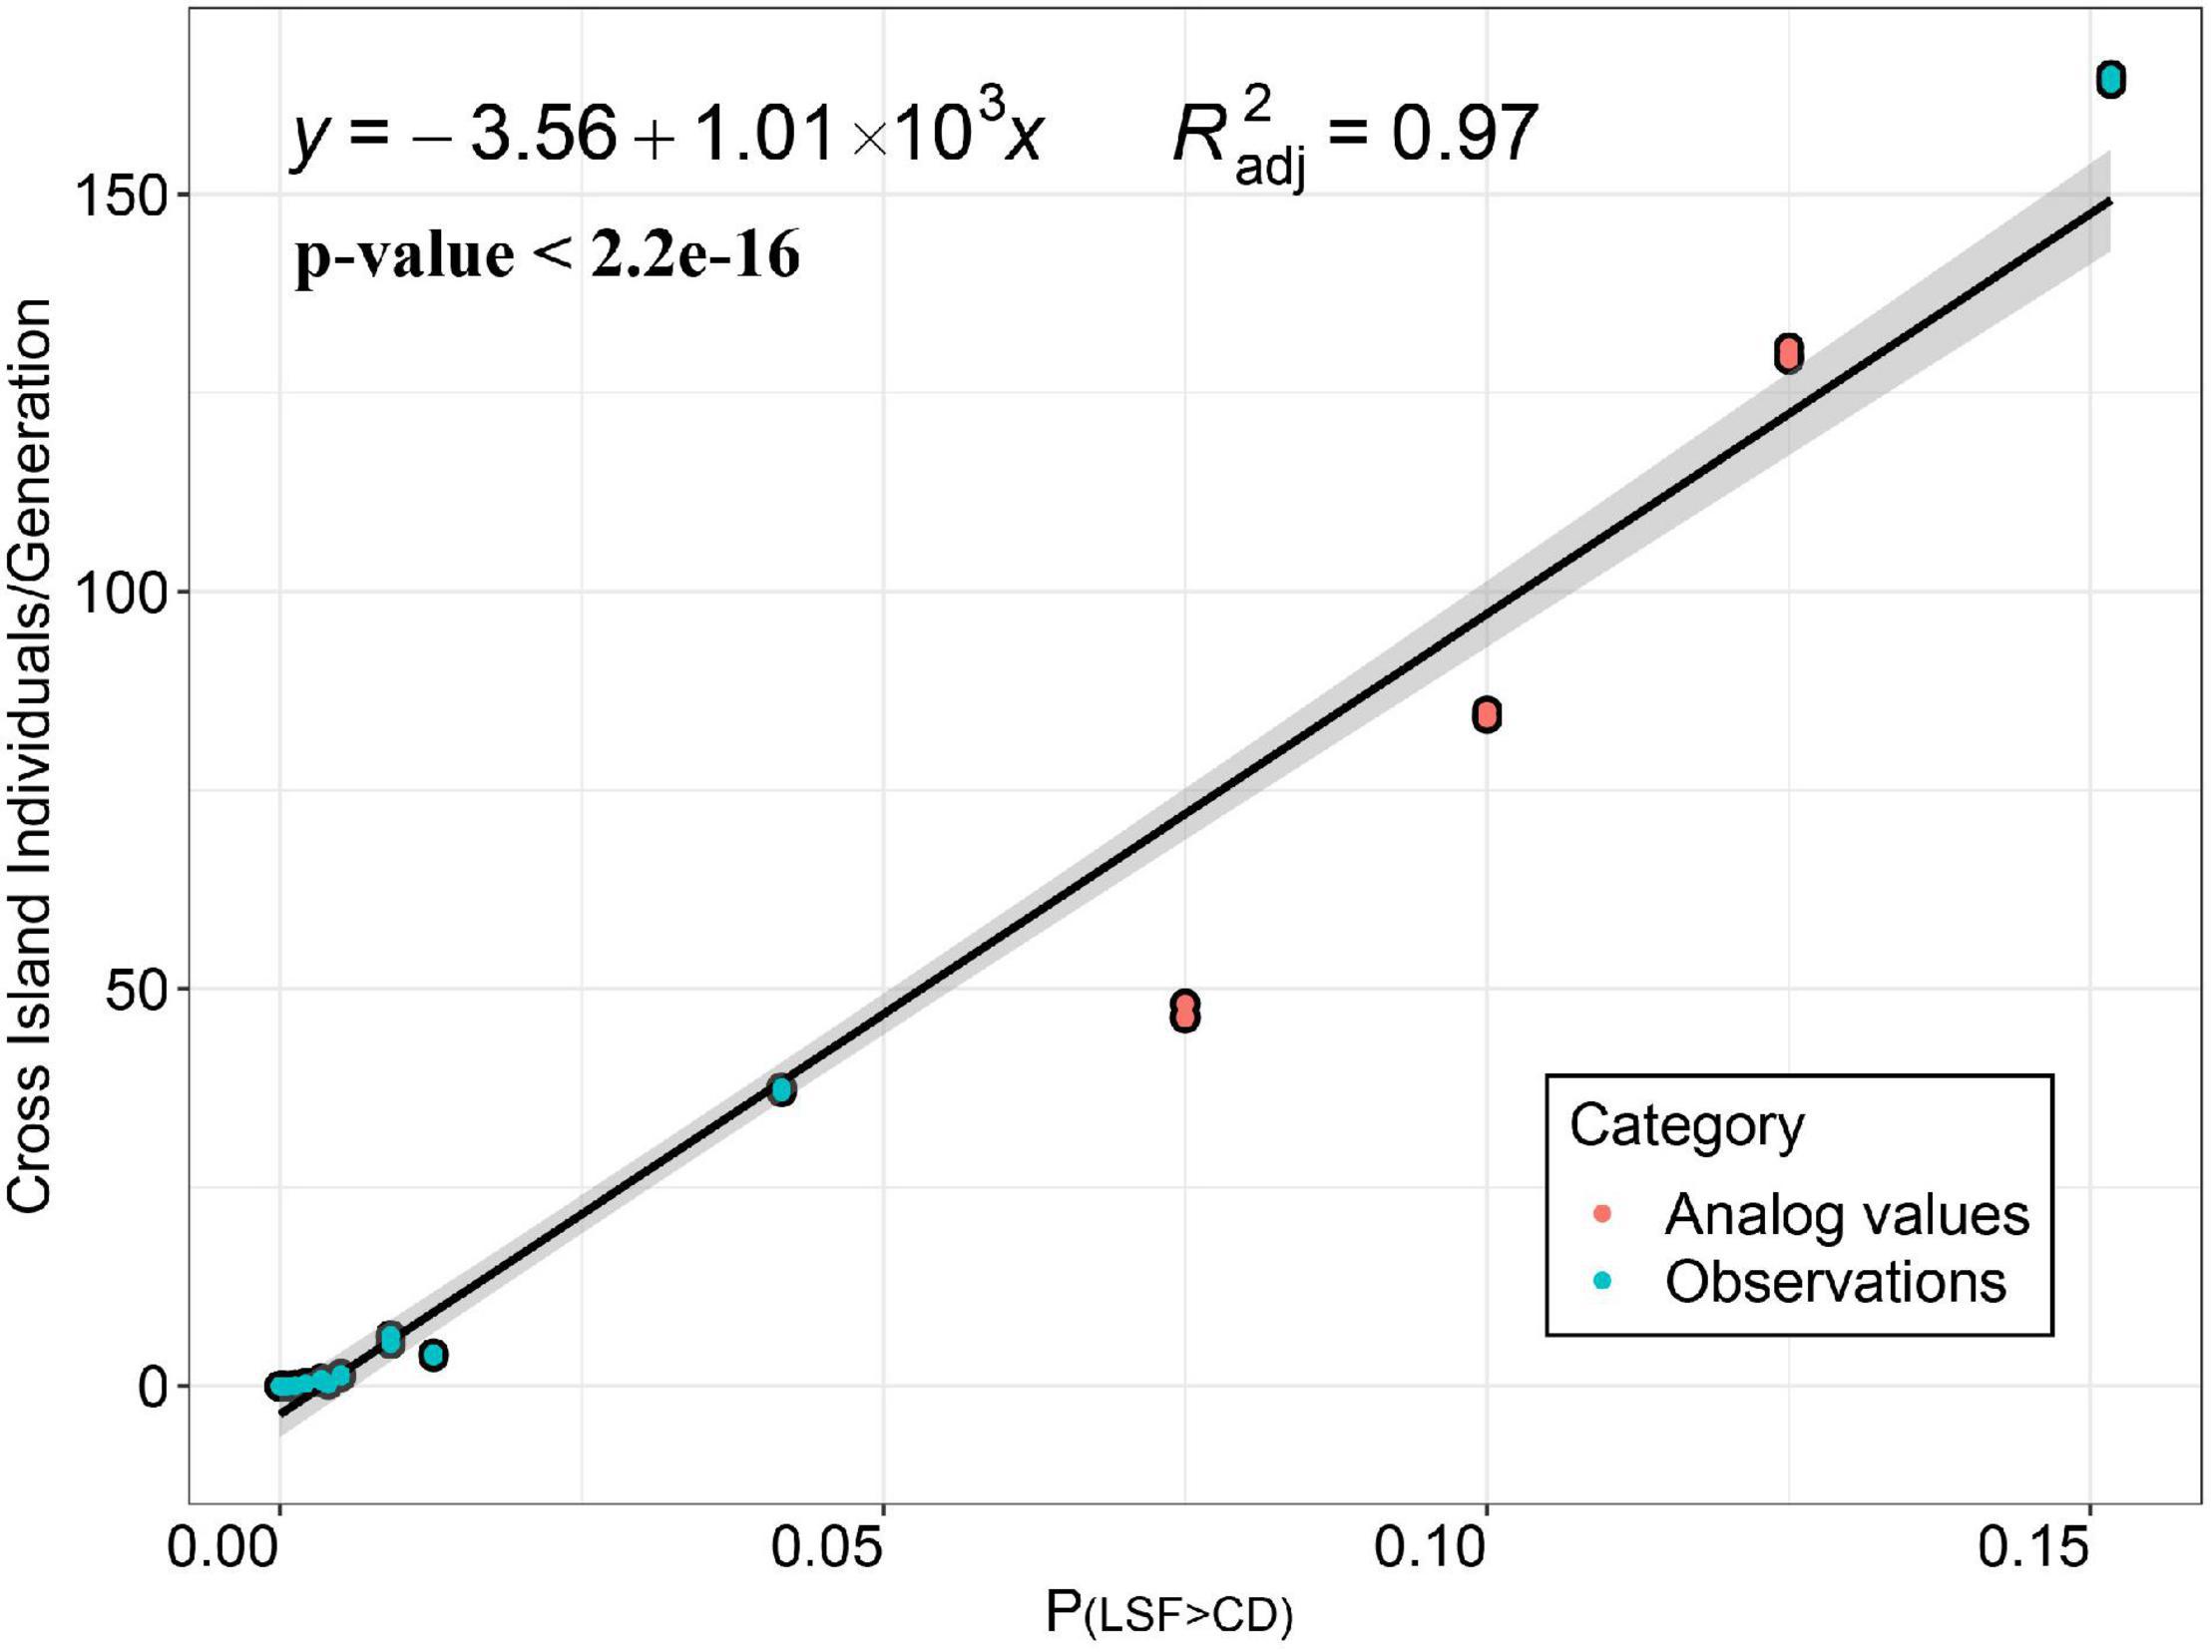
Figure 6. Simulation of the relationship between P(LSF>CD)) and cross-island individuals per generation in the process of species spreading from the mainland to island in 500 generations. Unary linear regression is shown in black and the CI is shown in gray. The blue points represent the P(LSF>CD) actually measured in the experiment (data come from measurements of 14 species), and the orange points represent the simulated point for supplementation (data come from simulation values of three hypothetical species). We repeated the simulation three times for each species. LSF, longest single flight; CD, closest distance.
Discussion
The Differences of Flight Abilities Among Seven Superfamilies of Lepidoptera
Previous studies on the flight ability of insects using a flight mill system mainly focused on agricultural pests (Hashiyama et al., 2013; Sappington and Burks, 2014; Hoddle and Hoddle, 2016; Fu et al., 2017a,b; Lopez et al., 2017; Babu et al., 2020). This study is the first to use a unified method to study the flight ability in Lepidoptera families and superfamilies to explore traits related to possible invasion and colonization ability. In this experiment, 1,142 specimens of seven Lepidoptera superfamilies were collected. In total 186 species had their flight ability measured in the experiment. Superfamily Geometroidea showed no significant difference with superfamily Lasiocampoidea but was significantly weaker than the other five superfamilies (Figures 1Ca–d). A total of 197 samples of superfamily Geometroidea were used for data analysis, accounting for 17.3% of the total samples, and only family Geometridae species are included in this superfamily. Geometrid moths are frequently flattened when in a static state, and the color of body and wing is often very similar to the surrounding environment. One of the best known Geometrid moths is the peppered moth (Biston betularia). The initial phenotype of this moth was speckled black and white, but industrialization in Britain and other regions in the nineteenth century increased the proportion of melanic individuals (Cook et al., 2012; Cook and Saccheri, 2013). This change in the main color-form as a consequence of selective predation is still considered as an example of the rapid evolution as a consequence of natural selection in a changing environment, which is driven by selective predation (Cook et al., 2012; Cook and Saccheri, 2013). Individuals of American peppered moth (Biston betularia) larvae are selected to match background color depending on their different host plants, and the slender shape makes them look more like branches, thereby using a similar approach to reduce predation (Noor et al., 2008; Eacock et al., 2017). Thus, the impact of selection on key traits is clear, but at least in this group, it does not require an ability to fly to escape predators, and conversely, the general body form of Geometrids may be expected to have a weaker flight performance.
Superfamily Drepanoidea had the highest in VTDF parameters (Figure 1Ca), which was faster than the other five superfamilies (with the exception of Lasiocampoidea). But at present, we know very little about this superfamily, with only a few omics studies about the social caterpillar Drepana arcuata from this superfamily (Yack et al., 2001; Yadav et al., 2020a,b), which provide no insights into flight performance. Superfamily Pyraloidea (family Pyralidae) showed the strongest LSF and TLSF in comparison to other superfamilies (Figures 1Cc,d), suggesting that it has high flight endurance. Superfamily Pyraloidea has the smallest body size in all samples collected in this study, such as the smallest BL, weight, and wing area. At present, there are too few comparative studies on the high taxonomic rank flight ability of Lepidoptera, but species-specific morphology is likely to be responsible for the differences found here.
Among 187 individuals belonging to superfamily Bombycoidea in this study, 171 individuals (∼91.4%) are from family Sphingidae and the remaining individuals are from family Saturniidae. The results show that the of Bombycoidea are significantly higher than those of the other five superfamilies (Figure 1Cb), possibly because superfamily Bombycoidea includes the family Sphingidae with the highest (Supplementary Figure 3). Our results prove that moths can have extensive niche differentiation, and two families with distant phylogenetic relationships (Figure 1B) may have similar flight abilities. Traits to escape predation are important, as Lepidoptera can account for more than 50% of the food of some insectivorous bats (Galan et al., 2018), and within this, Noctuidae can account for 50% of Lepidoptera species consumed (Zeale et al., 2011). Hawk moths (Lepidoptera, Bombycoidea, Sphingidae), Notodontidae, and Noctuidae (Lepidoptera and Noctuoidea) are more active and fly faster than most other moths. Large species with fat bodies may be particularly vulnerable to bats, such as many species in Sphingidae and Noctuidae, and need to be able to either fly fast or have other adaptations to reduce the risk of predation (Ntelezos et al., 2017; Rubin et al., 2018; Aiello et al., 2021). Hawk moths have the most aerodynamic body form of most moths, based on both wings and body morphology (Willmott and Ellington, 1997), which enables very high-speed short-distance flight.
Difference of Flight Capability of Moths Between Mainland and Island
Affectd by the environment of the habitats, different geographical populations may have different flight abilities, although LSF and TLSF have no statistically significant differences, the mean value of VTDF and VLSF in island are much higher than mainland [ratio span (island/mainland): LSF (1.90–4.03), TLSF (1.03–3.20), VTDF (0.71–1.45), VLSF (0.85−1.66)] (Figures 2A-D). We found that the same group (at family level) between mainland and island showed difference in flight ability. We speculate that the difference may be due to different species composition. Because most of the flight data of the same family at different sites are from different species. To test this hypothesis, we compared the data of common species [B. panterinaria (Geometridae), T. juno (Erebidae), and U. meticulodina (Notodontidae)] from the island (ZSDXG) and the mainland (HNYHG) (Figures 3A–D). U. metaculodina showed that the mean value of island individuals is lower than that of mainland individuals (ratio of mean value are 0.62 and 0.76 in LSF and TLSF, respectively). But the average values of LSF and TLSF in the samples of B. panterinaria and T. juno collected from islands are larger than those from mainland samples, although the difference was not statistically significant (ratios of mean value are 23.30 and 19.84 between parameters LSF and TLSF in species B. panterinaria and ratios are 2.00 and 2.30 between LSF and TLSF in T. juno). Based on the above results, we infer that islands may recruit more species with strong flight capacity (in parameter LSF and TLSF) than the mainland, which may expand differences in average of LSF and TLSF between mainland and island; moreover, prevalent wind current speed and direction are likely to influence this. The species found on both islands and continents show that island individuals have a weaker flight speed (VTDF&andVLSF) than continental individuals, which indicates that flight distance (LSF) may be more important for species ability to spread than flight speed.
Zhoushan Island is only separated from the mainland about 9,000 years ago due to the rising sea level caused by climate change (Wang, 1980). Zhoushan Island is the largest island in the Zhoushan Archipelago and is close (the shortest distance is only about 8.3 km) to the mainland. In such a short period of time and extremely similar natural environment, the same species may not have time to differentiate their flight abilities or adapt to local conditions, such as differing wind speeds. However, although 9,000 years is not enough for species differentiation, the level of gene flow in addition to environmental pressures depends on wing-traits that relate to flight ability. It is generally difficult to prove this through actual observation data for these small insects, but we have measured the flight parameters of a considerable number of species, so we can verify the possibility through the simulation.
The Simulation Reveals the Possible Dispersal Threshold
Our results show that L. muscosalis, the species with the largest LSF, has the highest number of cross-island generations and the highest number of cross-island individuals per generation in 500 generations. With the decrease of species dispersal ability (P(LSF>CD)), the number of cross-island generations and the number of cross-island individuals in each generation decreased rapidly. However, it is interesting to note that the decline rate of the cross-island generations is slower than that of the number of cross-island individuals per generation. When the average number of cross-island individuals decreased from 166.6 to 6.6 (corresponding to the first four species with P(LSF>CD) value declined from 0.151 to 0.009 in Figure 4), the number of cross-island generations remained at a high level (495–487). When P(LSF>CD) decreased from 0.005 to 0.0012 (From T. juno to A. major in Figure 4), the number of cross-island individuals was very low (from 1 to 2), and the number of cross-island generations decreased rapidly from 375 to 24. For the remaining species, there was almost no cross-island migration within 500 generations, and the P(LSF>CD) dropped to less than 0.0006.
Regression analysis also shows that when P(LSF>CD) drops below 0.004 (obtained from the simulation of spreading from the mainland to the island) and 0.003 (obtained from the simulation of spreading from the island to the mainland), the species lose the ability to migrate over the sea (the predicted value of the number of individuals that successfully spread is less than 0) (Figure 6 and Supplementary Figure 6). Regardless of whether the species is spreading from the mainland to the island or from the island to the mainland, the requirements for P(LSF>CD) are relatively consistent. As long as a species can complete the spread from the mainland to the island (or from the island to the mainland), it may also be able to complete the reverse proliferation activity with the help of wind conditions. Our results showed that the flight ability of the individuals that successfully cross to or from the island is significantly stronger than that of the individuals that remain on the mainland (Figure 5). Similar results are also found in the simulation of species spreading from a small circle (island) to large circle (mainland) (Supplementary Figures 4, 5). We did not simulate whether individuals with strong flight ability would produce a larger proportion of offspring with strong flight ability (though it is likely to be heritable), but a study on Episyrphus balteatus (Diptera and Syrphidae) with migration behavior showed that the offspring of migrants in this species had higher flight activity than those of resident individuals (Dällenbach et al., 2018). The reality is far more complicated than the simulation. At present, we do not know how many of the species we collected from the island existed before Zhoushan Island separated from the mainland. Although the individuals successfully landing on the island from the mainland are all with stronger flying capability, the individuals from the islands that mate with them may be not strong enough, so they may could not produce offspring with strong flying capabilities. Molecular approaches would be needed to determine gene flow between mainland and island to determine how these populations interact and how many still show genetic connectivity to mainland populations. Furthermore, mainland individuals generally come from more diverse communities, so may be more competitive than species adapted to more depauperate island communities.
Factors Affecting the Spread of Lepidoptera Insects
The known factors that may affect the flight ability of Lepidoptera and other insects include sex and days post-eclosion. The effect of sex on flight ability varies between species. In Helicoverpa armigera (Lepidopera and Noctuidae), males have better flight abilities than females (Jyothi et al., 2021), while in Amyelois transitella (Lepidopera and Pyralidae) and Rhynchophorus ferrugineus (Coleoptera and Dryophthoridae), there is no sexual difference (Ávalos et al., 2014; Sappington and Burks, 2014). The flight capacity of newly emerged adults is weak in many groups, reaching the peak at 3 or 4 days post-eclosion (Tanaka and Yamanaka, 2009; Liu et al., 2011; Fu et al., 2017b).
In addition, how Lepidopterans determine the direction of flight is a longstanding question for researchers. Species, such as monarch butterflies (Reppert et al., 2016) and Bogong moths (Dreyer et al., 2018) are able to navigate using geomagnetic fields, time compensated sun compass, and identifying landmarks to determine migration routes. But the processes guiding short-distance dispersal are less well understood. Lepidoptera individuals need to determine the destination if they travel between islands and other landmasses, and many sensory cues are not available over water, and loss of energy and poor weather are more likely to cause death, though studies show that some species can detect polarized light, and this may impact navigation over extended distances. Recently, MacDonald et al. (2019) partly proved that butterflies rely on vision to detect patches of suitable habitats. Their research shows that individuals with normal vision are 30.1 times more likely to navigate to the target island after being released than those with induced flash blindness.
Limitations
Although we collected a large number of Lepidopteran samples from the field, it is almost impossible to identify the physiological state of each sample, and its performance on the flight mill depends greatly on the physiological state. This may be the main reason for the high variability for some measures within species in our study. According to the activity of insects during sampling, the low TDF may be caused by the discomfort of the tested insects caused by the flight mill or the weakening of the flight ability caused by human operation error, but these factors should not be responsible for consistent differences observed between samples from different species and localities. However, whether it is reasonable to filter data in this way remains to be verified. Whilst we changed the experimental duration in 2020, the four flight parameters used in our analysis are unlikely to have been impacted. In addition, the dispersal direction of individuals in our simulation is completely random, and MacDonald et al. (2019) also pointed out that this random flight null assumption tends to overestimate the proportion of successful dispersal of butterflies toward adjacent habitat patches (MacDonald et al., 2019).
Conclusion
Understanding colonization and invasion patterns of species and the traits responsible is critical both to understand species biogeography and to enable proactive management. Our results show that among the common Lepidoptera groups (at the level of superfamily or family), superfamily Geometroidea and family Geometroidae have the weakest flight ability, while Pyralidae has the strongest flight endurance. Additionally, we found that island species generally have higher LSF than mainland species, although we did not detect statistically significant differences in our data overall, clear patterns were observed in some species. The simulation results show that the stronger the flight ability is [in this study, the ratio (P(LSF>CD)) of the offspring whose LSF is greater than the shortest distance between islands is used to measure the flight ability], the species in coastal habitats are more likely to have successful cross-island dispersal, and when P(LSF>CD) is lower than 0.004, moths rarely spread between islands under natural conditions. If the habitat of the immigrating species is suitable for the survival of the immigrating species, it will be possible for the immigrating species to establish a population on the new island or continent. Overextended periods, with the immigration of species with strong flight abilities, islands are more likely to recruit species with stronger flight abilities.
Data Availability Statement
The original contributions presented in the study are included in the article/Supplementary Material, further inquiries can be directed to the corresponding author/s.
Author Contributions
ABZ and YXZ conceived and designed the experiments, wrote, reviewed, and edited the manuscript. AH and YW reviewed and edited the manuscript. YXZ, JXC, and HL performed the flight mill experiments. YXZ, YW, and BYD analyzed the data. YXZ, QRH, ZL, and XHL performed the computer simulations. All authors contributed substantially to this research.
Funding
This work was supported by the Natural Science Foundation of China (Grant Nos. 31772501 and 32170421), the China National Funds for Distinguished Young Scientists (Grant No. 31425023), Support Project of High-level Teachers in Beijing Municipal Universities (Grant No. IDHT20180518), and the Academy for Multidisciplinary Studies, Capital Normal University.
Conflict of Interest
The authors declare that the research was conducted in the absence of any commercial or financial relationships that could be construed as a potential conflict of interest.
Publisher’s Note
All claims expressed in this article are solely those of the authors and do not necessarily represent those of their affiliated organizations, or those of the publisher, the editors and the reviewers. Any product that may be evaluated in this article, or claim that may be made by its manufacturer, is not guaranteed or endorsed by the publisher.
Supplementary Material
The Supplementary Material for this article can be found online at: https://www.frontiersin.org/articles/10.3389/fevo.2021.771719/full#supplementary-material
Footnotes
References
Aiello, B. R., Tan, M., Bin Sikandar, U., Alvey, A. J., Bhinderwala, B., Kimball, K. C., et al. (2021). Adaptive shifts underlie the divergence in wing morphology in bombycoid moths. Proc. Biol. Sci. 288:20210677. doi: 10.1098/rspb.2021.0677
Ávalos, J. A., Martí-Campoy, A., and Soto, A. (2014). Study of the flying ability of Rhynchophorus ferrugineus (Coleoptera: Dryophthoridae) adults using a computer-monitored flight mill. Bull. Entomol. Res. 104, 462–470. doi: 10.1017/S0007485314000121
Babu, A., Del Pozo-Valdivia, A. I., and Reisig, D. D. (2020). Baseline flight potential of Euschistus servus (Hemiptera: Pentatomidae) and its implications on local dispersal. Environ. Entomol. 49, 699–708. doi: 10.1093/ee/nvaa041
Chang, K. (2018). Studies on the Relationship Between Flight Ability and Morphological Trait of Moths in the Field of Mount Dongling, Beijing (Insecta: Lepidoptera). [Dissertation/Master’s Thesis]. Beijing: Capital Normal University
Chapman, J. W., Reynolds, D. R., Hill, J. K., Sivell, D., Smith, A. D., and Woiwod, I. P. (2008a). A seasonal switch in compass orientation in a high-flying migrant moth. Curr. Biol. 18, 908–909. doi: 10.1016/j.cub.2008.08.014
Chapman, J. W., Reynolds, D. R., Mouritsen, H., Hill, J. K., Riley, J. R., Sivell, D., et al. (2008b). Wind selection and drift compensation optimize migratory pathways in a high-flying moth. Curr. Biol. 18, 514–518. doi: 10.1016/j.cub.2008.02.080
Chattopadhyay, P., Banerjee, G., and Mukherjee, S. (2017). Recent trends of modern bacterial insecticides for pest control practice in integrated crop management system. Biotech 7:60. doi: 10.1007/s13205-017-0717-6
Combes, S. A., Crall, J. D., and Mukherjee, S. (2010). Dynamics of animal movement in an ecological context: dragonfly wing damage reduces flight performance and predation success. Biol. Lett. 6, 426–429. doi: 10.1098/rsbl.2009.0915
Common, I. F. B. (1954). A study of the ecology of the adult bogong moth, Agrotis infusa (Boisd)(Lepidoptera: Noctuidae), with special reference to its behaviour during migration and aestivation. Aust. J. Zool. 2, 223–263. doi: 10.1071/ZO9540223
Cook, L. M., Grant, B. S., Saccheri, I. J., and Mallet, J. (2012). Selective bird predation on the peppered moth: the last experiment of Michael Majerus. Biol. Lett. 8, 609–612. doi: 10.1098/rsbl.2011.1136
Cook, L. M., and Saccheri, I. J. (2013). The peppered moth and industrial melanism: evolution of a natural selection case study. Heredity 110, 207–212. doi: 10.1038/hdy.2012.92
Dällenbach, L. J., Glauser, A., Lim, K. S., Chapman, J. W., and Menz, M. H. (2018). Higher flight activity in the offspring of migrants compared to residents in a migratory insect. Proc. Biol. Sci. 285, 20172829. doi: 10.5061/dryad.44hc2
Dreyer, D., Frost, B., Mouritsen, H., Günther, A., Green, K., Whitehouse, M., et al. (2018). The Earth’s magnetic field and visual landmarks steer migratory flight behavior in the nocturnal Australian Bogong moth. Curr. Biol. 28, 2160–2166. doi: 10.1016/j.cub.2018.05.030
Eacock, A., Rowland, H. M., Edmonds, N., and Saccheri, I. J. (2017). Colour change of twig-mimicking peppered moth larvae is a continuous reaction norm that increases camouflage against avian predators. PeerJ 5:e3999. doi: 10.7717/peerj.3999
Folmer, O., Black, M., Hoeh, W., Lutz, R., and Vrijenhoek, R. (1994). DNA primers for amplification of mitochondrial cytochrome c oxidase subunit I from diverse metazoan invertebrates. Mol. Mar. Biol. Biotechnol. 3, 294–299.
Fu, X. W., Chang, H., He, L. M., Zhao, S. Y., and Wu, K. M. (2017a). Flight performance of Macdunnoughia crassisigna (Lepidoptera: Noctuidae). Bull. Entomol. Res. 107, 715–723. doi: 10.1017/s0007485317000232
Fu, X. W., Zhao, S., Li, C., Wu, X., Guo, J., and Wu, K. (2017b). Flight performance of Ctenoplusia agnata (Lepidoptera: Noctuidae). J. Econ. Entomol. 110, 986–994. doi: 10.1093/jee/tox080
Furlong, M. J., Wright, D. J., and Dosdall, L. M. (2013). Diamondback moth ecology and management: problems, progress, and prospects. Annu. Rev. Entomol. 58, 517–541. doi: 10.1146/annurev-ento-120811-153605
Galan, M., Pons, J. B., Tournayre, O., Pierre, E., Leuchtmann, M., Pontier, D., et al. (2018). Metabarcoding for the parallel identification of several hundred predators and their prey: application to bat species diet analysis. Mol. Ecol. Resour. 18, 474–489. doi: 10.1111/1755-0998.12749
Gustafsson, K. M., Agrawal, A. A., Lewenstein, B. V., and Wolf, S. A. (2015). The monarch butterfly through time and space: the social construction of an icon. BioScience 65, 612–622. doi: 10.1093/biosci/biv045
Hao, M., Jin, Q., Meng, G., Yang, C., Yang, S., Shi, Z., et al. (2020). Regional assemblages shaped by historical and contemporary factors: Evidence from a species-rich insect group. Mol. Ecol. 29, 2492–2510. doi: 10.1111/mec.15412
Hashiyama, A., Nomura, M., Kurihara, J., and Toyoshima, G. (2013). Laboratory evaluation of the flight ability of female Autographa nigrisigna (Lepidoptera: Noctuidae), measured by actograph and flight mill. J. Econ. Entomol. 106, 690–694. doi: 10.1603/EC12272
Hoddle, M. S., and Hoddle, C. D. (2016). How far can the palm weevil, Rhynchophorus vulneratus (Coleoptera: Curculionidae), fly? J. Econ. Entomol. 109, 629–636. doi: 10.1093/jee/tov402
Hoddle, M. S., Hoddle, C. D., Faleiro, J. R., El-Shafie, H. A. F., Jeske, D. R., and Sallam, A. A. (2015). How far can the red palm weevil (Coleoptera: Curculionidae) fly?: computerized flight mill studies with field-captured weevils. J. Econ. Entomol. 108, 2599–2609. doi: 10.1093/jee/tov240
Hudgins, E. J., Liebhold, A. M., and Leung, B. (2017). Predicting the spread of all invasive forest pests in the United States. Ecol. Lett. 20, 426–435. doi: 10.1111/ele.12741
Jantzen, B., and Eisner, T. (2008). Hindwings are unnecessary for flight but essential for execution of normal evasive flight in Lepidoptera. Proc. Natl. Acad. Sci. U.S.A. 105, 16636–16640. doi: 10.1073/pnas.0807223105
Jia, X. (2019). A Preliminary Comparison of the Flight Abilities of Moths (Lepidoptera) in Different Habitats of Islands and Continents. [Dissertation/Master’s Thesis]. Beijing: Capital Normal University.
Jiang, C. (2018). The Comparison of Flight Parameters of Common Lepidoptera in DongLing Mountain area of Beijing. [Dissertation/Master’s Thesis]. Beijing: Capital Normal University.
Jones, H. B., Lim, K. S., Bell, J. R., Hill, J. K., and Chapman, J. W. (2016). Quantifying interspecific variation in dispersal ability of noctuid moths using an advanced tethered flight technique. Ecol. Evol. 6, 181–190. doi: 10.1002/ece3.1861
Jyothi, P., Aralimarad, P., Wali, V., Dave, S., Bheemanna, M., Ashoka, J., et al. (2021). Evidence for facultative migratory flight behavior in Helicoverpa armigera (Noctuidae: Lepidoptera) in India. PLoS One 16:e0245665. doi: 10.1371/journal.pone.0245665
Liu, Z., McNeil, J. N., and Wu, K. (2011). Flight mill performance of the lacewing Chrysoperla sinica (Neuroptera: Chrysopidae) as a function of age, temperature, and relative humidity. J. Econ Entomol. 104, 94–100.
Lopez, V. M., Hoddle, M. S., Francese, J. A., Lance, D. R., and Ray, A. M. (2017). Assessing flight potential of the invasive Asian longhorned beetle (Coleoptera: Cerambycidae) with computerized flight mills. J. Econ. Entomol. 110, 1070–1077. doi: 10.1093/jee/tox046
MacDonald, Z. G., Acorn, J. H., Zhang, J., and Nielsen, S. E. (2019). Perceptual range, targeting ability, and visual habitat detection by greater fritillary butterflies Speyeria cybele (Lepidoptera: Nymphalidae) and Speyeria atlantis. J. Insect. Sci. 19:1. doi: 10.1093/jisesa/iez060
Menchetti, M., Guéguen, M., and Talavera, G. (2019). Spatio-temporal ecological niche modelling of multigenerational insect migrations. Proc. Biol. Sci. 286:20191583. doi: 10.1098/rspb.2019.1583
Nathan, R., Schurr, F. M., Spiegel, O., Steinitz, O., Trakhtenbrot, A., and Tsoar, A. (2008). Mechanisms of long-distance seed dispersal. Trends Ecol. Evol. 23, 638–647. doi: 10.1016/j.tree.2008.08.003
Noor, M. A., Parnell, R. S., and Grant, B. S. (2008). A reversible color polyphenism in American peppered moth (Biston betularia cognataria) caterpillars. PLoS One 3:e3142. doi: 10.1371/journal.pone.0003142
Ntelezos, A., Guarato, F., and Windmill, J. F. (2017). The anti-bat strategy of ultrasound absorption: the wings of nocturnal moths (Bombycoidea: Saturniidae) absorb more ultrasound than the wings of diurnal moths (Chalcosiinae: Zygaenoidea: Zygaenidae). Biol. Open 6, 109–117. doi: 10.1242/bio.021782
Panian, J., and Wiltschko, D. (2004). Ramp initiation in a thrust wedge. Nat. 427, 624–627. doi: 10.1038/nature02334
Pearl, R., and Slobodkin, L. (1976). The growth of populations. Q. Rev. Biol. 51, 6–24. doi: 10.1086/394288
R Core Team (2021). R: A Language and Environment for Statistical Computing. Vienna, Austria: R Foundation for Statistical Computing. Available online at: https://www.R-project.org
Ratnasingham, S., and Hebert, P. D. (2007). BARCODING: bold: the barcode of life data system (http://www.barcodinglife.org). Mol. Ecol. Notes 7, 355–364.
Reppert, S. M., Guerra, P. A., and Merlin, C. (2016). Neurobiology of monarch butterfly migration. Annu. Rev. Entomol. 61, 25–42. doi: 10.1146/annurev-ento-010814-020855
Rivero, A., Giron, D., and Casas, J. (2001). Lifetime allocation of juvenile and adult nutritional resources to egg production in a holometabolous insect. Proc. R. Soc. Lond. B Biol. Sci. 268, 1231–1237. doi: 10.1098/rspb.2001.1645
Rubin, J. J., Hamilton, C. A., McClure, C. J., Chadwell, B. A., Kawahara, A. Y., and Barber, J. R. (2018). The evolution of anti-bat sensory illusions in moths. Sci. Adv. 4:eaar7428. doi: 10.1126/sciadv.aar7428
Sappington, T. W., and Burks, C. S. (2014). Patterns of flight behavior and capacity of unmated navel orangeworm (Lepidoptera: Pyralidae) adults related to age, gender, and wing size. Environ. Entomol. 43, 696–705. doi: 10.1603/EN13279
Stork, N. E. (2018). How many species of insects and other terrestrial arthropods are there on earth? Annu. Rev. Entomol. 63, 31–45. doi: 10.1146/annurev-ento-020117-043348
Tanaka, K., and Yamanaka, T. (2009). Factors affecting flight activity of Ophraella communa (Coleoptera: Chrysomelidae), an exotic insect in Japan. Environ. Entomol. 38, 235–241. doi: 10.1603/022.038.0129
Telang, A., Li, Y., Noriega, F. G., and Brown, M. R. (2006). Effects of larval nutrition on the endocrinology of mosquito egg development. J. Exp Biol. 209, 645–655. doi: 10.1242/jeb.02026
Tihelka, E., Cai, C., Giacomelli, M., Lozano-Fernandez, J., Rota-Stabelli, O., Huang, D., et al. (2021). The evolution of insect biodiversity. Curr. Biol. 31, R1299–R1311.
Triant, D. A., Cinel, S. D., and Kawahara, A. Y. (2018). Lepidoptera genomes: current knowledge, gaps and future directions. Curr. Opin. Insect. Sci. 25, 99–105. doi: 10.1016/j.cois.2017.12.004
Wang, J. (1980). The relationship between sea level rising and climate change on east of China (in Chinese with English abstract). Chin. J. Geogr. 35, 299–313.
Warrant, E., Frost, B., Green, K., Mouritsen, H., Dreyer, D., Adden, A., et al. (2016). The Australian Bogong moth Agrotis infusa: a long-distance nocturnal navigator. Front. Behav. Neurosci. 10:77. doi: 10.3389/fnbeh.2016.00077
Whittaker, R. J., Fernández-Palacios, J. M., Matthews, T. J., Borregaard, M. K., and Triantis, K. A. (2017). Island biogeography: taking the long view of nature’s laboratories. Science 357:eaam8326. doi: 10.1126/science.aam8326
Willmott, A. P., and Ellington, C. P. (1997). The mechanics of flight in the hawkmoth Manduca sexta. II. Aerodynamic consequences of kinematic and morphological variation. J. Exp. Biol. 200, 2723–2745.
Yack, J. E., Smith, M. L., and Weatherhead, P. J. (2001). Caterpillar talk: acoustically mediated territoriality in larval Lepidoptera. Proc. Natl. Acad. Sci. U.S.A. 98, 11371–11375. doi: 10.1073/pnas.191378898
Yadav, C., Smith, M., Ogunremi, D., and Yack, J. (2020a). Draft genome assembly and annotation of the masked birch caterpillar, Drepana arcuata (Lepidoptera: Drepanoidea). Data Brief. 33:106531. doi: 10.1016/j.dib.2020.106531
Yadav, C., Smith, M. L., and Yack, J. E. (2020b). Transcriptome analysis of a social caterpillar, Drepana arcuata: de novo assembly, functional annotation and developmental analysis. PLoS One 15:e0234903. doi: 10.1371/journal.pone.0234903
Yang, C., Han, H., Chi, M., Jin, Q., Wu, C., Zhu, C., et al. (2012). Species identification of Noctuidae moths (Insecta: Lepidoptera) from Baihuashan, Beijing, China with DNA barcoding. Acta Entomol. Sin. 55, 1082–1092.
Zeale, M. R., Butlin, R. K., Barker, G. L., Lees, D. C., and Jones, G. (2011). Taxon-specific PCR for DNA barcoding arthropod prey in bat faeces. Mol. Ecol. Resour. 11, 236–244. doi: 10.1111/j.1755-0998.2010.02920.x
Keywords: lepidoptera, flight ability, flight mill, cross-island dispersal, simulation
Citation: Zheng Y-X, Wang Y, Dai B-Y, Li Z, Huo Q-R, Cui J-X, Liu H, Li X-H, Hughes AC and Zhang A-B (2021) Flight Mill Experiments and Computer Simulations Indicate Islands Recruit More Capable Flyers of Moths. Front. Ecol. Evol. 9:771719. doi: 10.3389/fevo.2021.771719
Received: 07 September 2021; Accepted: 28 October 2021;
Published: 10 December 2021.
Edited by:
Gengping Zhu, Tianjin Normal University, ChinaReviewed by:
Lloyd W. Morrison, Missouri State University, United StatesXiaolei Huang, Fujian Agriculture and Forestry University, China
Copyright © 2021 Zheng, Wang, Dai, Li, Huo, Cui, Liu, Li, Hughes and Zhang. This is an open-access article distributed under the terms of the Creative Commons Attribution License (CC BY). The use, distribution or reproduction in other forums is permitted, provided the original author(s) and the copyright owner(s) are credited and that the original publication in this journal is cited, in accordance with accepted academic practice. No use, distribution or reproduction is permitted which does not comply with these terms.
*Correspondence: Ai-bing Zhang, emhhbmdhYjIwMDhAY251LmVkdS5jbg==
†These authors have contributed equally to this work