
94% of researchers rate our articles as excellent or good
Learn more about the work of our research integrity team to safeguard the quality of each article we publish.
Find out more
ORIGINAL RESEARCH article
Front. Ecol. Evol. , 05 January 2022
Sec. Conservation and Restoration Ecology
Volume 9 - 2021 | https://doi.org/10.3389/fevo.2021.771439
This article is part of the Research Topic Grassland Conservation in Asia: Sustainability Under Climate Change View all 28 articles
 Huilong Lin*
 Yuting Zhao
The source park of the Yellow River (SPYR), as a vital ecological shelter on the Qinghai-Tibetan Plateau, is suffering different degrees of degradation and desertification, resulting in soil erosion in recent decades. Therefore, studying the mechanism, influencing factors and current situation of soil erosion in the alpine grassland ecosystems of the SPYR are significant for protecting the ecological and productive functions. Based on the 137Cs element tracing technique and machine learning algorithms, five strategic variable selection algorithms based on machine learning algorithms are used to identify the minimal optimal set and analyze the main factors that influence soil erosion in the SPYR. The optimal model for estimating soil erosion in the SPYR is obtained by comparisons model outputs between the RUSLE and machine learning algorithms combined with variable selection models. We identify the spatial distribution pattern of soil erosion in the study area by the optimal model. The results indicated that: (1) A comprehensive set of variables is more objective than the RUSLE model. In terms of verification accuracy, the simulated annealing -Cubist model (R = 0.67, RMSD = 1,368 t km–2⋅a–1) simulation results represents the best while the RUSLE model (R = 0.49, RMSD = 1,769 t⋅km–2⋅a–1) goes on the worst. (2) The soil erosion is more severe in the north than the southeast of the SPYR. The average erosion modulus is 6,460.95 t⋅km–2⋅a–1 and roughly 99% of the survey region has an intensive erosion modulus (5,000–8,000 t⋅km–2⋅a–1). (3) Total erosion loss is relatively 8.45⋅108 t⋅a–1 in the SPYR, which is commonly 12.64 times greater than the allowable soil erosion loss. The economic monetization of SOC loss caused by soil erosion in the entire research area was almost $47.90 billion in 2014. These results will help provide scientific evidences not only for farmers and herdsmen but also for environmental science managers and administrators. In addition, a new ecological policy recommendation was proposed to balance grassland protection and animal husbandry economic production based on the value of soil erosion reclassification.
The Qinghai-Tibetan Plateau is acknowledged as the “Third Pole” and has received an increasing attention toward ecological and environmental concerns (Yao et al., 2012; Madsen, 2016). The source park of the Yellow River (SPYR), located in the North-Eastern range of the Qinghai-Tibetan Plateau, is a dynamic ecological shelter and is one of the most vulnerable ecological zones in the world (Meng et al., 2016). Because of the conservation of water bodies and provision of water resources to both communities and adjacent areas, the SPYR is recognized as the “Water Tower of the Yellow River” (Ge et al., 2018; Wu et al., 2018). The main part of the SPYR is covered by alpine grassland. The alpine grasslands in the SPYR not only plays an exceptional role in ecological functions such as water conservation, biodiversity protection, and carbon fixation (Harris, 2010), but also play critical roles in livestock production, representing the main sources of income for local pastoralists. However, nearly 90% of this alpine grassland suffers different degrees of degradation and desertification due to climate change, global warming and anthropological activities (Evans, 2005; Fassnacht et al., 2015; Mariano et al., 2018). Portions of the grasslands are experiencing moderate and severe degradation, 40.8 and 17.58%, respectively (Miehe et al., 2019) and a direct soil erosion is also resulted in recent decades (Yao et al., 2016). This erosion not only reduces soil fertility and pollutes water resources but also responsible for sediment accumulation, river obstructions, downstream flooding and flow patterns (Evans et al., 2017). Consequently, exploring the mechanism, influencing factors, and current situation of soil erosion in the alpine grassland ecosystems of the SPYR is significant for protecting the ecological and productive functions.
Soil erosion is a complicated process that depends on soil properties, ground slope, vegetation, freeze/thawing, wind erosivity, and rainfall/precipitation volume and intensity (Li et al., 2018; Zhang et al., 2019). Soil erosion research is generally conducted by field observations (Mhazo et al., 2016; Li et al., 2018; Zeng et al., 2018), tracer studies (Jia et al., 2016; Wang et al., 2017), experimental operations (Zhang et al., 2019) and soil erosion simulations (Konz et al., 2012). 137Cs is an anthropogenic radioisotope, which has been widely used to quantify soil erosion at the Spatio-Temporal scale, and to calibrate or validate the erosion models (Li et al., 2021). Conventional experimental methods can be easily applied to small-scale studies, such as research at the patch scale and slope scale (Bakker et al., 2005), and the results help to investigate the potential occurrence of soil erosion (Teng et al., 2018). However, traditional experimental methods are labor-intensive, expensive, and difficult to apply in large-scale research (Efthimiou, 2018). Therefore, model simulation is a convenient method for studying large-scale soil erosion and is commonly applied in such research fields (Abdelwahab et al., 2018; Starkloff et al., 2018). The earliest soil erosion model [the universal soil loss equation (USLE)] was established by Wischmeier and Smith (1958). It is widely reported that erosion plot data collected in United States have been used to develop and calibrate the Revised Universal Soil Loss Equation (RUSLE), which was further used to estimate global soil erosion (Doetterl et al., 2012; Prasannakumar et al., 2012), and it can provide valuable input for the SPYR as well as China, based on the challenge of sustainable grassland resource uses. In addition, various physical models of soil erosion processes have also been established in recent years, including the Water Erosion Prediction Project (WEPP) model (Kinnell, 2017), Revised Wind Erosion Equation (RWEQ) (Teng et al., 2021), European soil erosion model (EUROSEM) (Veihe et al., 2001), Limburg soil erosion model (LISM) and soil erosion model of Mediterranean regions (SEMMED) (De Jong et al., 1999). However, these models are derived from specific scientific concerns and applicable to certain regions. The factors related to the specific alpine grassland grazing ecosystem of the SPYR in the Qinghai-Tibetan Plateau, such as freeze/thaw cycles, grazing-induced erosion (Evans, 2005; Lin et al., 2008), wind erosion, and human activities, have not been considered in the soil erosion process (Gourfi et al., 2018). Therefore, it is unreasonable to use these models in the present study because they may cause the prediction results to be biased or inaccurate for this region.
With the development of “3s” technologies [geographic information system (GIS), remote sensing (RS), a global positioning system (GPS)], it is possible to identify comprehensive environmental variables to characterize soil erosion (Gholami et al., 2018). Thus, a comprehensive set of soil erosion variables can be integrated, including meteorological, soil, topography, vegetation, and management variables. A strategic variable screening process was developed to avoid redundancy and collinearities between variables to determine the minimal-optimal set for developing simulation models by a machine learning algorithm (Xiong et al., 2014). A machine learning algorithm is a process used to fit a model to a dataset through training or learning (Willcock et al., 2018). Many types of machine learning algorithms have been used extensively in determining soil characteristics, such as soil organic carbon (SOC), soil nutrient content, and soil parent material (Heung et al., 2016; Zhi et al., 2018). However, innovative research on soil erosion based on multiple machine learning algorithms is rare, especially in the alpine grassland ecosystem of the SPYR. In this study, five strategic variable selection algorithms based on machine learning algorithms, namely, the Boruta all-relevant (BOR), simulated annealing (SA), genetic algorithm (GA), recursive features elimination (RFE), and univariate filters (UF), are used to identify the minimal-optimal set (You et al., 2014; Hosseini et al., 2016; Yang R. M. et al., 2016; Li and Ma, 2018). Compared to logistic regression, bivariate and multivariate statistical models, several modern machine learning approaches such as the generalized linear model (GLM), cubist model (cubist), random forest model (RFM), and boosting tree (BST) model can overcome the obstacles of spatial modeling in the field of soil erosion assessment (Gayen et al., 2019) and achieve a higher prediction accuracy (Marjanoviæ et al., 2011; Micheletti et al., 2013). Hence the GLM, cubist, RFM, and BST model would be adopted to estimate soil erosion, and a cross-comparison of those models can be performed (Li et al., 2017; Chang et al., 2018; Peng et al., 2018; Wang et al., 2019).
The objectives of this study were to (1) Categorize the soil erosion parameters set, screened by the machine learning method and analyze the main factors that influence soil erosion in the SPYR. (2) Determine the optimal model for estimating soil erosion in the SPYR that can be combined with specific environmental factors of the alpine grassland ecosystem of the SPYR. (3) Identify the spatial distribution pattern of soil erosion in the study area by the optimal prediction model. The soil erosion classification and direct economic losses caused by soil erosion enable farmers and policymakers to generate grassland management strategies with the expectation of profit and corresponding risk. These results will help to provide scientific direction for grassland protection, soil restoration and establishment of policy framework for ecological development in the SPYR.
SPYR (N32°02′–36°13′, E95°42′–102°17′) comprises an area of about 130,798 km2, and the area records for 35% of the total runoff of the Yellow River (Zheng et al., 2018). The elevation of the SPYR ranges from 2,052 to 6,227 m and descends from the Southwest to the Northeast (Figure 1). Topographic features and geographical situations pose an impact on the natural environment, with characteristics such as frost temperatures, intense diurnal temperatures, frequent seasonal rainfall, recurrent strong winds, and powerful solar radiation (Ge et al., 2017). Most of the study area has a typical continental plateau climate, with an average annual temperature ranging −4 and 2°C rising from Western to Eastern. Average annual rainfall ranges from 350 to 750 mm and is concentrated from June to September. The soil types are mainly alpine meadow soil and steppe soil. Alpine grassland accounts for 95.12% of the total area of the SPYR, and it includes alpine meadow at 83.12% and alpine steppe at 12% (Liang et al., 2016).
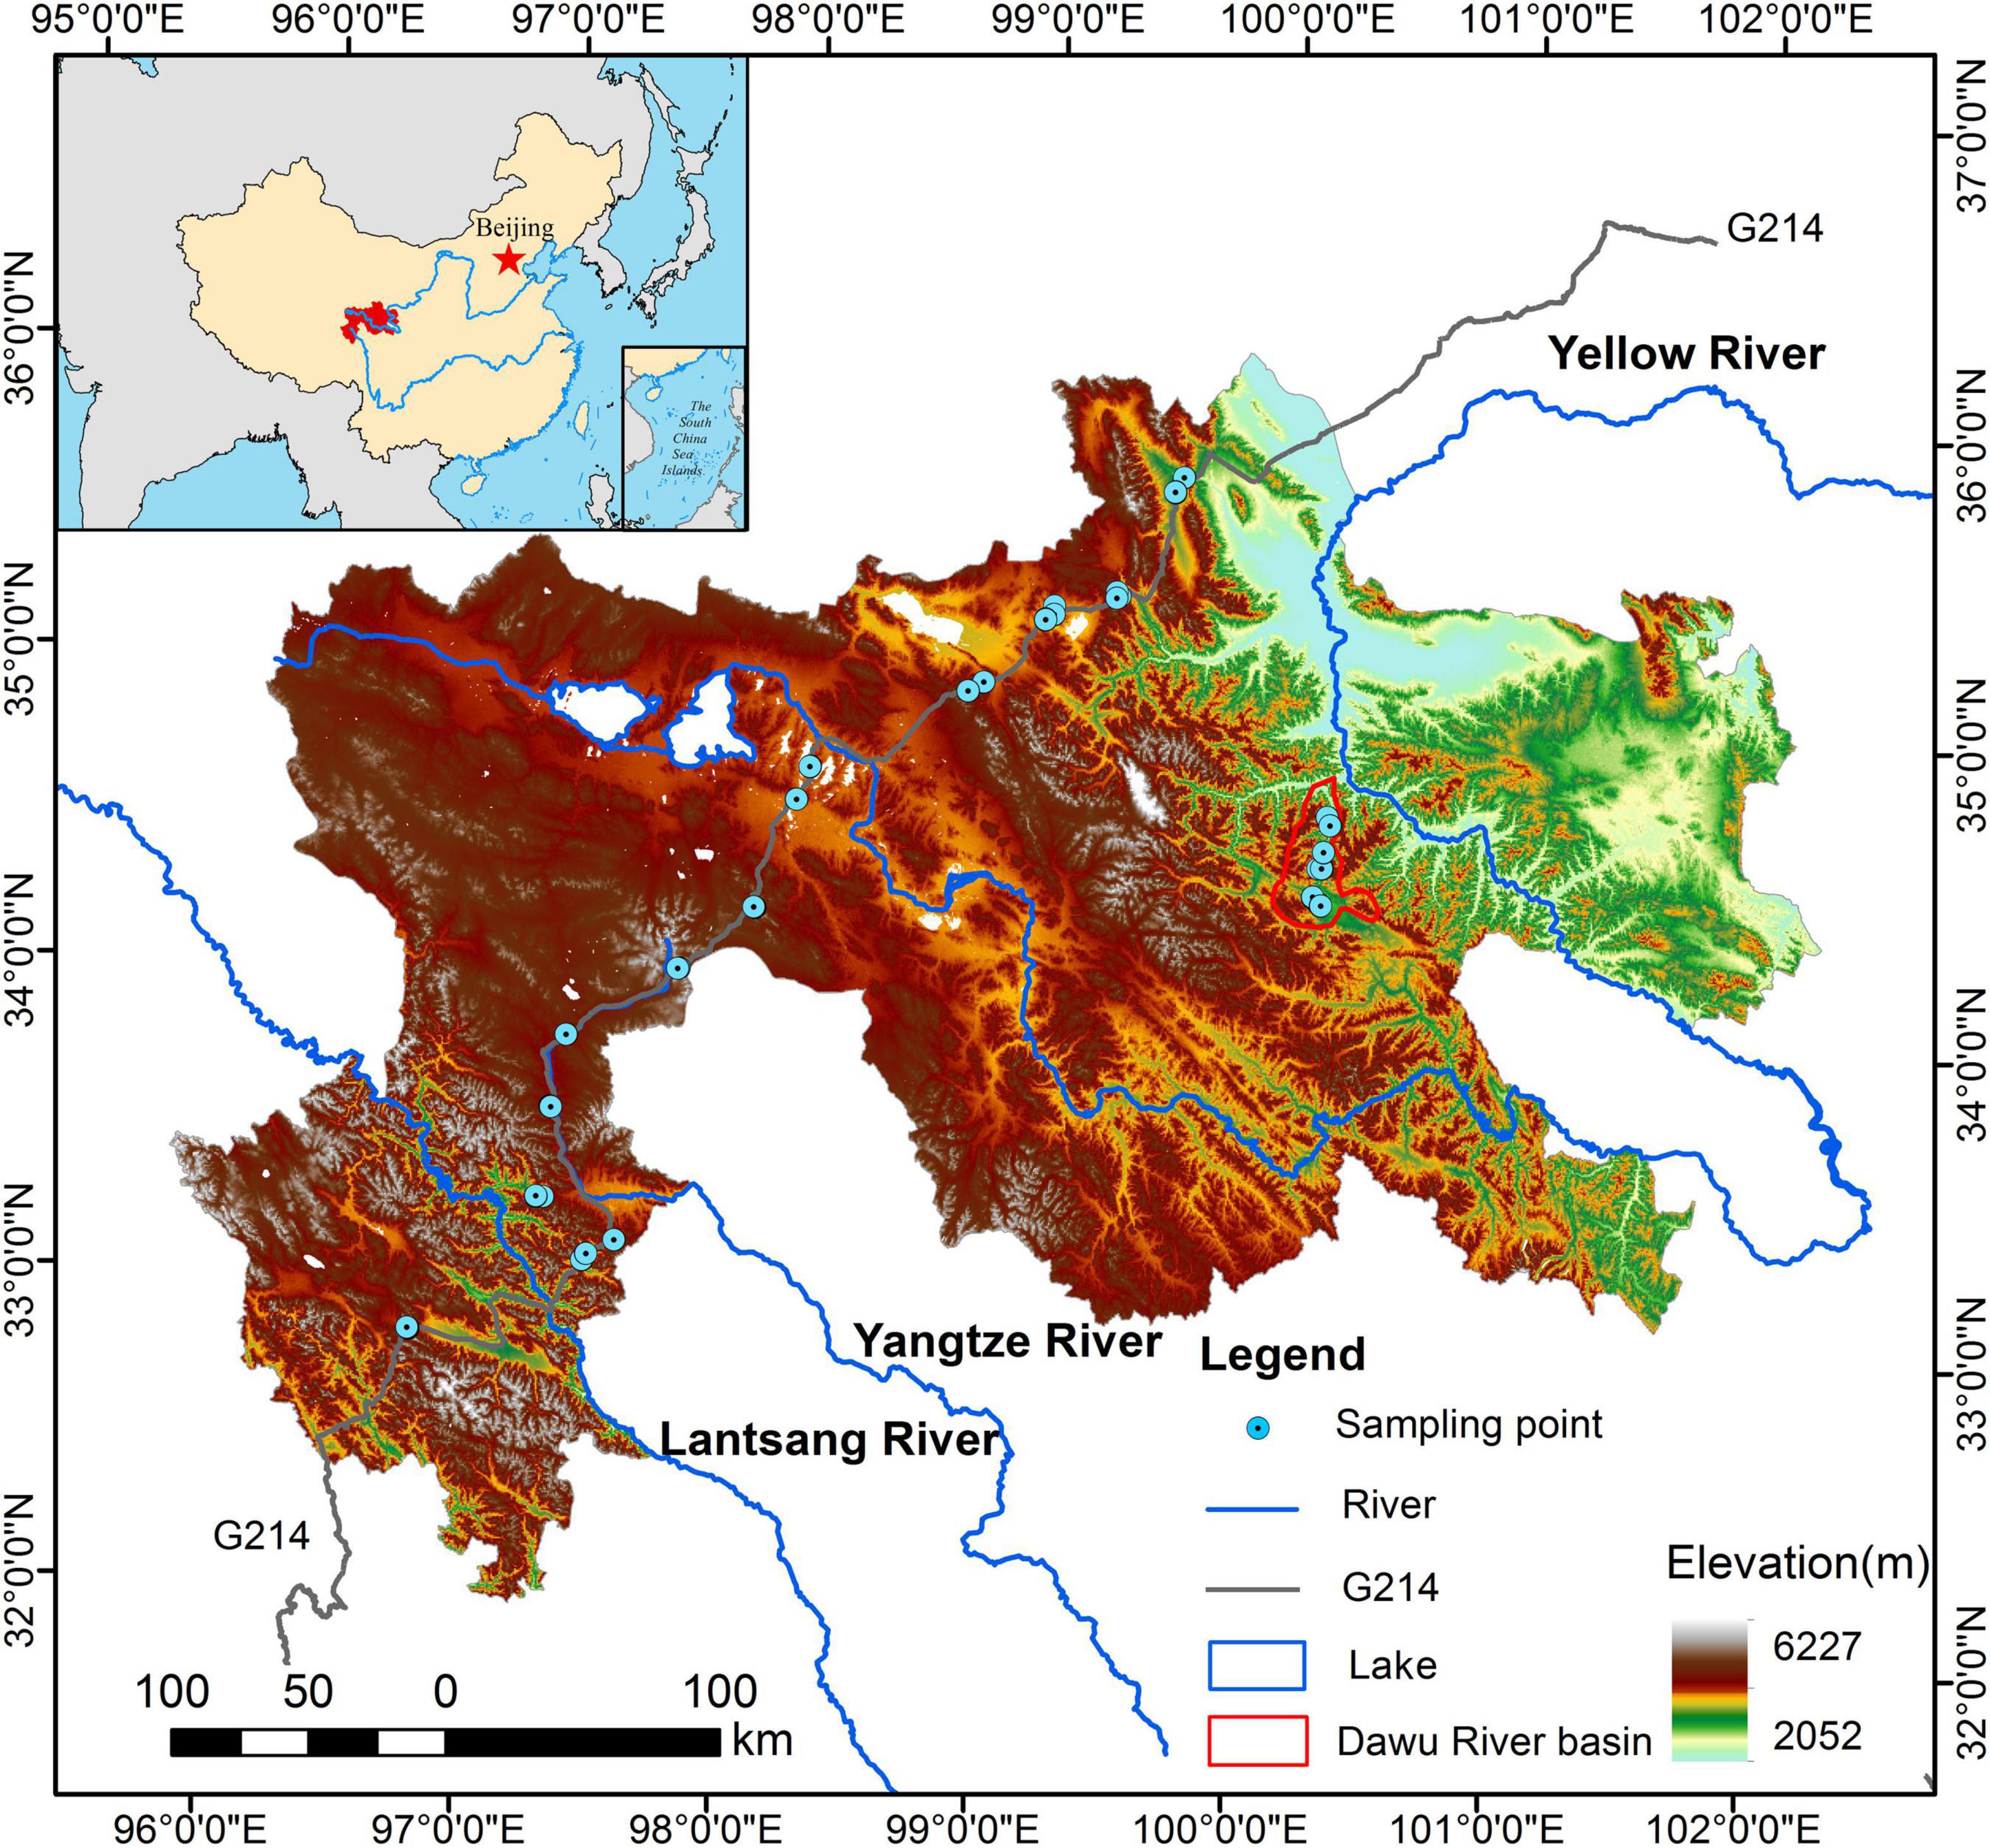
Figure 1. Map of study area and sampling points.
Considering that the terrain of the study region is treacherous with high mountains and glaciers, two transect surveys were performanced which were superimposed an additional constraint that sampling sites were selected based on NDVI levels under various conditions of grassland types and topography to ensure potential representative sampling locations. The one runs throughout the whole study area from Northeast to Southwest along national road G214, while the other transect survey along the Dawu River in the Northeast of Guo Luo Tibetan Autonomous Prefecture (Figure 1). Each sampling point was located at least 500 m away from the highway or river bank to avoid the disturbance caused by proximity. During July and August 2014 (keeping in view of the returning green stage and the accessibility to the sampling sites), 165 soil samples were collected from the soil surface using an internal diameter cores sampler with 20 cm long and 5 cm diameter from the soil surface. The bulk density of each sample of 0–20 cm layers was obtained from each soil mass and sampled volume as described earlier by Nosrati et al. (2015) and Wang et al. (2017). The SOC was determined using the potassium dichromate, external heating method (Cao et al., 2011). The vegetation and soil samples were measured at each sampling site by a standard method (Ren, 1998).
Collected samples were air-dried, ground, and passed through a 2 mm sieve. Each sample 137Cs radionuclide content was analyzed by low background gamma-ray spectrometry using a hyper pure coaxial germanium detector linked to a multi-channel digital analyzer system (EG&G, ORTEC) (Haribala et al., 2016) at the School of Nuclear Science and Technology, Lanzhou University. The 137Cs radionuclide content (Bq kg–1) was detected at the 661.6 keV peak over a counting time of 24 h. Each sample weight exceeded 300 g and supplied a precision of approximately ±5% at the 95% confidence level.
The observed soil erosion modulus was calculated by following three model (Wang Y. B. et al., 2014; Li et al., 2021):
where CPIi is the areal activity (Bq⋅m–2) of ith sampling point, i the sample number, Ci 137Cs radionuclide content of the ith sample (Bq kg–1), W the mass of ith soil sample (kg), S the corer area (m2).
where CPRi is 137Cs content change rate (%) of the ith sample, CRI 137Cs background value (Bq⋅m–2) for the study area. In this study, the soil 137Cs background value was 2,229.1 Bq⋅m–2, which was determined by the SPYR (Wang et al., 2017).
where Ei is the observed soil erosion modulus of the ith sampling point (t⋅hm–2⋅a–1), Bdi soil bulk density (Mg⋅m–3), DIi soil layer thickness (m) of the ith sampling point, T time between the 137Cs settling peak (1963) and the sample time.
Thirty-three environmental variable data sets based on available data sources on the climate, soil, topography, vegetation, and management were collected (Appendix Table 1). These data sources were compiled into raster data by ArcGIS 10.2 software to construct the soil erosion model. About 40% of these variables (12) were categorical, including soil taxonomic properties, land-use and land-cover change (LULC), and vegetation type, while 60% (21) of the variables (Table 1) were continuous, including organic matter content, vegetation cover, NDVI, frozen earth period, and climatic and biotic variables.
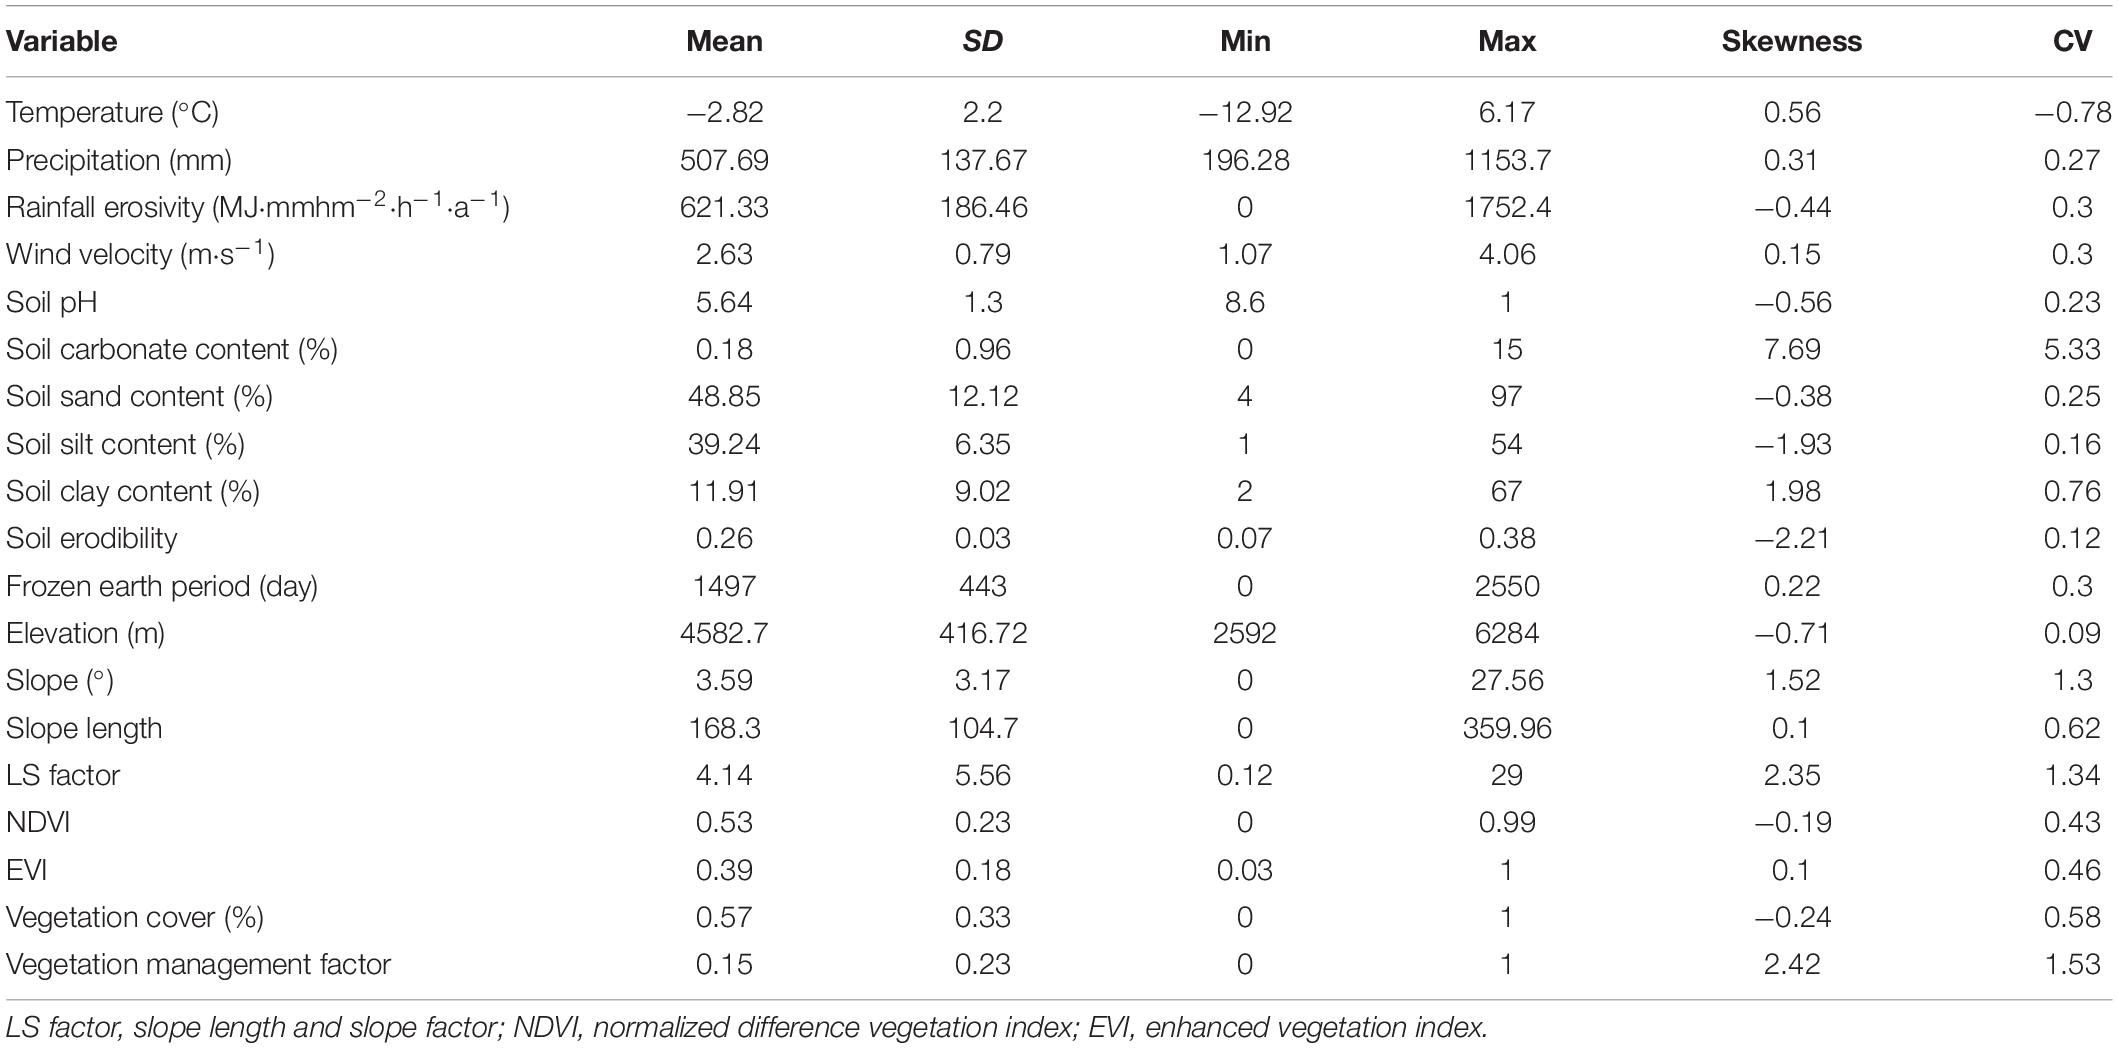
Table 1. Descriptive statistics of the continuous variables characterizing soil and environmental properties among the 165 sampling sites.
The elevation, aspect, slope, slope length, and slope factor (LS factor) were calculated from the digital elevation model (DEM) using ArcGIS 10.2 software. The DEM data were downloaded from 90 m Shuttle Radar Topography Mission (SRTM) images1. And resample the image’s spatial resolution from 90 to 100 m. The projection-type of DEM data was Albers.
The SOC, soil pH, soil carbonate content, soil sand content, soil silt content, soil clay content, and frozen earth period were obtained from the China Soil Map-Based Harmonized World Soil Database (V1.1). The data source mentioned above comes from the Cold and Arid Regions Sciences Data Centre of the Chinese Academy of Sciences (CAS) at Lanzhou2.
The daily precipitation, daily average temperature, and average wind velocity were based on a dataset of daily surface observation values in China (V3.0). The 838 meteorological stations data was acquired from the China Meteorological Data Sharing Service System website3.
Normalized Difference Vegetation Index and EVI obtained from TM/ETM satellite images. The vegetation index products (MOD13Q1) were downloaded from a NASA website4.
The daily precipitation and daily temperature were averaged every month; the daily wind velocities were accumulated every year; and the monthly mean temperature, monthly total precipitation, and yearly wind velocity were obtained based on meteorological data using meteorological interpolation software (ANUSPLIN, version 4.3). The monthly total precipitation was used to simulate rainfall erosivity. The MOD13Q1 data from January to December 2014 were transformed and registered into a GeoTIFF format using the MODIS reprojection tool (MRT). The maximum NDVI and maximum EVI were selected from NDVI and EVI datasets from January to December. Vegetation cover was simulated by the NDVI data. Soil erodibility data and vegetation management factor data were calculated by the RUSLE model (Prasannakumar et al., 2012). The details of the other variables are included in Appendix Table 1.
The parameters and sample data were integrated using the raster-package function in R 3.4.3 (R Development Core Team, 2017) software. Then, variables were selected by the BOR, GA, SA, RFE, and UF algorithms (You et al., 2014; Hosseini et al., 2016; Yang R. M. et al., 2016; Li and Ma, 2018). The five variable filtering algorithms were used in R 3.4.3 (R Development Core Team, 2017).
The whole dataset was randomly split into a calibration set (70%) and a validation set (30%) for model establishment and validation. The GLM forms a multivariate regression relation between a response variable and several predictor variables. The advantage of a GLM over simple linear regression is that the variables may be continuous, categorical, or any combination of these two allowing for non-linearity in the data (Atkinson and Massari, 1998; Rudy et al., 2016; Li et al., 2017). Cubist model is a ruled-based regression technique that builds multivariate linear regression models at the terminal leaves of a tree and parts the predictor variates into different subsets (Moisen et al., 2006; Akpa et al., 2016). RFM trains classification samples through decision trees and makes predictions based on the results of the classification, and has the ability to obtain classification and regression analysis data from various measurement scales with non-parametric statistics without making assumptions (Li et al., 2017; Wang et al., 2019; Tang et al., 2021). BST model is based on a first classification tree with subsequent trees generated by assigning greater weights to incorrectly classified training data (Pouteau et al., 2011; Yang R. M. et al., 2016). The GLM, cubist, RFM, and BST models (Li et al., 2017; Chang et al., 2018; Peng et al., 2018; Wang et al., 2019) were implemented with the mboost, bst, plyr, cubist, and RF packages, respectively, in R 3.4.3 (R Development Core Team, 2017). The 24 simulation results of the predicted soil erosion modulus were obtained by combining 6 algorithms [all relevant (AR), BOR, SA, GA, RFE, and UF] (You et al., 2014; Hosseini et al., 2016; Yang R. M. et al., 2016; Li and Ma, 2018) and 4 models (GLM, cubist, RFM and BST) (Li et al., 2017; Chang et al., 2018; Peng et al., 2018; Wang et al., 2019). The validation set that were not employed for model construction were used for the selected model validation and confirmation with the help of 45-degree line test. The cross-validation of the validation set were performanced between values of the predicted soil erosion modulus by the 24 models and values of the observed soil erosion modulus to evaluate the predictive ability of each model. The observed soil erosion modulus and the predicted values were plotted against the predicted data to find the trend of the slope of the expected curves. If the expected curve tends to make an angle of 45 degree with the axes, this means that there is no significant difference between the actual and predicted values. To evaluate the predictive capability of the 24 models, the following three performance indicators were used : the coefficient of determination (R2), root mean squared deviation (RMSD) and residual prediction deviation (RPD) (Lin et al., 2013).
The goodness of fit for the RUSLE model and machine learning algorithms combined with variable selection models were assessed via comparisons between the predicted results and observed values to evaluate the reliability and accuracy of the model output. The root mean square deviation (RMSD), standard deviation (SD), and correlation coefficients (R) were used to evaluate model accuracy (Lin et al., 2013). The cross-comparison results of the R and RMSD in different models are displayed in the Taylor diagram. The Taylor diagram illustrated R, RMSD, the standard difference in observations, and the standard difference in predicted values (Choubin et al., 2018). The polar axes and the radial axes separately illustrated the correlation coefficient and the RMSD of the model validation results. The predicted models were more approached observed point on the x-axis, and they presented a relatively higher correlation and low RMSD (Jia et al., 2016).
Prediction results by the optimal soil erosion model were classified by the Standards for Classification and Gradation of Soil Erosion (Ministry of Water Resources of the People’s Republic of China, 2007). The classification results were used to provide a reference for the soil restoration and ecological policy. The economic monetization of SOC loss caused by soil erosion in the SPYR was based on the market value approach (Costanza et al., 1998). The net soil erosion modulus minus the tolerable soil erosion modulus is the actual soil erosion modulus (Hancock et al., 2015). Tolerable soil erosion loss is generally 500 t⋅km–2⋅a–1 (Chen et al., 2000; Li et al., 2009). The values of SOC were estimated by the C tax ($180⋅t C) (Patton et al., 2015).
Among the 33 environmental variables, the number of variables selected by the GA, RFE, BOR, UF, and SA algorithms was 29, 26, 22, 22, and 13 variables, respectively (Appendix Table 2). The five algorithms selected precipitation, wind velocity, rainfall erosivity, frozen earth period, slope, aspect, water flow direction, the NDVI, land cover, and vegetation type as variables in common that may play significant roles in explaining the soil erosion mechanism.
Figure 2 compared five variable search methods across four modeling techniques (GLM, cubist, RFM, and BST) in terms of both prediction accuracy and model complexity. The cross-validation results of GA BST model that selected 29 variables showed slightly inferior performance to the UF cubist model. This indicated that the 22 variables selected by the UF cubist model contained better predictive power to that of 29 variable selected by the GA BST model. Comparing with the UF cubist model, the SA cubist model had fairly comparable performance in similar model accuracy, but dramatically decreased model complexity. The SA cubist model struck a balance between model complexity and performance. It greatly reduced the number of variables to only 13 while preserving most of the predicting power to infer soil erosion. The cross-validation identified and optimized model parameters. The 13 variables selected by the SA cubist model captured the major factors – soil organic carbon, soil property and soil erodibility besides nine common variables mentioned above involving climate (e.g., precipitation, wind velocity, and rainfall erosivity), soil (e.g., frozen earth period, soil organic carbon, soil property, and soil erodibility), topography (e.g., slope, aspect, and water flow direction), vegetation (e.g., vegetation type and NDVI) and management (e.g., land cover) properties (Figure 2 and Appendix Table 2).
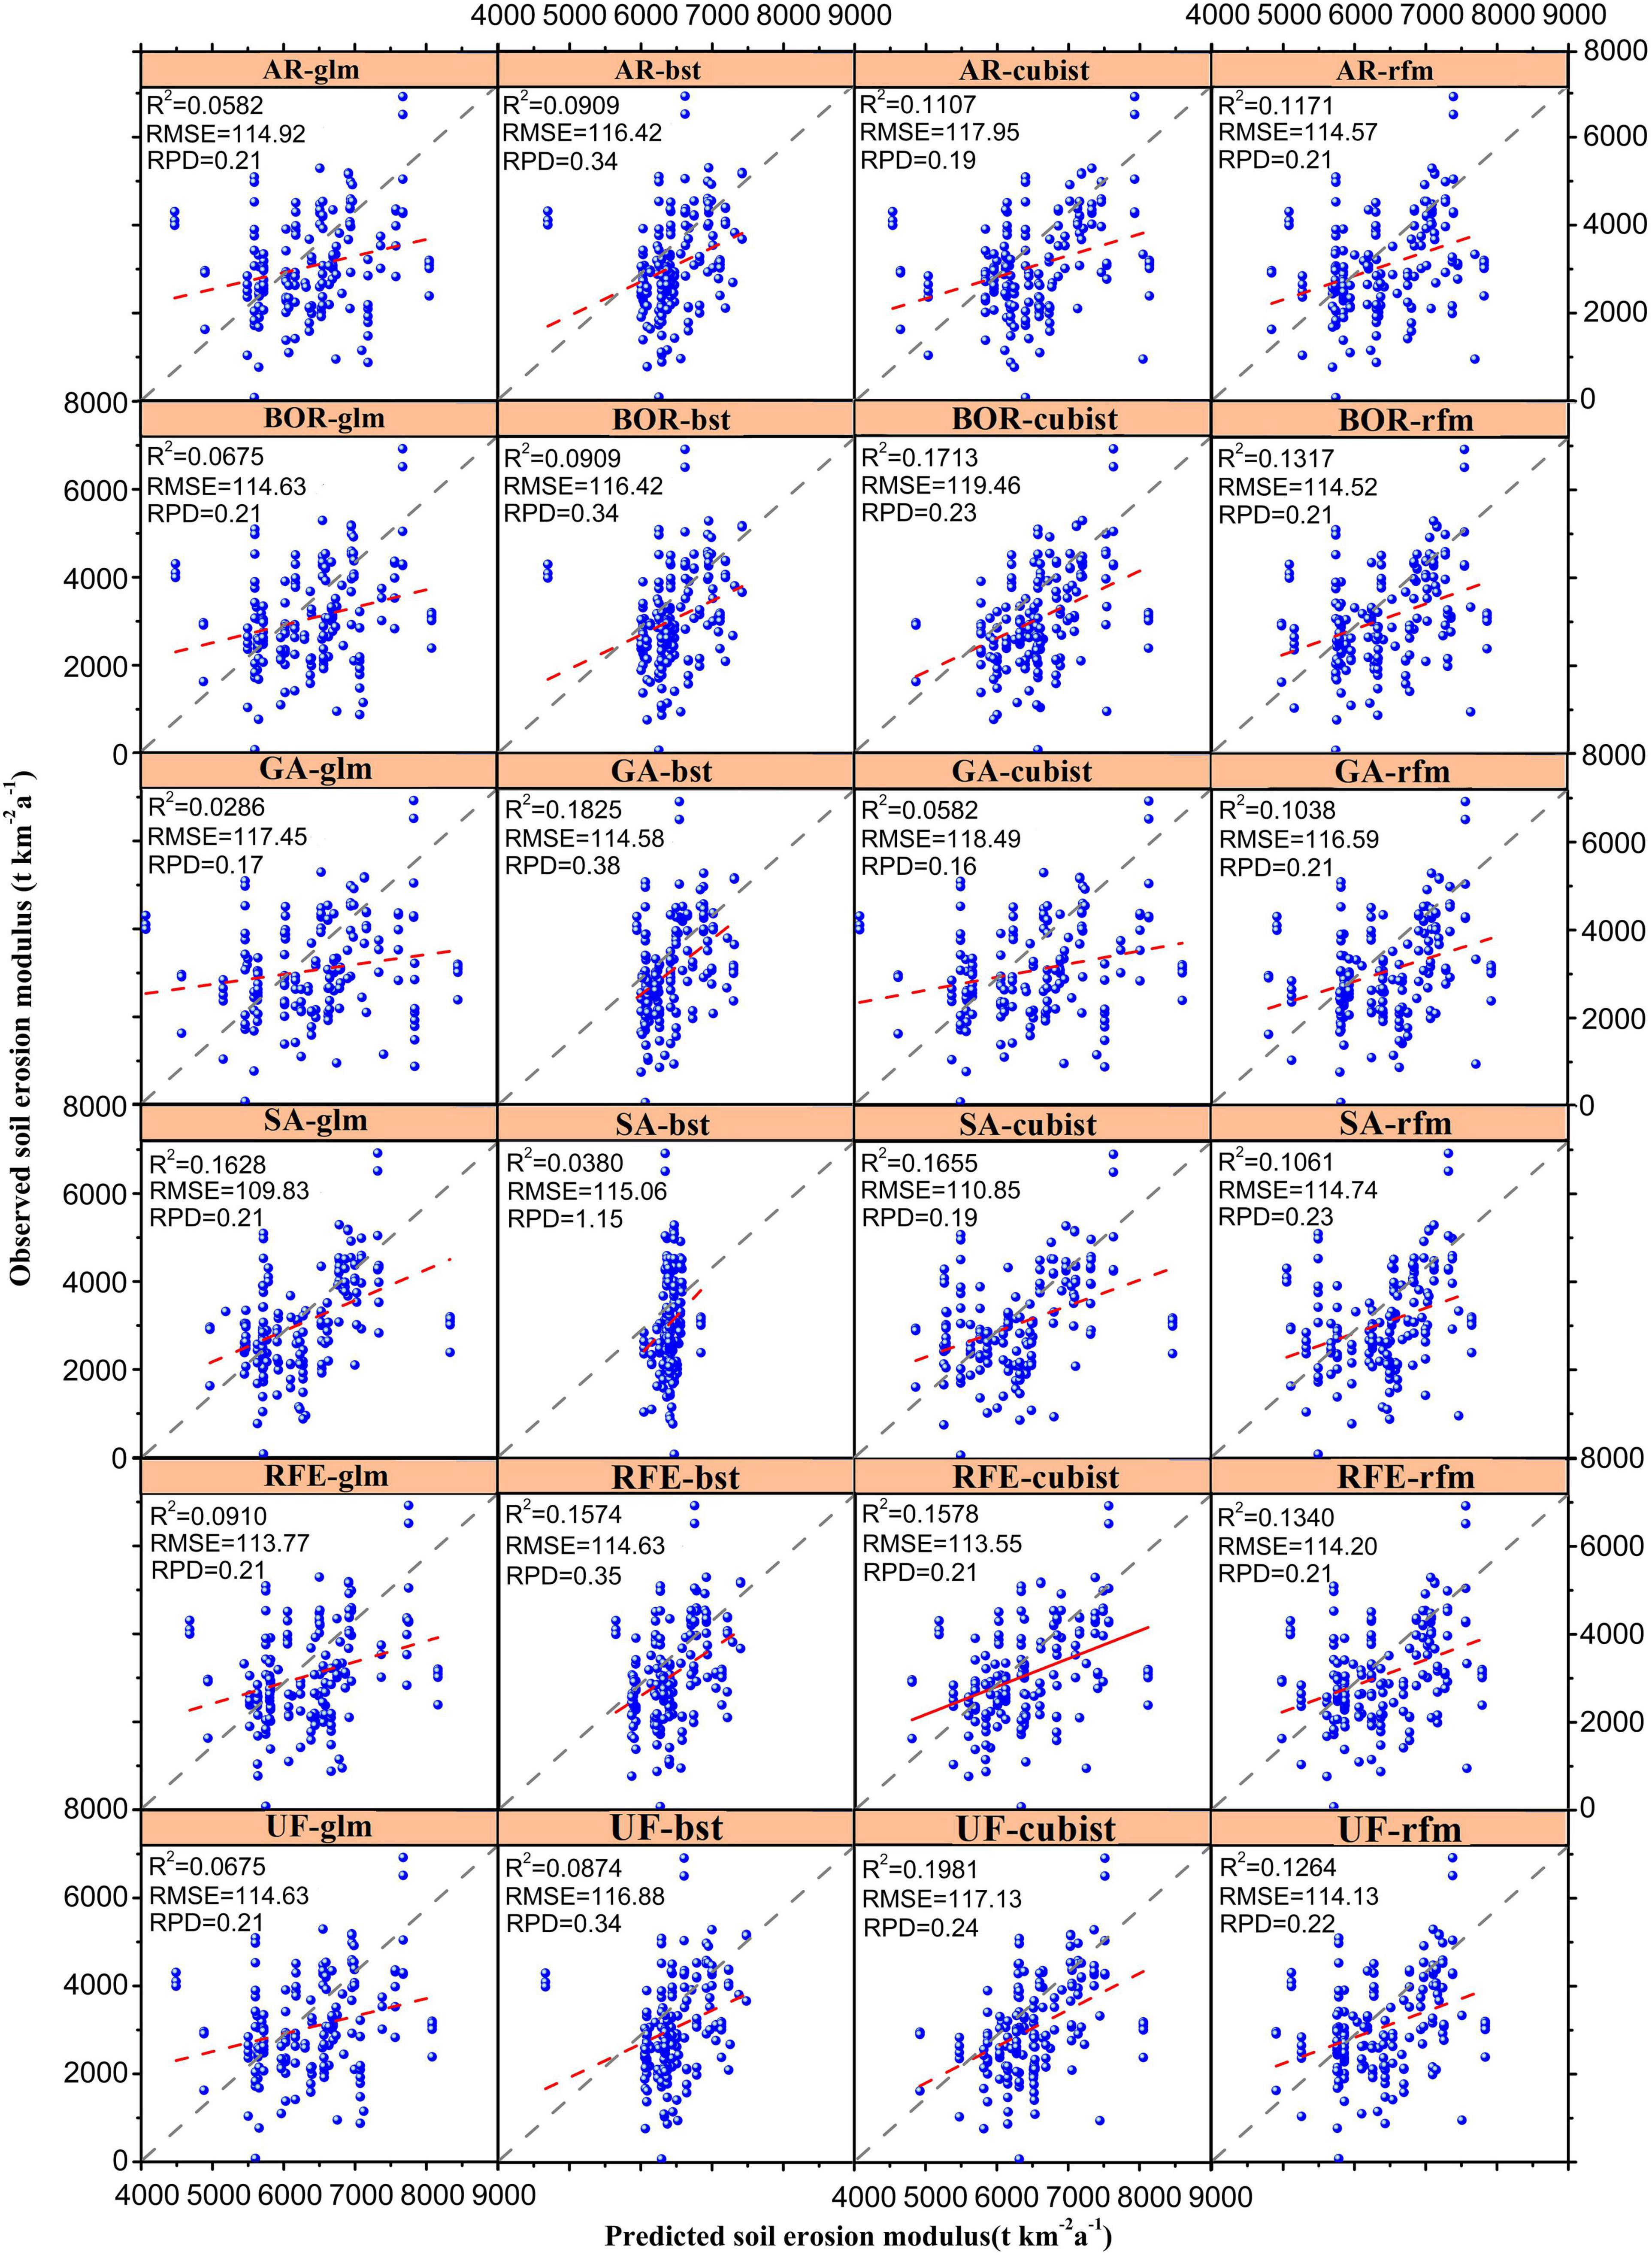
Figure 2. Validation results of 24 models which combing six variable selection algorithms and four machine learning approaches. The six variable selection algorithms are: all relevant (AR), Boruta all-relevant (BOR), simulated annealing (SA), genetic algorithm (GA), recursive features elimination (RFE), and univariate filters (UF). The four machine learning approaches are: generalized linear model (glm), cubist model (cubist), random forest model (rfm), and boosting tree model (bst). Other abbreviations: R2, the coefficient of determination; RMSD, root mean squared deviation; RPD, residual prediction deviation.
The goodness of fit for the RUSLE models and machine learning algorithms combined with variable selection models showed that the GLM (R = 0.63) and cubist model (R = 0.67) performed the best while RUSLE (R = 0.49) performed the worst (Figure 3). The Taylor diagram show that (1) the fitting result was poorer for the RUSLE model than the 24 machine learning models (the location labeled with ‘RUSLE’ were the outermost from the observation point). (2) Compared with the other five variable selection models, the SA variable set combined with the GLM and cubist model was more consistent with the actual measurements, and the SA variable set combined with BST was the least consistent with the actual measurements. (3) Compared with the BST and RF models, the GLM and cubist models were slightly more consistent with the field measurements (the points labeled with ‘GLM’ and ‘cubist’ are nearer to the observation point than the points labeled with ‘BST’ and ‘RFM’). The cross combination of the BST model and all variable sets had the lowest agreement (the points labeled with ‘BST’ is the farthest to the observation point than the other points). (4) Contrast to the AR, BOR, GA, UF, and RFE variables, the GLM did not present a significant difference in fitting results (the gaps of the points labeled with ‘RFM’ from the observation point were nearly the same). The results show that in terms of classification accuracy, the RFE performs best among the five feature-selection algorithms, and the Cubist model performs best among the four machine learning algorithms. In these 24 combinations, the optimal model is the SA cubist model (R = 0.67, RMSD = 1368).
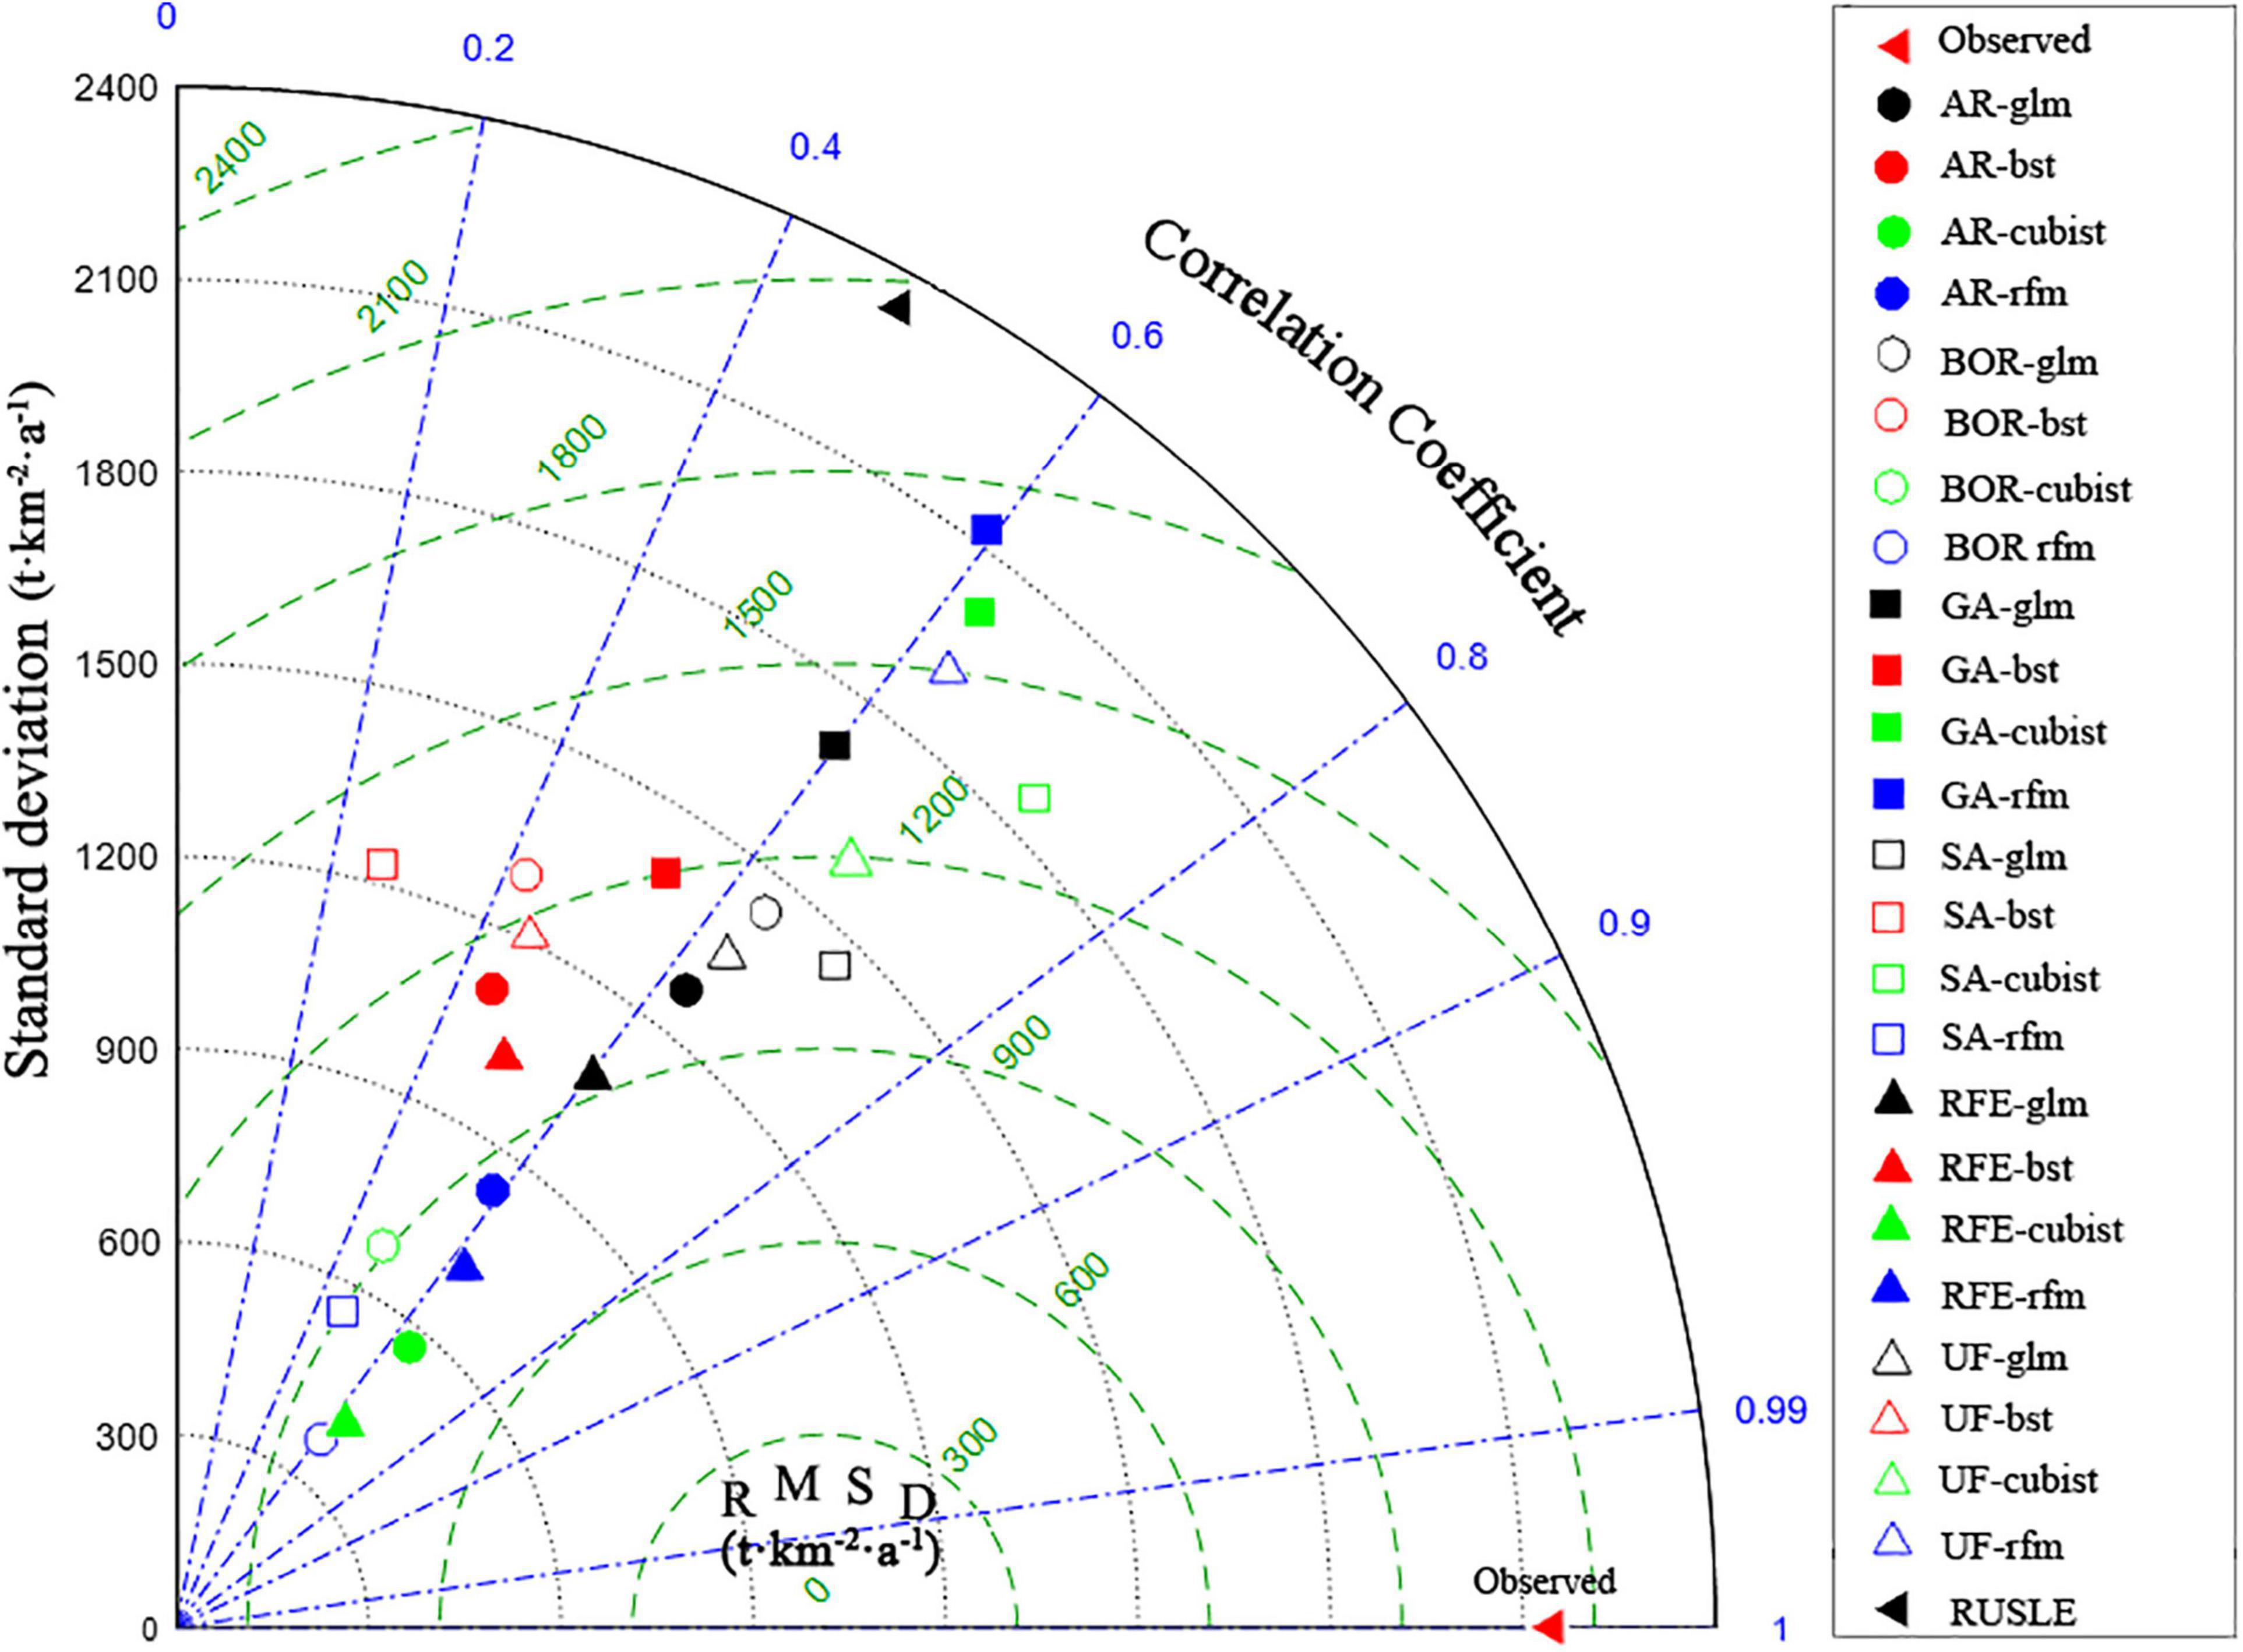
Figure 3. Performance of RUSLE (revised universal soil loss equation model) and 24 machine learning models at the site level. “Observed” on the x-axis means the statistical information of the observed dataset. AR, all relevant; BOR, Boruta all-relevant; SA, simulated annealing; GA, genetic algorithm; RFE, recursive features elimination; UF, univariate filters; GLM, generalized linear model; cubist, cubist model; RFM, random forest model; BST, boosting tree model; RUSLE, revised universal soil loss equation.
The SA cubist model estimated the total erosion loss was about 8.45 108 t⋅a–1 in 2014, which is 12.64 times the allowable soil erosion loss. The soil erosion modulus showed substantial spatial heterogeneity in the SPYR (Figure 4). The soil erosion modulus ranged from 4841.68 to 8054.09 t⋅km–2⋅a–1, and the average soil erosion modulus was 6460.95 t⋅km–2⋅a–1. In general, 99% of the area in the SPYR belongs to the severe soil erosion modulus (5,000–8,000 t⋅km–2⋅a–1).
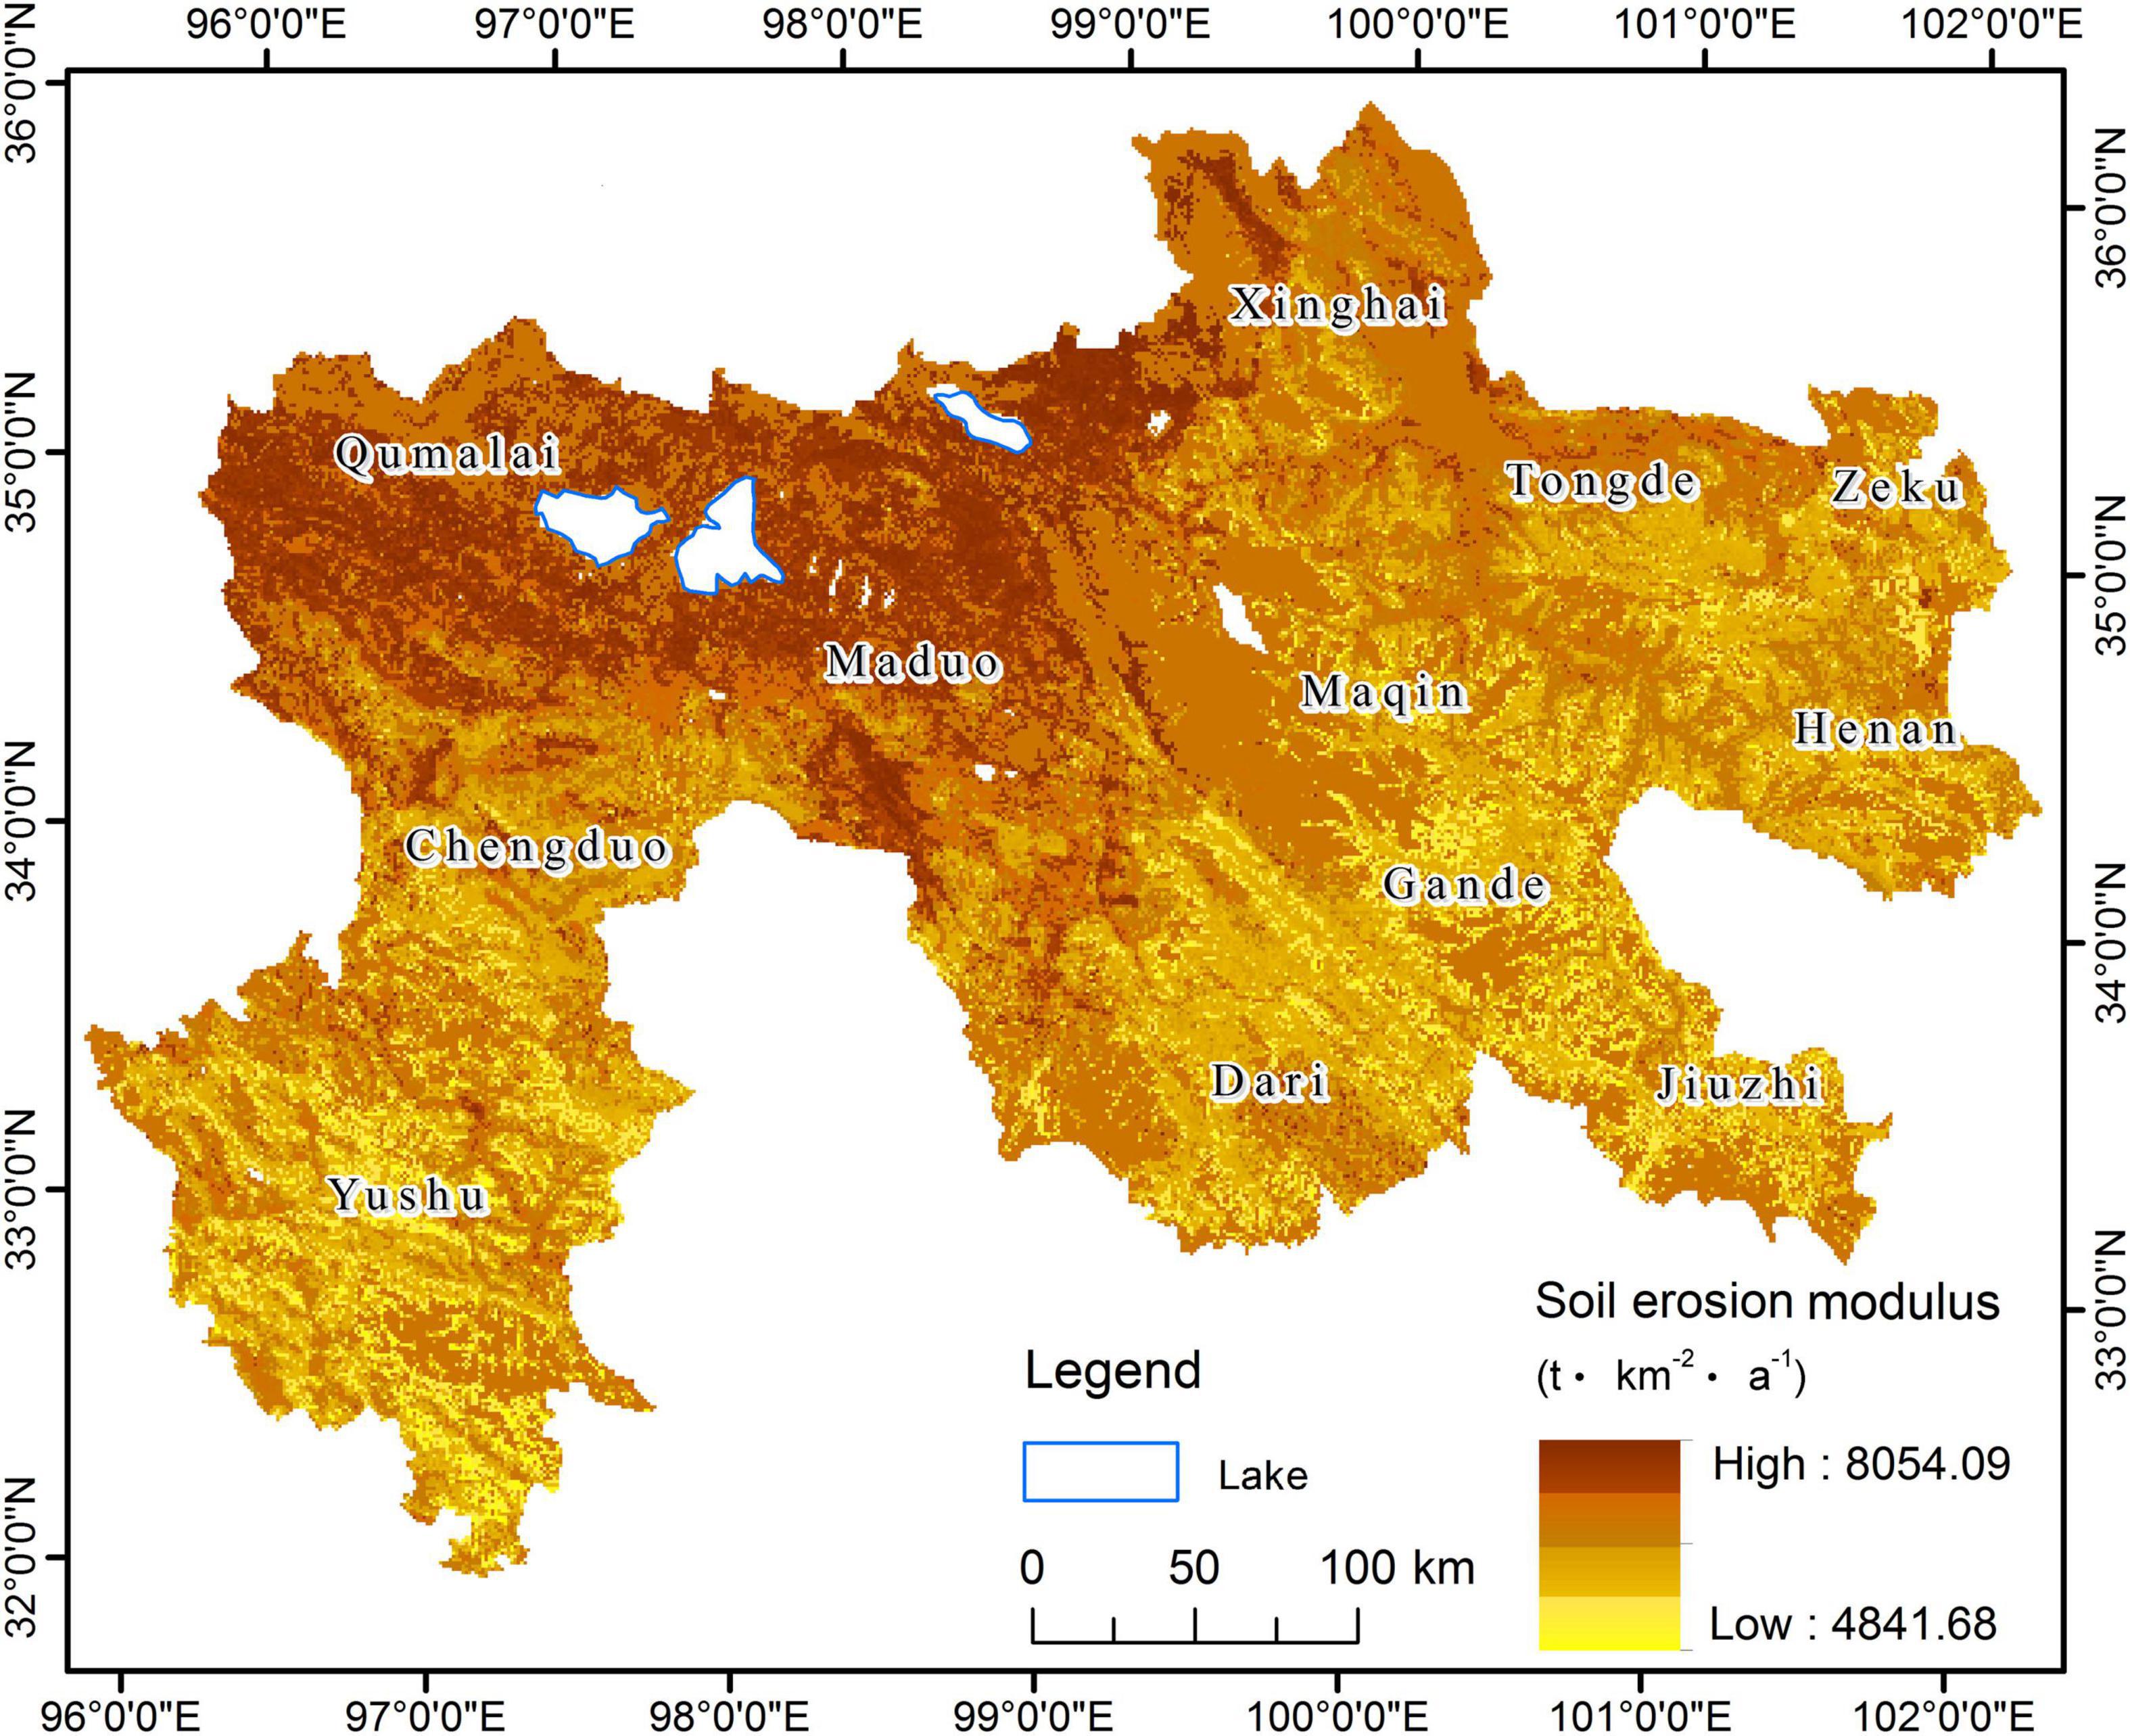
Figure 4. The spatial distribution of the soil erosion modulus.
According to the Standards for Classification and Gradation of Soil Erosion, the region with the most severe soil erosion modulus (7,000–8,000 t⋅km–2⋅a–1) occupied 12.38% of the total soil erosion regions. It mainly appeared in the Northern part of the SPYR. The moderately severe region of the soil erosion modulus (6,000–7,000 t⋅km–2⋅a–1) occupied 71.19% of the total soil erosion regions and was distributed in the middle of the study area. The slightly severe region of the soil erosion modulus (5,000–6,000 t⋅km–2⋅a–1) occupied 16.43% of the total soil erosion regions and was distributed South of the SPYR (Figure 4).
The simulated soil erosion modulus values were more significant than that in two previous report (276 and 3,208 t⋅km–2⋅a–1), which used the RUSLE model (Teng et al., 2018) and RWEQ model (Teng et al., 2021) to calculate the soil water and wind erosion modulus on the Qinghai-Tibetan Plateau, respectively. At the same time, the RUSLE model emphasizes soil erosion loss by rainfall, slope, aspect, vegetation, and soil erodibility but ignores soil erosion loss from winds, freeze-thaw cycles, and human activity. Although few research studies have provided a comprehensive prediction of soil erosion (Sadeghi et al., 2018; Shen et al., 2018), high levels of precipitation have been reported to lead to severe erosion, while low temperatures combined with adequate precipitation may cause even greater soil losses in the study area (Yang et al., 2018). The same as the RWEQ model.
Under freeze-thaw conditions, soil moisture is transported, and the soil structure is damaged; moreover, the soil porosity, bulk density, shear strength, aggregate stability, and organic matter are all changed, which leads to high soil erodibility and erosion intensity increases (Wang L. et al., 2014; Sadeghi et al., 2018). In addition, soil erosion modulus caused by wind erosion is also an important aspect of soil erosion because the wind speed is a vital factor that affects soil erosion (Teng et al., 2021). Soil particles erode as the sheer pressure exerted by wind-force leads to soil particles being hard to grip on the soil surface (Jiang et al., 2018; Zhang et al., 2018). Furthermore, grazing livestock and human activity are both key factors in the intensification of soil erosion. Intensive grazing will alter and destroy soil surfaces, causing whole sod to erode and expose mineral soil, especially in areas with low vegetation cover (Lin et al., 2008; Evans et al., 2017; Zhang et al., 2018).
Besides, frequent human activities will cause soil erosion, such as collecting Chinese Caterpillar Fungus (Wang C. G. et al., 2018) and overexploitation of tourist attractions, and so on (Yang Y. et al., 2016). The comprehensive set of variables based on the inclusion of freeze-thaw erosion, wind erosion, water erosion, and human-caused erosion was more objective than that used in the RUSLE or RWEQ model. The inclusion of these variables may explain why the soil erosion results derived from this set of variables were more excellent than the results from the RUSLE or RWEQ model because this comprehensive set of variables involved more soil erosion factors, including meteorological, soil, topographic, vegetation, and management factors, which enhance our understanding of soil erosion processes using a data-based model.
Evaluation results of model accuracy comparisons among five variable selection methods and four prediction models are illustrated in Figure 3. The model validation included machine learning models and the RUSLE model. The results showed that variable screening technology could further reduce model complexity. The SA method selected 13 out of the 33 relevant variables, i.e., climatic factors, including precipitation, wind velocity, and rainfall; soil factors, including SOC, soil properties, soil erodibility, and frozen earth period; topography factors, including slope, aspect, and water flow direction; and vegetation factors, including vegetation type and the NDVI. The UF method largely reduces the number of variables that were most able to explicate soil erosion. The Boruta algorithm screening out the majority of climatic and topographic variables, thus abated model collinearity. The feature-selection method can simplify model parameters and reduce operational costs; in addition, this method can also improve the estimation accuracy of a model by eliminating redundant interference parameters.
Our results showed that in terms of classification accuracy, the RFE performs the best among the five feature-selection algorithms and the Cubist model performs the best among the four machine learning algorithms. The projected results of the RUSLE model were limited by fixed parameters, which included only rainfall, slope, slope direction, vegetation, and soil texture. The accuracy of the RUSLE model is the lowest among the models because some factors that may affect soil erosion were ignored, such as diurnal temperature, strong winds, freeze-thaw, and so on.
In order to gain much more insight through statistical analysis and modeling compared to biased linear sampling along roads, the conditional Latin Hypercube design for soil sampling to even its spatial distribution would be adopted in our near future studies (Ma et al., 2020; Tang et al., 2021).
According to the Standards for Classification and Gradation of Soil Erosion, 99% of the SPYR area experiences severe soil erosion. (Ministry of Water Resources of the People’s Republic of China, 2007), soil erosion modulus was further reclassified into three grades: level I (severe, soil erosion modulus in 5,000–6,000 t⋅km–2⋅a–1), level II (moderately severe, the soil erosion modulus in 6,000–7,000 t⋅km–2⋅a–1), and level III (most severe, the soil erosion modulus 7,000–8,000 t⋅km–2⋅a–1). The soil erosion modulus of each county was reclassified into three grades (Figure 5). Level III erosion occurred mainly in the triangle zone of Qumalai County and Maduo County. Level II erosion occurred in Xinghai County, Dari County, Chengdu County, Western Zeku County, Western Maqin County, Tongde County, and parts of Jiuzhi County, Henan County, Gande County, and Yushu County. Level I erosion primarily occurred in Eastern Maqin County, Eastern Zeku County, and most areas of Jiuzhi County, Henan County, Gande County, and Yushu County (Figure 5).
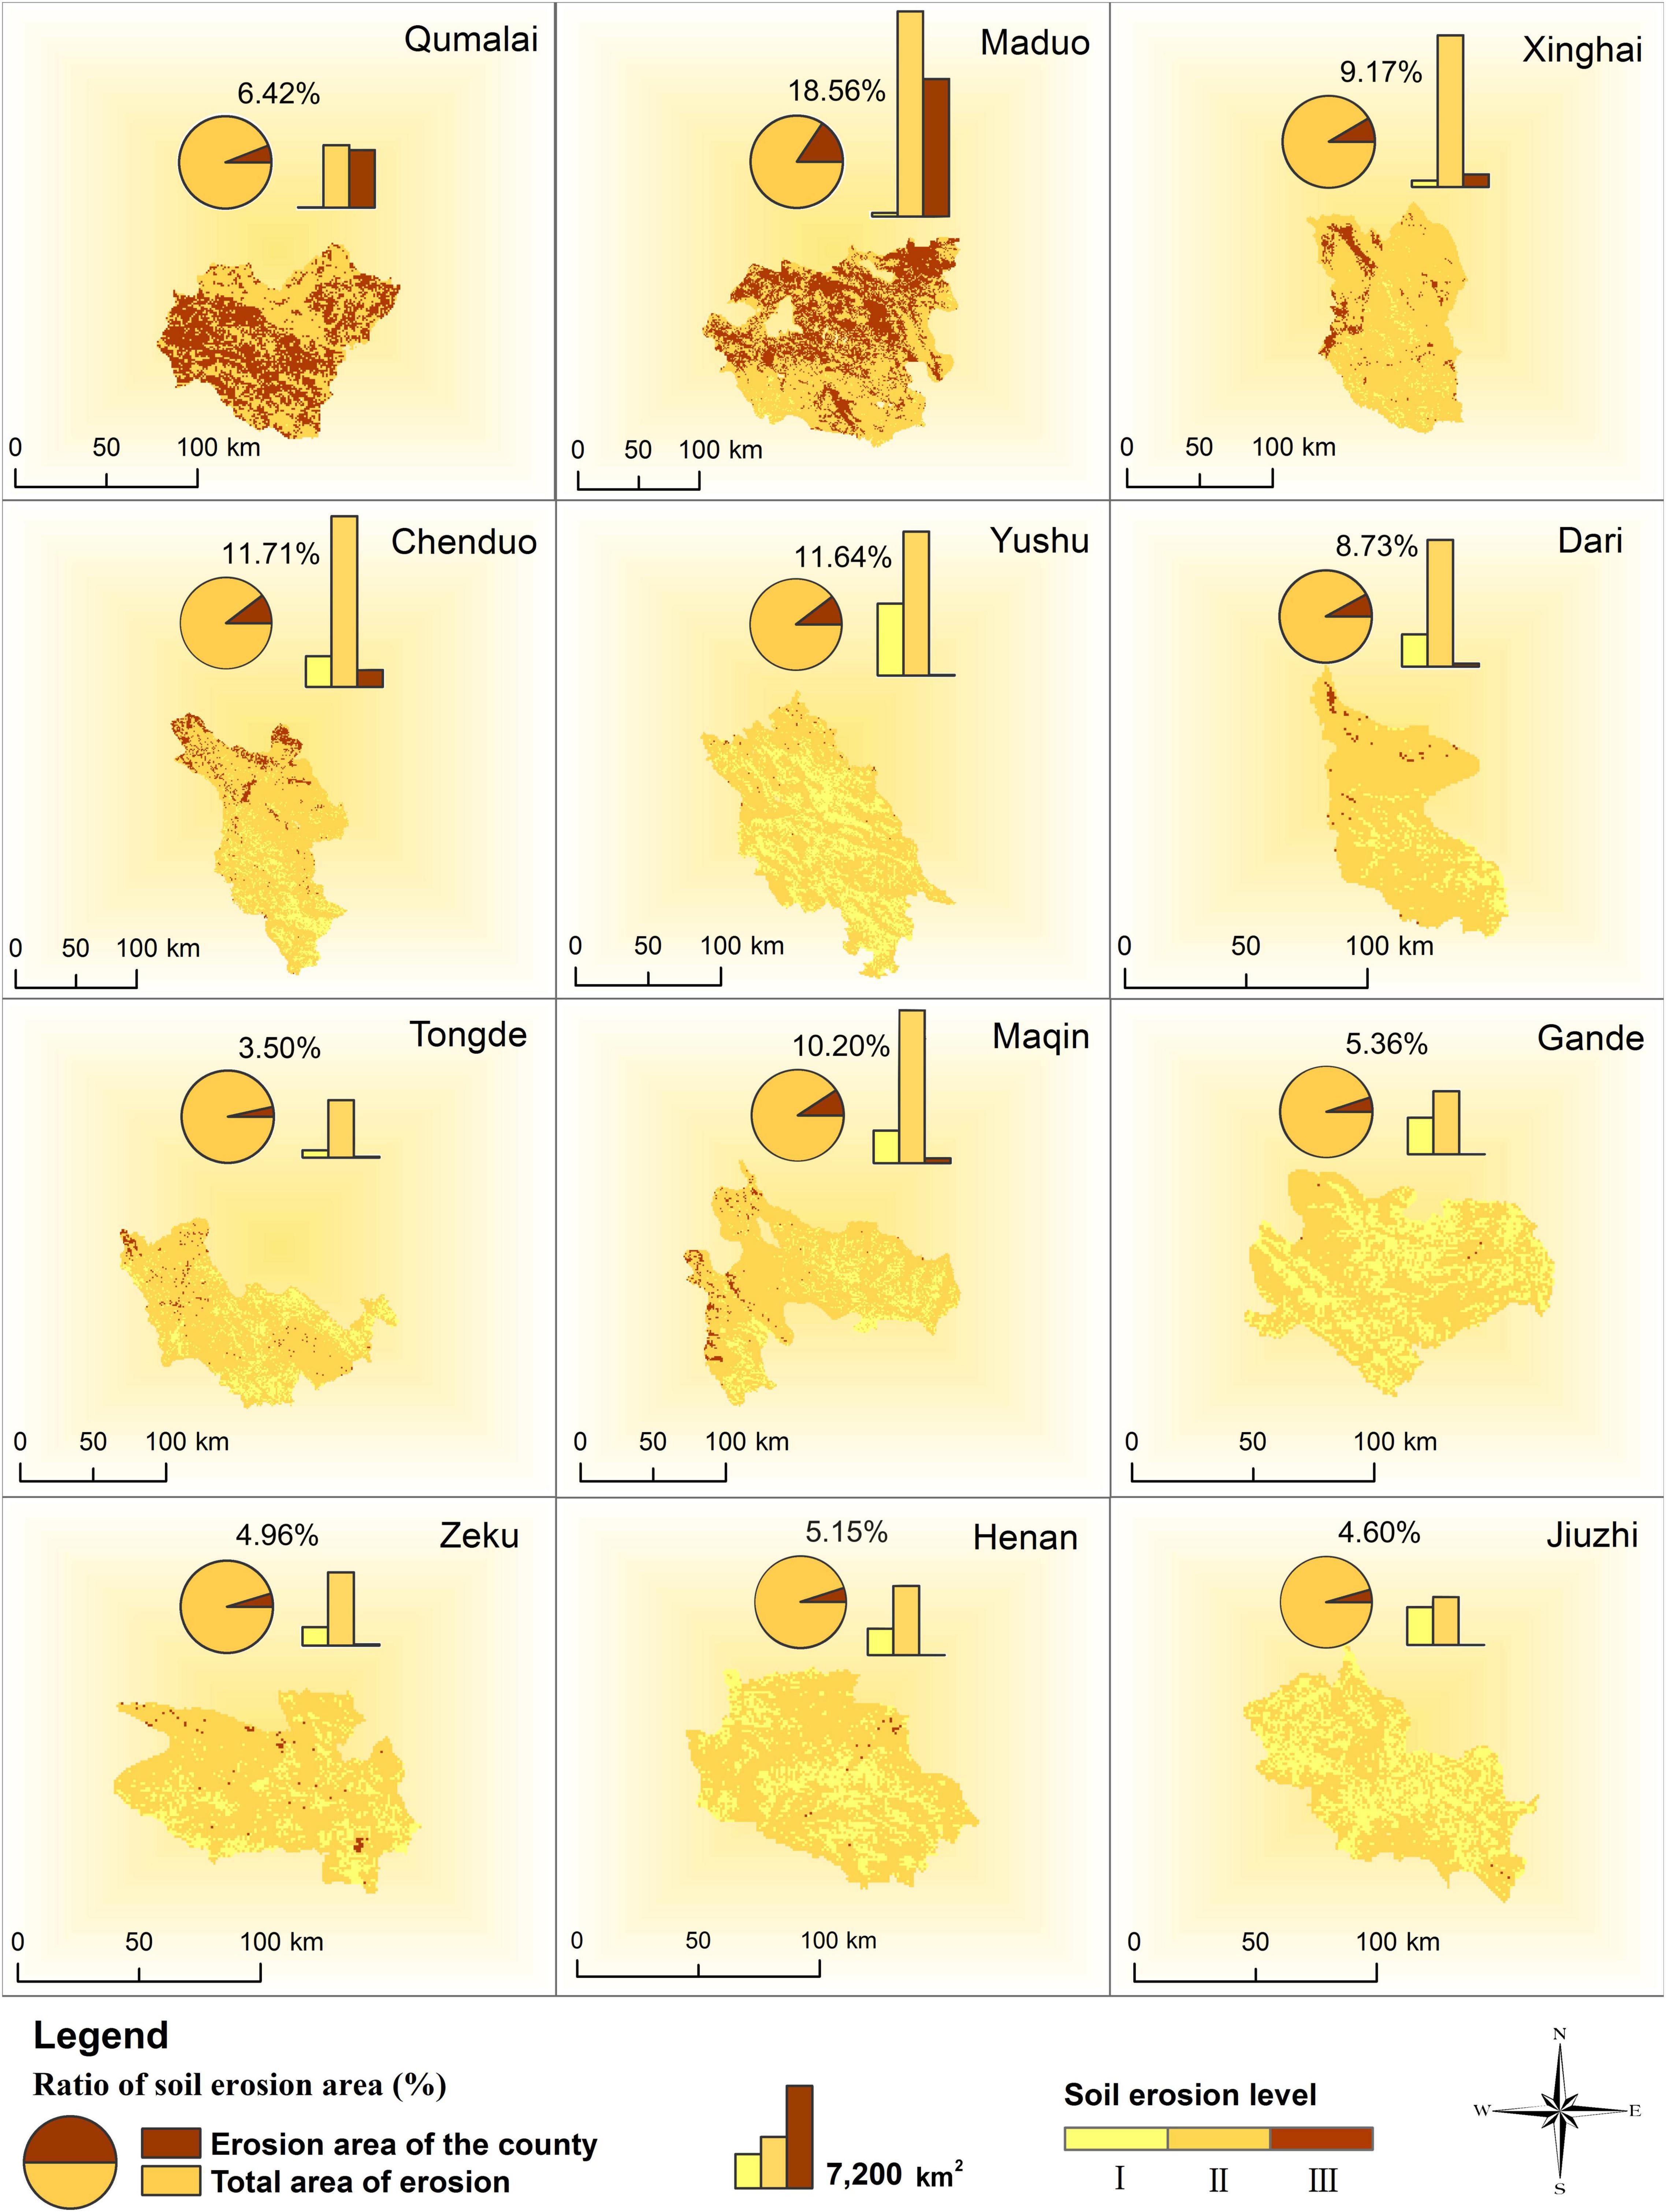
Figure 5. Soil erosion modulus reclassified in each county.
Severe soil erosion causes significant ecological degradation as well as substantial ecological, economic losses in the SPYR. For example, the economic monetization of SOC losses caused by soil erosion total $47.90 billion in the SPYR. The economic losses were approximately fivefold of the output value of animal husbandry ($10.10 billion) in 2014 (Qinghai Bureau Statistics, 2014). We can infer that the economic monetization of soil erosion would be far huger than the SOC loss. Actually natural resources are priceless. Monetization of soil erosion loss is only a caution light for taking a partial solution in eco-compensation. Therefore, a new ecological policy recommendation based on soil erosion reclassification should be proposed to balance grassland conservation and animal husbandry production for the prevention and control of soil erosion loss (Figure 6).
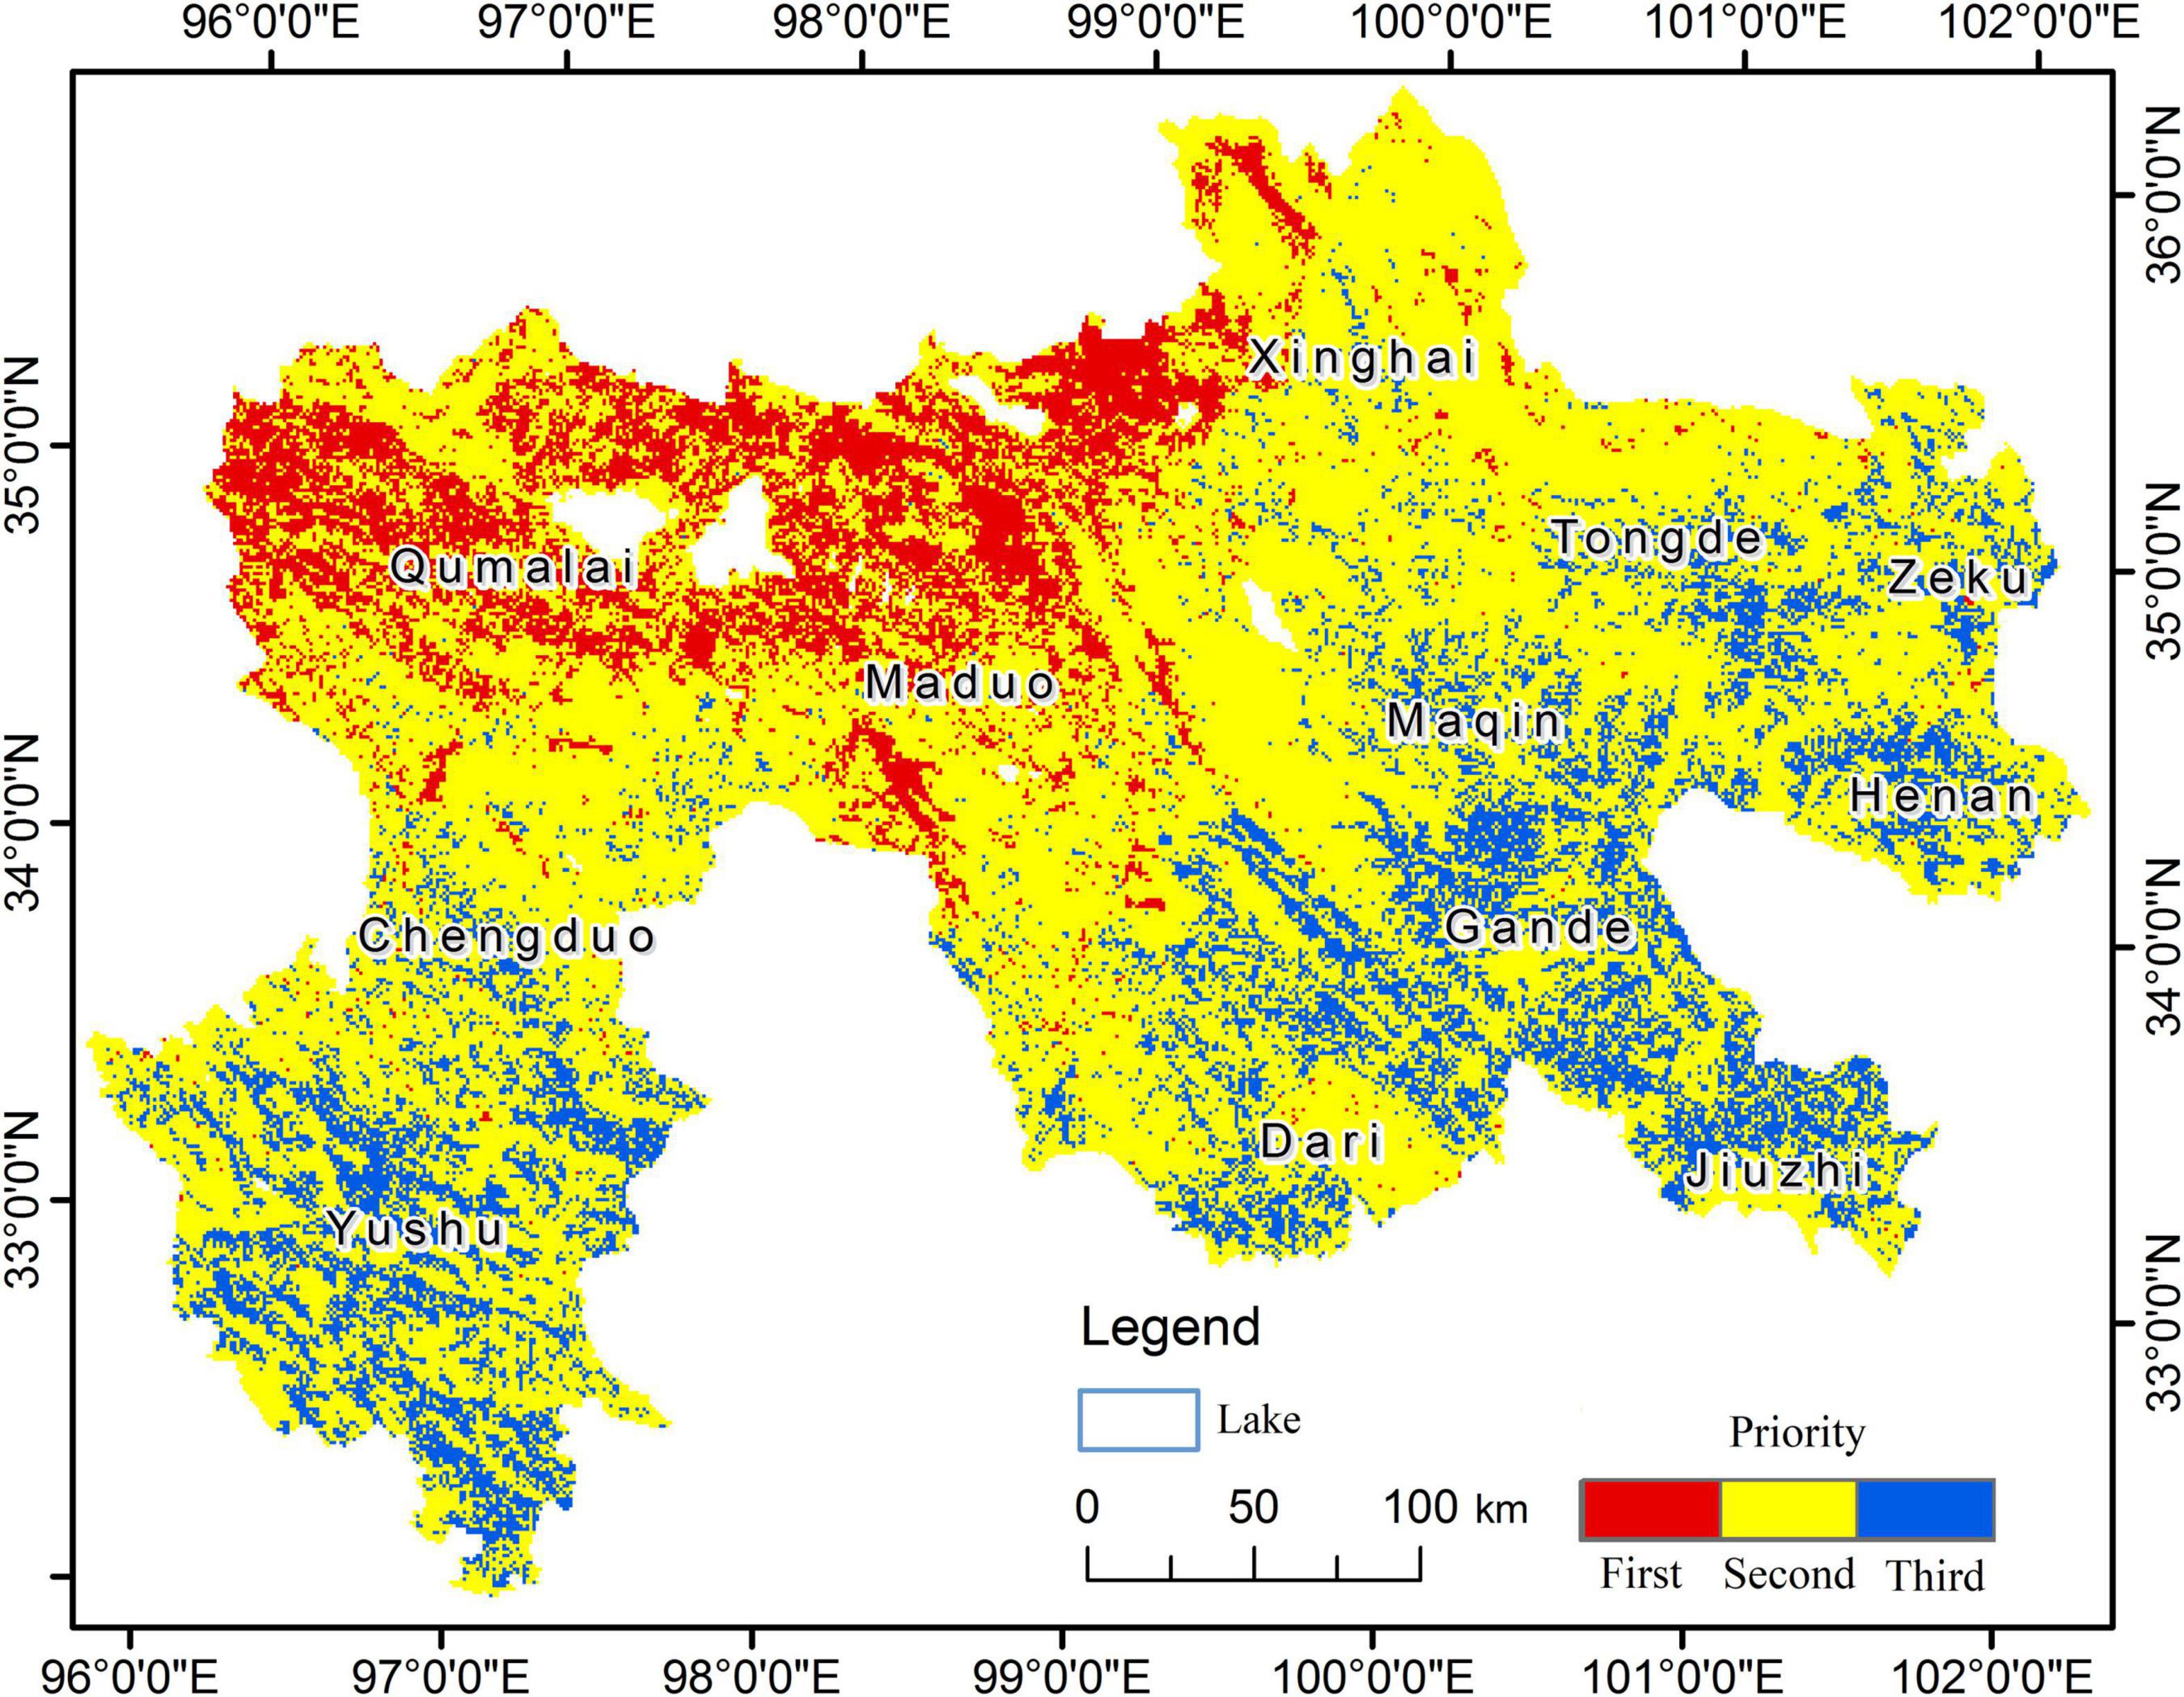
Figure 6. Priority level of soil erosion control strategy.
A conservative management strategy was suggested for some fragile areas (soil erosion at level III) since grassland’s economic products have led to serious soil erosion (Figure 6). This grassland sector should not be used for grazing (Yin et al., 2019). At this level, the government should provide ecological subsidies to compensate for the economic losses caused by not allowing grazing. Additionally, the government should relocate local herder households to new countryside neighbors to cities. At the same time management department should also supply training projects to sustain transitions to alternative livelihoods for these herdsmen, such as making Tibetan typical handicrafts and building Tibetan distinctive hotels for developing Tourism. Notably, over the long term, simply banning grazing may result in a snowballing population increase of deleterious wild animal species that are short of plenty natural predators, such as rabbits and pika, thus probably resulting in new ecological problems (Wang Y. et al., 2018). Therefore, after 5 years of banning grazing, grasslands should be managed under a grass-animal balance policy, or grazing should be continued to be banned. The implemented policy will depend on the condition of the grassland.
The moderately severe sector (level II) should be managed intensively to improve the basic conditions (Figure 6). Even now the balance of livestock and pasture production is an important factor at level II soil erosion regions (Yin et al., 2019). The study conducted by Fan et al. (2010) propose that the determination of appropriate carrying capacity should follow the principle of the “law of the minimum limiting factors” in order to minimize degradation of the grasslands, i.e., stocking rates should be primarily based on herbage yields of low-productivity years, there is also the opportunity to conserve forage in high-yield years and carry this over to alleviate grazing pressure in low-yield years. Further, there is the possibility of reducing grazing pressure on more degraded parts of the grassland in high-yield years to aid their recovery. For sustainable development, it is insufficient to manage grazing systems solely within the framework of pasture productivity (Lin et al., 2011) especially for distinctive erosion areas (level II). The ‘optimum’ stocking rate should be obtained from grazing experiments not only considering the forage-livestock balance, but also maintaining the soil erosion at a tolerable level. Sun et al. (2015) conducted a 3-year study on Tibetan sheep on the Eastern Qinghai-Tibetan Plateau. They found that the ‘optimum’ stocking rate that ensures economic sustainability is 24 sheep months ha–1 (Sun et al., 2015). Considering moderately severe soil erosion conditions in this area, the stocking rate should not exceed one-third of the ‘optimum’ stocking rate in order to prevent and control the soil erosion loss at level II soil erosion regions. If herder households comply with this policy, then they should be able to receive a subsidy.
The severe sector (level I) should be managed intensively to improve grassland productivity via the application of certain measures (fertilization, tillage, and resowing) for the sustainable utilization of grassland (Figure 6). When soil erosion is at the level I, the stocking amount should not exceed two-thirds of the ‘optimum’ stocking rate in order to obtain a certain production income, meanwhile prevent and control the soil erosion. In addition, the stocking rate in the cold-period pastures should be less than the stocking rate in the warm-season pastures (Sun et al., 2015).
New models using machine learning techniques that combine local ecological variables (n = 33) were constructed based on the observed soil erosion modulus determined by the 137Cs element tracing technique. 13 environmental variables played critical roles in explaining the process of soil erosion. The results from the comprehensive set of variables were more objective than the produced from the RUSLE model. Nearly 99% of the study region has an intensive erosion modulus (5,000–8,000 t⋅km–2⋅a–1). Northern soil erosion modulus was higher intense than that in the Southern of the SPYR. The total erosion loss was almost 8.45⋅108 t⋅a–1 in SPYR. The annual economic loss of SOC caused by soil erosion throughout the entire survey zone was generally $47.90 billion in 2014. In addition, integrating monetization of nature resource into soil erosion classification outlined a partial solution in eco-compensation, and provided ecological policy recommendations for three levels of soil erosion. That is a more accurate and flexible method of managing grasslands.
The economic monetization of soil erosion may be underestimated. This manuscript only accounted for SOC loss during soil erosion. Obviously, natural resources are priceless. Monetization of nature resource is only a partial solution in eco-compensation.
The original contributions presented in the study are included in the article/Supplementary Material, further inquiries can be directed to the corresponding author.
HL conceptualized this study and led the writing. HL and YZ collected and analyzed the data, interpreted the results, and revised the text. Both authors contributed to this work and approved the final manuscript before submission.
This work was supported by the National Natural Science Foundation of China (32171680 and 31772666) and the Fundamental Research Funds for the Central Universities (lzujbky-2021-kb13).
The authors declare that the research was conducted in the absence of any commercial or financial relationships that could be construed as a potential conflict of interest.
All claims expressed in this article are solely those of the authors and do not necessarily represent those of their affiliated organizations, or those of the publisher, the editors and the reviewers. Any product that may be evaluated in this article, or claim that may be made by its manufacturer, is not guaranteed or endorsed by the publisher.
We thank Kalhoro Ghulam Mujtaba (a candidate at Lanzhou University) for assistance in editing the English in the manuscript. The constructive comments and suggestions from reviewers are also highly appreciated.
The Supplementary Material for this article can be found online at: https://www.frontiersin.org/articles/10.3389/fevo.2021.771439/full#supplementary-material
Abdelwahab, O. M. M., Ricci, G. F., De Girolamo, A. M., and Gentile, F. (2018). Modelling soil erosion in a mediterranean watershed: comparison between Swat and annagnps models. Environ. Res. 166, 363–376. doi: 10.1016/j.envres.2018.06.029
Akpa, S. I. C., Odeh, I. O. A., Bishop, T. F. A., Hartemink, A. E., and Amapu, I. Y. (2016). Total soil organic carbon and carbon sequestration potential in nigeria. Geoderma 271, 202–215.
Atkinson, P. M., and Massari, R. (1998). Generalised linear modelling of susceptibility to landsliding in the central apennines. Italy. Comput. Geosci. 24, 373–385.
Bakker, M. M., Govers, G., Kosmas, C., Vanacker, V., Oost, K. V., and Rounsevell, M. (2005). Soil erosion as a driver of land-use change. Agric. Ecosyst. Environ. 105, 467–481. doi: 10.1016/j.agee.2004.07.009
Cao, S. K., Cheng, K. L., Cao, G. C., Zhang, L., Ma, J., Yang, L., et al. (2011). The analysis of characteristic and spatial variability for soil organic matter and organic carbon around qinghai lake. Proc. Environ. Sci. 10, 678–684. doi: 10.1016/j.proenv.2011.09.109
Chang, Y. C., Chang, K. H., and Wu, G. J. (2018). Application of eXtreme gradient boosting trees in the construction of credit risk assessment models for financial institutions. Appl. Soft. Comput. J. 73, 914–920. doi: 10.1016/j.asoc.2018.09.029
Chen, Q., Qi, S., and Sun, L. (2000). Process and trend of soil loss tolerance research. Bull. Soil Water Conserv. 20, 9–13. doi: 10.3969/j.issn.1000-288X.2000.01.003
Choubin, B., Darabi, H., Rahmati, O., Sajedi-Hosseini, F., and Klove, B. (2018). River suspended sediment modelling using the CART model: a comparative study of machine learning techniques. Sci. Total Environ. 615, 272–281. doi: 10.1016/j.scitotenv.2017.09.293
Costanza, R., D’Arge, R., Groot, R., Farber, S., Grasso, M., Hannon, B., et al. (1998). The value of the world’s ecosystem services and natural capital. Ecol. Econ. 25, 3–15. doi: 10.1016/S0921-8009(98)00020-2
De Jong, S. M., Paracchini, M. L., Bertolo, F., Folving, S., Megier, J., and De Roo, A. P. J. (1999). Regional assessment of soil erosion using the distributed model SEMMED and remotely sensed data. Catena 37, 291–308. doi: 10.1016/S0341-8162(99)00038-7
Doetterl, S., van Oost, K., and Six, J. (2012). Towards constraining the magnitude of global agricultural sediment and soil organic carbon fluxes. Earth Surface Proc. Land. 37, 642–655.
Efthimiou, N. (2018). The importance of soil data availability on erosion modeling. Catena 165, 551–566. doi: 10.1016/j.catena.2018.03.002
Evans, R. (2005). Curtailing grazing-induced erosion in a small catchment and its environs, the peak district, central england. Appl. Geogr. 25, 81–95. doi: 10.1016/j.apgeog.2004.11.002
Evans, R., Collins, A. L., Zhang, Y., Foster, I. D. L., Boardman, J., Sint, H., et al. (2017). A comparison of conventional and 137 Cs-based estimates of soil erosion rates on arable and grassland across lowland England and Wales. Earth Sci. Rev. 173, 49–64. doi: 10.1016/j.earscirev.2017.08.005
Fan, J. W., Shao, Q. Q., Liu, J. Y., Wang, J. B., Harris, W., Chen, Z. Q., et al. (2010). Assessment of effects of climate change and grazing activity on grassland yield in the three rivers headwaters region of qinghai–tibet plateau, China. Environ. Monit. Asses. 170, 571–584.
Fassnacht, F. E., Li, L., and Fritz, A. (2015). Mapping degraded grassland on the eastern tibetan plateau with multi-temporal landsat 8 datawhere do the severely degraded areas occur? Int. J. Appl. Earth Observ. Geoinform. 42, 115–127. doi: 10.1016/j.jag.2015.06.005
Gayen, A., Pourghasemi, H. R., Saha, S., Keesstra, S., and Bai, S. (2019). Gully erosion susceptibility assessment and management of hazard-prone areas in India using different machine learning algorithms. Sci. Total Environ. 668, 124–138.
Ge, J., Meng, B., Liang, T. G., Feng, Q. S., Gao, J. L., Yang, S. X., et al. (2018). Modeling alpine grassland cover based on MODIS data and support vector machine regression in the headwater region of the Huanghe River, China. Remote Sensing Environ. 218, 162–173. doi: 10.1016/j.rse.2018.09.019
Ge, J., Meng, B. P., Yang, S. X., Gao, J. L., Yang, J. P., Zhang, R. P., et al. (2017). Monitoring of above-ground biomass in alpine grassland based on agricultural digital camera and MODIS remote sensing data: a case study in the yellow river headwater region. Acta Pratacul. Sin. 26, 23–34.
Gholami, V., Booij, M. J., Nikzad, T. E., and Hadian, M. A. (2018). Spatial soil erosion estimation using an artificial neural network (ANN) and field plot data. Catena 163, 210–218. doi: 10.1016/j.catena.2017.12.027
Gourfi, A., Daoudi, L., and Shi, Z. (2018). The assessment of soil erosion risk, sediment yield and their controlling factors on a large scale: example of morocco. J. Afr. Earth Sci. 147, 281–299. doi: 10.1016/j.jafrearsci.2018.06.028
Hancock, G. R., Wells, T., Martinez, C., and Dever, C. (2015). Soil erosion and tolerable soil loss: insights into erosion rates for a well-managed grassland catchment. Geoderma 23, 256–265. doi: 10.1016/j.geoderma.2014.08.017
Haribala, H., Hu, B., Wang, C., Gerilemandahu, Xu, X., Zhang, S., et al. (2016). Assessment of radioactive materials and heavy metals in the surface soil around uranium mining area of tongliao, china. Ecotoxicol. Environ. Saf. 130, 185–192.
Harris, R. B. (2010). Rangeland degradation on the qinghai-tibetan plateau: a review of the evidence of its magnitude and causes. J. Arid Environ. 2010, 1–12. doi: 10.1016/j.jaridenv.2009.06.014
Heung, B., Ho, H. C., Zhang, J., Knudby, A., Bulmer, C. E., and Schmidt, M. G. (2016). An overview and comparison of machine-learning techniques for classification purposes in digital soil mapping. Geoderma 265, 62–77. doi: 10.1016/j.geoderma.2015.11.014
Hosseini, M., Movahedi Naeini, S. A., Dehghani, A. A., and Khaledian, Y. (2016). Estimation of soil mechanical resistance parameter by using particle swarm optimization, genetic algorithm and multiple regression methods. Soil Tillage Res. 157, 32–42. doi: 10.1016/j.still.2015.11.004
Jia, W., Liu, M., Yang, Y., He, H., Zhu, X., Yang, F., et al. (2016). Estimation and uncertainty analyses of grassland biomass in Northern China: comparison of multiple remote sensing data sources and modeling approaches. Ecol. Indic. 60, 1031–1040. doi: 10.1016/j.ecolind.2015.09.001
Jiang, Y., Gao, Y., Dong, Z., Liu, B., and Zhao, L. (2018). Simulations of wind erosion along the qinghai-tibet railway in north-central tibet. Aeolian Res. 32, 192–201. doi: 10.1016/j.aeolia.2018.03.006
Kinnell, P. I. A. (2017). A comparison of the abilities of the USLE-M, RUSLE2 and WEPP to model event erosion from bare fallow areas. Sci. Total Environ. 596-597, 32–42. doi: 10.1016/j.scitotenv.2017.04.046
Konz, N., Prasuhn, V., and Alewell, C. (2012). On the measurement of alpine soil erosion. Catena 91, 63–71. doi: 10.1016/j.catena.2011.09.010
Li, J., Alvarez, B., Siwabessy, J., Tran, M., Huang, Z., Przeslawski, R., et al. (2017). Application of random forest, generalised linear model and their hybrid methods with geostatistical techniques to count data: predicting sponge species richness. Environ. Mod. Soft. 97, 112–129. doi: 10.1016/j.envsoft.2017.07.016
Li, L., Du, S., Wu, L., and Liu, G. (2009). An overview of soil loss tolerance. Catena 78, 93–99. doi: 10.1016/j.catena.2009.03.007
Li, T. C., Shao, M., Jia, Y. H., Jia, X. X., and Huang, L. M. (2018). Small-scale observation on the effects of the burrowing activities of mole crickets on soil erosion and hydrologic processes. Agric. Ecosyst. Environ. 261, 136–143. doi: 10.1016/j.agee.2018.04.010
Li, X., and Ma, X. (2018). An improved simulated annealing algorithm for interactive multi-objective land resource spatial allocation. Ecol. Complexity 36, 184–195. doi: 10.1016/j.ecocom.2018.08.008
Li, Y. F., Wang, Z. G., Zhao, J. L., Lin, Y. M., Tang, G. P., Tao, Z., et al. (2021). Characterizing soil losses in china using data of 137Cs inventories and erosion plots. Catena 203:105296.
Liang, T. G., Yang, S. X., Feng, Q. S., Liu, B., Zhang, R. P., Huang, X. D., et al. (2016). Multi-factor modeling of above-ground biomass in alpine grassland: a case study in the three-river headwaters region, China. Remote Sensing Environ. 186, 164–172. doi: 10.1016/j.rse.2016.08.014
Lin, H. L., Feng, Q. S., Liang, T. G., and Ren, J. Z. (2013). Modelling global-scale potential grassland changes in spatio-temporal patterns to global climate change. Int. J. Sust. Dev. World Ecol. 20, 83–96. doi: 10.1080/13504509.2012.749815
Lin, H. L., Long, R. J., and Ren, J. Z. (2008). Grazing-induced erosion: review and prospect. Chin. J. Ecol. 12, 2222–2227.
Lin, H. L., Wang, Z. Q., and Zhang, Y. J. (2011). Evaluation of forage-livestock balance mechanisms under the perspective of integrated grazing system. Acta Agrestia Sin. 19, 717–723.
Ma, T., Brus, D. J., Zhu, A. X., Zhang, L., and Scholten, T. J. G. (2020). Comparison of conditioned latin hypercube and feature space coverage sampling for predicting soil classes using simulation from soil maps. Geoderma 370:114366.
Madsen, D. (2016). Conceptualizing the tibetan plateau: environmental constraints on the peopling of the “Third Pole”. Arch. Res. Asia 5, 24–32. doi: 10.1016/j.ara.2016.01.002
Mariano, D. A., Santos, C. A. C., Wardlow, B. D., Anderson, M. C., Schiltmeyer, A. V., Tadesse, T., et al. (2018). Use of remote sensing indicators to assess effects of drought and human-induced land degradation on ecosystem health in Northeastern Brazil. Remote Sens. Environ. 213, 129–143. doi: 10.1016/j.rse.2018.04.048
Marjanoviæ, M., Kovaèeviæ, M., Bajat, B., and Voženílek, V. (2011). Landslide susceptibility assessment using SVM machine learning algorithm. Eng. Geol. 123, 225–234.
Meng, F., Su, F., Yang, D., Tong, K., and Hao, Z. (2016). Impacts of recent climate change on the hydrology in the source region of the yellow river basin. J. Hydrol. Regional Stud. 6, 66–81. doi: 10.1016/j.ejrh.2016.03.003
Mhazo, N., Chivenge, P., and Chaplot, V. (2016). Tillage impact on soil erosion by water: discrepancies due to climate and soil characteristics. Agric. Ecosyst. Environ. 230, 231–241. doi: 10.1016/j.agee.2016.04.033
Micheletti, N., Foresti, L., Robert, S., Leuenberger, M., Pedrazzini, A., Jaboyedoff, M., et al. (2013). Machine learning feature selection methods for landslide susceptibility mapping. Math. Geosci. 46, 33–57.
Miehe, G., Schleuss, P. M., Seeber, E., Babel, W., Biermann, T., Braendle, M., et al. (2019). The kobresia pygmaea ecosystem of the tibetan highlands – origin, functioning and degradation of the world’s largest pastoral alpine ecosystem. Sci. Total Environ. 648, 754–771. doi: 10.1016/j.scitotenv.2018.08.164
Ministry of Water Resources of the People’s Republic of China (2007). Standards for Classification and Gradation of Soil Erosion (SL 190-2007). Beijing: China Standard Press.
Moisen, G. G., Freeman, E. A., Blackard, J. A., Frescino, T. S., Zimmermann, N. E., and Edwards, T. C. (2006). Predicting tree species presence and basal area in utah: a comparison of stochastic gradient boosting, generalized additive models, and tree-based methods. Ecol. Mod. 199, 176–187.
Nosrati, K., Haddadchi, A., Zare, M. R., and Shirzadi, L. (2015). An evaluation of the role of hillslope components and land use in soil erosion using 137Cs inventory and soil organic carbon stock. Geoderma 24, 29–40. doi: 10.1016/j.geoderma.2014.12.008
Patton, D., Bergstrom, J. C., Moore, R., and Covich, A. P. (2015). Economic value of carbon storage in U.S. national wildlife refuge wetland ecosystems. Ecosyst. Serv. 16, 94–104. doi: 10.1016/j.ecoser.2015.10.017
Peng, J., Biswas, A., Jiang, Q., Zhao, R., Hu, J., Hu, B., et al. (2018). Estimating soil salinity from remote sensing and terrain data in southern Xinjiang Province, China. Geoderma 337:6. doi: 10.1016/j.geoderma.2018.08.006
Pouteau, R., Rambal, S., Ratte, J. P., Gogé, F., Joffre, R., and Winkel, T. (2011). Downscaling modis-derived maps using gis boosted regression trees : the case of frost occurrence over the arid andean highlands of bolivia. Remote Sensing Environ. 115, 117–129.
Prasannakumar, V., Vijith, H., Abinod, S., and Geetha, N. (2012). Estimation of soil erosion risk within a small mountainous sub-watershed in Kerala, India, using revised universal soil loss equation (RUSLE) and geo-information technology. Geosci. Front. 3, 209–215. doi: 10.1016/j.gsf.2011.11.003
Qinghai Bureau Statistics (2014). Qinghai Statistical Yearbook 2014. Beijing: China Academic Journal Electronic Publishing House, 279–280.
R Development Core Team (2017). R: a Language and Environment for Statistical Computing. Vienna: R Foundation for Statistical Computing.
Ren, J. (1998). Research Methods of Grassland Science (in Chinese). Beijing: China Agricultural Press.
Rudy, A. C. A., Lamoureux, S. F., Treitz, P., and van Ewijk, K. Y. (2016). Transferability of regional permafrost disturbance susceptibility modelling using generalized linear and generalized additive models. Geomorphology 264, 95–108.
Sadeghi, S. H., Raeisi, M. B., and Hazbavi, Z. (2018). Influence of freeze-only and freezing-thawing cycles on splash erosion. Int. Soil Water Conserv. Res. 6, 275–279. doi: 10.1016/j.iswcr.2018.07.004
Shen, Y., Zhang, C., Wang, X., Zou, X., and Kang, L. (2018). Statistical characteristics of wind erosion events in the erosion area of Northern China. Catena 167, 399–410. doi: 10.1016/j.catena.2018.05.020
Starkloff, T., Stolte, J., Hessel, R., Ritsema, C., and Jetten, V. (2018). Integrated, spatial distributed modelling of surface runoff and soil erosion during winter and spring. Catena 166, 147–157. doi: 10.1016/j.catena.2018.04.001
Sun, Y., Angerer, J. P., and Hou, F. J. (2015). Effects of grazing systems on herbage mass and liveweight gain of tibetan sheep in eastern qinghai-tibetan plateau, China. Rangel J. 37, 181–190. doi: 10.1071/rj14062
Tang, R., Zhao, Y. T., and Lin, H. L. (2021). Spatio-temporal variation characteristics of aboveground biomass in the headwater of the yellow river based on machine learning. Remote Sensing 13:3404.
Teng, H., Liang, Z., Chen, S., Liu, Y., Viscarra Rossel, R. A., Chappel, l. A, et al. (2018). Current and future assessments of soil erosion by water on the tibetan plateau based on RUSLE and CMIP5 climate models. Sci. Total Environ. 635, 673–686. doi: 10.1016/j.scitotenv.2018.04.146
Teng, Y. M., Zhan, J. Y., Liu, W., Sun, Y. X., Agyemang, F. B., Liang, L., et al. (2021). Spatiotemporal dynamics and drivers of wind erosion on the qinghai-tibet plateau, China. Ecol. Indic. 123:107340.
Veihe, A., Rey, J., Quinton, J. N., Strauss, P., Sancho, F. M., and Somarriba, M. (2001). Modelling of event-based soil erosion in costa rica, nicaragua and mexico: evaluation of the EUROSEM model. Catena 44, 187–203. doi: 10.1016/S0341-8162(00)00158-2
Wang, C. G., Tang, Z., and Nanm, Z. B. (2018). The caterpillar fungus boom on the tibetan plateau: curse or blessing? China Econ. Rev. 47, 65–76. doi: 10.1016/j.chieco.2017.12.003
Wang, L., Shi, Z. H., Wu, G. L., and Fang, N. F. (2014). Freeze_thaw and soil moisture effects on wind erosion. Geomorphology 207, 141–148. doi: 10.1016/j.geomorph.2013.10.032
Wang, Y., Hodgkinson, K. C., Hou, F., Wang, Z., and Chang, S. (2018). An evaluation of government-recommended stocking systems for sustaining pastoral businesses and ecosystems of the alpine meadows of the qinghai-tibetan plateau. Ecol. Evolu. 8, 4252–4264. doi: 10.1002/ece3.3960
Wang, Y., Song, Q., Du, Y., Wang, J., Zhou, J., Du, Z., et al. (2019). A random forest model to predict heatstroke occurrence for heatwave in China. Sci. Total Environ. 650, 3048–3053. doi: 10.1016/j.scitotenv.2018.09.369
Wang, Y. B., Niu, F. J., Wu, Q. B., and Gao, Z. Y. (2014). Assessing soil erosion and control factors by radiometric technique in the source region of the yellow river, tibetan plateau. Quat. Res. 81, 538–544. doi: 10.1016/j.yqres.2013.11.00
Wang, Y. B., Sun, Y., Niu, F., and Wu, Q. (2017). Using 137Cs measurements to investigate the impact of soil erosion on soil nutrients in alpine meadows within the Yangtze River region. China. Cold Regions Sci. Technol. 135, 28–33. doi: 10.1016/j.coldregions.2016.12.008
Willcock, S., Martínez-López, J., Hooftman, D. A. P., Bagstad, K. J., Balbi, S., Marzo, A., et al. (2018). Machine learning for ecosystem services. Ecosyst. Serv. 33, 165–174. doi: 10.1016/j.ecoser.2018.04.004
Wischmeier, W. H., and Smith, D. D. (1958). Rainfall energy and its relationship to soil loss. Trans. Am. Geophys. Union 3, 285–291. doi: 10.1029/TR039i002p00285
Wu, X., Zhang, X., Xiang, X., Zhang, K., Jin, H., Chen, X., et al. (2018). Changing runoff generation in the source area of the yellow river: mechanisms, seasonal patterns and trends. Cold Reg. Sci. Technol. 155, 58–68. doi: 10.1016/j.coldregions.2018.06.014
Xiong, X., Grunwald, S., Myers, D. B., Kim, J., Harris, W. G., and Comerford, N. B. (2014). Holistic environmental soil-landscape modeling of soil organic carbon. Environ. Mod. Soft. 57, 202–215. doi: 10.1016/j.envsoft.2014.03.004
Yang, D., Liu, W., Wang, J., Liu, B., Fang, Y., Li, H., et al. (2018). Wind erosion forces and wind direction distribution for assessing the efficiency of shelterbelts in northern China. Aeolian Res. 33, 44–52. doi: 10.1016/j.aeolia.2018.05.001
Yang, R. M., Zhang, G. L., Liu, F., Lu, Y. Y., Yang, F., Yang, F., et al. (2016). Comparison of boosted regression tree and random forest models for mapping topsoil organic carbon concentration in an alpine ecosystem. Ecol. Indic. 60, 870–878. doi: 10.1016/j.ecolind.2015.08.036
Yang, Y., Wang, Z., Li, J., Gang, C., Zhang, Y., Zhang, Y., et al. (2016). Comparative assessment of grassland degradation dynamics in response to climate variation and human activities in China, mongolia, pakistan and uzbekistan from 2000 to 2013. J. Arid Environ. 135, 164–172. doi: 10.1016/j.jaridenv.2016.09.004
Yao, T., Thompson, L. G., Mosbrugger, V., Zhang, F., Ma, Y., Luo, T., et al. (2012). Third pole environment (TPE). Environ. Dev. 3, 52–64. doi: 10.1016/j.envdev.2012.04.002
Yao, Z., Zhao, C., Yang, K., Liu, W., Li, Y., You, J., et al. (2016). Alpine grassland degradation in the qilian mountains, china -a case study in damaying grassland. Catena 137, 494–500. doi: 10.1016/j.catena.2015.09.021
Yin, Y., Hou, Y., Langford, C., Bai, H., and Hou, X. (2019). Herder stocking rate and household income under the grassland ecological protection award policy in northern China. Land Policy 82, 120–129. doi: 10.1016/j.landusepol.2018.11.037
You, W., Yang, Z., and Ji, G. (2014). Feature selection for high-dimensional multi-category data using PLS-based local recursive feature elimination. Exp. Syst. Appl. 41, 1463–1475. doi: 10.1016/j.eswa.2013.08.043
Zeng, F., Jiang, Z., Shen, L., Chen, W., Yang, Q., and Zhang, C. (2018). Assessment of multiple and interacting modes of soil loss in the karst critical zone, Southwest China (SWC). Geomorphology 322, 97–106. doi: 10.1016/j.geomorph.2018.08.043
Zhang, H., Fan, J., Cao, W., Harris, W., Li, Y., Chi, W., et al. (2018). Response of wind erosion dynamics to climate change and human activity in Inner Mongolia, China during 1990 to 2015. Sci. Total Environ. 639, 1038–1050. doi: 10.1016/j.scitotenv.2018.05.082
Zhang, K., Yu, Y., Dong, J., Yang, Q., and Xu, X. (2019). Adapting & testing use of USLE K factor for agricultural soils in China. Agric. Ecosyst. Environ. 269, 148–155. doi: 10.1016/j.agee.2018.09.033
Zheng, D., van der Velde, R., Su, Z., Wen, J., Wang, X., and Yang, K. (2018). Impact of soil freeze-thaw mechanism on the runoff dynamics of two tibetan rivers. J. Hydrol. 563, 382–394. doi: 10.1016/j.jhydrol.2018.06.024
Keywords: grassland degradation, 137Cs element tracing, soil erosion classification, restoration and protection management, alpine grassland
Citation: Lin HL and Zhao YT (2022) Soil Erosion Assessment of Alpine Grassland in the Source Park of the Yellow River on the Qinghai-Tibetan Plateau, China. Front. Ecol. Evol. 9:771439. doi: 10.3389/fevo.2021.771439
Received: 06 September 2021; Accepted: 13 December 2021;
Published: 05 January 2022.
Edited by:
Jian Sun, Institute of Tibetan Plateau Research, Chinese Academy of Sciences (CAS), ChinaReviewed by:
Xiaoming Kang, Institute of Wetland Research, Chinese Academy of Forestry, ChinaCopyright © 2022 Lin and Zhao. This is an open-access article distributed under the terms of the Creative Commons Attribution License (CC BY). The use, distribution or reproduction in other forums is permitted, provided the original author(s) and the copyright owner(s) are credited and that the original publication in this journal is cited, in accordance with accepted academic practice. No use, distribution or reproduction is permitted which does not comply with these terms.
*Correspondence: Huilong Lin, bGluaHVpbG9uZ0BsenUuZWR1LmNu
Disclaimer: All claims expressed in this article are solely those of the authors and do not necessarily represent those of their affiliated organizations, or those of the publisher, the editors and the reviewers. Any product that may be evaluated in this article or claim that may be made by its manufacturer is not guaranteed or endorsed by the publisher.
Research integrity at Frontiers
Learn more about the work of our research integrity team to safeguard the quality of each article we publish.