 Amanda Ratier Backes
 Larissa Frey
 José Ramón Arévalo
 Sylvia Haider
94% of researchers rate our articles as excellent or good
Learn more about the work of our research integrity team to safeguard the quality of each article we publish.
Find out more
ORIGINAL RESEARCH article
Front. Ecol. Evol., 18 November 2021
Sec. Biogeography and Macroecology
Volume 9 - 2021 | https://doi.org/10.3389/fevo.2021.758160
This article is part of the Research TopicBiodiversity across Afromontane EnvironmentsView all 13 articles
Elevational variation of vegetation has been of interest for centuries, and a prominent example for such pronounced vegetation changes can be found along the steep elevational gradient on Tenerife, Canary Islands, 200 km off the West-African cost. The 3,718-m ascent to the peak of the island volcano, Teide, offers a unique opportunity to investigate associated changes in vegetation. However, elevation is not a directly acting factor, but represents several natural environmental gradients. While the elevational variation of temperature is globally rather uniform and temperature effects on plant communities are well understood, much less is known about the region-specific elevational change of chemical soil properties and their impact on plant communities along elevational gradients. Because human interference takes place even at high-elevation areas, we considered human-induced disturbance as important third factor acting upon plant community assemblages. In our study, we compared the effects of soil properties, temperature and disturbance on species richness, functional identity and functional diversity of plant communities along the elevational gradient on Tenerife. We used pairs of study plots: directly adjacent to a road and in natural vegetation close by. In each plot, we did vegetation relevées, took soil samples, and installed temperature loggers. Additionally, we collected leaf samples to measure leaf functional traits of 80% of the recorded species. With increasing elevation, soil cation concentrations, cation exchange capacity (CEC) and pH decreased significantly, while the soil carbon to phosphorus ratio slightly peaked at mid-elevations. Temperature had the strongest effects, increasing species richness and favoring communities with fast resource acquisition. Species richness was higher at road verges, indicating the positive effect of reduced competition and artificially generated heterogeneity. However, we did not detect road effects on plant functional characteristics. Vice versa, we did not find soil effects on species richness, but increased concentrations of soil cations favored acquisitive communities. Surprisingly, we could not reveal any influence on community functional diversity. The importance of temperature aligns with findings from large-scale biogeographic studies. However, our results also emphasize that it is necessary to consider the effects of local abiotic drivers, like soil properties and disturbance, to understand variation in plant communities.
Plant community changes and plant species distributions along elevational gradients are a century-old topic in biogeography (e.g., von Humboldt, 1849; Whittaker and Niering, 1965). A prominent example of a pronounced vegetation sequence described by Alexander von Humboldt (von Humboldt and Bonpland, 1831) occurs along the steep elevational gradient on the island of Tenerife, Canary Islands, 200 km west of the African coast. Along the slopes of Mount Teide, vegetation belts comprise coastal and thermo-sclerophyllous scrub at low elevations, forests of Canary Island pine (Pinus canariensis C. Sm.) at mid-elevations and alpine scrub within the high-elevation volcanic caldera (Fernández-Palacios, 1992; Figure 1). In addition to such elevational variation in taxonomic composition, elevational patterns of plant species richness were observed worldwide (e.g., McCain and Grytnes, 2010; Haider et al., 2018). More recently, studies also addressed how community functional identity and functional diversity vary along elevational gradients (Schellenberger Costa et al., 2017; Midolo et al., 2021).
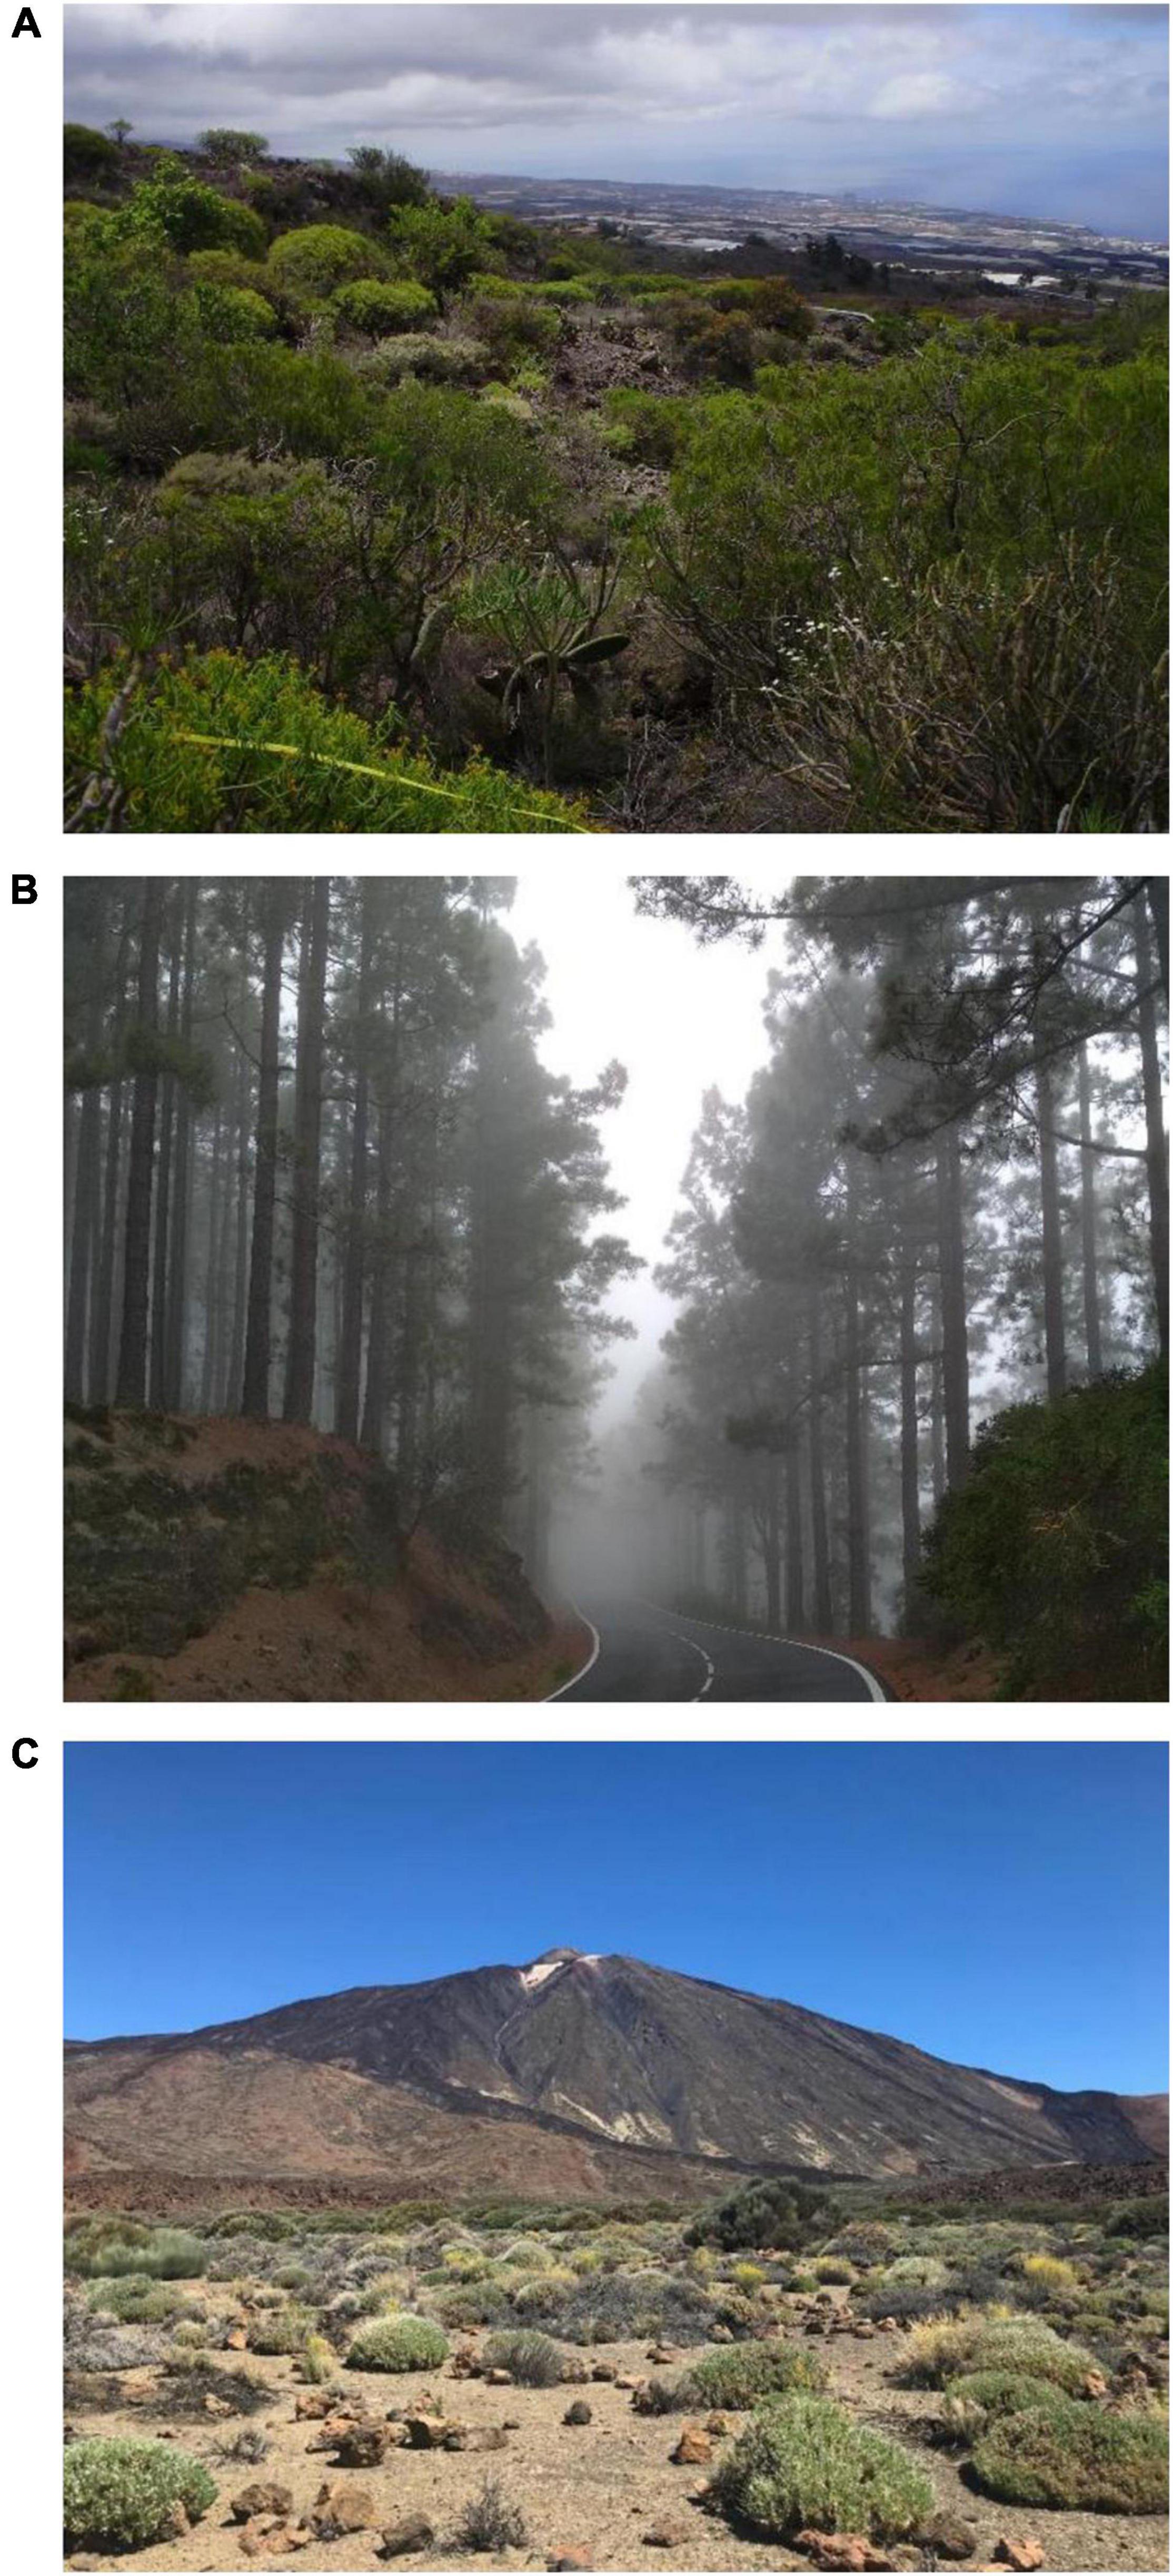
Figure 1. The elevational gradient sampled in Tenerife starts with (A) coastal vegetation and thermo-sclerophyllous scrub, followed by (B) forests of Canary Island pine (Pinus canariensis C. Sm.), and ending at the high elevation plateau of Las Cañadas with (C) high mountain scrub.
Elevation per se is not directly acting upon vegetation, but represents a number of environmental conditions (Körner, 2007). Two major environmental components changing with elevation and relevant for shaping plant communities are temperature and chemical soil properties. Temperature decreases with increasing elevation in mountains worldwide and adiabatic lapse rates have been intensely studied (Barry, 2008). In contrast, elevational changes of chemical soil properties are less frequently studied, region-specific and depend on multiple factors, such as bedrock, soil age and climatic conditions (Köhler et al., 2006; Dinter et al., 2020). These factors may affect soil acidity as well as biochemical cycles which can in turn modify concentrations of plant available nutrients (Grieve et al., 1990; Köhler et al., 2006; Unger et al., 2012; Tan and Wang, 2016). Since the environmental conditions shaping chemical soil properties (e.g., precipitation) do not necessarily change linearly with elevation (Körner, 2007), also the change of chemical soil properties might not be linearly correlated with elevation.
Soil properties are often modified by human actions (Weil and Brady, 2016). In mountains, especially the building of road infrastructure, road maintenance activities and disturbance through vehicle traffic and trampling can cause severe physical and chemical changes of road verge soil (Forman and Alexander, 1998; Johnston and Johnston, 2004). This might include higher concentrations of nutrients and less acidic soil pH, for example as a consequence of road dust, and moister conditions from road drainage (Forman and Alexander, 1998; Müllerová et al., 2011). Vehicles accessing the road verge may also lead to higher bulk density of the soil, causing lower soil permeability and thus reduced water and nutrient flows (Johnston and Johnston, 2004; Makineci et al., 2007; Deljouei et al., 2018; Yang et al., 2018). Therefore, even though soil nutrient concentrations might not differ between road verges and more natural vegetation away from the road, nutrient availability for plants may be lower in close proximity to roads as the roots may experience difficulties in penetrating hard soil or oxygen stress due to less aeration (Stirzaker et al., 1996; Makineci et al., 2007).
Both warmer temperatures and better soil conditions (more nutrients and neutral pH) have been found to increase the number of species in plant communities (Laughlin et al., 2007; Liu et al., 2020). Road disturbance should reduce competition among plants, and thus also enable a larger number of species to co-exist (Catford et al., 2012; Milbau et al., 2013; Haider et al., 2018). Moreover, temperature and soil conditions have been recognized to modify the functional characteristics of plant communities (Schellenberger Costa et al., 2017). So-called plant functional traits link morphological and physiological features to a plants’ performance (Violle et al., 2007). Functional traits measured at the individual level can be translated to the level of species assemblages via abundance-weighted community trait means and community functional diversity. Trade-offs between traits associated with resource acquisition vs. resource investment define opposing ecological strategies observed in plant species and communities. Hence, functional traits are suitable proxies to describe the competitive ability of species and the competition intensity within a community, respectively. Acquisitive strategies are characterized by fast nutrient uptake and fast growth of short-lived leaves, and therefore characteristic for species with high competitive ability, represented e.g., by high values for specific leaf area (SLA) and leaf nitrogen concentration. Vice versa, conservative strategies are related to slow nutrient uptake and slow growth of highly durable leaves, and therefore characteristic for species with high competitive ability, represented e.g., by high values for leaf dry matter content (LDMC) and high amounts of carbon in the leaves (Wright et al., 2004; Díaz et al., 2016).
Many studies have shown community leaf traits to shift from acquisitive to conservative strategies with increasing harshness of environmental conditions, such as temperature (Moles et al., 2014; Rosbakh et al., 2015; Bruelheide et al., 2018). However, fewer studies investigated functional trait responses at the community level to varying soil conditions, especially along elevational gradients (but see Gong et al., 2020; Midolo et al., 2021). Paralleling the effect of benign climatic conditions, better soil conditions with higher nutrient concentrations and intermediate pH should lead to more acquisitive plant communities, e.g., with higher SLA (Molina-Venegas et al., 2018) and higher concentrations of leaf nitrogen (Schellenberger Costa et al., 2017). In contrast, it was found that plant communities on nutrient-poor soil had lower leaf nutrient concentrations as well as lower SLA (Wright et al., 2017). Additionally, by increasing the availability of resources (space, light, nutrients), road disturbance also favors species and communities with a more acquisitive strategy (Forman and Alexander, 1998). An increase in SLA and a decrease of LDMC were observed at sites with experimental physical disturbance (Bernhardt-Römermann et al., 2011), and an increase in leaf nitrogen was found at high disturbance intensity (Carreño-Rocabado et al., 2012).
Environmental factors like temperature and chemical soil properties do not only affect community trait means, but also community functional diversity. Environmental filtering is assumed to constrain species traits to certain values (Keddy, 1992), resulting in a decrease of functional diversity under harsh environmental conditions, e.g., in areas where the climate is characterized by low temperatures (Jiang et al., 2018) or where the soil is very poor in nutrients or has extreme pH values. Studies of functional diversity along soil nutrient availability are scarce (but see Schellenberger Costa et al., 2017; López-Angulo et al., 2020; Midolo et al., 2021). Another important assembly mechanism driving the functional diversity of plant communities is the concept of limiting similarity (Macarthur and Levins, 1967; Mouillot et al., 2007). In this case, functional differences between co-existing species reduce competition, resulting in communities with high functional diversity (Mouillot et al., 2007). Another factor that comes into play is road disturbance. The removal of plant biomass and consequently of dominant competitors as part of road maintenance will allow the entry of more individuals into the community as competition for space, light and nutrients decreases. With the addition of more individuals, functional diversity should increase due to a pure sampling effect (Mayfield et al., 2010).
In our study, we investigated how environmental conditions modify plant community characteristics along a gradient on Tenerife spanning more than 2,300 m in elevation. Thereby, we asked: (1) How do soil properties change along the elevational gradient and how do soil properties differ between road verges and away-from road locations? (2) Which environmental factors (temperature, soil properties, and road disturbance) have the strongest effects on species richness, functional identity, and functional diversity of plant communities?
Our study was carried out on Tenerife, the largest of the Canary Islands, situated in the mid-Atlantic between 27° 38′ and 29° 25′ off the West-African coast. The highest point on the island is the summit of the volcano Mount Teide at 3,718 m a.s.l. The crossover of different weather system causes the humid air masses of the north-eastern trade winds to remain on the northern slopes. Consequently, the southern slopes of Tenerife, where this study’s elevational gradients are located, are characterized by an arid and warm climate (Fernández-Palacios, 1992). Temperature decreases along the elevational gradient with a lapse rate of approximately 0.5°C per 100 m (Morales Matos and Pérez González, 2000). Precipitation increases from approximately 100 mm per year at the coast to a maximum of approximately 500 mm at mid-elevations and moderately decreases again toward the summit, but with high variability due to the island’s complex topography (Morales Matos and Pérez González, 2000; AEMET, 2012). This characteristic distribution of precipitation and temperature, the history of volcanic activity, and the specific topography of the island, lead to the formation of many different types of soil (Morales Matos and Pérez González, 2000).
Data collection took place in April and May 2018. All data and samples were retrieved from the permanent plots which were established in 2008 following the design of the standardized mountain road survey of the Mountain Invasion Research Network (MIREN) (Bacaro et al., 2015; Haider et al., 2021). Thereby, three roads on the island’s southern slopes were selected, spanning from the coast to the crater of Mt. Teide. By dividing the elevational range of each road into 19 equal portions, 20 sampling locations were chosen evenly over an ascent of approximately 2,350 m. At each sampling location, two plots with 2 m × 50 m each were established, one directly adjacent and with the long side parallel to the road (hereinafter roadside plot), and a second one perpendicular to the roadside plot, at 50–100 m away from the road (hereinafter distant plot). Steep topography and private property prevented sampling in some locations, resulting in a total of 111 plots.
In each plot, all vascular plant species were identified, and their cover was visually estimated and recorded via classes from 1 to 7 (where class 1 corresponds to a cover of up to 1%; 2 = 1–5%; 3 = 6–25%; 4 = 26–50%; 5 = 51–75%; 6 = 76–95% and 7 = 96–100%). For the leaf trait sampling, we primarily aimed to collect the most abundant and most frequent species, both native and non-native species, and all life forms (grasses, forbs, shrubs, and trees). For each species, we collected 10–50 leaves from one to three typical populations, so that the sampling covered the species’ elevational distribution. Later, trait values of all populations of a species were averaged to get a single value for each trait of each species. With this approach, we obtained for each plot trait information of species making up at least 80% of the relative plot cover (except for five plots); an established threshold for a reliable characterization of the functional properties of a community (Pakeman and Quested, 2007). In total, 332 leaf samples for 189 species (out of 270 species recorded in the survey) were collected.
For a subset of the leaf samples, we conducted laboratory analyses of five traits associated with an acquisitive (SLA, leaf N, and leaf N:P ratio) and a conservative growth strategy (LDMC and leaf C:P ratio). In a second step, we used this subset of samples as “calibration samples” to predict the trait values for the remaining samples via the high-throughput method of near-infrared reflectance spectroscopy (NIRS) as described for example by Foley et al. (1998) and applied in previous projects (Kühn et al., 2021; see Supplementary Material for more details).
In the field, the calibration samples were kept in bags with a wet tissue to prevent water loss during the sampling day, then weighed and scanned with a flatbed scanner on the same day. Leaf area was calculated using WinFOLIA (Regent Instruments, Quebec, CA). The samples were subsequently dried for 72 h at 80°C in a drying oven and weighed again. LDMC was calculated as the ratio of leaf dry weight to leaf fresh weight, and SLA as the ratio of fresh leaf area to leaf dry weight (Kleyer et al., 2008; Pérez-Harguindeguy et al., 2013). The dry samples were milled into fine powder using a ball mill (MM 400, Retsch, Haan, DE). Following a nitric acid digestion and adding ammonium heptamolybdate and ascorbic acid, the concentration of leaf phosphorus was measured by visual assay with a Photometer SmartSpecTM 3000 (BIO-RAD). The total carbon and nitrogen concentrations were measured via gas-chromatography with the Dumas method (Vario EL Cube, Elementar Analysensysteme, Langenselbold, DE). From these single element values, we calculated leaf N:P and leaf C:P ratio.
Species richness was defined as the total number of species recorded per plot. Community-weighted trait means (CWMs) were calculated for each of the five leaf traits (SLA, LDMC, leaf N, leaf N:P ratio, leaf C:P ratio) and for each plot using the SYNCSA package (Debastiani and Pillar, 2012) in the R statistical environment (R Core Team, 2020):
where pi is the relative cover of species i in the community, and traiti is the trait value of species i.
To quantify functional diversity (FD), we calculated Rao’s quadratic entropy (Rao’s Q; Rao, 1982; Botta-Dukát, 2005) for each plot:
where the species’ trait distances are weighted by their relative abundance in the community. N is the number of species in the plot, pi and pj are the relative cover of species i and j, and dij is the trait distance between species i and j. Thus, Rao’s Q gives the mean functional distance between any two species in a plot. We included all five leaf traits in the calculation of Rao’s Q (multi-trait functional diversity). The calculation of functional diversity was done with species trait values scaled to unit variance, in the FD package in R (Laliberté and Legendre, 2010). Elevational variation of CWMs, functional diversity (Rao’s Q) and species richness and the effect of road proximity are shown in Supplementary Figure 1 and Supplementary Table 1. See Supplementary Table 2 for an overview of all the leaf trait, soil and temperature variables used in this study.
From three locations in each plot, we collected a bulked soil sample from the upper 10 cm of the mineral soil layer. The samples were sieved (<2 mm) and remaining, visible plant particles were removed. Soil pH was measured in 1 molar KCl. For gas-chromatographically measuring total soil carbon and nitrogen concentrations, fresh soil was dried for 72 h at 105°C and then milled to fine powder. To determine the concentrations of the base cations calcium, magnesium and potassium, fresh soil was percolated in a solution of 0.1 molar barium chloride. Afterward, the cation concentrations were measured by atomic absorption spectrometry (ContrAA 300 AAS, Analytik Jena, Jena, Germany). The concentration of hydrogen ions was measured by determining the pH of the percolates, and the cation exchange capacity (CEC) was calculated as the sum of ion equivalents of all measured exchangeable cations (Ca, K, Mg, and H). For the determination of bioavailable phosphorus, the soil samples were analyzed using the method proposed by Olsen (1954). Like for the leaf samples, the measurement of soil P was done photometrically after adding a molybdate reagent solution and an ascorbic acid solution. The ratios of N:P and of C:P were calculated.
Near-surface soil temperature was measured using miniature loggers (HOBO 64K Pendant, with 0.53°C accuracy, Bourne, MA, United States). They were installed in the center of the roadside plot and 50 m away from it, at the start of the distant plot, at a depth of 3 cm below the soil surface. They were programmed to log at 1.5 h intervals from May 2018 until April 2019. Data quality control was done in R (R Core Team, 2020), and days with less than 13 measurements per day (out of 16) were excluded when calculating the daily averages, as well as months with less than 27 days with enough measurements. After data cleaning, daily and monthly averages and the bioclimatic variables Bio10 (mean temperature of the warmest quarter) and Bio11 (mean temperature of the coldest quarter) were calculated using the climvars package (Maclean and Gardner, 2021), which follows the definitions of WorldClim (Hijmans et al., 2005). By taking into account climate of different seasons and including the periods where temperature stress might be strongest for plant growth, survival and reproduction, these two bioclimatic variables are ecologically and physiologically relevant and are widely used in species distribution studies (Lembrechts et al., 2019). We did not choose to use annual means, for example, since they cover periods that have less influence on foliage. Temperature variation with elevation and proximity to roads is shown in Supplementary Figure 2.
All statistical analyses were carried out in R version 4.1.0 (R Core Team, 2020). To get an overview about how the measured chemical soil properties are correlated, a principal component analysis (PCA) was performed (function “prcomp”) and visualized with the R packages “FactoMineR” (Lê et al., 2008) and “factoextra” (Kassambara and Mundt, 2020).
To analyze elevational changes of chemical soil properties and the influence of road proximity, we used linear mixed-effects models (R package “lmerTest”; Kuznetsova et al., 2017). Models were fitted with each of the eight investigated soil variables as response, and elevation, proximity to roads (roadside or -distant plot) and their interaction as fixed effects. Sampling location nested in road identity was added as random factor. Elevation was scaled prior to analyses. Because the interaction term was never significant, a simplified model without the interaction was fitted. P-values were calculated from F-statistics of type III sum of squares with Satterthwaite approximation to estimate the denominator degrees of freedom. We visually checked, if model assumptions were met, and transformed the response variables if necessary. This was the case for soil N and soil Mg concentrations, soil C:P and N:P ratios (log-transformed) and for soil Ca and soil K concentration and CEC (square-root-transformed). Additionally, we fitted models with the same structure, but including the quadratic term of elevation, using its second-order polynomial. We compared the AIC (Akaike’s Information Criterion) of linear and quadratic models and considered those with lower AIC as the better models. For soil pH, C:P ratio and K, the quadratic model had a lower AIC than the linear one.
To test and compare the effects of soil properties, temperature and road proximity, we used a multivariate generalized linear mixed model based on a Markov Chain Monte Carlo sampler (“MCMCglmm” function in the R package “MCMCglmm”; Hadfield, 2010). Response variables were the CWMs of SLA, LDMC, leaf N, leaf N:P, and leaf C:P, Rao’s Q of these traits (multi-trait functional diversity) and species richness. All response variables were scaled and, if necessary, transformed prior to scaling. This was the case for SLA, leaf C:P ratio, Rao’s Q, and species richness (log-transformed). As predictors we included temperature of the warmest and of the coldest quarter, proximity to roads (roadside or distant plot), and chemical soil properties, summarized by using the values of the first three axes of the PCA described above. We also permitted the interactions between road proximity and soil variables. All predictors were scaled, which allows to directly compare their effect sizes. The random effect of sampling location nested in road was added to control for the fact that all response variables were measured in the same plots. The model was fitted with a Gaussian distribution for all response variables. We ran the model with 100,000 iteration steps, discarded the first 10,000 samples as burn-in and thinned the remaining samples by storing every 25th iteration step.
We found three major axes of variation in chemical soil properties. The first PCA axis summarized cation concentrations in the soil (hereafter referred to as “cation axis”), and explained 41.1% of the total variation (Figures 2A,C). The soil cations Ca, Mg and the CEC were strongly negatively correlated with the cation axis (i.e., high positive values along this axis mean a low concentration of soil Ca and soil Mg, and low CEC). The second PCA axis summarized the concentration of soil N as well as soil C:P and N:P ratios (hereafter referred to as “nutrient axis”). This axis explained 28.6% of the total variation (Figures 2A,B). Soil N and both soil C:P and N:P ratios were negatively correlated with the nutrient axis. The third PCA axis summarized soil acidity and the concentration of soil K (hereafter referred to as “soil acidity axis”), explaining 14.2% of the total variation (Figures 2B,C). Soil pH and K were negatively correlated with the soil acidity axis.
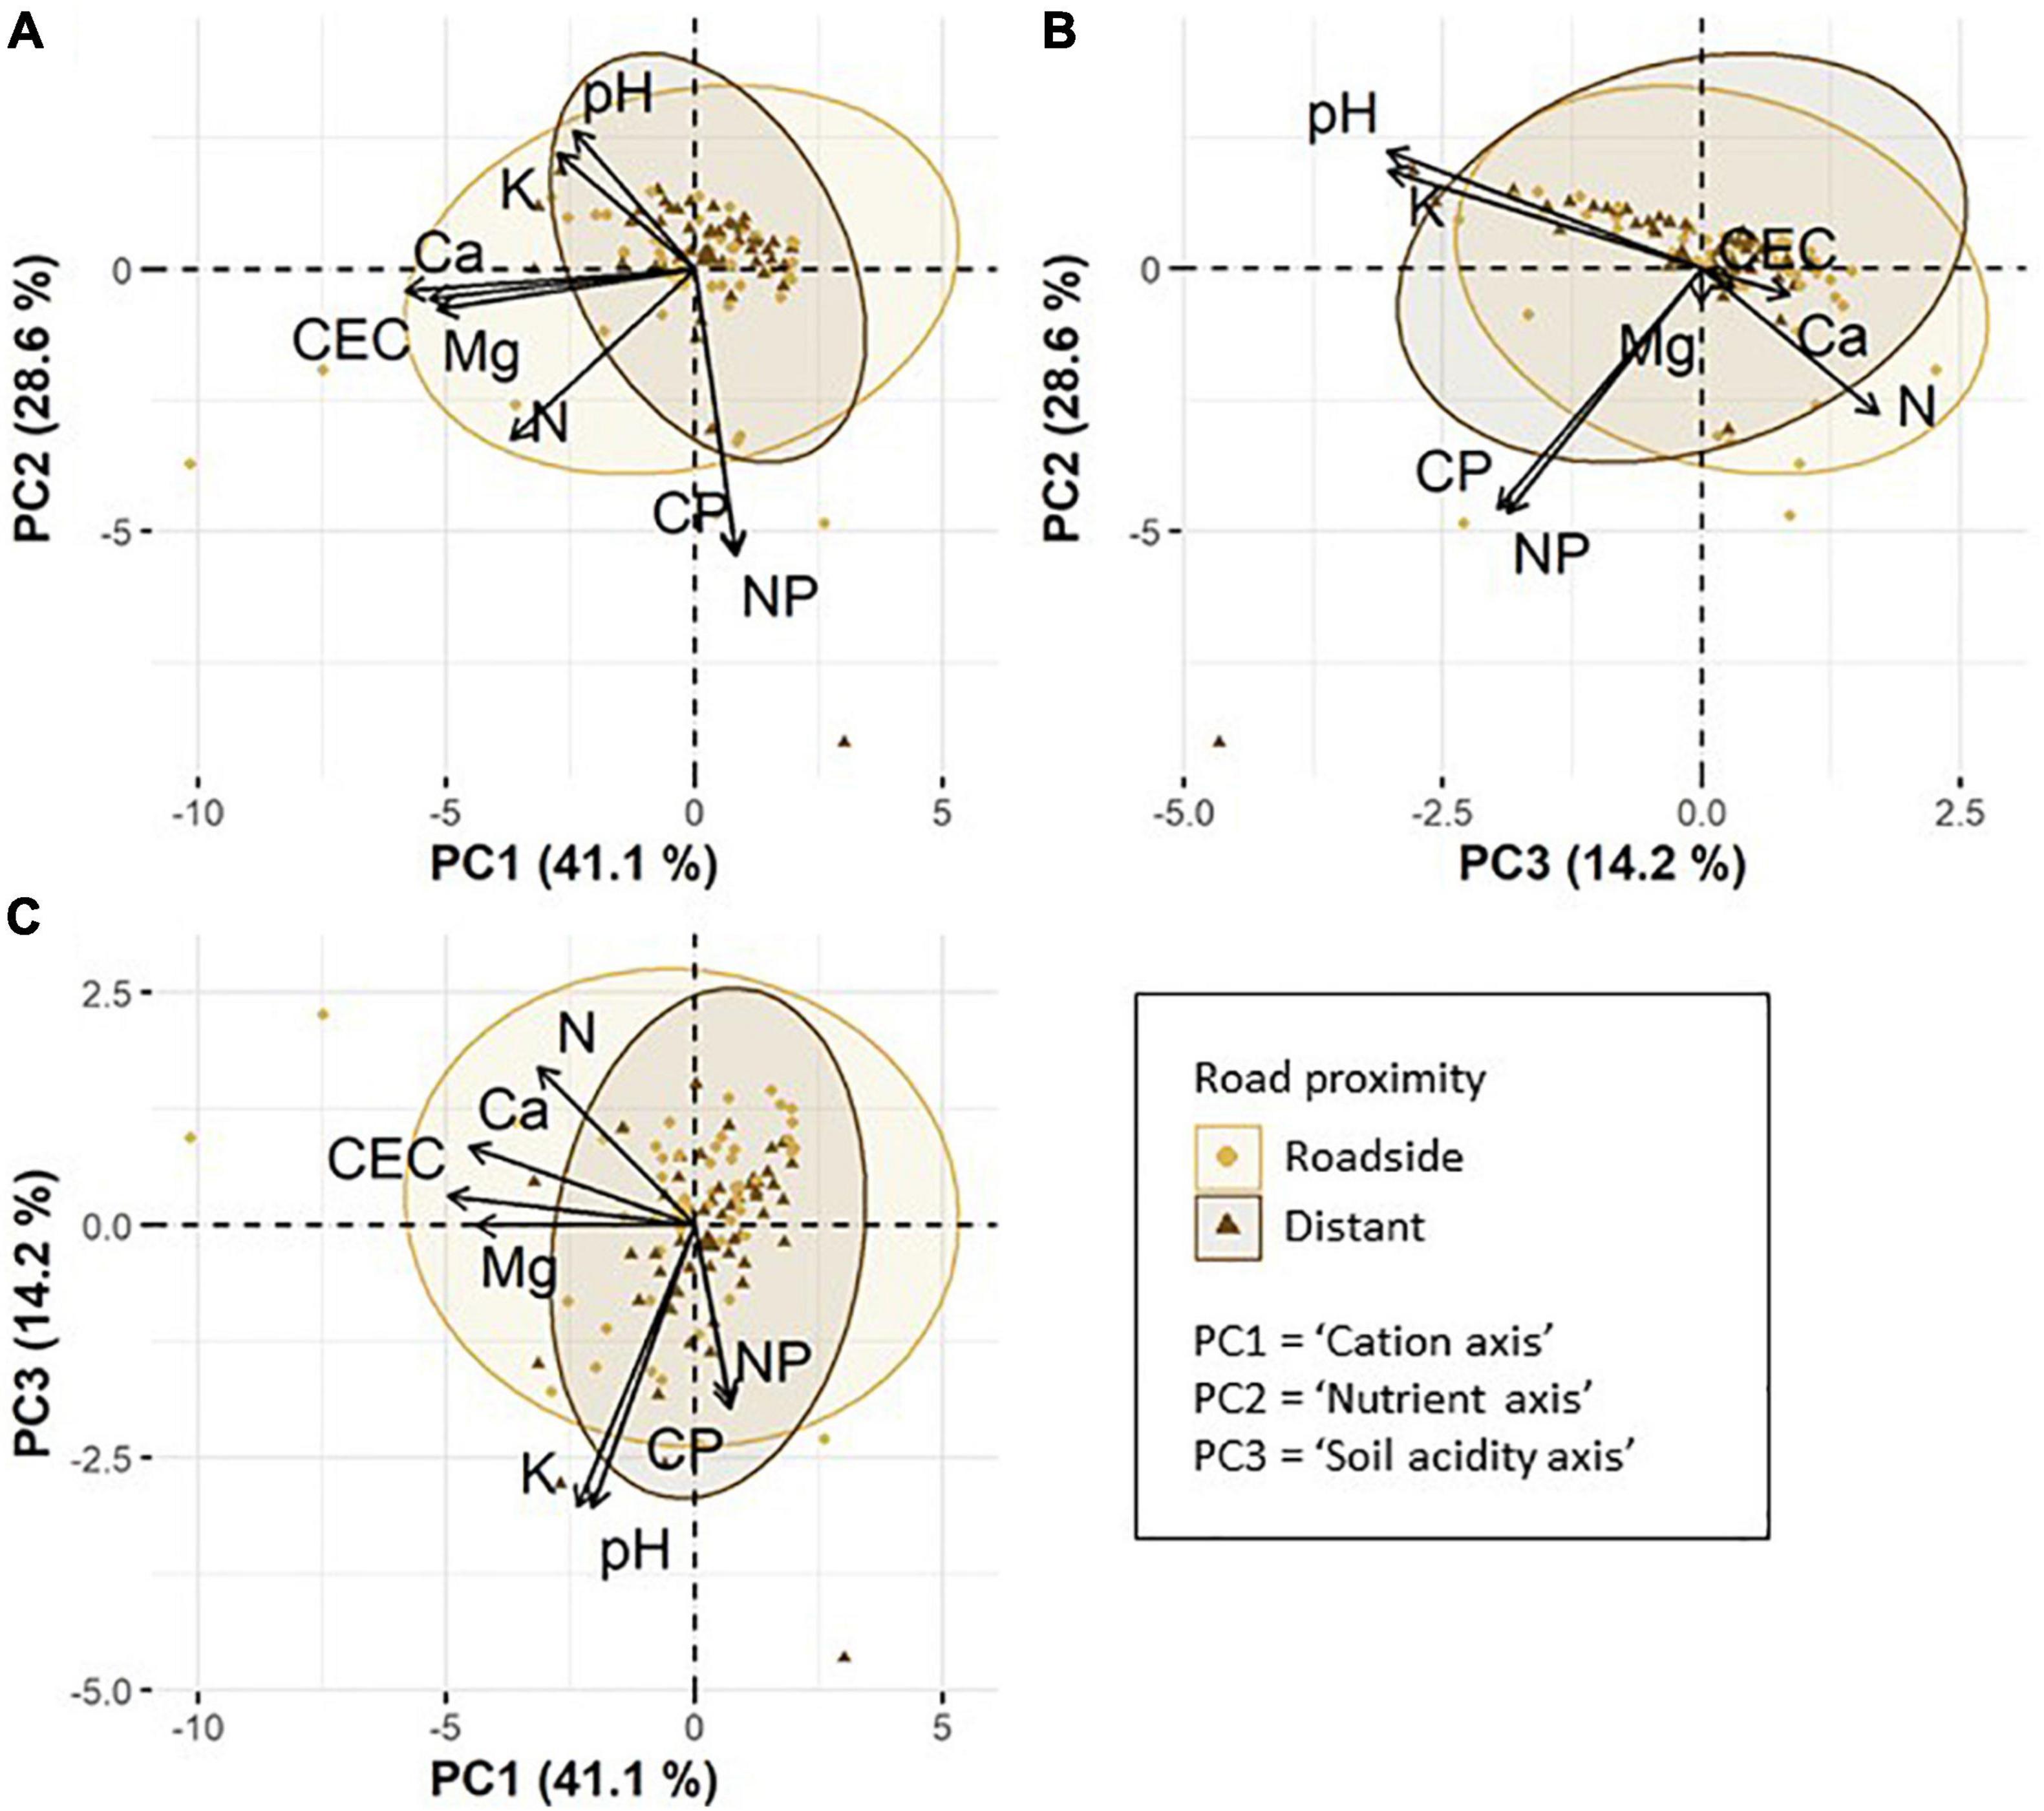
Figure 2. Principle component analysis (PCA) based on eight chemical soil properties: pH, cation exchange capacity (CEC), soil nitrogen (N), carbon to phosphorus ratio (CP), nitrogen to phosphorus ratio (NP), calcium (Ca), magnesium (Mg), and potassium (K). Per cent values show the variance explained by PC1, PC2, and PC3. The ellipses are 95% confidence ellipses and visualize the variation in soil properties of roadside plots compared to distant plots. Larger symbols correspond to the ellipse centroids. (A) displays axes PC1 and PC2, (B) axes PC3 and PC 2 and (C) axes PC1 and PC3.
Most of the investigated chemical soil properties (pH, Ca, K, Mg, and CEC) decreased significantly with increasing elevation (Figures 3A,E–H and Table 1). While soil Ca, Mg and CEC decreased continuously, pH and soil K decreased more steeply in the lower part of the elevational gradient. Soil C:P ratio peaked at mid elevations, while while soil N:P ratio did not respond to elevation (Figures 3C,D and Table 1). Soil pH values were significantly higher in roadside plots compared to distant plots (Figure 3A and Table 1). For concentrations of N and Mg, the opposite was observed (Figures 3B,G and Table 1).
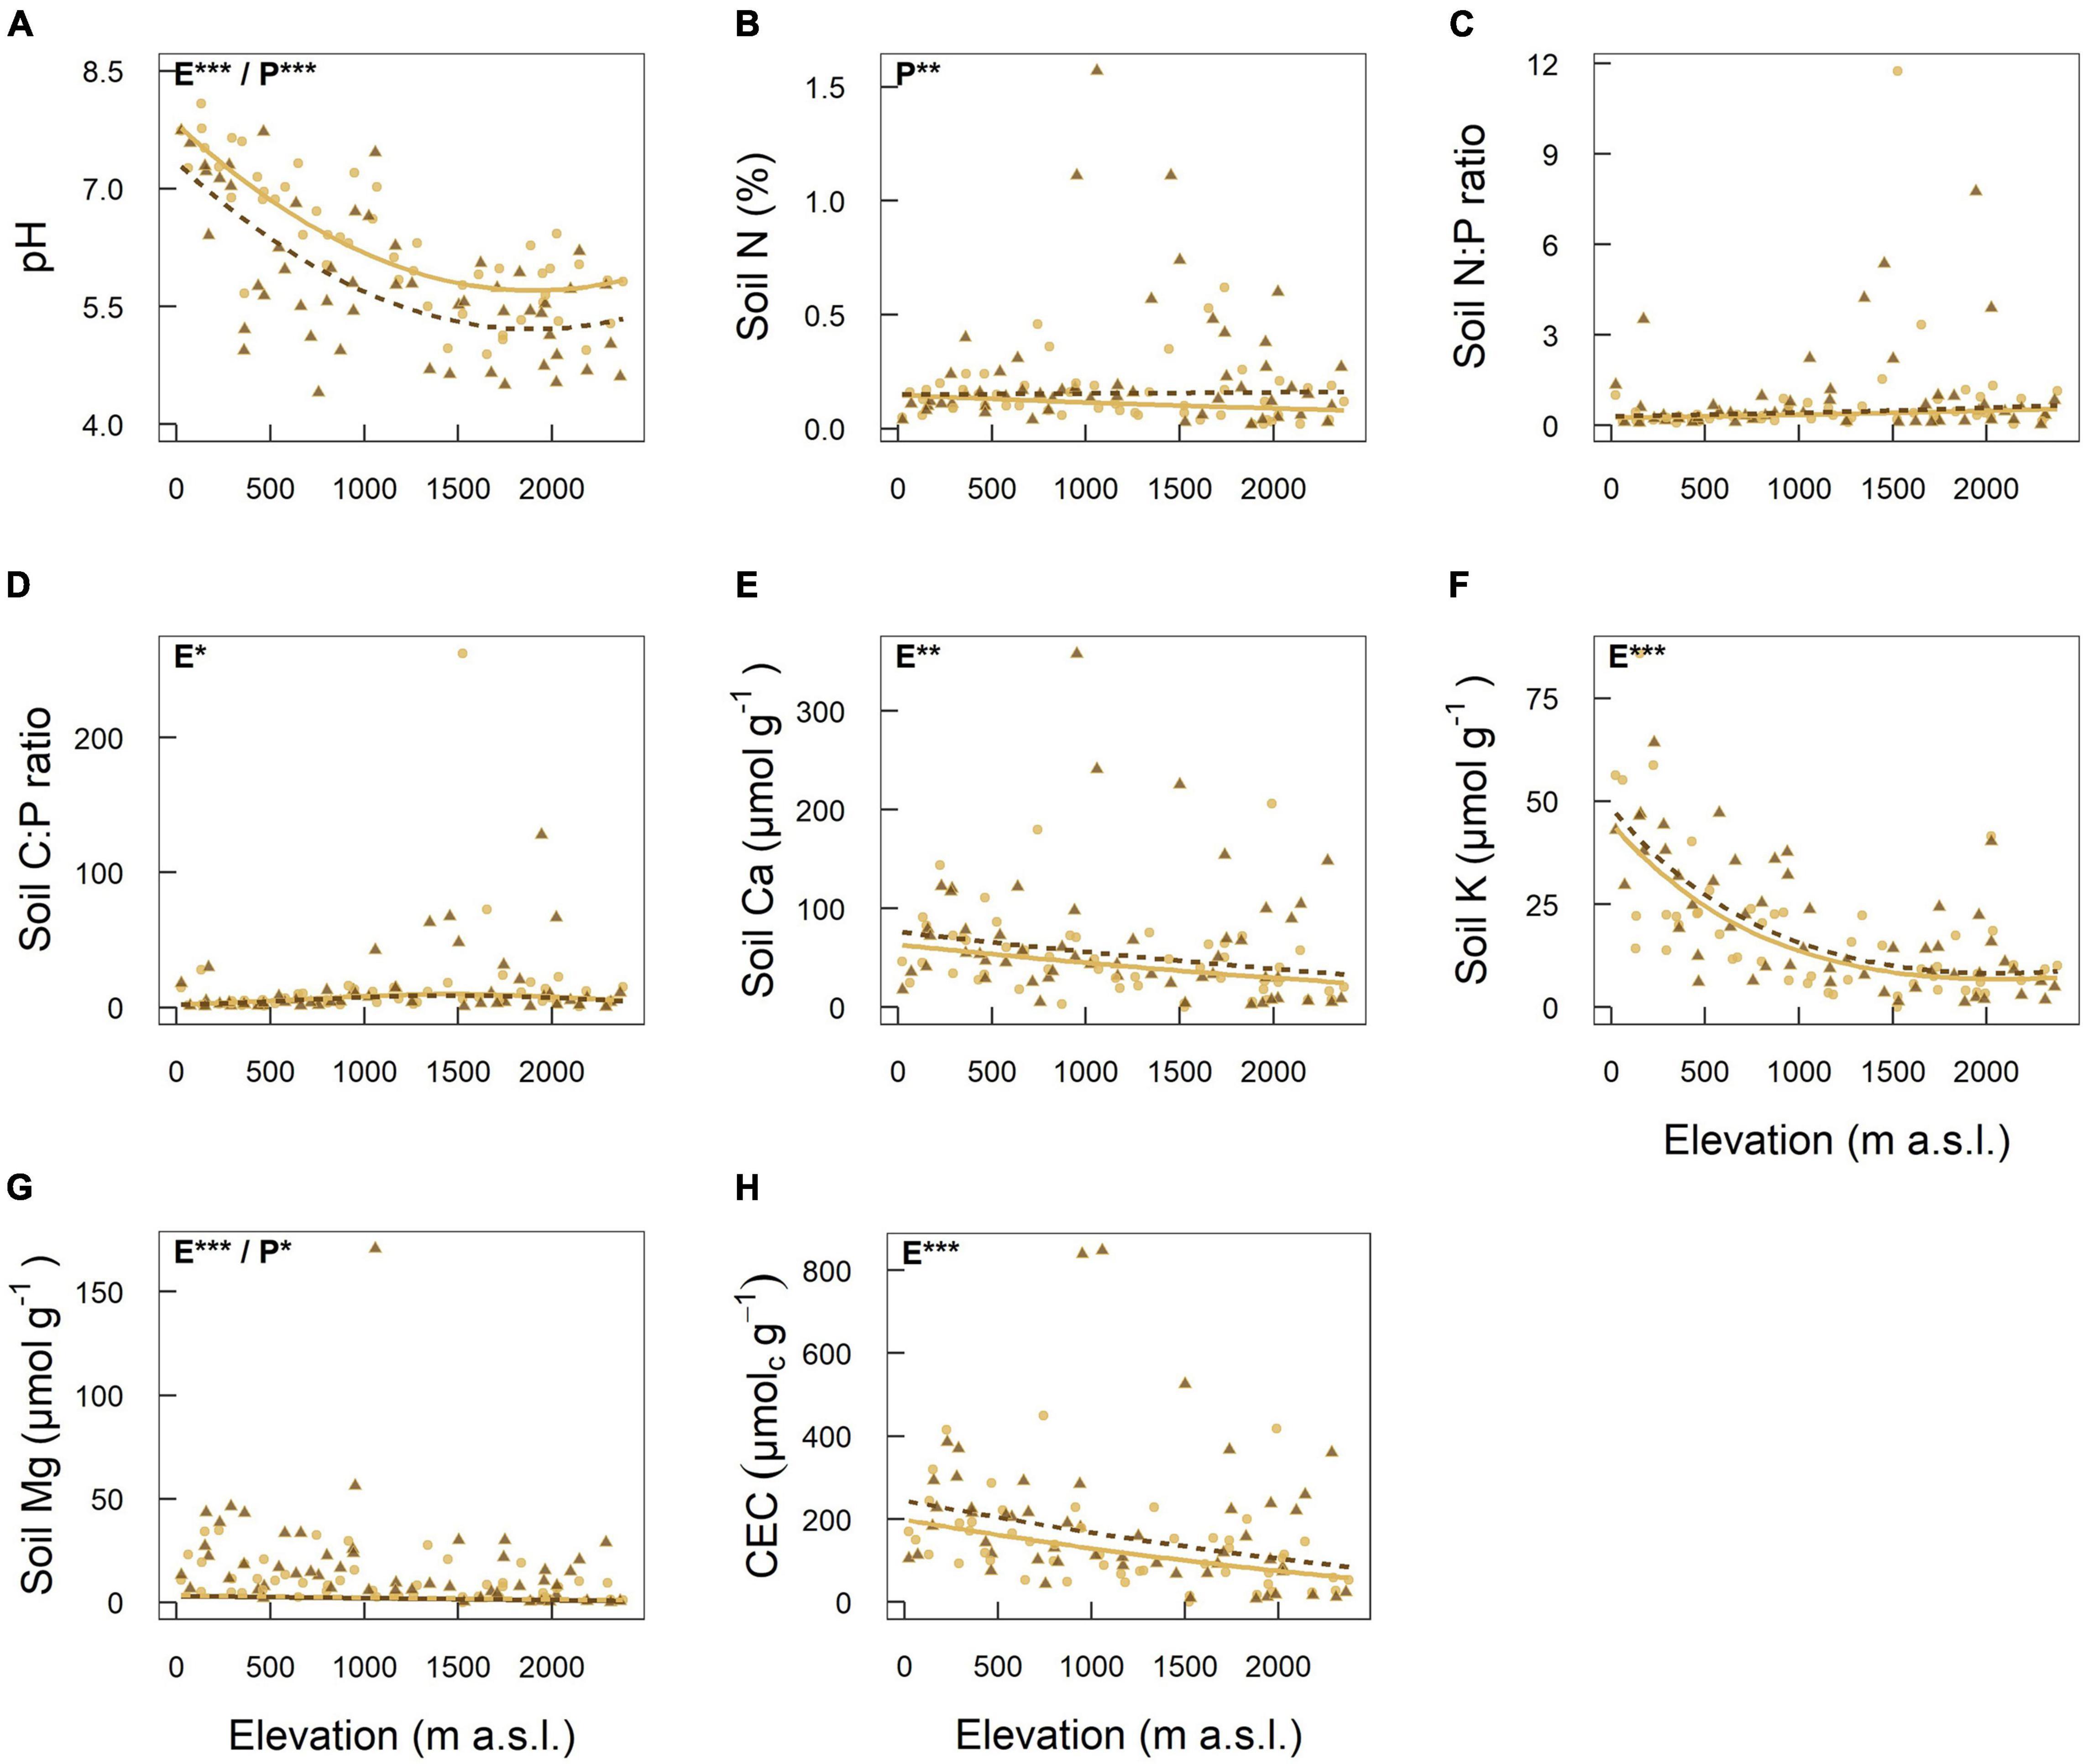
Figure 3. Elevational variation of eight chemical soil properties: (A) pH, (B) Soil nitrogen, (C) Soil nitrogen to phosphorus ratio, (D) Soil carbon to phosphorus ratio, (E) Soil calcium, (F) Soil potassium, (G) Soil magnesium, (H) Cation exchange capacity. Linear mixed-effects models were fitted separately for each soil property as response to elevation (first or second-order polynomial), road proximity (roadside or distant plot), and their interaction. Sampling location nested in road identity, which corresponds to the sampling design, was included as random effect. Light brown continuous lines and circles represent plots next to the road (roadside plots). Dark brown dashed lines and triangles represent plots away from the road in natural vegetation (distant plots). For soil pH, C:P ratio and K the model including the quadratic term of elevation had a higher explanatory power (lower AIC) compared to the model including only the linear term of elevation. Significant terms are indicated at the top left of each plot: “E” corresponds to elevation and “P” to road proximity. Significance levels are indicated as follows: < 0.001 = ***, < 0.01 = **, < 0.05 = *.
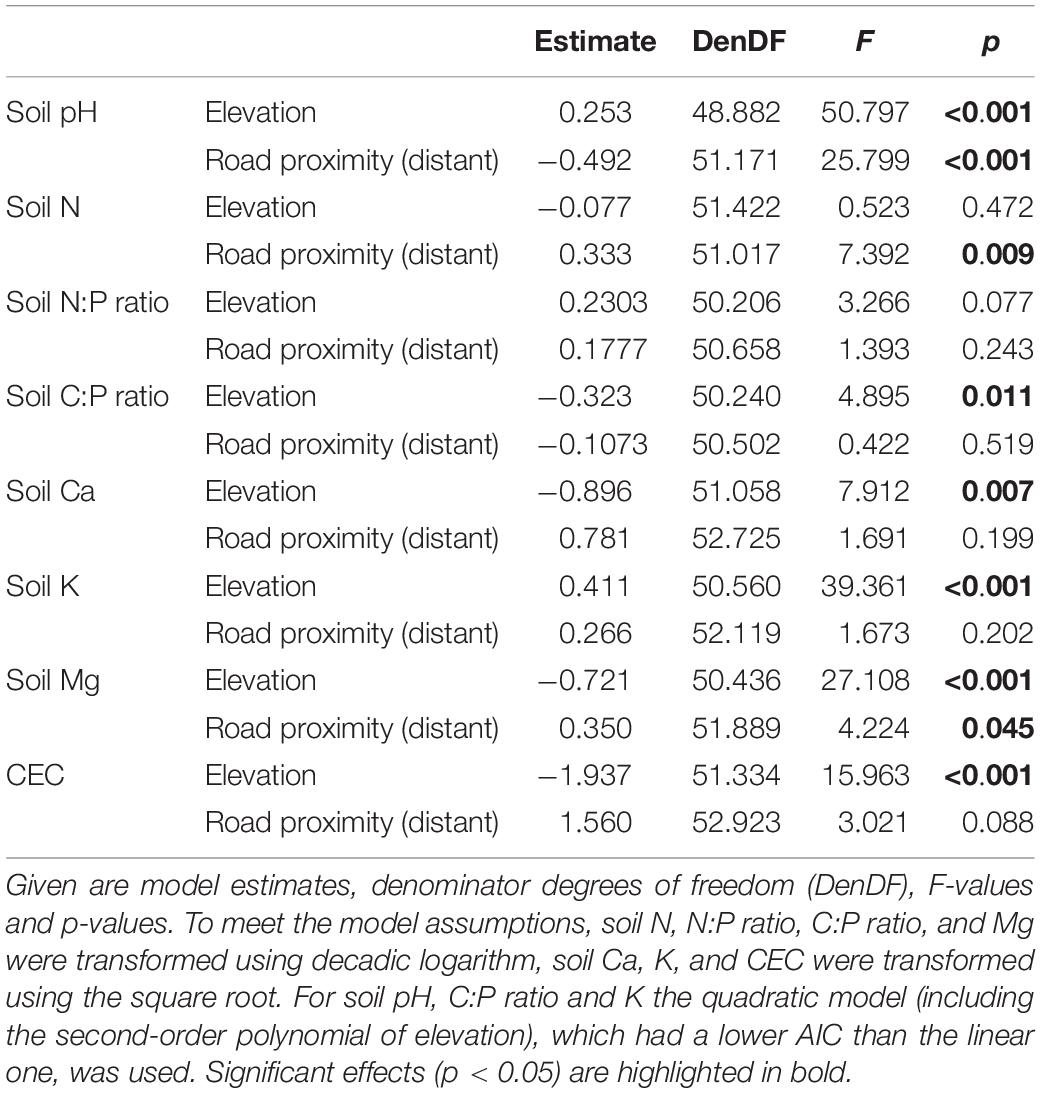
Table 1. Results from linear mixed-effects models to analyze the effects of elevation and road proximity (roadside or distant plot) on chemical soil properties.
Mean temperature of the warmest quarter had a positive effect on leaf N and a negative effect on leaf C:P ratio (Figure 4 and Supplementary Table 3). Mean temperature of the coldest quarter had a positive effect on SLA and species richness (Figure 4 and Supplementary Table 3). SLA increased with increasing CEC and soil cation concentrations (negative effect of the “cation axis,” Figure 4 and Supplementary Table 3). Species richness was higher in roadside plots compared to distant plots. Among the environmental variables tested, mean temperature of the coldest quarter had the strongest effects on vegetation characteristics (strongest on species richness, followed by the effect on SLA). The second strongest influence was exerted by mean temperature of the warmest quarter (on leaf N and second on leaf C:P ratio), followed by road proximity (on species richness) and soil cations (on SLA).
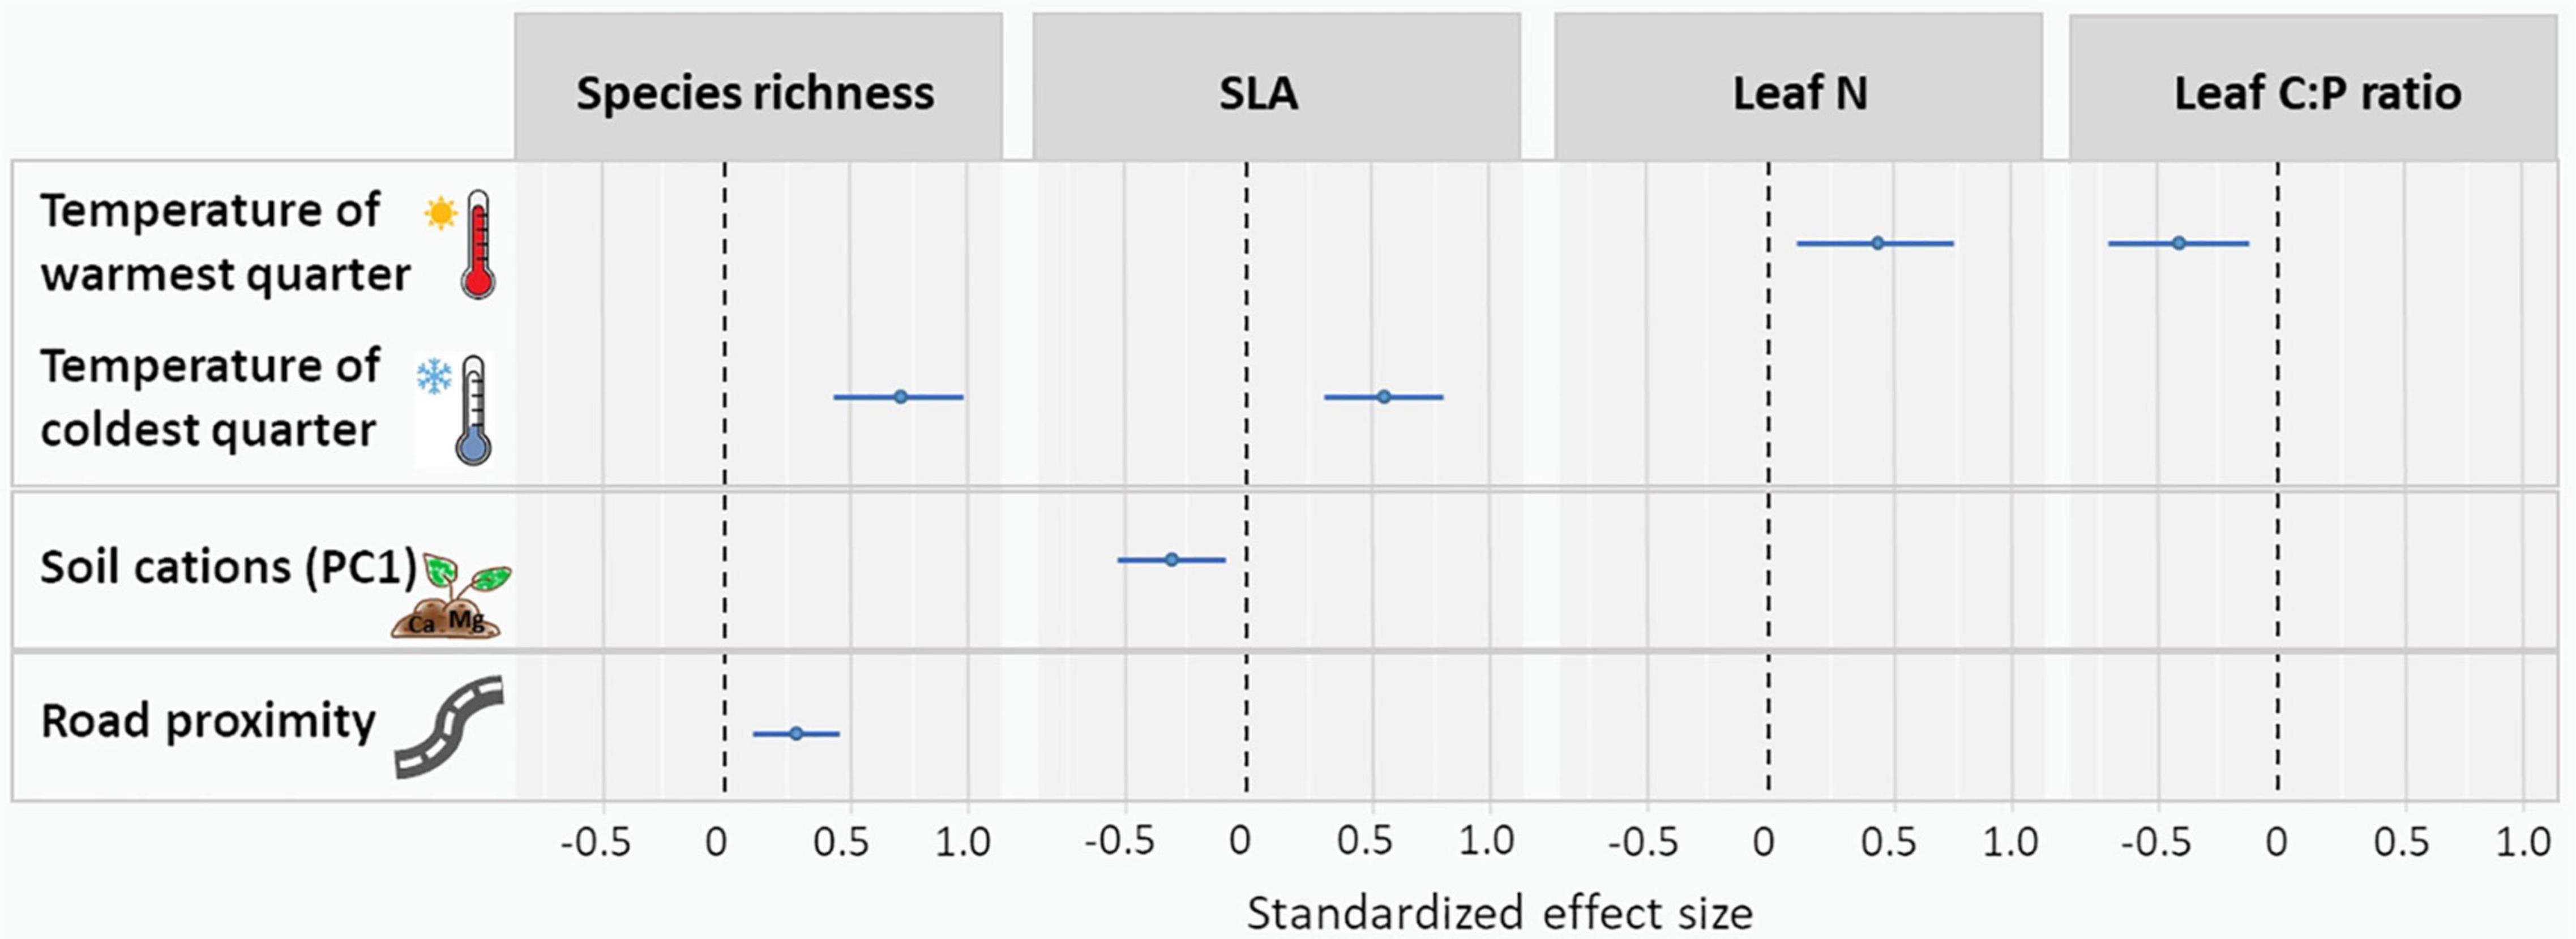
Figure 4. Standardized effect size of mean temperature of warmest quarter, mean temperature of coldest quarter, soil cations (summarized through the first axis of the PCA) and road proximity on CWMs of plant functional traits (SLA [mm2 mg–1], leaf N [%], and leaf C:P [g g–1]) and species richness. Only significant effects are shown. For complete results, see Supplementary Table 3.
Soil properties, such as soil acidity and the amount of nutrients, vary with environmental conditions and can reflect e.g., climatic differences, such as lower temperatures or aridity. This effect can be seen in particular along elevational gradients due to the strong environmental variation. In our study, the CEC, base cation concentrations (Ca, Mg, K) and pH decreased significantly along the elevational gradient on the south of Mt. Teide, on Tenerife. This elevational response of exchangeable cations is overall consistent with the results of another study conducted from mid to high elevations (1,400–3,100 m a.s.l.) on the northeastern slopes of Mt. Teide (Köhler et al., 2006), and was also found, for example, on the Galápagos Islands (Dinter et al., 2020). In contrast, a study conducted in the equatorial Andes did not observe clear elevational changes of soil base cations (Unger et al., 2012), and in Costa Rica, CEC, Ca and Mg concentrations were found to be highest at the highest elevation sampled (2,600 m a.s.l.; Grieve et al., 1990). Soil nutrient concentrations depend on multiple factors which do not necessarily change linearly with elevation (Körner, 2007). Differences in bedrock, soil age, climatic conditions or vegetation between regions result in region-specific soil property changes along elevational gradients (Köhler et al., 2006; Dinter et al., 2020). The distinct vegetational cover along the elevational gradient and thus input of litter between the study site in the equatorial Andes (Unger et al., 2012) and our study makes it difficult to sufficiently compare the results. Although soil age and bedrock are similar on the study site in Costa Rica, the investigated soil shows much greater depth and different structure. In contrast to our results, soil pH was found to increase from mid-elevations toward the tree line (around 2,100 m a.s.l.) on the northeastern slopes Mt. Teide (Köhler et al., 2006). These opposing responses of soil pH in the same mountain system are likely to be caused by different elevational patterns of precipitation: annual precipitation mainly increased within our studied elevational gradient from the coast (∽100 mm/y) to the Canary pine forest belt (∽500 mm/y), plateauing in the highest study plots. Vice versa, the lowest part of the elevational gradient studied by Köhler et al. (2006) was located in the most humid belt at mid-elevations (∽1,050 mm/y), and precipitation decreased from there toward higher elevations (480 mm/y measured at 2,160 m a.s.l., in short distance to our highest study plots; Köhler et al., 2006). Hence, pH seems to be negatively correlated to precipitation and thus soil moisture—a pattern also reported from elevational gradients, for example, on Hawaii (Vitousek and Chadwick, 2013), on the Galápagos Islands (Dinter et al., 2020), and in Italy (Dixon et al., 2016).
In our study, soil C:P ratio peaked at mid-elevations, within the belt of Canary pine forest. A high ratio of soil C:P might indicate an efficient use of phosphorus by plants and microorganisms (Zhang et al., 2016), which in our case is likely to be supported by moister conditions in this elevational belt. On the other hand, the decomposition of pine needles is a slow process, potentially slowing down the relocation of phosphorus from dead plant material into the soil. At higher elevations, colder temperatures might further reduce decomposition rates and thus also increase the soil C:P ratio. The latter was found for example in a study in Northern China, where the soil C:P ratio significantly increased with elevation (Xu et al., 2019).
Soil N and N:P ratio showed no significant variation along our studied gradient. In our study, soil analyses were only conducted on mineral soil which has lower N concentrations than the organic layer. It was found that N concentrations were highest in the organic layers due to decomposing litter (Köhler et al., 2006). Thus, the increased litter in the pine forest resulted in higher N concentrations in mid-elevation soil samples which were, however, not significantly different to other samples. The lack of significant elevational changes of N and P coincides with the results of the studies conducted on the northeastern slope of Mt. Teide on Tenerife (Köhler et al., 2006), in the equatorial Andes (Unger et al., 2012), and on Mt. Gongga in China (Tan and Wang, 2016). Overall, young soils of volcanic origin—as found on Tenerife—are usually poorly developed and have lower nutrient concentrations and lower CEC compared to older soils (Köhler et al., 2006; Tan and Wang, 2016).
We found significantly higher concentrations of soil N and Mg in plots away from the road compared to plots adjacent to the road. This contradicts our expectation that road verge soil might contain higher nutrient concentrations as a consequence, for example, of road dust, and moister conditions from road drainage (Forman and Alexander, 1998; Müllerová et al., 2011). Our results might be explained by higher bulk density caused by vehicles accessing the road verge which might lead to lower soil permeability and reduced water infiltration (i.e., greater surface runoff) and nutrient flows (Johnston and Johnston, 2004; Makineci et al., 2007; Deljouei et al., 2018; Yang et al., 2018). Other studies which investigated the effect of road proximity on soil nutrients also found higher soil N and soil Mg concentrations away from the road. They explained this increase of nutrients by higher vegetation density and higher N mineralization rates (Johnston and Johnston, 2004; Deljouei et al., 2018). Moreover, along roads, due to mechanical disturbance mainly through vehicles, finer soil material is removed and the more coarse-grained mineral soils have lower concentrations of the major nutrients P and N as well as of exchangeable cations (Johnston and Johnston, 2004).
Besides the resulting disturbance along roadsides, the construction of roads might have severe impacts on soil properties. These are especially strong, if alkaline construction material is used in naturally acidic environments (Müllerová et al., 2011). As a consequence, soil pH might increase next to roads—as found in our study as well as in other regions (Müllerová et al., 2011; Deljouei et al., 2018).
The main objective of our study was to evaluate how two important components of the environment—chemical soil properties and temperature—shape vegetation characteristics along the elevational gradient on Tenerife. Moreover, we analyzed the influence of roads on vegetation, and how the effects of soil are modified through road proximity. The strongest effects detected on different vegetation aspects analyzed in this study was that of temperature of the coldest and the warmest quarter, both variables decreasing with elevation. Species richness and SLA (acquisitive trait) significantly increased with mean winter temperature, and leaf N (acquisitive trait) increased with mean summer temperature, while leaf C:P ratio (conservative trait) decreased with mean summer temperature (Figure 4). The effect of temperature on vegetation has been widely studied (Kreft and Jetz, 2007; Šímová et al., 2011) and shifts of functional traits toward more conservative trait values with decreasing temperature and increasing elevation have been observed (Read et al., 2014; Schellenberger Costa et al., 2017). Cold temperatures and frost affect plants by causing physiological stress via cellular membrane damage on leaves and lower metabolic activities, which ultimately affect growth and reproduction (Yadav, 2010). At the high elevations of Mt. Teide, where we measured winter temperatures in the soil as cold as 1.7°C (Supplementary Figure 1), the specialist sclerophyllous shrubs dominate the communities. They seem to cope with the extreme conditions by having smaller, thicker leaves (low SLA) with high carbon content and low nutrient concentrations (high leaf C:P ratio). Because only specialist species are able to survive in such harsh conditions at high elevations, temperature also has a filtering effect on species richness toward colder sites, as observed as well on the neighboring island La Palma (Irl et al., 2015), but also at the global scale (Wright et al., 2017; Bruelheide et al., 2018) and e.g., for Kilimanjaro (Peters et al., 2019).
In our study, soil cation concentrations were the only chemical soil properties exerting a significant effect on the vegetation. SLA increased with increasing soil Ca and Mg concentrations and higher CEC. More favorable soil conditions at low elevations (with higher Ca, Mg and CEC) seem to be an important factor—in addition to temperature—which favors species with acquisitive strategies in these communities. As soil conditions get less favorable (i.e., with increasing elevation), the communities are characterized by a more conservative strategy with smaller SLA. Our results deviate from those found at Mt. Kilimanjaro, where soil nutrients (N, P, Ca, Na, K) had a negative effect on LDMC, and a positive effect on leaf N and leaf P, but not on SLA (Schellenberger Costa et al., 2017). Despite the different single results in terms of which traits were affected by soil nutrients, the overall result from Schellenberger Costa et al. (2017) also showed soil nutrients to favor acquisitive strategies. The lack of an effect from our soil nutrient axis (determined by soil N concentration, soil C:P, and N:P ratio) might be due to the very low concentrations of N and P in the poorly developed soils at Mt. Teide, as also found in another study on Tenerife (Köhler et al., 2006) and in general for Mediterranean soils (Torrent, 2005). Even though the N concentrations we found in the soil along the southern slopes of Tenerife spanned over a wide range (0.02–1.57%), comparable to values found in alpine grasslands (0.2–1.2%, Körner, 2003), only a few sites contained more soil N than found by Köhler et al. (2006) on the northern slopes (0.02–0.26%). The overall poorly developed soils in our study area might also explain why we could not detect a positive effect of soil quality on species richness, although soil quality, and species richness almost paralleled each other along the elevational gradient.
We expected species richness to be higher next to roads compared to non-road habitats, because of the disturbance in the roadside habitats, which should weaken competition among plants through an increase in bare soil, light and nutrients and thus allow more species to co-exist (Catford et al., 2012). Indeed, communities at the road verge harbored more species than the communities away from the road in our study region. However, this was likely primarily because of the heterogeneity generated by the human activities associated to roads and more available space and light than increased nutrient availability (lower soil N and Mg concentrations next to the road). The removal of biomass during road maintenance in Tenerife, for example, prevents continuous cover of highly competitive species by creating empty spots and opportunities for other species to grow. We also expected disturbance to favor species with acquisitive traits, such as high SLA (McIntyre et al., 1999; Bernhardt-Römermann et al., 2011), which allow for a quick uptake and use of the available resources. However, in our study, CWMs of the functional traits investigated did not differ between communities next to and away from the road. This finding, together with the absence of an increase in functional diversity next to roads, is surprising and difficult to explain. A possible explanation might be that during the warmest quarter, temperature in roadside plots was significantly higher than in distant plots (Supplementary Material). Therefore, the effect of road disturbance might have been captured by the overall stronger effect of temperature. Alternatively, the new species favored by disturbance at roadsides might be functionally similar and thus do not significantly contribute to functional diversity or changes in CWMs.
We found no support for the expected interaction between soil properties and road disturbance. We expected that the same amount of soil nutrients or cations, for example, would have a different impact on roadside vegetation compared to the distant vegetation, as these nutrients might not be available for plant uptake due to higher soil compaction from vehicle traffic. However, these interacting effects were not detected in any of the vegetation characteristics analyzed here. This might be explained by a less pronounced difference in soil bulk density or grain size distribution in roadside and distant plots than we presumed, and therefore a similar nutrient availability for plants.
Surprisingly, functional diversity was not affected by any of the environmental factors considered. While other studies found functional diversity to decrease through environmental filtering (but see Schellenberger Costa et al., 2017; López-Angulo et al., 2020; Midolo et al., 2021) and to increase through competition (Mayfield et al., 2010), we could not detect any differences. While our selection of traits was done carefully in order to encompass the aspects of vegetation relevant to our questions, we also acknowledge that the leaf traits considered in this study do not capture all dimensions of trait variation. For example, seed and dispersal traits may also be important for community assembly (although not independent of life form, which make them less suitable for this study). Since the studied environmental variables are all related to competition intensity, we consider the choice of leaf traits related to the species’ competitive and growth ability as appropriate. Thus, regarding the lack of a response of functional diversity in the study presented here, we emphasize that although elevation is often criticized of being merely an umbrella term, it also combines the effects of several environmental factors, thus revealing ecological patterns which cannot be detected with individual analyses of single variables (Körner, 2007).
In our study, temperature had the strongest effects on vegetation characteristics along the elevational gradient of Tenerife—stronger than chemical soil properties and disturbance. As decreasing temperature gradients are general patterns in mountains, our findings align with observations from elevational gradients in other regions. In addition, our results are in accordance with studies explaining broad-scale patterns of species richness and functional trait variation, particularly those looking at continental and global geographic patterns (Hawkins et al., 2003; Kreft and Jetz, 2007; Šímová et al., 2011; Bruelheide et al., 2018). While elevational temperature patterns are quite linear, soil patterns are more idiosyncratic, and thus not simply transferrable across regions. At the species level, a global compilation study found soil measured at the same site as the traits to be a more important driver of trait variation than temperature data extracted from smaller resolution sources (Ordoñez et al., 2009; but see Liu et al., 2017). Together with the results from our regional study, this emphasizes the importance of including data from local environmental conditions for climate, disturbance and fine-scale soil conditions for understanding biodiversity patterns.
The dataset presented in this article is available at the Dryad Digital Repository, https://doi.org/10.5061/dryad.66t1g1k37.
AR, LF, and SH conceived the ideas and analyzed the data. AR conducted the fieldwork and collected the vegetation data with help from SH and JA. AR and LF conducted the chemical soil and leaf analysis, respectively. AR and LF led the writing with important contributions from SH. All authors revised drafts of the manuscript, and approved the final version.
AR and SH gratefully acknowledge the support of iDiv funded by the German Research Foundation (DFG—FZT 118, 202548816).
The authors declare that the research was conducted in the absence of any commercial or financial relationships that could be construed as a potential conflict of interest.
All claims expressed in this article are solely those of the authors and do not necessarily represent those of their affiliated organizations, or those of the publisher, the editors and the reviewers. Any product that may be evaluated in this article, or claim that may be made by its manufacturer, is not guaranteed or endorsed by the publisher.
We thank Anna Bittner, Leana Meder, Miguel Antonio Padrón Mederos, Niels Preuk, Paul Kühn, Stefan Trogisch, Susanne Lubosch, and Tim Walther for helping in the field and/or in the laboratory. We are grateful to Benjamin Rosenbaum for advice with the Markov Chain Monte Carlo approach. We further thank two reviewers for their helpful comments.
The Supplementary Material for this article can be found online at: https://www.frontiersin.org/articles/10.3389/fevo.2021.758160/full#supplementary-material
AEMET (2012). Climate atlas of the Archipelagos of the Canary Islands, Madeira and the Azores: Air Temperature and Precipitation, 1971-2000. Madrid: AEMET.
Bacaro, G., Maccherini, S., Chiarucci, A., Jentsch, A., Rocchini, D., Torri, D., et al. (2015). Distributional patterns of endemic, native and alien species along a roadside elevation gradient in Tenerife, Canary Islands. Commun. Ecol. 16, 223–234. doi: 10.1556/168.2015.16.2.10
Barry, R. G. (2008). Mountain Weather and Climate Third Edition, 3rd Edn. Cambridge: Cambridge University Press, doi: 10.1017/CBO9780511754753
Bernhardt-Römermann, M., Gray, A., Vanbergen, A. J., Bergès, L., Bohner, A., Brooker, R. W., et al. (2011). Functional traits and local environment predict vegetation responses to disturbance: a pan-European multi-site experiment. J. Ecol. 99, 777–787. doi: 10.1111/j.1365-2745.2011.01794.x
Botta-Dukát, Z. (2005). Rao’s quadratic entropy as a measure of functional diversity based on multiple traits. J. Veg. Sci. 16, 533–540. doi: 10.1111/j.1654-1103.2005.tb02393.x
Bruelheide, H., Dengler, J., Purschke, O., Lenoir, J., Jiménez-Alfaro, B., Hennekens, S. M., et al. (2018). Global trait–environment relationships of plant communities. Nat. Ecol. Evol. 2, 1906–1917. doi: 10.1038/s41559-018-0699-8
Carreño-Rocabado, G., Peña-Claros, M., Bongers, F., Alarcón, A., Licona, J.-C., and Poorter, L. (2012). Effects of disturbance intensity on species and functional diversity in a tropical forest. J. Ecol. 100, 1453–1463. doi: 10.1111/j.1365-2745.2012.02015.x
Catford, J. A., Daehler, C. C., Murphy, H. T., Sheppard, A. W., Hardesty, B. D., Westcott, D. A., et al. (2012). The intermediate disturbance hypothesis and plant invasions: implications for species richness and management. Perspect. Plant Ecol. Evol. Syst. 14, 231–241. doi: 10.1016/j.ppees.2011.12.002
Debastiani, V. J., and Pillar, V. D. (2012). SYNCSA—R tool for analysis of metacommunities based on functional traits and phylogeny of the community components. Bioinformatics. 28, 2067–2068. doi: 10.1093/bioinformatics/bts325
Deljouei, A., Sadeghi, S. M. M., Abdi, E., Bernhardt-Römermann, M., Pascoe, E. L., and Marcantonio, M. (2018). The impact of road disturbance on vegetation and soil properties in a beech stand, Hyrcanian forest. Eur. J. Forest Res. 137, 759–770. doi: 10.1007/s10342-018-1138-8
Díaz, S., Kattge, J., Cornelissen, J. H. C., Wright, I. J., Lavorel, S., Dray, S., et al. (2016). The global spectrum of plant form and function. Nature 529, 167–171. doi: 10.1038/nature16489
Dinter, T. C., Gerzabek, M. H., Puschenreiter, M., Strobel, B. W., Strahlhofer, M., Couenberg, P. M., et al. (2020). Changes in topsoil characteristics with climate and island age in the agricultural zones of the Galápagos. Geoderma 376:114534. doi: 10.1016/j.geoderma.2020.114534
Dixon, J. L., Chadwick, O. A., and Vitousek, P. M. (2016). Climate-driven thresholds for chemical weathering in postglacial soils of New Zealand. J. Geophys. Res. Earth Surf. 121, 1619–1634. doi: 10.1002/2016JF003864
Fernández-Palacios, J. M. (1992). Climatic responses of plant species on Tenerife, The Canary Islands. J. Veg. Sci. 3, 595–603. doi: 10.2307/3235826
Foley, W. J., McIlwee, A., Lawler, I., Aragones, L., Woolnough, A. P., and Berding, N. (1998). Ecological applications of near infrared reflectance spectroscopy - a tool for rapid, cost-effective prediction of the composition of plant and animal tissues and aspects of animal performance. Oecologia 116, 293–305. doi: 10.1007/s004420050591
Forman, R. T. T., and Alexander, L. E. (1998). Roads and their major ecological effects. Annu. Rev. Ecol. Syst. 29, 207–231. doi: 10.1146/annurev.ecolsys.29.1.207
Gong, H., Li, Y., Yu, T., Zhang, S., Gao, J., Zhang, S., et al. (2020). Soil and climate effects on leaf nitrogen and phosphorus stoichiometry along elevational gradients. Global Ecol. Conserv. 23:e01138. doi: 10.1016/j.gecco.2020.e01138
Grieve, I. C., Proctor, J., and Cousins, S. A. (1990). Soil variation with altitude on Volcan Barva, Costa Rica. Catena 17, 525–534. doi: 10.1016/0341-8162(90)90027-B
Hadfield, J. D. (2010). MCMC methods for multi-response generalized linear mixed models: the MCMCglmm R package. J. Stat. Soft. 33, 1-22. doi: 10.18637/jss.v033.i02
Haider, S., Kueffer, C., Bruelheide, H., Seipel, T., Alexander, J. M., Rew, L. J., et al. (2018). Mountain roads and non-native species modify elevational patterns of plant diversity. Global Ecol. Biogeogr. 27, 667–678. doi: 10.1111/geb.12727
Haider, S., Lembrechts, J., McDougall, K., Pauchard, A., Alexander, J. M., Barros, A., et al. (2021). Think globally, measure locally: the MIREN standardized protocol for monitoring species distributions along elevation gradients. Preprints doi: 10.22541/au.162219027.79625324/v1
Hawkins, B. A., Field, R., Cornell, H. V., Currie, D. J., Guégan, J.-F., Kaufman, D. M., et al. (2003). Energy, water, and broad-scale geographic patterns of species richness. Ecology 84, 3105–3117. doi: 10.1890/03-8006
Hijmans, R. J., Cameron, S. E., Parra, J. L., Jones, P. G., and Jarvis, A. (2005). Very high resolution interpolated climate surfaces for global land areas. Int. J. Climatol. 25, 1965–1978. doi: 10.1002/joc.1276
Irl, S. D. H., Harter, D. E. V., Steinbauer, M. J., Gallego Puyol, D., Fernández-Palacios, J. M., Jentsch, A., et al. (2015). Climate vs. topography – spatial patterns of plant species diversity and endemism on a high-elevation island. J. Ecol. 103, 1621–1633. doi: 10.1111/1365-2745.12463
Jiang, Z., Ma, K., Liu, H., and Tang, Z. (2018). A trait-based approach reveals the importance of biotic filter for elevational herb richness pattern. J. Biogeogr. 45, 2288–2298. doi: 10.1111/jbi.13398
Johnston, F. M., and Johnston, S. W. (2004). Impacts of road disturbance on soil properties and on exotic plant occurrence in subalpine areas of the Australian Alps. Arct. Antarct. Alp. Res. 36, 201–207.
Kassambara, A., and Mundt, F. (2020). Factoextra: Extract and Visualize the Results of Multivariate Data Analyses. Available online at: https://CRAN.R-project.org/package=factoextra (accessed April 1, 2020).
Keddy, P. A. (1992). Assembly and response rules: two goals for predictive community ecology. J. Veg. Sci. 3, 157–164. doi: 10.2307/3235676
Kleyer, M., Bekker, R. M., Knevel, I. C., Bakker, J. P., Thompson, K., Sonnenschein, M., et al. (2008). The LEDA Traitbase: a database of life-history traits of the Northwest European flora. J. Ecol. 96, 1266–1274. doi: 10.1111/j.1365-2745.2008.01430.x
Köhler, L., Gieger, T., and Leuschner, C. (2006). Altitudinal change in soil and foliar nutrient concentrations and in microclimate across the tree line on the subtropical island mountain Mt. Teide (Canary Islands). Flora Morphol. Distrib. Funct. Ecol. Plants 201, 202–214. doi: 10.1016/j.flora.2005.07.003
Körner, C. (2007). The use of ‘altitude’ in ecological research. Trends Ecol. Evol. 22, 569–574. doi: 10.1016/j.tree.2007.09.006
Kreft, H., and Jetz, W. (2007). Global patterns and determinants of vascular plant diversity. Proc. Natl. Acad. Sci. U.S.A. 104, 5925–5930. doi: 10.1073/pnas.0608361104
Kühn, P., Backes, A. R., Römermann, C., Bruelheide, H., and Haider, S. (2021). Contrasting patterns of intra-specific trait variability in native and non-native plant species along an elevational gradient on Tenerife, Canary Islands. Ann. Bot. 127, 565–576. doi: 10.1093/aob/mcaa067
Kuznetsova, A., Brockhoff, P. B., and Christensen, R. H. B. (2017). lmerTest package: tests in linear mixed effects models. J. Stat. Soft. 82, 1–26. doi: 10.18637/jss.v082.i13
Laliberté, E., and Legendre, P. (2010). A distance-based framework for measuring functional diversity from multiple traits. Ecology 91, 299–305. doi: 10.1890/08-2244.1
Laughlin, D. C., Abella, S. R., Covington, W. W., and Grace, J. B. (2007). Species richness and soil properties in Pinus ponderosa forests: a structural equation modeling analysis. J. Veg. Sci. 18, 231–242. doi: 10.1111/j.1654-1103.2007.tb02534.x
Lê, S., Josse, J., and Husson, F. (2008). FactoMineR: an R package for multivariate analysis. J. Stat. Soft. 25, 1–18. doi: 10.18637/jss.v025.i01
Lembrechts, J. J., Lenoir, J., Roth, N., Hattab, T., Milbau, A., Haider, S., et al. (2019). Comparing temperature data sources for use in species distribution models: from in-situ logging to remote sensing. Global Ecol. Biogeogr. 28, 1578–1596. doi: 10.1111/geb.12974
Liu, L., Xu, Y., Tang, Y., Du, W., Shao, C., Wu, J., et al. (2020). The importance of including soil properties when disentangling the drivers of species richness: the case of the alpine genus Saxifraga L. in China. Front. Ecol. Evol. 8:244. doi: 10.3389/fevo.2020.00244
Liu, M., Wang, Z., Li, S., Lü, X., Wang, X., and Han, X. (2017). Changes in specific leaf area of dominant plants in temperate grasslands along a 2500-km transect in northern China. Sci. Rep. 7:10780. doi: 10.1038/s41598-017-11133-z
López-Angulo, J., Pescador, D. S., Sánchez, A. M., Luzuriaga, A. L., Cavieres, L. A., and Escudero, A. (2020). Impacts of climate, soil and biotic interactions on the interplay of the different facets of alpine plant diversity. Sci. Total Environ. 698:133960. doi: 10.1016/j.scitotenv.2019.133960
Macarthur, R., and Levins, R. (1967). The limiting similarity, convergence, and divergence of coexisting species. Am. Natural. 101, 377–385.
Maclean, I. M. D., and Gardner, A. (2021). Climvars: Functions for Calculating Biologically Meaningful Climate Variables. R Package Version 0.1.0. Available online at: https://github.com/ilyamaclean/climvars (accessed March 3, 2021).
Makineci, E., Demir, M., Comez, A., and Yilmaz, E. (2007). Chemical characteristics of the surface soil, herbaceous cover and organic layer of a compacted skid road in a fir (Abies bornmulleriana Mattf.) forest. Trans. Res. Part D Trans. Environ. 12, 453–459. doi: 10.1016/j.trd.2007.06.001
Mayfield, M. M., Bonser, S. P., Morgan, J. W., Aubin, I., McNamara, S., and Vesk, P. A. (2010). What does species richness tell us about functional trait diversity? Predictions and evidence for responses of species and functional trait diversity to land-use change. Global Ecol. Biogeogr. 19, 423–431. doi: 10.1111/j.1466-8238.2010.00532.x
McCain, C. M., and Grytnes, J.-A. (2010). “Elevational gradients in species richness,” in Encyclopedia of Life Sciences, (Chichester: John Wiley & Sons, Ltd), doi: 10.1002/9780470015902.a0022548
McIntyre, S., Lavorel, S., Landsberg, J., and Forbes, T. D. A. (1999). Disturbance response in vegetation - towards a global perspective on functional traits. J. Veg. Sci. 10, 621–630. doi: 10.2307/3237077
Midolo, G., Kuss, P., and Wellstein, C. (2021). Land use and water availability drive community-level plant functional diversity of grasslands along a temperature gradient in the Swiss Alps. Sci. Total Environ. 764:142888. doi: 10.1016/j.scitotenv.2020.142888
Milbau, A., Shevtsova, A., Osler, N., Mooshammer, M., and Graae, B. J. (2013). Plant community type and small-scale disturbances, but not altitude, influence the invasibility in subarctic ecosystems. New Phytol. 197, 1002–1011. doi: 10.1111/nph.12054
Moles, A. T., Perkins, S. E., Laffan, S. W., Flores-Moreno, H., Awasthy, M., Tindall, M. L., et al. (2014). Which is a better predictor of plant traits: temperature or precipitation? J. Veg. Sci. 25, 1167–1180. doi: 10.1111/jvs.12190
Molina-Venegas, R., Aparicio, A., Lavergne, S., and Arroyo, J. (2018). Soil conditions drive changes in a key leaf functional trait through environmental filtering and facilitative interactions. Acta Oecol. 86, 1–8. doi: 10.1016/j.actao.2017.11.008
Morales Matos, G., and Pérez González, R. (2000). Gran Atlas Temático de Canarias. Santa Cruz de Tenerife (Canary Islands): Editorial Insterinsular Canaria.
Mouillot, D., Dumay, O., and Tomasini, J. A. (2007). Limiting similarity, niche filtering and functional diversity in coastal lagoon fish communities. Estuar. Coast. Shelf Sci. 71, 443–456. doi: 10.1016/j.ecss.2006.08.022
Müllerová, J., Vítková, M., and Vítek, O. (2011). The impacts of road and walking trails upon adjacent vegetation: effects of road building materials on species composition in a nutrient poor environment. Sci. Total Environ. 409, 3839–3849. doi: 10.1016/j.scitotenv.2011.06.056
Ordoñez, J. C., van Bodegom, P. M., Witte, J.-P. M., Wright, I. J., Reich, P. B., and Aerts, R. (2009). A global study of relationships between leaf traits, climate and soil measures of nutrient fertility. Global Ecol. Biogeogr. 18, 137–149. doi: 10.1111/j.1466-8238.2008.00441.x
Pakeman, R. J., and Quested, H. M. (2007). Sampling plant functional traits: what proportion of the species need to be measured? Appl. Veg. Sci. 10, 91–96. doi: 10.1111/j.1654-109X.2007.tb00507.x
Pérez-Harguindeguy, N., Díaz, S., Garnier, E., Lavorel, S., Poorter, H., Jaureguiberry, P., et al. (2013). New handbook for standardised measurement of plant functional traits worldwide. Austr. J. Bot. 61:167. doi: 10.1071/BT12225
Peters, M. K., Hemp, A., Appelhans, T., Becker, J. N., Behler, C., Classen, A., et al. (2019). Climate–land-use interactions shape tropical mountain biodiversity and ecosystem functions. Nature 568, 88–92. doi: 10.1038/s41586-019-1048-z
R Core Team (2020). R: A Language and Environment for Statistical Computing. Vienna: R Foundation for Statistical Computing.
Rao, C. R. (1982). Diversity and dissimilarity coefficients: a unified approach. Theor. Popul. Biol. 21, 24–43. doi: 10.1016/0040-5809(82)90004-1
Read, Q. D., Moorhead, L. C., Swenson, N. G., Bailey, J. K., and Sanders, N. J. (2014). Convergent effects of elevation on functional leaf traits within and among species. Funct. Ecol. 28, 37–45. doi: 10.1111/1365-2435.12162
Rosbakh, S., Römermann, C., and Poschlod, P. (2015). Specific leaf area correlates with temperature: new evidence of trait variation at the population, species and community levels. Alp. Bot. 125, 79–86. doi: 10.1007/s00035-015-0150-6
Schellenberger Costa, D., Gerschlauer, F., Pabst, H., Kühnel, A., Huwe, B., Kiese, R., et al. (2017). Community-weighted means and functional dispersion of plant functional traits along environmental gradients on Mount Kilimanjaro. J. Veg. Sci. 28, 684–695. doi: 10.1111/jvs.12542
Šímová, I., Storch, D., Keil, P., Boyle, B., Phillips, O. L., and Enquist, B. J. (2011). Global species-energy relationship in forest plots: role of abundance, temperature and species climatic tolerances: global species-energy in forest plots. Global Ecol. Biogeogr. 20, 842–856. doi: 10.1111/j.1466-8238.2011.00650.x
Stirzaker, R. J., Passioura, J. B., and Wilms, Y. (1996). Soil structure and plant growth: impact of bulk density and biopores. Plant Soil 185, 151–162.
Tan, Q., and Wang, G. (2016). Decoupling of nutrient element cycles in soil and plants across an altitude gradient. Sci. Rep. 6:34875. doi: 10.1038/srep34875
Torrent, J. (2005). “Mediterranean soils,” in Encyclopedia of Soils in the Environment, ed. D. Hillel (Amsterdam: Elsevier), 418–427. doi: 10.1016/B0-12-348530-4/00023-0
Unger, M., Homeier, J., and Leuschner, C. (2012). Effects of soil chemistry on tropical forest biomass and productivity at different elevations in the equatorial Andes. Oecologia 170, 263–274. doi: 10.1007/s00442-012-2295-y
Violle, C., Navas, M.-L., Vile, D., Kazakou, E., Fortunel, C., Hummel, I., et al. (2007). Let the concept of trait be functional! Oikos 116, 882–892. doi: 10.1111/j.2007.0030-1299.15559.x
Vitousek, P. M., and Chadwick, O. A. (2013). Pedogenic thresholds and soil process domains in basalt-derived soils. Ecosystems. 16, 1379–1395. doi: 10.1007/s10021-013-9690-z
von Humboldt, A. (1849). Aspects of Nature, in Different Lands and Different Climates. London: J. Murray, doi: 10.5962/bhl.title.45601
von Humboldt, A., and Bonpland, A. (1831). Atlas Géographique et Physique du Nouveau Continent, 6th Edn. Paris: Smith.
Weil, N. C., and Brady, R. R. (2016). The Nature and Properties of Soils, 15th Edn. Columbus: Pearson.
Whittaker, R. H., and Niering, W. A. (1965). Vegetation of the Santa Catalina Mountains, Arizona: a Gradient Analysis of the South Slope. Ecology 46, 429–452. doi: 10.2307/1934875
Wright, I. J., Dong, N., Maire, V., Prentice, I. C., Westoby, M., Díaz, S., et al. (2017). Global climatic drivers of leaf size. Science 357, 917–921. doi: 10.1126/science.aal4760
Wright, I. J., Reich, P. B., Westoby, M., Ackerly, D. D., Baruch, Z., Bongers, F., et al. (2004). The worldwide leaf economics spectrum. Nature 428, 821–827. doi: 10.1038/nature02403
Xu, Z., Chang, Y., Li, L., Luo, Q., Xu, Z., Li, X., et al. (2019). Climatic and topographic variables control soil nitrogen, phosphorus, and nitrogen: phosphorus ratios in a Picea schrenkiana forest of the Tianshan Mountains. PLoS one 14:e0211839. doi: 10.1371/journal.pone.0211839
Yadav, S. K. (2010). Cold stress tolerance mechanisms in plants. A review. Agron. Sustain. Dev. 30, 515–527. doi: 10.1051/agro/2009050
Yang, Y., Zhang, L., Li, H., He, H., Wei, Y., Luo, J., et al. (2018). Soil physicochemical properties and vegetation structure along an elevation gradient and implications for the response of alpine plant development to climate change on the northern slopes of the Qilian Mountains. J. Mt. Sci. 15, 1006–1019. doi: 10.1007/s11629-017-4637-z
Keywords: species richness, mountains, climate gradient, altitudinal gradient, chemical soil properties, road disturbance, environmental filtering, plant functional traits
Citation: Ratier Backes A, Frey L, Arévalo JR and Haider S (2021) Effects of Soil Properties, Temperature and Disturbance on Diversity and Functional Composition of Plant Communities Along a Steep Elevational Gradient on Tenerife. Front. Ecol. Evol. 9:758160. doi: 10.3389/fevo.2021.758160
Received: 13 August 2021; Accepted: 26 October 2021;
Published: 18 November 2021.
Edited by:
David Horák, Charles University, CzechiaReviewed by:
David Sánchez-Fernández, University of Murcia, SpainCopyright © 2021 Ratier Backes, Frey, Arévalo and Haider. This is an open-access article distributed under the terms of the Creative Commons Attribution License (CC BY). The use, distribution or reproduction in other forums is permitted, provided the original author(s) and the copyright owner(s) are credited and that the original publication in this journal is cited, in accordance with accepted academic practice. No use, distribution or reproduction is permitted which does not comply with these terms.
*Correspondence: Sylvia Haider, c3lsdmlhLmhhaWRlckBib3RhbmlrLnVuaS1oYWxsZS5kZQ==
†These authors have contributed equally to this work and share first authorship
Disclaimer: All claims expressed in this article are solely those of the authors and do not necessarily represent those of their affiliated organizations, or those of the publisher, the editors and the reviewers. Any product that may be evaluated in this article or claim that may be made by its manufacturer is not guaranteed or endorsed by the publisher.
Research integrity at Frontiers
Learn more about the work of our research integrity team to safeguard the quality of each article we publish.