- 1The Institute of Forestry, The Chinese Academy of Forestry, Beijing, China
- 2Department of Biology, Taiyuan Normal University, Taiyuan, China
- 3School of Life Science, Qufu Normal University, Qufu, China
Akebia quinata, also known as chocolate vine, is a creeping woody vine which is used as Chinese herbal medicine, and found widely distributed in East Asia. At present, its wild resources are being constantly destroyed. This study aims to provide a theoretical basis for the resource protection of this plant species by analyzing the possible changes in its geographic distribution pattern and its response to climate factors. It is the first time maximum entropy modeling (MaxEnt) and ArcGIS software have been used to predict the distribution of A. quinata in the past, the present, and the future (four greenhouse gas emission scenarios, namely, SSP1-2.6, SSP2-4.5, SSP3-7.0, and SSP5-8.5). Through the prediction results, the impact of climate change on the distribution of A. quinata and the response of A. quinata to climate factors were analyzed. The results showed that the most significant climatic factor affecting the distribution pattern of A. quinata was the annual precipitation. At present, the suitable distribution regions of A. quinata are mainly in the temperate zone, and a few suitable distribution regions are in the tropical zone. The medium and high suitable regions are mainly located in East Asia, accounting for 51.1 and 81.7% of the worldwide medium and high suitable regions, respectively. The migration of the geometric center of the distribution regions of A. quinata in East Asia is mainly affected by the change of distribution regions in China, and the average migration rate of the geometric center in each climate scenario is positively correlated with the level of greenhouse gas emission scenario.
Introduction
Akebia quinata, also known as chocolate vine, is a creeping woody vine widely distributed in East Asia (Wang et al., 2021). As a valuable Chinese herbal medicine, its fruit and stem have analgesic, diuretic, and anti-inflammatory effects (Park et al., 2018; Song et al., 2018). Over the years, the wild resources of this species have been destroyed due to increased cutting, and this species is facing more and more severe survival challenges. The protection of A. quinata is very urgent, and some reasonable and efficient protection schemes need to be implemented. This requires us to understand the suitable growth conditions of A. quinata and understand its geographical distribution and the impact of climate change upon it. At present, this species has only been reported in the fields of pharmacological activity (Sung et al., 2015; Lee et al., 2017), chemical composition (Jiang et al., 2006; Mimaki et al., 2007), and genome research (Li et al., 2016), but there are still gaps in knowledge around its geographical distribution and climate response.
The geographic distribution data of species are the basic information for studying their life process. In recent years, due to human activities and climate change, the habitat of many species has been destroyed and changed, and the survival of species has been threatened, or some even driven to extinction. Accurate simulation and prediction of species' distribution area is the key to their conservation. To achieve this goal, many factors need to be considered, especially climatic factors. On the one hand, climatic factors play a decisive role in the life process of species, and the accelerated prosperity or extinction of species can even depend on it (Lenoir et al., 2008; Acevedo et al., 2020). On the other hand, climate change also has a profound impact on the distribution pattern of species (Moraitis et al., 2019; Wang et al., 2019; Wilson et al., 2019) and will lead to a series of changes in the survival rate, dominance, community structure, and replacement rate of species (Yi et al., 2018). Therefore, it is more important to make clear the distribution of species and predict the change of their distribution in the future. Accurate distribution data can not only be used to predict the various possibilities of species distribution change but are also critical to assess the potential impact of changing ecosystems.
Climate is one of the main determinants delimiting the geographical distribution of plant species on large scale (Ferrarini et al., 2019). There is a considerable amount of research declaring that climate change leads to expansion or retraction in plant species' ranges (Thuiller et al., 2005; Ferrarini et al., 2018). To assess the vulnerability of plant species under a rapidly changing climate, we can use species distribution modeling (SDM) to predict species climate niches and project their potential future range shifts (Huntley et al., 1995; Pearson and Dawson, 2003; Thuiller et al., 2005; Alavi et al., 2019).
Maximum entropy modeling (MaxEnt) is a very powerful presence/pseudo-absence algorithm. Many authors have suggested that it is one of the most efficient approaches for predicting the potential distributions of species (Elith et al., 2006, 2011; Phillips et al., 2006a). The model can simulate and predict the potential geographical distribution of species by using the current distribution data and various environmental parameters (Phillips et al., 2006a; Phillips and Dudík, 2008). It has the advantages of small sample size, fast running speed, and stable operation (Phillips et al., 2006a; Estes et al., 2013; Li J. et al., 2020). Even in the case of insufficient species distribution information, it also has good accuracy and can test the accuracy of prediction results (Saatchi et al., 2008; Yi et al., 2017). Therefore, it is widely used in many aspects of species distribution analysis (Yang et al., 2013; Qin et al., 2017; Zhang et al., 2019).
In this study, the MaxEnt model was used to simulate and predict the distribution of A. quinata in different climatic scenarios. The purpose of this study was (1) to find the key climatic factors that restrict the distribution of A. quinata; (2) to predict the distribution pattern of A. quinata under different climate scenarios; (3) to evaluate the impact of climate change on the distribution pattern of A. quinata; and (4) to predict the concentrated distribution region of A. quinata, analyze the migration of its concentrated distribution region, and explore the migration reasons of its concentrated distribution region.
Materials and Methods
Location Data Sources of A. quinata
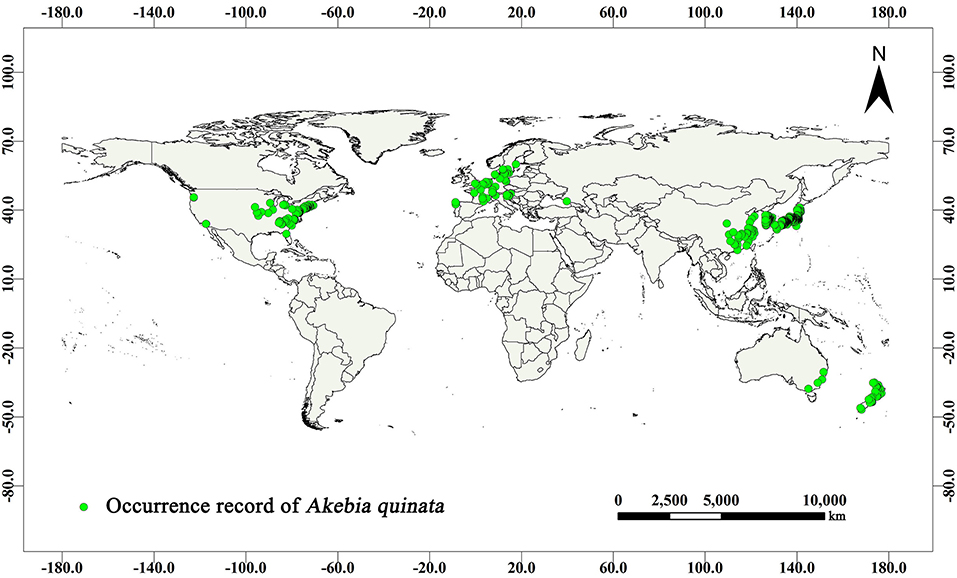
The geographic data on A. quinata distribution were collected from two sources. Data were collected within China using a GPS device (GARMIN GPSMAP 63SC, Kansas City, KS, USA) from the field survey in 2017–2019, covering Northwest China, Central China, South China, and East China. Data from other parts of the world were collected from the website of the Global Biodiversity Information Facility (GBIF, https://www.gbif.org). Based on the above 1,024 effective records (Figure 1), the prediction model was established. The actual distribution of A. quinata was analyzed using ArcGIS (version 10.2, ESRI, Redlands, CA, USA) software. The geographic distribution map of richness ×1 was drawn using a geographic information system (GIS).
We used two methods to filter the data downloaded using GIBF. First, we deleted the data with missing longitude and latitude information and fuzzy geographic location information and, second, we deleted the data that did not conform to the geographic coordinate system (World Geodetic System 1984) used in this study.
Climate Data Sources
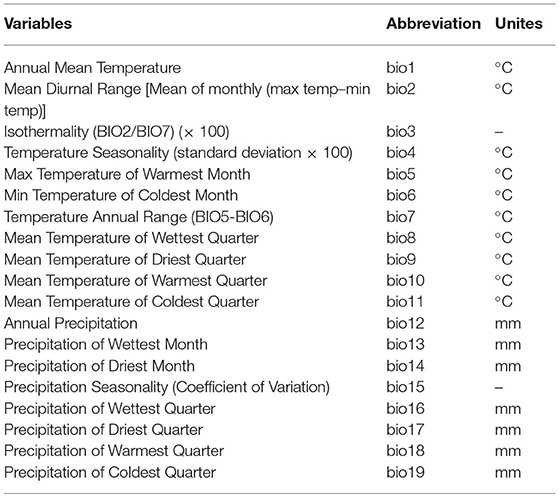
It is reported that 19 bioclimatic variables (Table 1) are the most typical and important variables to form the potential species distribution model (Molloy et al., 2013; Li J. et al., 2020). In this study, the current (1970–2000), past, and future climate scenarios were downloaded from WorldClim Version 2.1 (this version was released in January 2020) (www.worldclim.org) (Fick and Hijmans, 2017). These data include 19 climate variables. All variables were cast to USA Contiguous Albers Equal Area Conic (NAD 1983) and resampled using nearest-neighbor to a 30 arc-second resolution using ArcGIS. Using ArcGIS conversion tools, the environment variables were converted to ASCII format.
This study used the scenarios of the Last Interglacial, the Last Glacial Maximum, and the Mid-Holocene to predict the species distribution in the past. These three scenarios were provided by the Fourth Phase of Community Climate System Model (CCSM4) in the Fifth Phase of Coupled Model Intercomparison Project (CMIP5).
When simulating future species distribution, this study used the scenarios from shared socioeconomic pathway (SSP)-representative concentration pathway (RCP) (SSP1-1.9, SSP1-2.6, SSP4-3.4, SSP2-4.5, SSP4-6.0, SSP3-7.0, and SSP5-8.5) in the Sixth Phase of Coupled Model Intercomparison Project (CMIP6). These scenarios are a combination of SSPs and RCPs. Each scenario included a set of emissions and concentrations of chemically active gases, aerosols, and greenhouse gases. Among them, SSPs scenarios were the five basic scenarios (SSP1–SSP5) defined at the 2012 IPCC AR5 (Assessment Report 5 of the Intergovernmental Panel on Climate Change) special meeting, which are sustainable development path SSP1, intermediate path SSP2, regional competition path SSP3, unbalanced path SSP4, and traditional fossil fuel dominated path SSP5. RCPs scenario is from CMIP5, including a low emission scenario (RCP2.6), two medium emission scenarios (RCP4.5 and RCP6.0), and a high emission scenario (RCP8.5). CMIP6 inherits four RCPs scenarios in CMIP5 (RCP2.6, RCP4.5, RCP6.0, and RCP8.5) and adds three discharge paths (RCP1.9, RCP3.4, and RCP7.0). According to the CO2 emission of different scenarios (www.carbonbrief.org), we selected four emission scenarios with obvious classification for the simulation and prediction of this study, which are low emission scenario (SSP1-2.6), medium emission scenario (SSP2-4.5), medium-high emission scenario (SSP3-7.0), and high emission scenario (SSP5-8.5). The time span is 2021–2081.
Methods
Prediction Using the MaxEnt Model
The occurrence data of A. quinata and climate data were input into the MaxEnt (MaxEnt 3.4.1) model (Phillips et al., 2006b). We randomly selected 25% of the point data as the test set and 75% of the point data as the training set. The model was run 10 times to evaluate the average results. The area under curve (AUC) of the receiver operating characteristic (ROC) curve was selected to evaluate the performance of the model. The ROC curve analysis is a method to verify the performance of the MaxEnt model. Its principle is to judge the prediction accuracy of the model by calculating the area enclosed by the curve and abscissa, that is, the AUC value. Generally, the model has five accuracy levels. When the AUC value is between 0.50 and 0.60, the prediction fails. The prediction accuracy between 0.60 and 0.70 is poor, the prediction effect between 0.70 and 0.80 is average, the prediction effect between 0.80 and 0.90 is good, and the prediction accuracy between 0.90 and 1.00 is excellent (Li Y. et al., 2020). The response curve of climate variables generated by the model reflects the relationship between the value of climate variables and the existence probability of A. quinata. A jackknife test and statistical table of contribution rate of climate variables were used to screen the climate variables with high importance.
Too many climate variables will reduce the computational efficiency of the MaxEnt model in predicting the distribution of species on a large regional scale, and the climate variables with obvious collinearity will affect the prediction accuracy (Li Y. et al., 2020; Sillero and Barbosa, 2020). Therefore, after running the MaxEnt model with 19 climate variables, this study screened climate variables and compiled the model again for prediction. The screening process was as follows:
(1) The Pearson correlation coefficient in SPSS (Statistical Product and Service Solutions, version 26.0, Armonk, NY, USA) software was used to calculate the correlation between climate variables.
(2) We removed all variables (variables whose percent contribution is <1%) whose percent contribution in the model prediction is lower than the contribution threshold setting. Next, among the variables with high correlation (the absolute value of the correlation coefficient is greater than or equal to 0.8), the variable with the highest contribution rate was retained, and other variables were removed.
Suitability Division of the Distribution Regions
By using the To Raster tool in ArcGIS, the American Standard Code for Information Interchange (ASCII) file exported using the MaxEnt model converted the raster into a grid layer, and the suitable distribution regions of species were obtained. In the predicted suitable distribution regions, the existence probability of species was between 0 and 1. According to the actual distribution and field survey results, using the Reclassify tool of ArcGIS and artificial classification method, the prediction results were divided into four grades: high suitability (>0.66), medium suitability (0.33–0.66), low suitability (0.15–0.33), and no suitability (<0.15).
This study used the world climate data to run the MaxEnt model. The map data and results of specific regions in this study were extracted from the global prediction results.
Geometric Center Analysis of the Distribution Regions
Raster Calculator tool in ArcGIS was used to separate the grid layer of species distribution, and the suitable distribution regions were separated. Next, the Raster Domain tool was used to convert the grid layer of the suitable distribution regions into a face, and then the Mean Center tool was used to find out the geometric center of the suitable distribution regions.
Results
Model Accuracy Evaluation
In this study, the average AUC of the MaxEnt model is 0.956 (Figure 2A), which indicates that the prediction accuracy is excellent, and the results can be used.
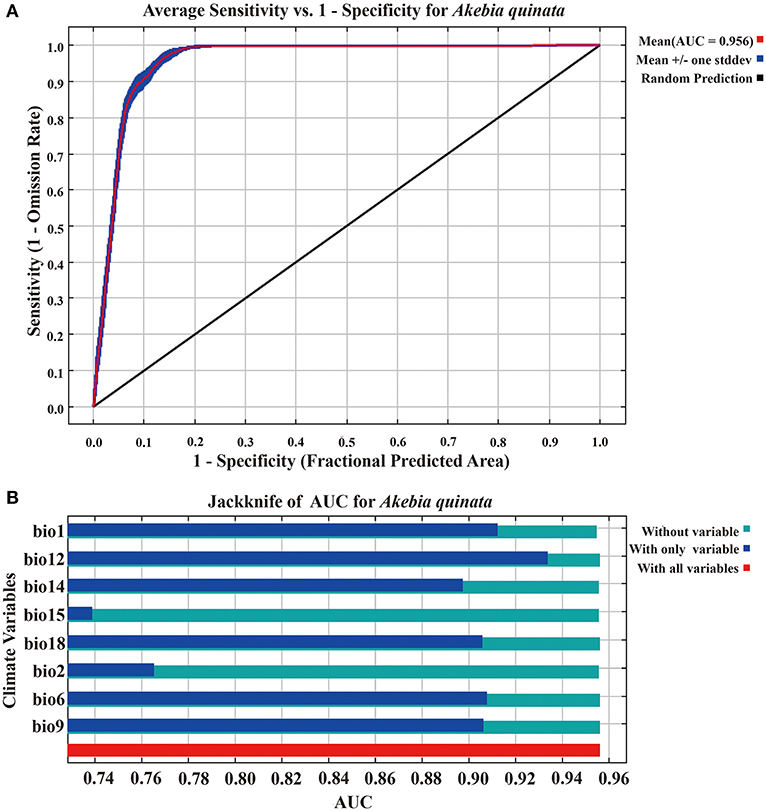
Figure 2. The ROC curve analysis and Jackknife test of the MaxEnt model. (A) The ROC curve of the MaxEnt model (10 runs). (B) The Jackknife test of the MaxEnt model.
Important Climate Variables
Supplementary Table S1 shows the contribution rates of climate variables in the MaxEnt model. Supplementary Table S2 shows the correlation test between 19 climate variables. According to the screening principle, eight climate variables (bio1, bio2, bio6, bio9, bio12, bio14, bio15, and bio18) are retained for recompiling the MaxEnt model operation. Figure 2B shows the Jackknife test (using AUC on test data). When using a single variable, the climate variable with the highest gain is bio12 (annual precipitation), and its gain value is >0.93. In addition, bio1 (annual mean temperature) and bio6 (minimum temperature of the coldest month) are the two most gain variables after bio12. They are three important climatic variables that restrict the geographic distribution of A. quinata. Figures 3A–C shows the response curves between the above three climate variables and the probability of the existence of A. quinata.
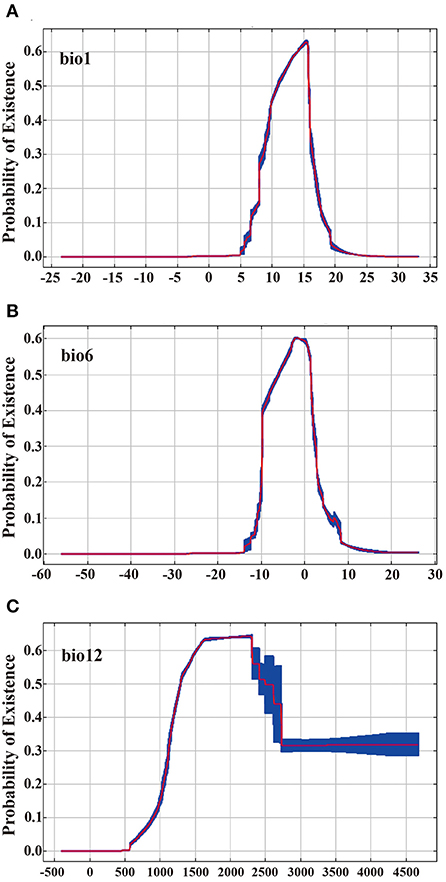
Figure 3. Response curves between the probability of presence and climate variables (10 runs). (A) response curves between the probability of presence and bio1. (B) response curves between the probability of presence and bio6. (C) response curves between the probability of presence and bio12. Red: mean. Blue: mean ± 1 standard deviation.
The probability of the existence of A. quinata is close to 0 when the annual precipitation (the most significant variable, bio12) is <570 mm, then increases rapidly and reaches the maximum when bio12 is 2,300 mm. The probability of existence decreases when bio12 continues to increase, but when bio12 is more than 2,700 mm, the probability of existence does not continue to decrease and remains in the low suitability range (0.15–0.33). There is no clear upper limit but there exists a clear lower limit of annual precipitation for the suitable distribution regions of A. quinata. According to the division of suitability, to meet the minimum existence probability (>0.15) of A. quinata, at least bio12 should be >1,000 mm. To achieve medium suitable survival conditions for A. quinata (probability of existence >0.33), bio12 should be in the range of 1,160–2,700 mm. The performance of the temperature factor in the suitable distribution regions of A. quinata is different from precipitation, and the temperature factor has clear upper and lower limits. When the temperature of bio1 (annual mean temperature) is <5.0°C, the probability of existence is close to 0. Due to the continuous increase of bio1, the probability of existence increases rapidly. When the temperature of bio1 increases to 15.5°C, the probability of existence reaches the maximum and is close to 0.63, then decreases rapidly and finally decreases to 0. The response curve of bio6 (minimum temperature of coldest month) is similar to bio1, except that the temperature threshold of existence probability is different. The two thresholds of existence probability approaching 0 are −14.0 and 19.0°C, respectively, and −3.0 and 0.0°C is the temperature range with the highest probability of existence (probability of existence is close to 0.60).
Potential Distribution Regions of A. quinata
According to the prediction results of the MaxEnt model, the prediction of the current and the future distribution is relatively clear, but the distribution of A. quinata is not found in the past three periods (Supplementary Figure S1).
Current Potential Distribution
According to the current prediction results (Figure 4A), most of the suitable distribution regions of A. quinata were mainly in the temperate zone, and a small number of suitable distribution regions were in the tropical zone. The total suitable area was 592.87 × 10⁴ km2, the low suitable area was 447.35 × 10⁴ km2, the medium suitable area was 143.99 × 10⁴ km2, and the highly suitable area was 1.53 × 10⁴ km2. In East Asia, the occurrence data of A. quinata were the most intensive. The suitable distribution regions were also mainly located in East Asia (Figure 4B), and the areas of medium and high suitability were 73.55 × 10⁴ and 1.25 × 10⁴ km2, respectively, accounting for 51.1 and 81.7% of the global medium and high suitable area, respectively. East Asia is the region with the most concentrated distribution of A. quinata, and so is a region worthy of attention in this study.
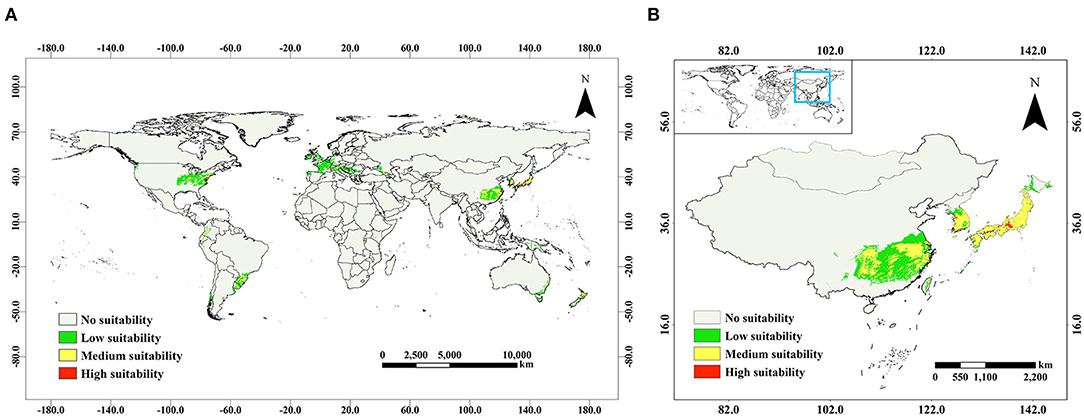
Figure 4. Prediction of suitable distribution regions of A. quinata in the current climate scenario. (A) Distribution of A. quinata in the world. (B) Distribution of A. quinata in East Asia.
Potential Distribution in the Future
Supplementary Table S3 shows the suitable area of A. quinata in the world under different climate scenarios. Figure 5A shows the suitable area change of A. quinata in the form of a broken line diagram. Worldwide, regardless of the transition from the current scenario to any scenario in 2021, the suitable area of A. quinata shows an increasing trend. In the SSP1-2.6 scenario, the suitable area shows a downward trend after 2021 and an upward trend from 2041. In the SSP2-4.5 scenario, the suitable area shows an upward trend before 2041 and begins to decline after 2041. In the SSP3-7.0 and SSP5-8.5 scenarios, the suitable area increased significantly from 2041 to 2061 and then remained stable. In the first two scenarios, the suitable area remains relatively stable, while in the latter two scenarios, the suitable area shows a significantly increasing trend, especially in the SSP5-8.5 scenario. Supplementary Figures S2–S5 shows the prediction picture of the suitable distribution regions of A. quinata in the world. A remarkable phenomenon is that from 2061 to 2081, with the upgrading of the greenhouse gas scenario, the suitable area for A. quinata in Europe will expand significantly, and there is a trend to expand to the northeast. With the upgrading of climate scenario, the suitable area of A. quinata in North America increases and tends to expand to the north, while the suitable area in South America shows a downward trend. In the rest of the regions except East Asia, the change in the suitable area of A. quinata is not obvious.
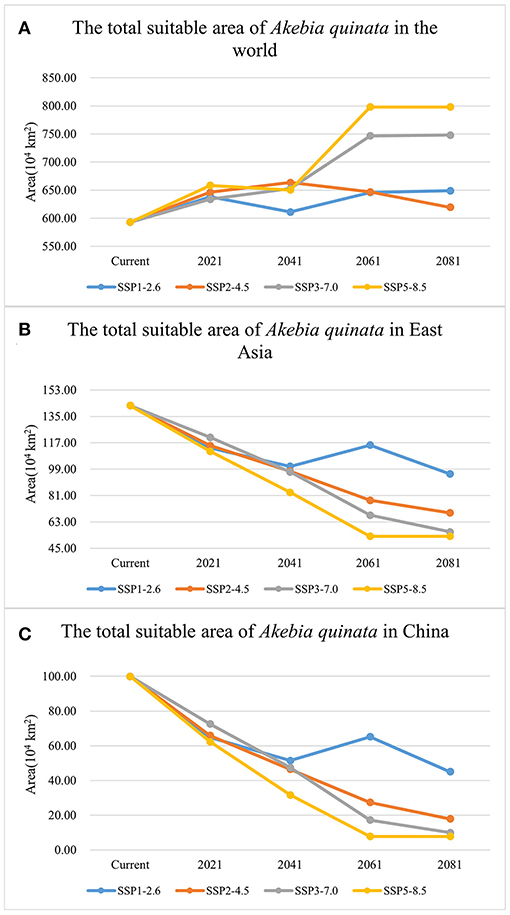
Figure 5. Broken line chart of the total suitable area of A. quinata under four greenhouse climate scenarios. (A) The total suitable area of A. quinata in the world. (B) The total suitable area of A. quinata in East Asia. (C) The total suitable area of A. quinata in China.
In East Asia, the suitable area of A. quinata shows a continuous decreasing trend under the SSP2-4.5, SSP3-7.0, and SSP5-8.5 scenarios, especially in SSP5-8.5 (Figure 5B). In the SSP1-2.6 scenario, the suitable area shows a downward trend before 2041, an upward trend in 2041 and 2061, and then continues to decline. A. quinata is mainly distributed in China, Korea, and Japan in East Asia. Figures 6A–H shows the suitable distribution regions of A. quinata in East Asia under the SSP1-2.6 and SSP5-8.5 scenarios. It is obvious that under the SSP5-8.5 scenario, the suitable distribution region of A. quinata in China shows a trend of continuous fragmentation from 2041 to 2081. Under the SSP1-2.6 scenario, the suitable distribution region in China can remain in a relatively stable state. From 2061 to 2081, under the SSP2-4.5 and SSP3-7.0 scenarios, the suitable distribution region in China also showed a fragmentation trend (Supplementary Figure S6). In Japan and South Korea, the suitable distribution regions of A. quinata remain stable in all scenarios. It can be seen from the line chart of suitable area that the suitable area of A. quinata in East Asia is closely related to that of China (Figures 5B,C). Supplementary Tables S4, S5 show the specific suitable area values in East Asia and China, respectively.
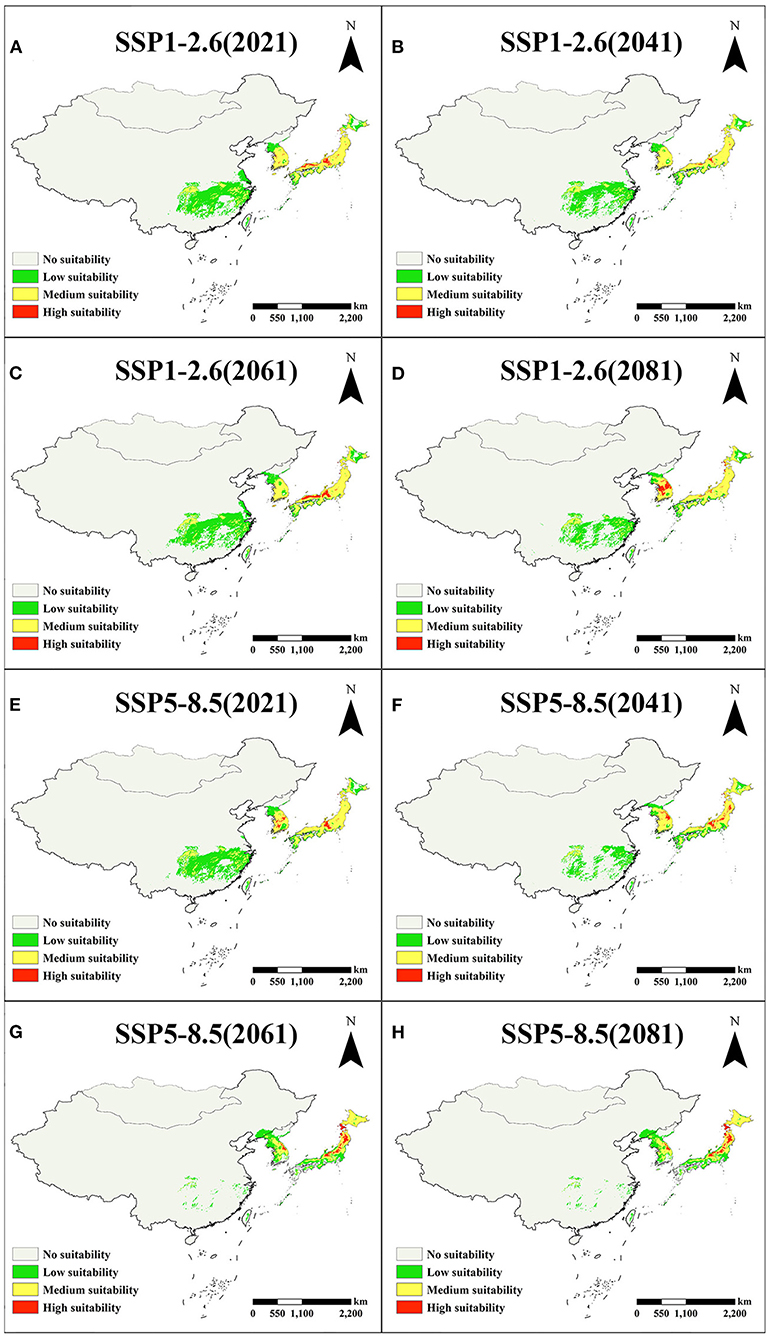
Figure 6. Distribution of A. quinata in East Asia in the SSP1-2.6 and SSP5-8.5 scenarios. (A–D) Distribution under the SSP1-2.6 scenario. (E–H) Distribution under the SSP5-8.5 scenario.
Geometric Center of Suitable Distribution Regions and Its Migration
The overall change of the suitable area can be expressed by the shift of the geometric center of the suitable distribution regions of A. quinata in East Asia. Based on the predicted potential distribution, the geometric centers of the distribution regions under different climate scenarios are obtained (Figure 7). Figure 7A shows the geometric centers under the current climate scenario and the 16 different future scenarios. It can be seen intuitively that these geometric centers generally show a trend of migration to the northeast. The migration distance of the geometric center is different in four different climate situations. In the SSP1-2.6 scenario (Figure 7B), the migration distance of the geometric center is relatively small, in the SSP2-4.5 and SSP3-7.0 scenarios (Figures 7C,D), the migration distance of the geometric center is relatively medium, and in the SSP5-8.5 scenario (Figure 7E), the migration distance of geometric center is relatively large.
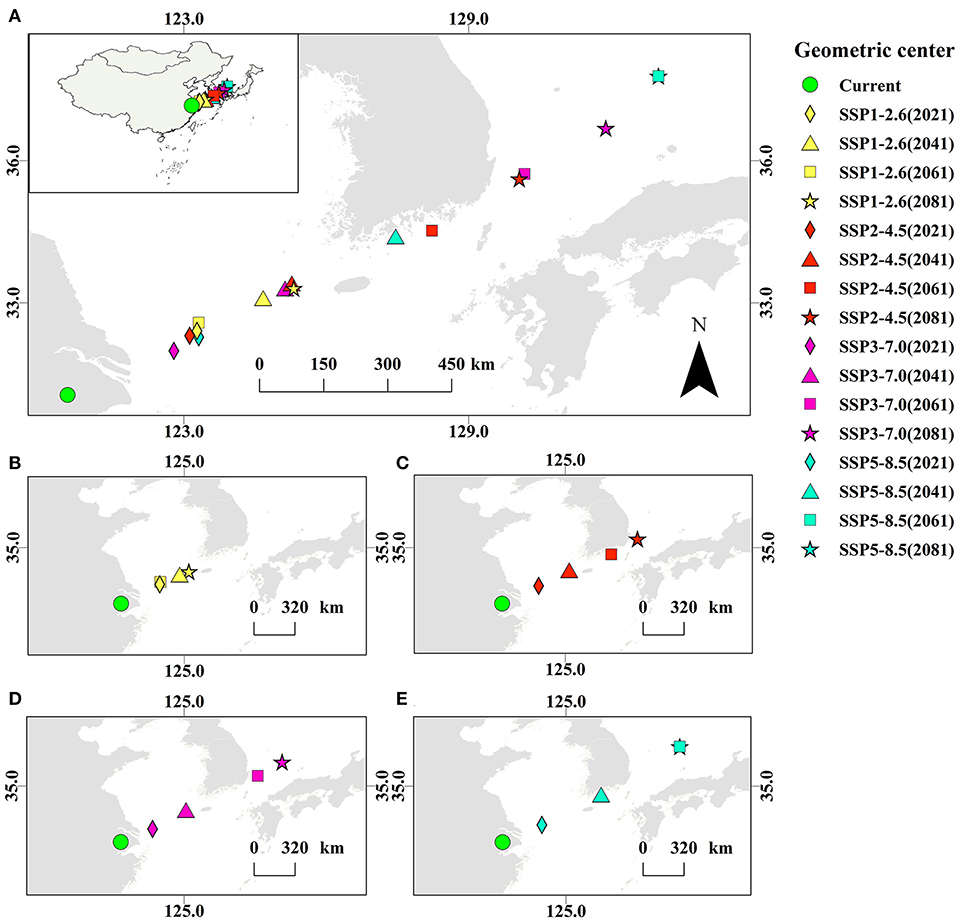
Figure 7. Geometric centers of distribution regions of A. quinata. (A) Geometric centers in different climate scenarios. (B) Geometric centers in the SSP1-2.6 scenario. (C) Geometric centers in the SSP2-4.5 scenario. (D) Geometric centers in the SSP3-7.0 scenario. (E) Geometric centers in the SSP5-8.5 scenario.
To express them more clearly, the migration of the geometric center are quantified. Considering the geometric center under the current climate scenario as the origin, the migration rate of the geometric center farthest from the origin is expressed as 1. The ratio of the distance between other geometric centers and the origin to the farthest distance is the migration rate of these geometric centers (Table 2). The climate scenario with the largest migration rate is SSP5-8.5 in 2061 and 2081, and the migration rate is 1. The climate scenario with the lowest migration rate is SSP3-7.0 in 2021, and the migration rate is 0.17. The average migration rates of the four climate scenarios are 0.29 (SSP1-2.6), 0.49 (SSP2-4.5), 0.55 (SSP3-7.0), and 0.69 (SSP5-8.5), respectively.
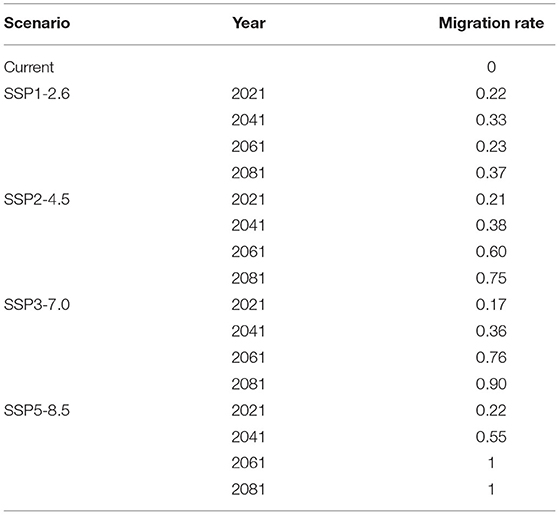
Table 2. Migration rate of the geometric center of Akebia quinata's distribution regions in East Asia.
In the SSP1-2.6 scenario, the migration rate of the geometric center increases slightly from 2021 to 2041, decreases in 2061 (the geometric center makes a return motion), and increases again in 2081, which is in a relatively stable dynamic equilibrium (the migration rate fluctuates between 0.22 and 0.37). It can be speculated that the distribution area of A. quinata may continue to maintain a relatively stable state in this scenario. In other scenarios, the geometric center does not make a return motion. And, with the continuous upgrading of the scene, the average migration rate of the geometric center also increases.
The decrease of the suitable area of A. quinata in East Asia is mainly affected by the change of the suitable area in China, while the suitable area of Japan and Korea has almost no change. Therefore, the weight of the suitable area of Japan and Korea in the total suitable area of East Asia has increased. The change of the suitable area weight causes the geometric center of the distribution area to move to the northeast, and the average mobility of geometric centers under different climate scenarios is positively correlated with the level of greenhouse gas emission scenarios.
Discussion
The change of plant distribution patterns is different under climate warming. The related research on the prediction of Cunninghamia lanceolata distribution shows that an increase in greenhouse gas emissions may lead to the decrease of the suitable area of C. lanceolata (Li Y. et al., 2020). In the study of two species of peony (Zhang et al., 2018), the suitable areas of Paeonia delavayi and Paeonia rockii will increase under the low concentration greenhouse gas emission scenario (RCP2.6), but the suitable area of P. rockii will increase and the suitable area of P. delavayi will decrease under the high concentration greenhouse gas emission scenario (RCP8.5). According to the related research of Coptis herbs, the suitable areas of Coptis chinensis and Coptis teeta will decrease, and the suitable area of Coptis deltoidea will increase in the future RCP8.5 scenario (Li J. et al., 2020). The prediction in this study shows that the suitable area of A. quinata in different regions of the world changes differently. In East Asia, when transitioning from the current scenario to three greenhouse gas emission scenarios (SSP2-4.5, SSP3-7.0, and SSP5-8.5), the suitable area of A. quinata will be significantly reduced. Compared with other scenarios, in the low concentration greenhouse gas emission scenario (SSP1-2.6), the suitable area change of A. quinata in East Asia is more conservative.
Global climate change will not only cause temperature changes in different regions but also change the distribution pattern of precipitation, resulting in changes in the distribution of A. quinata. Generally, plants can adapt to the fluctuation of climate factors within a certain threshold range, but when the change of climate factors approaches or even exceeds the threshold range, it will lead to the migration of their distribution (Camille and Gary, 2003). Plants need enough water to grow, but drought will limit their growth. When the precipitation in the driest month increases, it helps to prolong the growing season of the plants and promote their migration to more suitable habitats (Vaganov et al., 1999). In addition, extreme temperatures also significantly affect the growth of plants. If the minimum temperature of the coldest month drops, it will undoubtedly aggravate freezing and chilling injuries and cause plant death (Camille and Gary, 2003). The increase of maximum temperature in the warmest month may destroy the water balance in plants and hinder their metabolic function (Lemmens et al., 2006). The changes in these climate factors are directly reflected in the increase or decrease of suitable area. If the climate change is too large, it will cause more serious changes, that is, habitat fragmentation.
Conclusion
It is of great significance to predict the distribution pattern of A. quinata in different climatic conditions and analyze the response relationship between A. quinata and climatic factors for its protection and research. The results show that the concentrated distribution region of A. quinata is in East Asia. And, bio1 (annual mean temperature), bio6 (minimum temperature of the coldest month), and bio12 (annual precipitation) are the main climatic factors affecting the distribution pattern of A. quinata. In East Asia, when transitioningfrom the current scenario to three greenhouse gas emission scenarios (SSP2-4.5, SSP3-7.0, and SSP5-8.5), the suitable area of A. quinata will be significantly reduced. Compared with other scenarios, under the low concentration greenhouse gas emission scenario (SSP1-2.6), the change in suitable area of A. quinata in East Asia is more conservative. The geometric center of the distribution area of A. quinata in East Asia will move to the Northeast under the climate warming, which is mainly due to the decrease of the distribution area of A. quinata in China. And, the average migration rate of the geometric center under each climate scenario is positively correlated with the level of greenhouse gas emission scenario.
Data Availability Statement
The raw data supporting the conclusions of this article will be made available by the authors, without undue reservation.
Author Contributions
WW conceived and X-QX designed the study. J-MZ and WW processed the data, performed the analyses and analyzed the results, and wrote the manuscript. M-LS, Z-JL, X-YP, SS, and BL edited the manuscript. All authors read and approved the final version of the manuscript.
Funding
This work was supported by the Central Non-profit Research Institution of CAF (CAFYBB2017ZA004-7), the National Natural Science Foundation of China (41501059), and the Central Public-interest Scientific Institution Basal Research Funds (ZDRIF201711).
Conflict of Interest
The authors declare that the research was conducted in the absence of any commercial or financial relationships that could be construed as a potential conflict of interest.
Publisher's Note
All claims expressed in this article are solely those of the authors and do not necessarily represent those of their affiliated organizations, or those of the publisher, the editors and the reviewers. Any product that may be evaluated in this article, or claim that may be made by its manufacturer, is not guaranteed or endorsed by the publisher.
Acknowledgments
The authors gratefully acknowledge financial support from the Central Public-interest Scientific Institution Basal Research Funds (ZDRIF201711) and the Central Non-profit Research Institution of CAF (CAFYBB2017ZA004-7).
Supplementary Material
The Supplementary Material for this article can be found online at: https://www.frontiersin.org/articles/10.3389/fevo.2021.752682/full#supplementary-material
References
Acevedo, M. A., Beaudrot, L., Meléndez-Ackerman, E. J., and Tremblay, L. R. (2020). Local extinction risk under climate change in a neotropical asymmetrically dispersed epiphyte. J. Ecol. 108, 1553–1564. doi: 10.1111/1365-2745.13361
Alavi, S. J., Ahmadi, K., Hosseini, S. M., Tabari, M., and Nouri, Z. (2019). The response of English yew (Taxus baccata L.) to climate change in the Caspian Hyrcanian Mixed Forest ecoregion. Regional Environ. Change 19, 1495–1506. doi: 10.1007/s10113-019-01483-x
Camille, P., and Gary, Y. (2003). A globally coherent fingerprint of climate change impacts across natural systems. Nature 421, 37–42. doi: 10.1038/nature01286
Elith, J., Graham, C. H., Anderson, R. P., Dudík, M., Ferrier, S., Guisan, A., et al. (2006). Novel methods improve prediction of species' distributions from occurrence data. Ecography 29, 129–151. doi: 10.1111/j.2006.0906-7590.04596.x
Elith, J., Phillips, S. J., Hastie, T., Dudík, M., Chee, Y. E., and Yates, J. C. (2011). A statistical explanation of MaxEnt for ecologists. Diversity Distributions 17, 43–57. doi: 10.1111/j.1472-4642.2010.00725.x
Estes, L. D., Bradley, B. A., Beukes, H., Hole, D. G., Lau, M., Oppenheimer, M. G., et al. (2013). Comparing mechanistic and empirical model projections of crop suitability and productivity: implications for ecological forecasting. Global Ecol. Biogeogr. 22, 1007–1018. doi: 10.1111/geb.12034
Ferrarini, A., Alsafran, H. S. A. M., Dai, J., and Alatalo, M. J. (2018). Improving niche projections of plant species under climate change: silene acaulis on the British Isles as a case study. Clim. Dyn. 52, 1413–1423. doi: 10.1007/s00382-018-4200-9
Ferrarini, A., Dai, J., Bai, Y., and Alatalo, M. J. (2019). Redefining the climate niche of plant species: a novel approach for realistic predictions of species distribution under climate change. Sci. Total Environ. 671, 1086–1093. doi: 10.1016/j.scitotenv.2019.03.353
Fick, S. E., and Hijmans, J. R. (2017). WorldClim 2: new 1-km spatial resolution climate surfaces for global land areas. Int. J. Climatol. 37, 4302–4315. doi: 10.1002/joc.5086
Huntley, B., Berry, P. M., Cramer, W., and McDonald, P. A. (1995). Modelling present and potential future ranges of some european higher plants using climate response surfaces. J. Biogeogr. 22, 967–1001. doi: 10.2307/2845830
Jiang, D., Gao, Q. P., Shi, S. P., and Tu, F. P. (2006). Triterpenoid saponins from the fruits of Akebiae quinata. Chem. Pharm. Bull. 54, 595–597. doi: 10.1248/cpb.54.595
Lee, S. H., Song, Y. S., Jeong, Y., and Ko, S. K. (2017). Antioxidative and anti-inflammatory activities of Akebia quinata extracts in an in vitro model of acute alcohol-induced hepatotoxicity. J. Med. Food 20, 912–922. doi: 10.1089/jmf.2017.3920
Lemmens, C. M. H. M., Boeck, H. J. D., Gielen, B., Bossuyt, H., Malchair, S., Carnol, M., et al. (2006). End-of-season effects of elevated temperature on ecophysiological processes of grassland species at different species richness levels. Environ. Exp. Bot. 56, 245–254. doi: 10.1016/j.envexpbot.2005.02.009
Lenoir, J., Gegout, J. C., Marquet, P. A., De Ruffray, P., and Brisse, H. (2008). A significant upward shift in plant species optimum elevation during the 20th century. Science 320, 1768–1771. doi: 10.1126/science.1156831
Li, B., Li, Y., Cai, Q., Lin, F., Huang, P., and Zheng, Y. (2016). Development of chloroplast genomic resources for Akebia quinata (Lardizabalaceae). Conserv. Genet. Resour. 8, 447–449. doi: 10.1007/s12686-016-0593-0
Li, J., Fan, G., and He, Y. (2020). Predicting the current and future distribution of three Coptis herbs in China under climate change conditions, using the MaxEnt model and chemical analysis. Sci. Total Environ. 698:134141. doi: 10.1016/j.scitotenv.2019.134141
Li, Y., Li, M., Li, C., and Liu, Z. (2020). Optimized Maxent model predictions of climate change impacts on the suitable distribution of Cunninghamia lanceolata in China. Forests 11:302. doi: 10.3390/f11030302
Mimaki, Y., doi, S., Kuroda, M., and Yokosuka, A. (2007). Triterpene glycosides from the stems of Akebia quinata. Chem. Pharm. Bull. 55, 1319–1324. doi: 10.1248/cpb.55.1319
Molloy, S. W., Davis, R. A., and Van Etten, E. J. (2013). Species distribution modelling using bioclimatic variables to determine the impacts of a changing climate on the western ringtail possum (Pseudocheirus occidentals; Pseudocheiridae). Environ. Conserv. 41, 176–186. doi: 10.1017/S0376892913000337
Moraitis, M. L., Valavanis, V. D., and Karakassis, I. (2019). Modelling the effects of climate change on the distribution of benthic indicator species in the Eastern Mediterranean Sea. Sci. Total Environ. 667, 16–24. doi: 10.1016/j.scitotenv.2019.02.338
Park, S. H., Jang, S., Lee, S. W., Park, S. D., Sung, Y. Y., and Kim, K. H. (2018). Akebia quinata Decaisne aqueous extract acts as a novel anti-fatigue agent in mice exposed to chronic restraint stress. J. Ethnopharmacol. 222, 270–279. doi: 10.1016/j.jep.2018.04.010
Pearson, R. G., and Dawson, P. T. (2003). Predicting the impacts of climate change on the distribution of species: are bioclimate envelope models useful? Glob. Ecol. Biogeogr. 12, 361–371. doi: 10.1046/j.1466-822X.2003.00042.x
Phillips, S. J., Anderson, R. P., and Schapire, E. R. (2006a). Maximum entropy modeling of species geographic distributions. Ecol. Modell. 190, 231–259. doi: 10.1016/j.ecolmodel.2005.03.026
Phillips, S. J., Dudí, K. M., and Schapire, E. R. (2006b). Maxent Software for Modeling Species Niches and Distributions (Version 3.4.1). Available online at: http://biodiversityinformatics.amnh.org/open_source/maxent/
Phillips, S. J., and Dudík, M. (2008). Modeling of species distributions with Maxent: new extensions and a comprehensive evaluation. Ecography 31, 161–175. doi: 10.1111/j.0906-7590.2008.5203.x
Qin, A., Liu, B., Guo, Q., Bussmann, R. W., Ma, F., Jian, Z., et al. (2017). Maxent modeling for predicting impacts of climate change on the potential distribution of Thuja sutchuenensis Franch., an extremely endangered conifer from southwestern China. Glob. Ecol. Conserv. 10, 139–146. doi: 10.1016/j.gecco.2017.02.004
Saatchi, S., Buermann, W., Steege, H., Mori, S., and Smith, B. T. (2008). Modeling distribution of Amazonian tree species and diversity using remote sensing measurements. Remote Sens. Environ. 112, 2000–2017. doi: 10.1016/j.rse.2008.01.008
Sillero, N., and Barbosa, M. A. (2020). Common mistakes in ecological niche models. Int. J. Geogr. Information Sci. 35, 213–226. doi: 10.1080/13658816.2020.1798968
Song, D. H., Kim, G.-J., Chung, K.-H., Lee, K. J., and An, H. J. (2018). Ormosanine from Akebia quinata suppresses ethanol-induced inflammation and apoptosis and activates antioxidants via the mitogen activated protein kinase signaling pathway. J. Funct. Foods 48, 357–366. doi: 10.1016/j.jff.2018.07.033
Sung, Y. Y., Kim, D. S., and Kim, K. H. (2015). Akebia quinata extract exerts anti-obesity and hypolipidemic effects in high-fat diet-fed mice and 3T3-L1 adipocytes. J. Ethnopharmacol. 168, 17–24. doi: 10.1016/j.jep.2015.03.051
Thuiller, W., Lavorel, S., Araújo, M. B., Sykes, M. T., and Prentice, C. I. (2005). Climate change threats to plant diversity in Europe. Proc. Natl. Acad. Sci. U.S.A. 102, 8245–8250. doi: 10.1073/pnas.0409902102
Vaganov, E. A., Hughes, M. K., Kirdyanov, A. V., Schweingruber, F. H., and Silkin, P. P. (1999). Influence of snowfall and melt timing on tree growth in subarctic Eurasia. Nature 400, 149–151. doi: 10.1038/22087
Wang, B., Deveson, E. D., Waters, C., Spessa, A., Lawton, D., Feng, P., et al. (2019). Future climate change likely to reduce the Australian plague locust (Chortoicetes terminifera) seasonal outbreaks. Sci. Total Environ. 668, 947–957. doi: 10.1016/j.scitotenv.2019.02.439
Wang, H., Wang, X., Li, Y., Zhang, S., Li, Z., Li, Y., et al. (2021). Structural properties and in vitro and in vivo immunomodulatory activity of an arabinofuranan from the fruits of Akebia quinata. Carbohydr. Polym. 256:117521. doi: 10.1016/j.carbpol.2020.117521
Wilson, K. L., Skinner, M. A., Lotze, H. K., and Sorte, C. (2019). Projected 21st-century distribution of canopy-forming seaweeds in the Northwest Atlantic with climate change. Diversity Distributions 25, 582–602. doi: 10.1111/ddi.12897
Yang, X., Kushwaha, S. P. S., Saran, S., Xu, J., and Roy, S. P. (2013). Maxent modeling for predicting the potential distribution of medicinal plant, Justicia adhatoda L. in Lesser Himalayan foothills. Ecol. Eng. 51, 83–87. doi: 10.1016/j.ecoleng.2012.12.004
Yi, Y., Cheng, X., Yang, Z., Wieprecht, S., Zhang, S., and Wu, Y. (2017). Evaluating the ecological influence of hydraulic projects: a review of aquatic habitat suitability models. Renew. Sustain. Energy Rev. 68, 748–762. doi: 10.1016/j.rser.2016.09.138
Yi, Y., Zhou, Y., Cai, Y., Yang, W., Li, Z., and Zhao, X. (2018). The influence of climate change on an endangered riparian plant species: the root of riparian Homonoia. Ecol. Indic. 92, 40–50. doi: 10.1016/j.ecolind.2017.05.004
Zhang, K., Yao, L., Meng, J., and Tao, J. (2018). Maxent modeling for predicting the potential geographical distribution of two peony species under climate change. Sci. Total Environ. 634, 1326–1334. doi: 10.1016/j.scitotenv.2018.04.112
Keywords: MaxEnt, suitable distribution, resource protection, geometric center of distribution regions, geographical distribution pattern
Citation: Zhang J-M, Song M-L, Li Z-J, Peng X-Y, Su S, Li B, Xu X-Q and Wang W (2021) Effects of Climate Change on the Distribution of Akebia quinata. Front. Ecol. Evol. 9:752682. doi: 10.3389/fevo.2021.752682
Received: 03 August 2021; Accepted: 03 November 2021;
Published: 09 December 2021.
Edited by:
Wilfried Thuiller, UMR5553 Laboratoire d'Écologie Alpine (LECA), FranceReviewed by:
Seyed Mahdi Kazemi, Islamic Azad University, Qom, IranEmad Kaky, Sulaimani Polytechnic University, Iraq
Copyright © 2021 Zhang, Song, Li, Peng, Su, Li, Xu and Wang. This is an open-access article distributed under the terms of the Creative Commons Attribution License (CC BY). The use, distribution or reproduction in other forums is permitted, provided the original author(s) and the copyright owner(s) are credited and that the original publication in this journal is cited, in accordance with accepted academic practice. No use, distribution or reproduction is permitted which does not comply with these terms.
*Correspondence: Wei Wang, Z3JlYXRraW5nbHlzQDE2My5jb20=
 Jun-Ming Zhang1,2
 Xin-Qiao Xu
 Wei Wang