 Stephanie K. Erlandson
 Jesse Bellemare
 David A. Moeller
- 1Department of Plant and Microbial Biology, University of Minnesota, St. Paul, MN, United States
- 2Department of Biological Sciences, Smith College, Northampton, MA, United States
Biodiversity hotspots host a high diversity of narrowly distributed endemic species, which are increasingly threatened by climate change. In eastern North America, the highest concentration of plant diversity and endemism occurs in the Southern Appalachian Mountains (SAM). It has been hypothesized that this region served as a refugium during Pleistocene glacial cycles and that postglacial migration northward was dispersal limited. We tested this hypothesis using species distribution models for eight forest herb species. We also quantified the extent to which the geography of suitable habitat shifted away from the current range with climate change. We developed species distribution models for four forest herb species endemic to the SAM and four that co-occur in the same SAM habitats but have broader ranges. For widespread species, we built models using (1) all occurrences and (2) only those that overlap the SAM hotspot in order to evaluate the extent of Hutchinsonian shortfalls and the potential for models to predict suitable habitat beyond the SAM. We evaluated the extent to which predicted climatically suitable areas are projected to shift away from their current ranges under future climate change. We detected unoccupied but suitable habitat in regions up to 1,100 km north of the endemic species’ ranges. Endemic ranges are disjunct from suitable northern areas due to a ∼100–150 km gap of unsuitable habitat. Under future climate change, models predicted severe reductions in suitable habitat within current endemic ranges. For non-endemic species, we found similar overall patterns and gap of unsuitability in the same geographic location. Our results suggest a history of dispersal limitation following the last glacial maximum along with an environmental barrier to northward migration. Conservation of endemic species would likely require intervention and assisted migration to suitable habitat in northern New England and Canada.
Introduction
Understanding the abiotic, biotic, and historical factors that have shaped species’ current geographic distributions is crucial for predicting how species might respond to modern climate change. If species’ geographic distributions and range limits are determined largely by climatic factors (Woodward, 1987; Gaston, 2003), it is expected that ranges will need to shift substantial distances poleward in order to track favorable conditions as climate warms. There is growing evidence from empirical studies and predictive models that climate change is causing widespread shifts in the distribution and abundance of species (Chen et al., 2011; Bellard et al., 2012; Ehrlén and Morris, 2015; Dainese et al., 2017; Wang et al., 2018) and increasing extinction risk (Thomas et al., 2004; Keith et al., 2008). Similar range shifts are well-documented for past climate variation associated with glacial cycles (Betancourt et al., 1990; Jackson and Overpeck, 2000). However, it is unclear if all species share this capacity for rapid migration, especially given the more rapid pace of contemporary climate change (Svenning and Skov, 2004, 2005; Dullinger et al., 2012).
These range dynamics highlight a distinction between a species’ realized distribution and the actual extent of its potential distribution. For well-dispersed species, the realized and potential distributions may overlap extensively at geographical scales, even during times of environmental change (i.e., ranges that are in “dynamic equilibrium” with the environment, Webb, 1986). For poorly dispersed species, or those facing geographical barriers to colonization of disjunct suitable habitat, the realized distribution might only partly fill the full extent of the species’ potential distribution (“poor range-filling capacity,” Svenning and Skov, 2004). Species tending toward the latter scenario represent a significant challenge for conservation in the face of modern climate change, as their distributions might already show long-term “disequilibrium” with the environment, and rapid and commensurate adjustments to further change might be unlikely.
Better documenting these range dynamics is particularly critical for protecting biodiversity hotspots, which often contain a concentration of narrow-ranged or endemic species: i.e., “hotspots” of endemism (e.g., Médail and Diadema, 2009). The locations of such hotspots appear to be linked to aspects of geography, physiography, and past climate change (Sandel et al., 2011). For example, Ohlemüller et al. (2008) showed that areas with high concentrations of narrow-ranged species have distinct climatic and physiographic characteristics compared to surrounding areas, often being cooler and higher in elevation. Similarly, it has been suggested that hotspots of endemism have formed in areas with reduced climate change “velocity” in the past, tracing to factors like elevational complexity, which can buffer species against rapid climate change (Loarie et al., 2009; Sandel et al., 2011; Scherrer and Körner, 2011).
In the North Temperate Zone, many endemic and small-ranged species tend to be concentrated around the locations of putative Pleistocene-era glacial refugia (Daubenmire, 1978; Estill and Cruzan, 2001). The long-term restriction of endemic species to these areas suggests a failure by some species to fill their expanding potential distributions as climate ameliorated during the Holocene (Jansson, 2003; Svenning and Skov, 2007). Consequently, there may already be substantial mismatches between some species’ current realized distributions and their potential distributions owing to historical factors, such as dispersal limitation. In eastern North America, a major center of endemism for plants and animals of deciduous forests is the Southern Appalachian Mountains hotspot (hereafter SAM; Petranka, 1998; Estill and Cruzan, 2001). Of the 189 small-ranged endemic plant species reported from temperate deciduous forests in the eastern U.S., 119 overlap the SAM in their distributions and 18 are entirely restricted to this region (Bellemare and Moeller, 2014). The current concentration of endemic species in the SAM hotspot may trace to this area’s history as a Pleistocene glacial refugium and to limited rates of postglacial dispersal (Stein et al., 2000). The observation that many of these range-restricted species can be grown in horticulture far to the north of their current native ranges, and sometimes even escape and naturalize, is consistent with the inferred role of dispersal limitation in these plants’ distributions (Sax et al., 2013). However, a detailed analysis of these patterns, and possible mismatches between realized native vs. potential distributions, has not yet been undertaken.
In this study, we used species distribution models (SDMs; Franklin, 2010) to test the hypothesis that narrow endemic forest herbs of the SAM have limited range filling, such that there is substantial suitable habitat to the north of their current ranges. We developed SDMs using maxent and boosted regression trees for four well-known, endemic species: Trillium vaseyi (Melanthiaceae), Shortia galacifolia (Diapensiaceae), Phacelia fimbriata (Boraginaceae), and Diphylleia cymosa (Berberidaceae). By documenting mismatches between these species’ realized vs. potential distributions, these models also allowed us to evaluate the role that historical factors, like dispersal limitation, might have played in forming their current ranges. Further, we used these models to predict the magnitude of projected changes in suitable habitat under climate change. As a point of comparison, we also developed SDMs for four more widespread forest herb species from the Appalachian Mountains that overlap in range with the SAM endemics but extend further north. We built these models using (1) occurrences from their entire range and (2) using just those from the SAM. These models provided two key insights. First, they determined whether models built with occurrences from only the SAM range had the capacity to accurately predict suitable habitat outside of the range. If the limited sampling of geographic space (Wallacean shortfall) results in sampling of a fraction of the realized niche (Hutchinsonian shortfall), SDMs may not predict the entirety of suitable habitat beyond the region where models were trained. Second, these models allowed us to quantify the extent to which geographic ranges might recede northwards with climate change and whether those projected changes are similar for endemic and widespread species. We addressed the following specific questions:
(1) For endemics, to what extent is apparently suitable habitat already present north of the species’ ranges, and is that unoccupied habitat contiguous or disjunct from the current range? How do these patterns differ from those of more widespread forest plants?
(2) What is the magnitude of loss of suitable habitat in the SAM under future climates? To what extent do projections of potential habitat under future climates overlap with current ranges, and are extrinsic dispersal barriers (environmental or physical) likely to influence the possibility of northward population expansion?
(3) What is the relative magnitude of projected northward range shifts under climate change for narrow endemics vs. more widespread forest herbs? In addition, to what extent do Wallacean shortfalls result in Hutchinsonian shortfalls and influence projections of suitable habitat beyond the SAM biodiversity hotspot?
Materials and Methods
Study Species
We focused on eight species of herbaceous flowering plants whose ranges overlap in the forests of the Southern Appalachian Mountains (SAM: Figure 1). Four of these species are endemic to western North Carolina, eastern Tennessee, and adjacent regions (Phacelia fimbriata Michx., Diphylleia cymosa Michx., Shortia galacifolia Torr. & A. Gray., and Trillium vaseyi Harbison); two have widespread ranges across the eastern United States (Maianthemum canadense Desf., Trillium undulatum Willd.) and two have ranges that are intermediate to the others in size (Prosartes lanuginosa Michx., Houstonia serpyllifolia Michx.). The four more widespread species have similar habitat requirements to the four endemic species (Gleason and Cronquist, 1991 and personal observations), and in the southeastern United States their ranges are partially overlapping and restricted to the SAM.
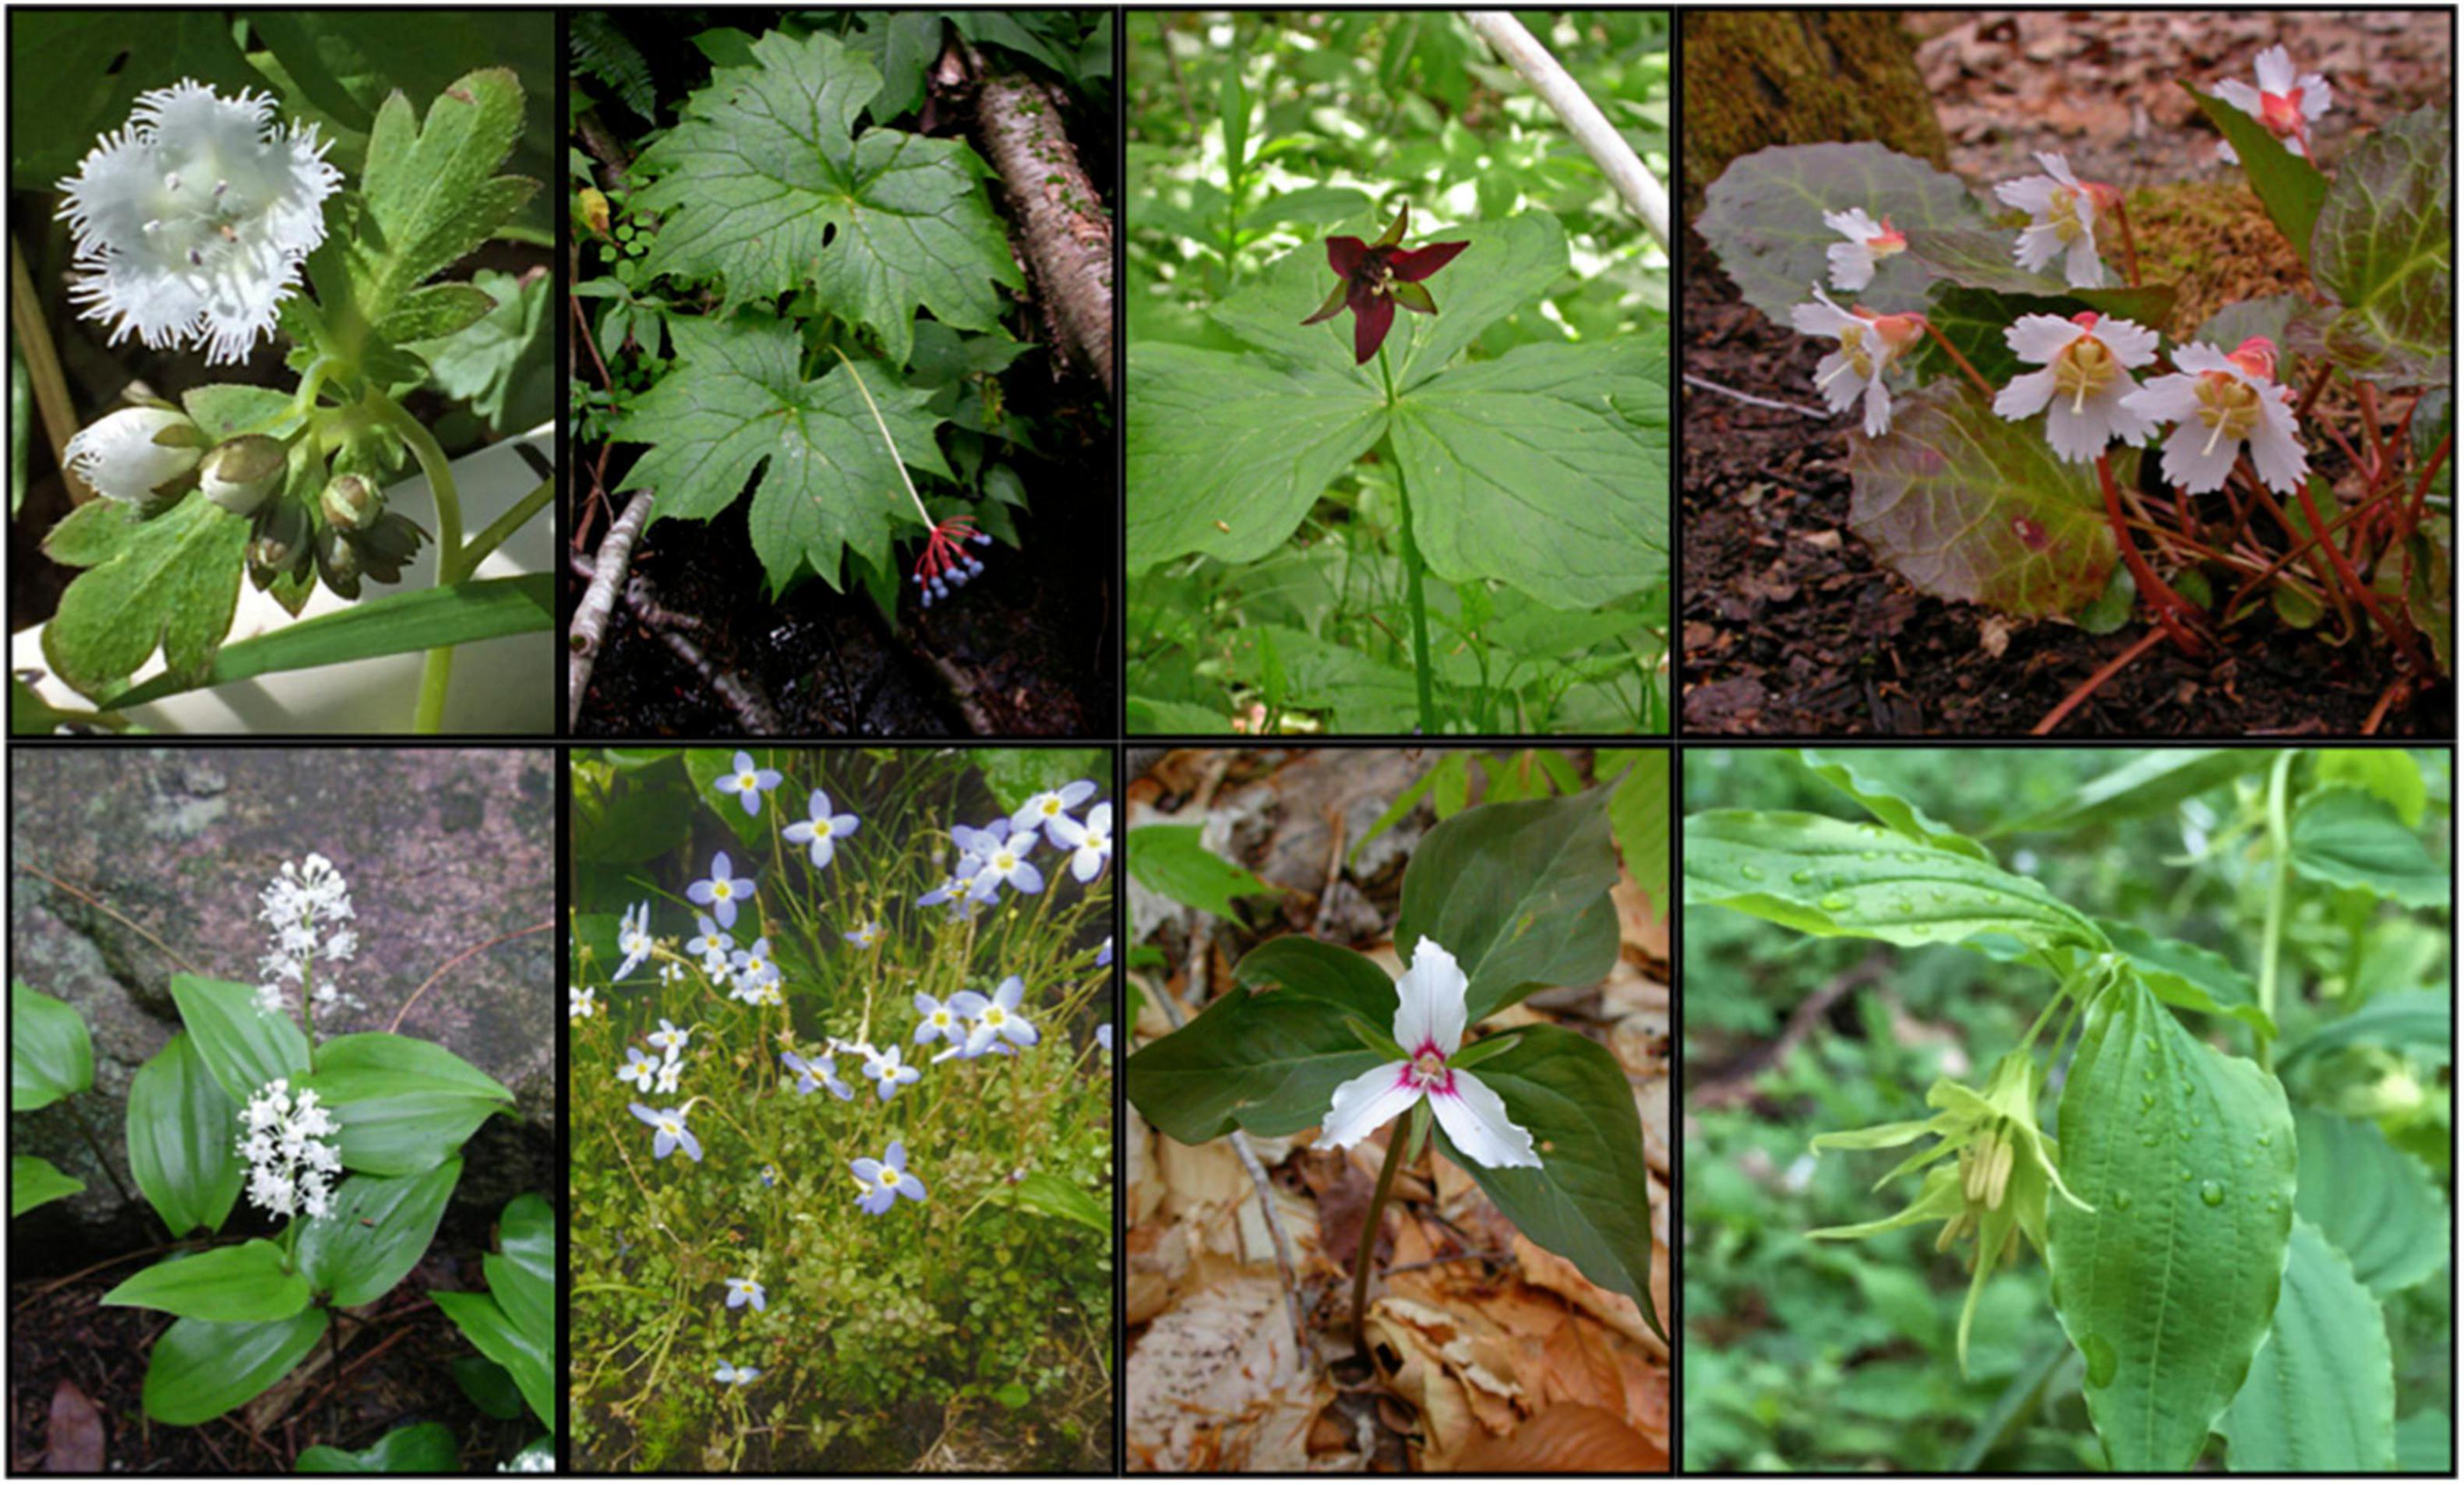
Figure 1. Species endemic to the Southern Appalachian Mountains biodiversity hotspot are shown in the top row. From left to right: Phacelia fimbriata, Diphylleia cymosa, Trillium vaseyi, and Shortia galacifolia. Non-endemic species with broader distributions are shown in the bottom row. From left to right: Maianthemum canadense, Houstonia serpyllifolia, Trillium undulatum, and Prosartes lanuginosa. Photo credits: M. canadense: By Halpaugh at English Wikipedia—Transferred from en.wikipedia to Commons., Public Domain. H. serpyllifolia: By Masebrock at English Wikipedia—Transferred from en.wikipedia to Commons., Public Domain. P. fimbriata, P. lanuginosa: Stephanie Erlandson. D. cymosa, S. galacifolia, T. vaseyi, T. undulatum: Jesse Bellemare.
Locality Data
We obtained occurrence records from the online database gbif (Global Biodiversity Information Facility1, see Supplementary Table 2.1 for DOIs), correspondence with other researchers, and our own field surveys for three of the four endemics: D. cymosa, P. fimbriata, and T. vaseyi. For the fourth endemic, S. galacifolia, we used pre-existing locality data, as it is a rare species that has been of considerable interest to botanists for centuries and its distribution is well-documented (e.g., Davies, 1955). Our field searches for the first three endemics occurred throughout sections of the Great Smoky Mountains National Park, Nantahala National Forest, and Cherokee National Forest during April, May and June of 2013 and 2014 when the species were flowering and most easily detected. The final set of occurrence data was filtered to remove duplicate or erroneous records, and eliminate those that lacked specific coordinates. Across all eight species, the total number of occurrences ranged from 20 to 1017 per species (Supplementary Appendix 2 and Supplementary Table 2.1). For the two widespread non-endemics, M. canadense and T. undulatum, some portions of the species’ range were far more heavily sampled than others. Therefore, we down-sampled occurrences across the range such that there was only one presence point per raster cell (0.1 degrees or 30 arc-seconds) using the R function “gridSample,” in the package “dismo” (Hijmans et al., 2017; R Core Team, 2017).
Environmental Data
We obtained environmental data from the online database WorldClim (version 1.42, Hijmans et al., 2005). We used a grid cell resolution of 1 × 1 km (30 arc-seconds) for the eastern United States (30–60 degrees latitude; −90 to −60 degrees longitude; tile 13). For each species, we selected environmental variables from the full list of 67 (36 temperature, 12 precipitation, 19 bioclim). Bioclim variables include various interactions among temperature and precipitation variables, such as the temperature of the wettest quarter. For maxent models, we pared down the number of environmental predictors using a principal components analysis (PCA) on the environmental data for the background points plus occurrences. Based on the PCA loadings, we eliminated highly correlated environmental predictors. This resulted in set of 3–6 predictors for each species (see Supplementary Appendix 2 and Supplementary Table 2.2). For boosted regression tree models, we conducted stepwise backward elimination until the deviance was minimized using the gbm.simplify function (Elith et al., 2008; Supplementary Appendix 3 and Supplementary Table 3.2).
Niche Breadth and Overlap
To examine whether pairs of our eight species share similar climate niches, we calculated Schoener’s D (using the R package dismo) for each pair of species using all Worldclim variables. Values of D may range from 0 (no niche overlap) to 1 (complete overlap).
We used the ecospat package in R to test for niche differentiation (Broennimann et al., 2012; Di Cola et al., 2017). For each non-endemic species, we used a principal components analysis (PCA-env) of the environmental variables incorporated into their respective SDMs (see below). We used Schoener’s D to quantify niche overlap. We tested if the climate niches for the full range of each species niches are more similar to the climate niches of their range in the Southern Appalachian Mountains than expected by chance using a permutation test (N = 999 permutations).
Species Distribution Models
We used two methods separately to develop species distribution models, maxent and boosted regression trees (general boosted models), as they have been shown to perform well compared to alternative methods (Elith et al., 2006; Hijmans and Graham, 2006; Phillips et al., 2006). Maxent is a machine-learning, presence-only method (Phillips et al., 2004); boosted regression trees (brt) is an ensemble method that combines regression trees and boosting (Elith et al., 2008). For simplicity, and because the models have similar predictions and evaluation scores, we present only the maxent results hereafter. Details of the brt methods and results can be found in Supplementary Appendix 3.
For the four endemic species, we built one type of model, which involved using all of our occurrence points (Southern Appalachian models: SA models). For the four non-endemic species, we built two different kinds of models. First, we built models using all of the occurrences from across the range as would be standard practice for SDMs (Full Range models: FR models). Second, we used only the subset of occurrences from the SAM; i.e., those that overlapped in distribution with the endemic species (SA models). This second approach provides a means for evaluating how well SDMs predict suitable territory outside of the SAM using only data from that region. This additional approach is important because it is well known that SDMs may perform poorly beyond the region where the model was developed and fail to predict range expansion (e.g., Briscoe Runquist et al., 2019, 2021; Lake et al., 2020).
We built SDMs using maxent version 3.4.1 implemented in R (Phillips et al., 2017a,b). Ten thousand background points were generated for non-endemic species; slightly fewer (6,000–9,000) were generated for the endemics because they had fewer occurrences over a narrower geographic extent (see Supplementary Table 2.3 for more details). To generate background points, we delineated a box encompassing the entire species’ range. For SA models (both endemics and non-endemics) background points were generated over an area encompassing the SAM plus adjacent lowland areas (34–36.5 degrees latitude; −85 to −80 degrees longitude). This area included the entire ranges of the four endemics. For the FR models for non-endemics, the area over which background points were generated included the entire temperate deciduous forest biome of eastern North America (30–60 degrees latitude; −90 to −60 degrees longitude). We clipped environmental layers for each model to these boxes using ArcMap software (ESRI, 2016).
For all species, hinge and product features were turned off. We increased the regularization coefficient (betamultiplier) to produce smoother response curves and prevent overfitting of models, especially when projecting to new areas (Supplementary Table 2.3; Warren and Seifert, 2011). Because our focal endemics are easily detectable during the period of time in which searches occurred, we increased the value of τ, the default presence detectability for them (Supplementary Table 2.3). Last, we used multivariate environmental similarity surfaces (MESS; Elith et al., 2010) to determine the distribution of analogous environments and limited our inferences about the distribution of potential suitable habitat to those geographic areas. For each species (and combination of SA and FR models) we report the results of one run of the model. We ran each model multiple times, each time drawing new background points, and the projections were very stable across model runs.
More details of model generation and setting selection can be found in Supplementary Appendix 2.
Model Evaluation
For all species, we used AUC and TSS for model evaluation. AUC, the area under the (receiver operating characteristic) curve, assesses model performance relative to random chance and ranges from 0 to 1 (Phillips and Dudiík, 2008). The true skill statistic, TSS, is a threshold-dependent metric based on the sensitivity (true positive rate) + the specificity (true negative rate)–1 (Allouche et al., 2006). Values range from −1 to +1, with 0 indicating model performance no better than chance, 1 indicating perfect accuracy, and −1 indicating perfect inaccuracy. We evaluated TSS at a model-dependent threshold value, where the sum of the true positive rate and the true negative rate was maximized (Freeman and Moisen, 2008).
We evaluated all models using fivefold cross validation. We trained each model with 80% of the occurrence and background data, and then tested against the other 20% of occurrences (fivefold cross-validation). AUC and TSS values were averaged across the five runs. Second, we evaluated how well the SAM models predicted occurrences outside (to the north) of the SAM for the four more widespread species.
The environmental variables that most negatively affected the probability of occurrence for each raster cell were determined using the “limiting” function in the package “maxent” (Elith et al., 2010). We were particularly interested in which environmental factors limited suitability at and beyond the northern border of the endemic species’ ranges.
Projections Under Climate Change
We projected future ranges of each species using two global circulation models (GCMs) and two emission scenarios: GCMs HadGEM2-ES and NorESMI-M from among the five recommended by Warszawski et al. (2013) and McSweeney and Jones (2016). These represent two potential extremes in temperature and precipitation variability in the eastern United States: the HadGEM2-ES model has high temperature variability and low precipitation variability, while NorESMI-M is the reverse. As the HadGEM2-ES model makes more extreme predictions as far as the severity of climate change compared to NorESMI-M, hereafter we focus on the more moderate and conservative NorESMI-M models (see Supplementary Appendix 4 for HadGEM2-ES Figures). For each GCM, we made projections under the “worst-case” carbon emission scenarios (no change in emissions: rcp8.5). The resulting two types of climate change scenarios were then projected for years 2050 and 2070.
We also projected the distribution of suitable habitat at the last glacial maximum (∼21,000 years BP) using paleoclimate data from the PMIP2 database3, accessed in WorldClim, and using the MIROC global circulation model. Results are shown in Supplementary Appendix 6.
Results
Niche Breadth and Overlap
Endemics and non-endemics had a wide range of niche overlap within and between groups. For example, the endemic P. fimbriata had very high niche overlap with the endemic D. cymosa (0.96) and the non-endemic H. serpyllifolia (0.90) but low overlap with the endemic S. galacifolia (0.18). The mean niche overlap did not differ significantly when comparing pairs of endemics (mean D = 0.56), pairs of non-endemics (mean D = 0.56), and pairs including one endemic and one non-endemic (mean D = 0.58; P = 0.983). More information on the natural history of each species and pairwise D-values can be found in Supplementary Appendix 1 (see Supplementary Table 1.1. for pairwise D-values).
As expected, climate niche breadth was greater for the full range (FR) of occurrences compared to the Southern Appalachian (SAM) occurrences for all four non-endemic species (Supplementary Figure 1.1). When comparing FR and SAM niches, Schoener’s D-values were highest for H. serpyllifolia and P. lanuginosa (0.75 and 0.63, respectively) and there was significant niche overlap between the SAM and FR occurrences for each species (P = 0.021 and 0.014, respectively). By contrast, niche overlap was lower for M. canadense and T. undulatum (0.32 and 0.31, respectively) and niche overlap was not greater than expected by chance for each species (P = 0.26 and 0.33, respectively).
Endemic Species: Current Ranges and Species Distribution Model Predictions
Model evaluation showed high AUC scores for all endemic species (0.86–0.98), indicating good model fit, as well as moderate to high TSS values (0.63–0.95; Table 1). Below we focus our discussion of the distribution of suitable habitat to areas with suitability scores of 0.7 or greater. Predicted suitable habitat in all models for the SAM overlapped with the current ranges (i.e., realized distributions) of the endemic species (Figures 2A,E,I,M). Suitable habitat for P. fimbriata and D. cymosa spanned most of the SAM along the border of North Carolina (NC) and Tennessee (TN), while suitable territory for T. vaseyi and S. galacifolia was concentrated in the southern half of this region.
Table 1. Evaluation metrics of SDM predictive performance based on fivefold cross validation where 80% of occurrences and background points were used for training and 20% of occurrences for testing.
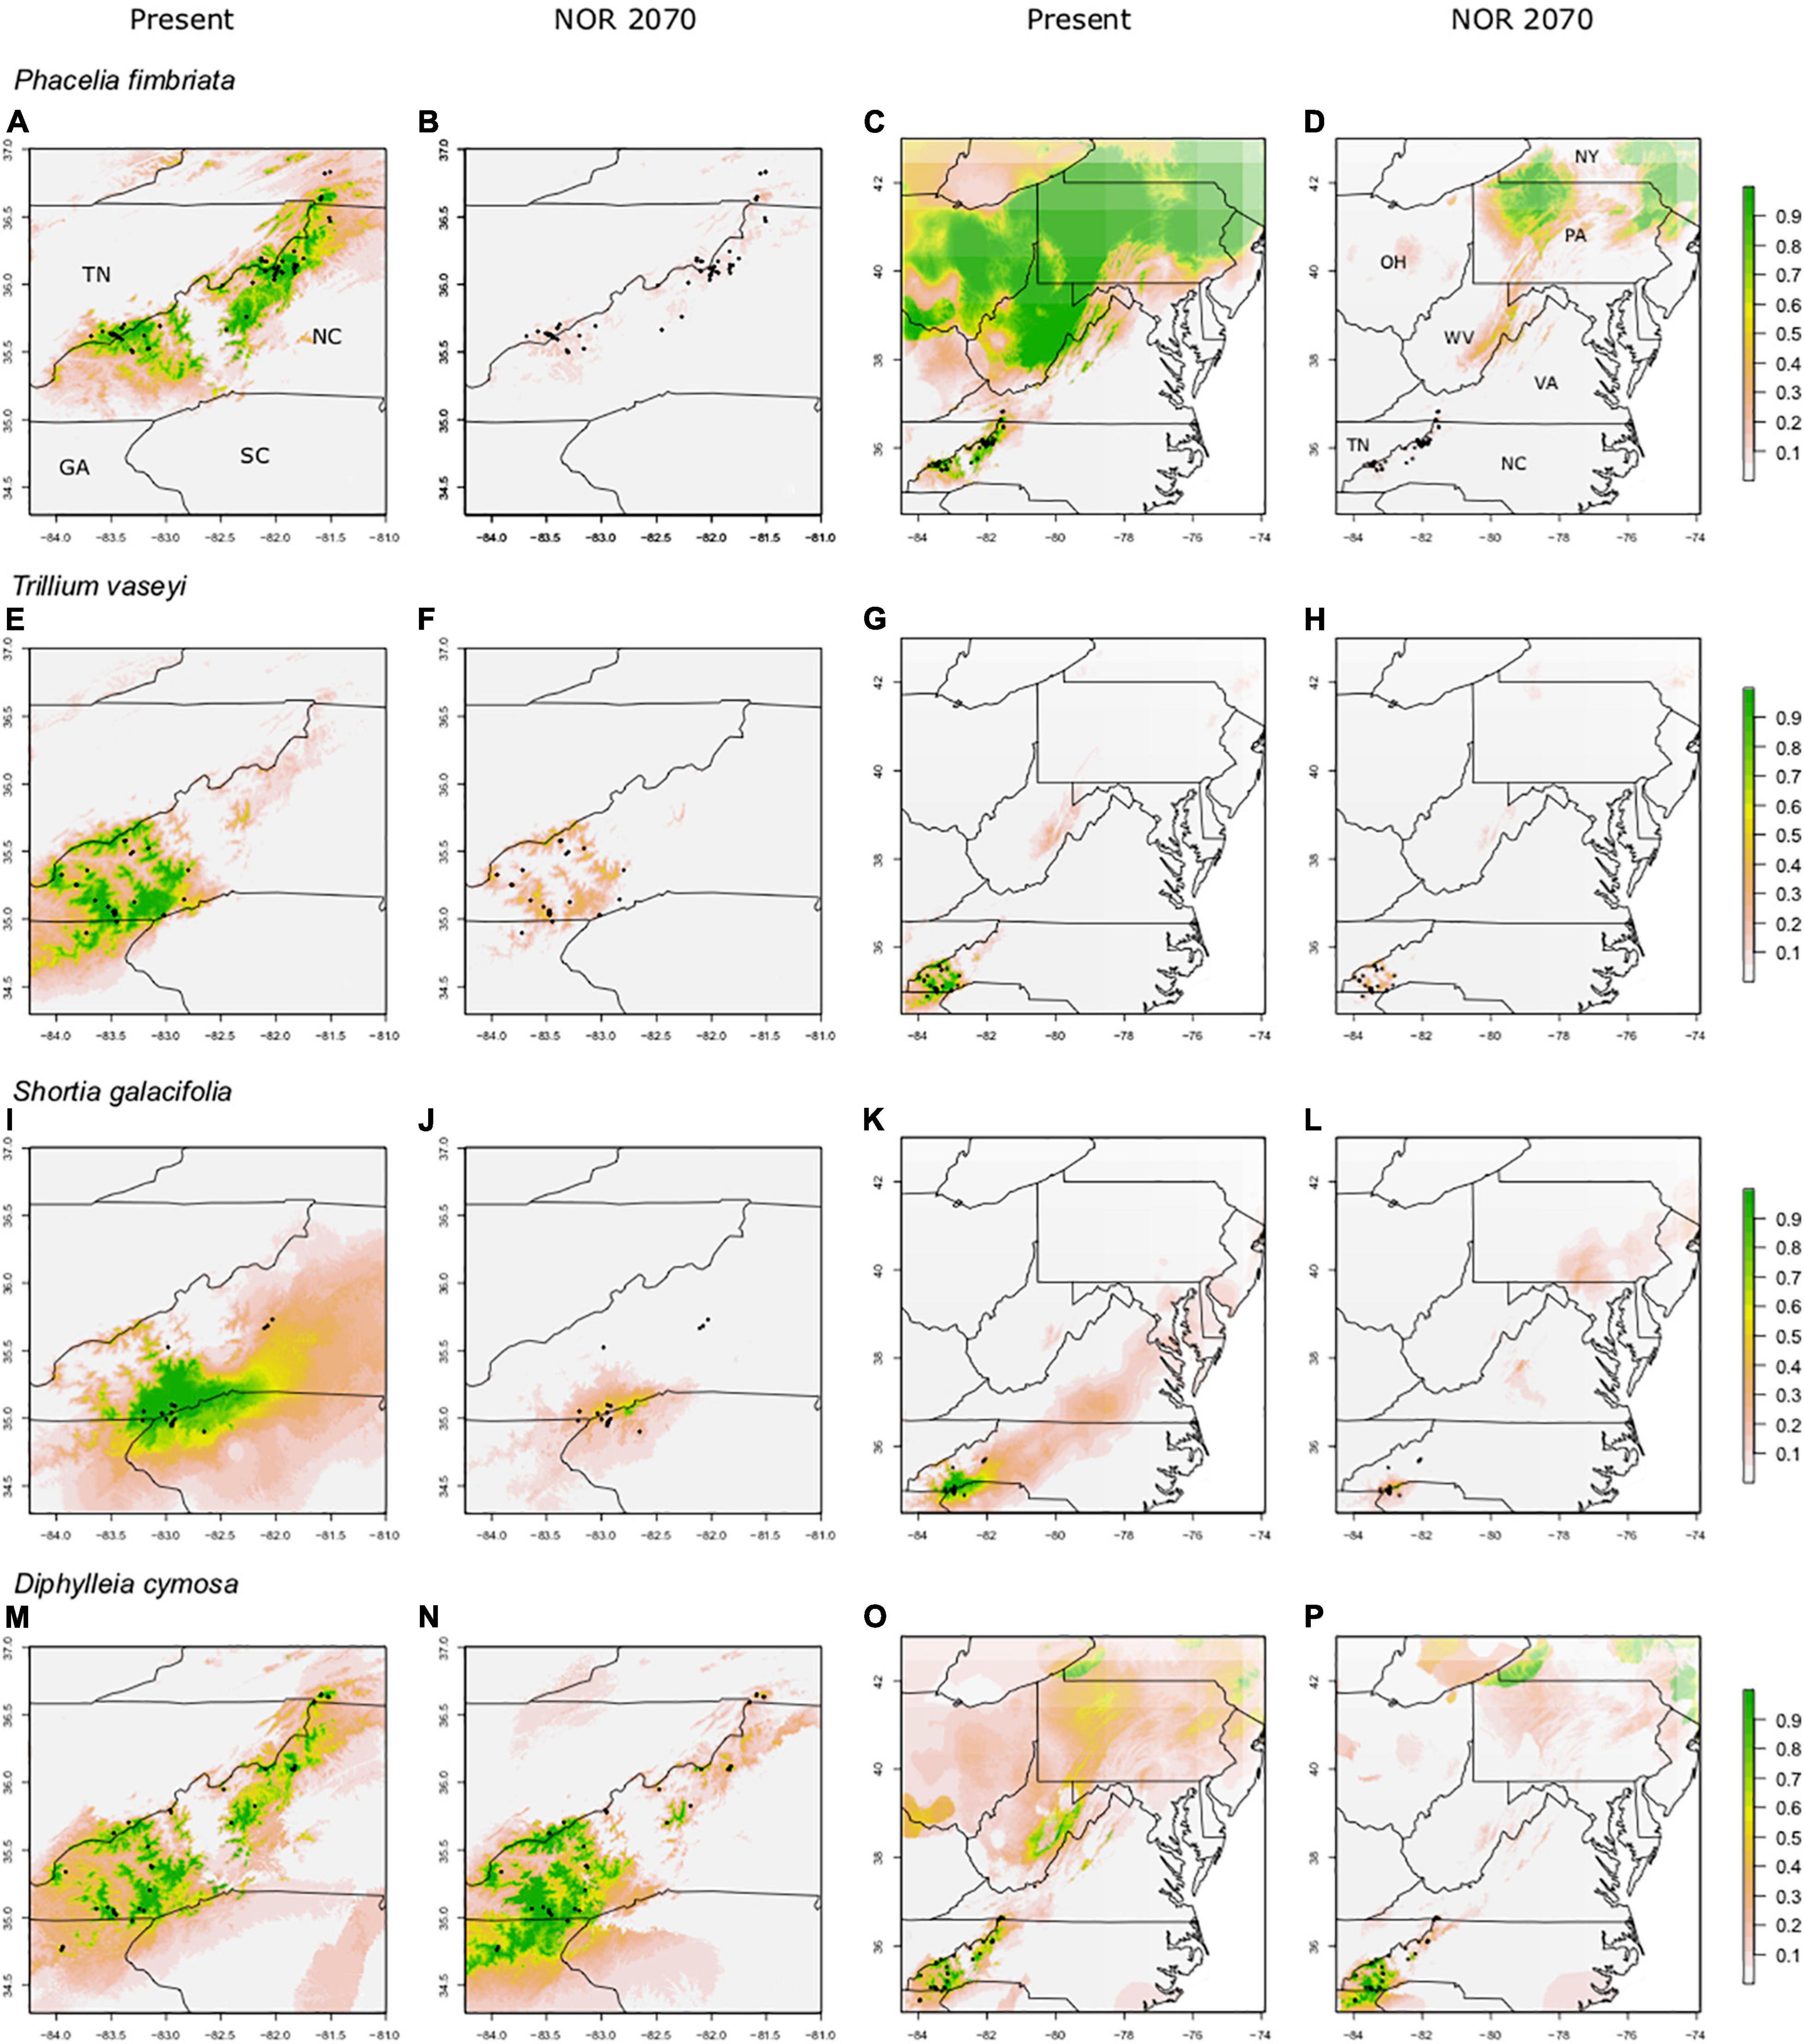
Figure 2. Predicted suitable habitat of endemic species using the maxent modeling method. A portion of the eastern United States overlapping our focal area is shown; Tennessee (TN), North Carolina (NC), South Carolina (SC), and Georgia (GA). Other labeled states include New York (NY), Pennsylvania (PA), Virginia (VA), West Virginia (WV), and Ohio (OH). Both present and future climate scenarios are shown. Rows indicate species, columns indicate climate data used. Present and future climate data are taken from WorldClim version 1.4. “NOR” indicates the general circulation model NorESMI-M. Models are projected into the year 2070 using the climate emission scenario rcp8.5. A pseudo Plate Carree projection is used, which is the default in ArcMap. We refer the reader to particular plots in the text using the letter labels (A–P).
Beyond the SAM, the SDMs for P. fimbriata and D. cymosa also predicted highly suitable habitat (i.e., potential range) in some northern areas outside these species realized distributions or native ranges (Figures 2C,O). For P. fimbriata, predicted suitable habitat occurred in West Virginia (WV), Pennsylvania (PA), and portions of New York (NY) and New England (see Supplementary Figure 2.1 for maps that show the entirety of the Appalachian range including New England). For D. cymosa, our model predicted parts of WV, upstate NY, and New England to be highly suitable. Notably, models for both species predicted a gap or break in suitable habitat in Virginia (VA), spanning west-to-east across the Appalachians in a region of lower elevation terrain. This gap in suitability (∼140 km wide along its south-to-north axis) across the mid-Appalachians results in a discontinuous distribution of predicted suitable habitat along the Appalachian Mountain corridor. For T. vaseyi, there is a small area of high suitability in the White Mountains of New Hampshire (Supplementary Figure 4.4). For S. galacifolia, SDMs predicted no highly suitable habitat outside the current range (Figures 2K,G). In Figure 2, we show a portion of the Appalachians up to southern New York so that details of the projections are easily visualized. In Supplementary Figure 2.1, we show projections for the entirety of Appalachian Mountain range including New England and southern Canada.
Endemic Species: Future Projections Under Climate Change
We limited our future projections to analogous environments, determined by MESS plots, in the eastern United States. To describe changes in the distribution of suitable habitat we used a threshold of 0.7 suitability. Most future climate projections showed moderate to severe reductions (range 86.5–100%) in suitable habitat within the endemics’ current ranges, while one species (D. cymosa) showed both retention and gain of suitable habitat (31% gain). In most cases, species also showed losses of suitable habitat to the north of their current ranges. We focus on the results of future projections for one climate change scenario (NorESM1-M, rcp8.5, 2070; see Supplementary Appendix 4 for HadGEM2-ES Figures). In this scenario, only P. fimbriata and D. cymosa retained substantial areas of highly suitable habitat (>70% suitability) to the north of their ranges (Figures 2D,P and Supplementary Figure 2.1). Descriptions of other climate change scenarios and future time points can be found in Supplementary Appendix 4.
Non-endemic Species: Current Ranges and Species Distribution Model Predictions
For the non-endemics, the Southern Appalachian (SA) models had high AUC (0.94–0.97) and TSS scores (0.80–0.94; Table 1). Full Range (FR) models had moderate to high AUC (0.71–0.91) and TSS scores (0.35–0.72; Table 1). FR model predictions overlapped strongly with the species’ current ranges, with 78–91% of presence points falling in areas predicted by models to be suitable habitat (Figures 3C,G,K,O); this suggests substantial “filling” of climatically determined potential distributions. For all non-endemics, SDM predictions also captured the observed restriction of these species to the high elevation areas of the Southern Appalachian Mountains in the southeastern U.S., as well as their much broader east-west distribution north of PA.
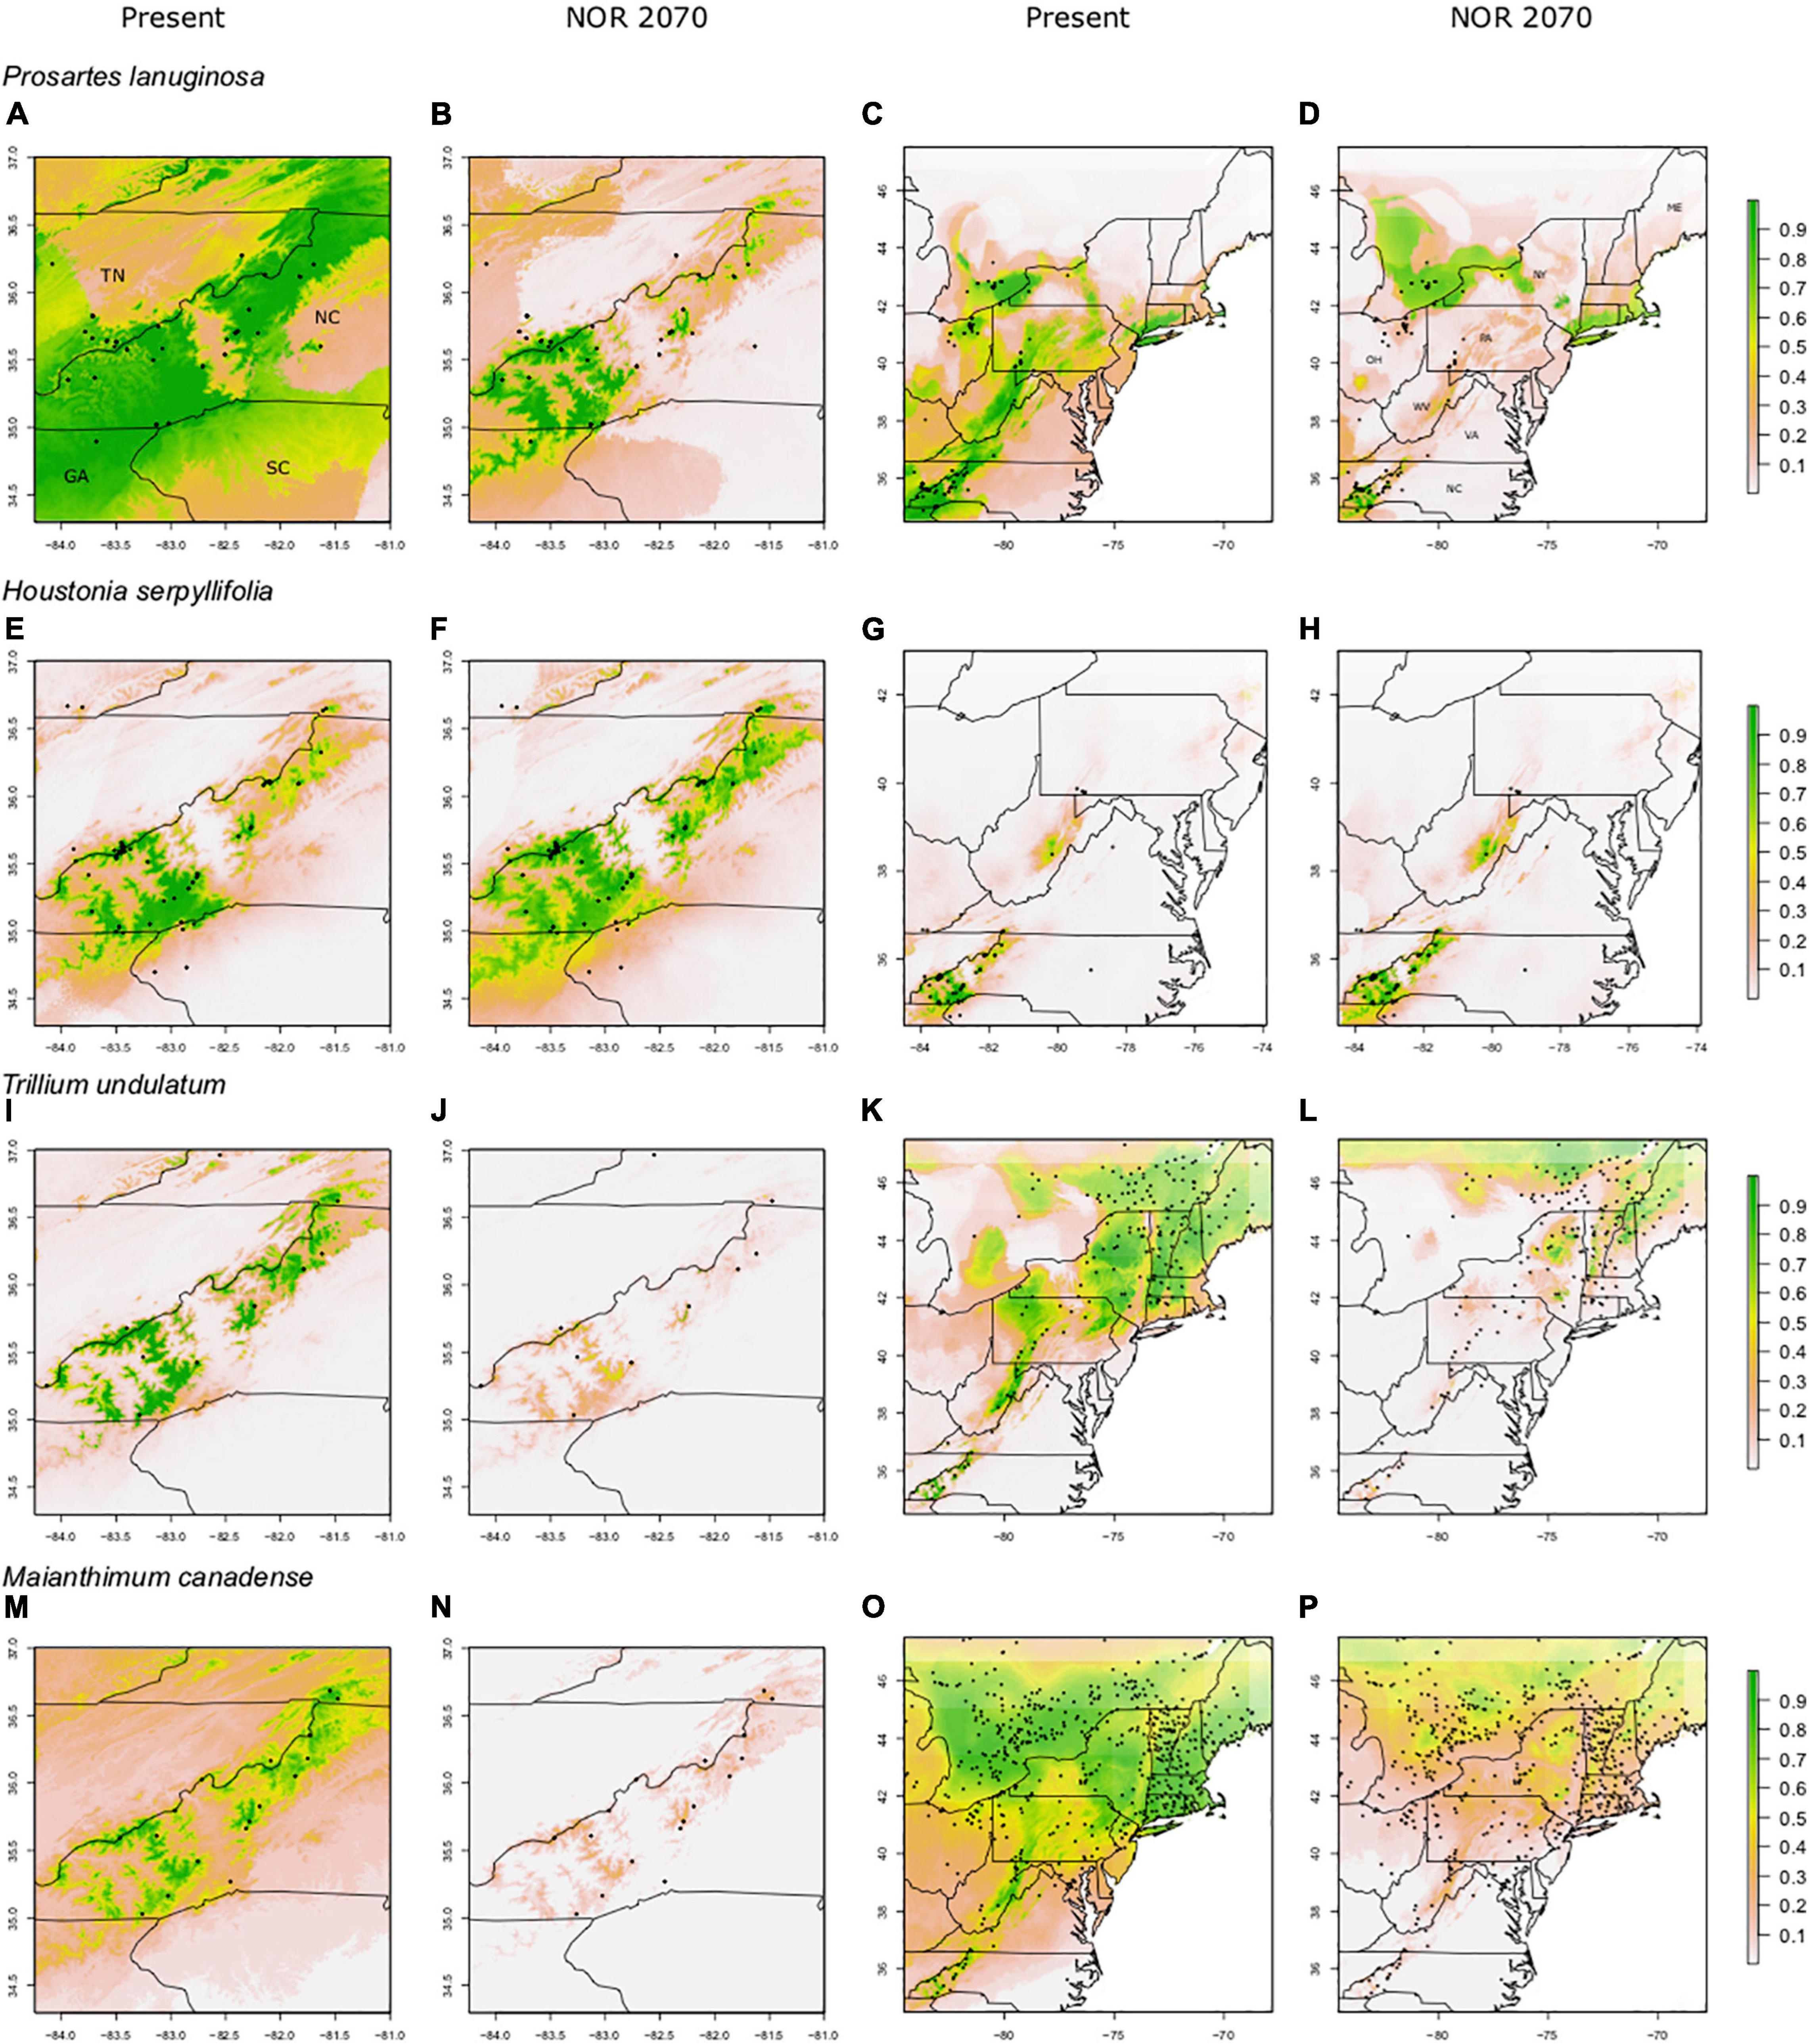
Figure 3. Predicted suitable habitat of FR (full range) models for non-endemic species using the maxent modeling method. A portion of the eastern United States is shown; Tennessee (TN), North Carolina (NC), South Carolina (SC), and Georgia (GA). Other labeled states include New York (NY), Pennsylvania (PA), Virginia (VA), West Virginia (WV), Ohio (OH), and Maine (ME). FR (full range) models were constructed using presence points found within the entire range of the species. Rows indicate species, columns indicate climate data used. Both present and future climate scenarios are shown. Present and future climate data are taken from WorldClim version 1.4. “NOR” indicates the general circulation model NorESMI-M. Models are projected into the year 2070 using the climate emission scenario rcp8.5. A pseudo Plate Carree projection is used, which is the default in ArcMap. We refer the reader to particular plots in the text using the letter labels (A–P).
The non-endemic SA models for M. canadense, T. undulatum, and P. lanuginosa had greater predictive performance than the FR models for both AUC and TSS (Table 1). Whereas, for H. serpyllifolia, performance metrics were very similar for the two types of models.
We also evaluated how well SA models predicted occurrences to the north of SAM that were not included in model building. Overall, SA models had fair to moderate predictive performance for H. serpyllifolia (AUC: 0.70; TSS: 0.41), M. canadense (AUC: 0.65; TSS: 0.23), P. lanuginosa (AUC: 0.55; TSS: 0.21), and T. undulatum (AUC: 0.62; TSS: 0.11).
Non-endemic Species: Future Projections
For most species, the FR models predicted significant reductions in suitable habitat within current ranges and often losses outside of ranges as well; however, those losses were not nearly as severe as in the SA models (61–95% losses for SA models; 23–66% losses for FR models; Figures 3, 4). For example, SA models predicted that M. canadense would lose 95% of its predicted suitable habitat in North America (Figure 4P); whereas, FR models predicted a loss of less suitable territory in North America (66%) and a shift of 23% of its range to northern NY and New England (Figure 3P). SA models predicted T. undulatum’s range to recede (61% lost; 26% shifted north) primarily to parts of Ontario and Quebec (Figure 4L), whereas FR models were less severe in predicting recession (45% lost; 50% shifted north) to northern NY, New England, and parts of Canada (Figure 3L). Areas of suitable habitat for P. lanuginosa and H. serpyllifolia show no movement northwards, but simply retention or loss.
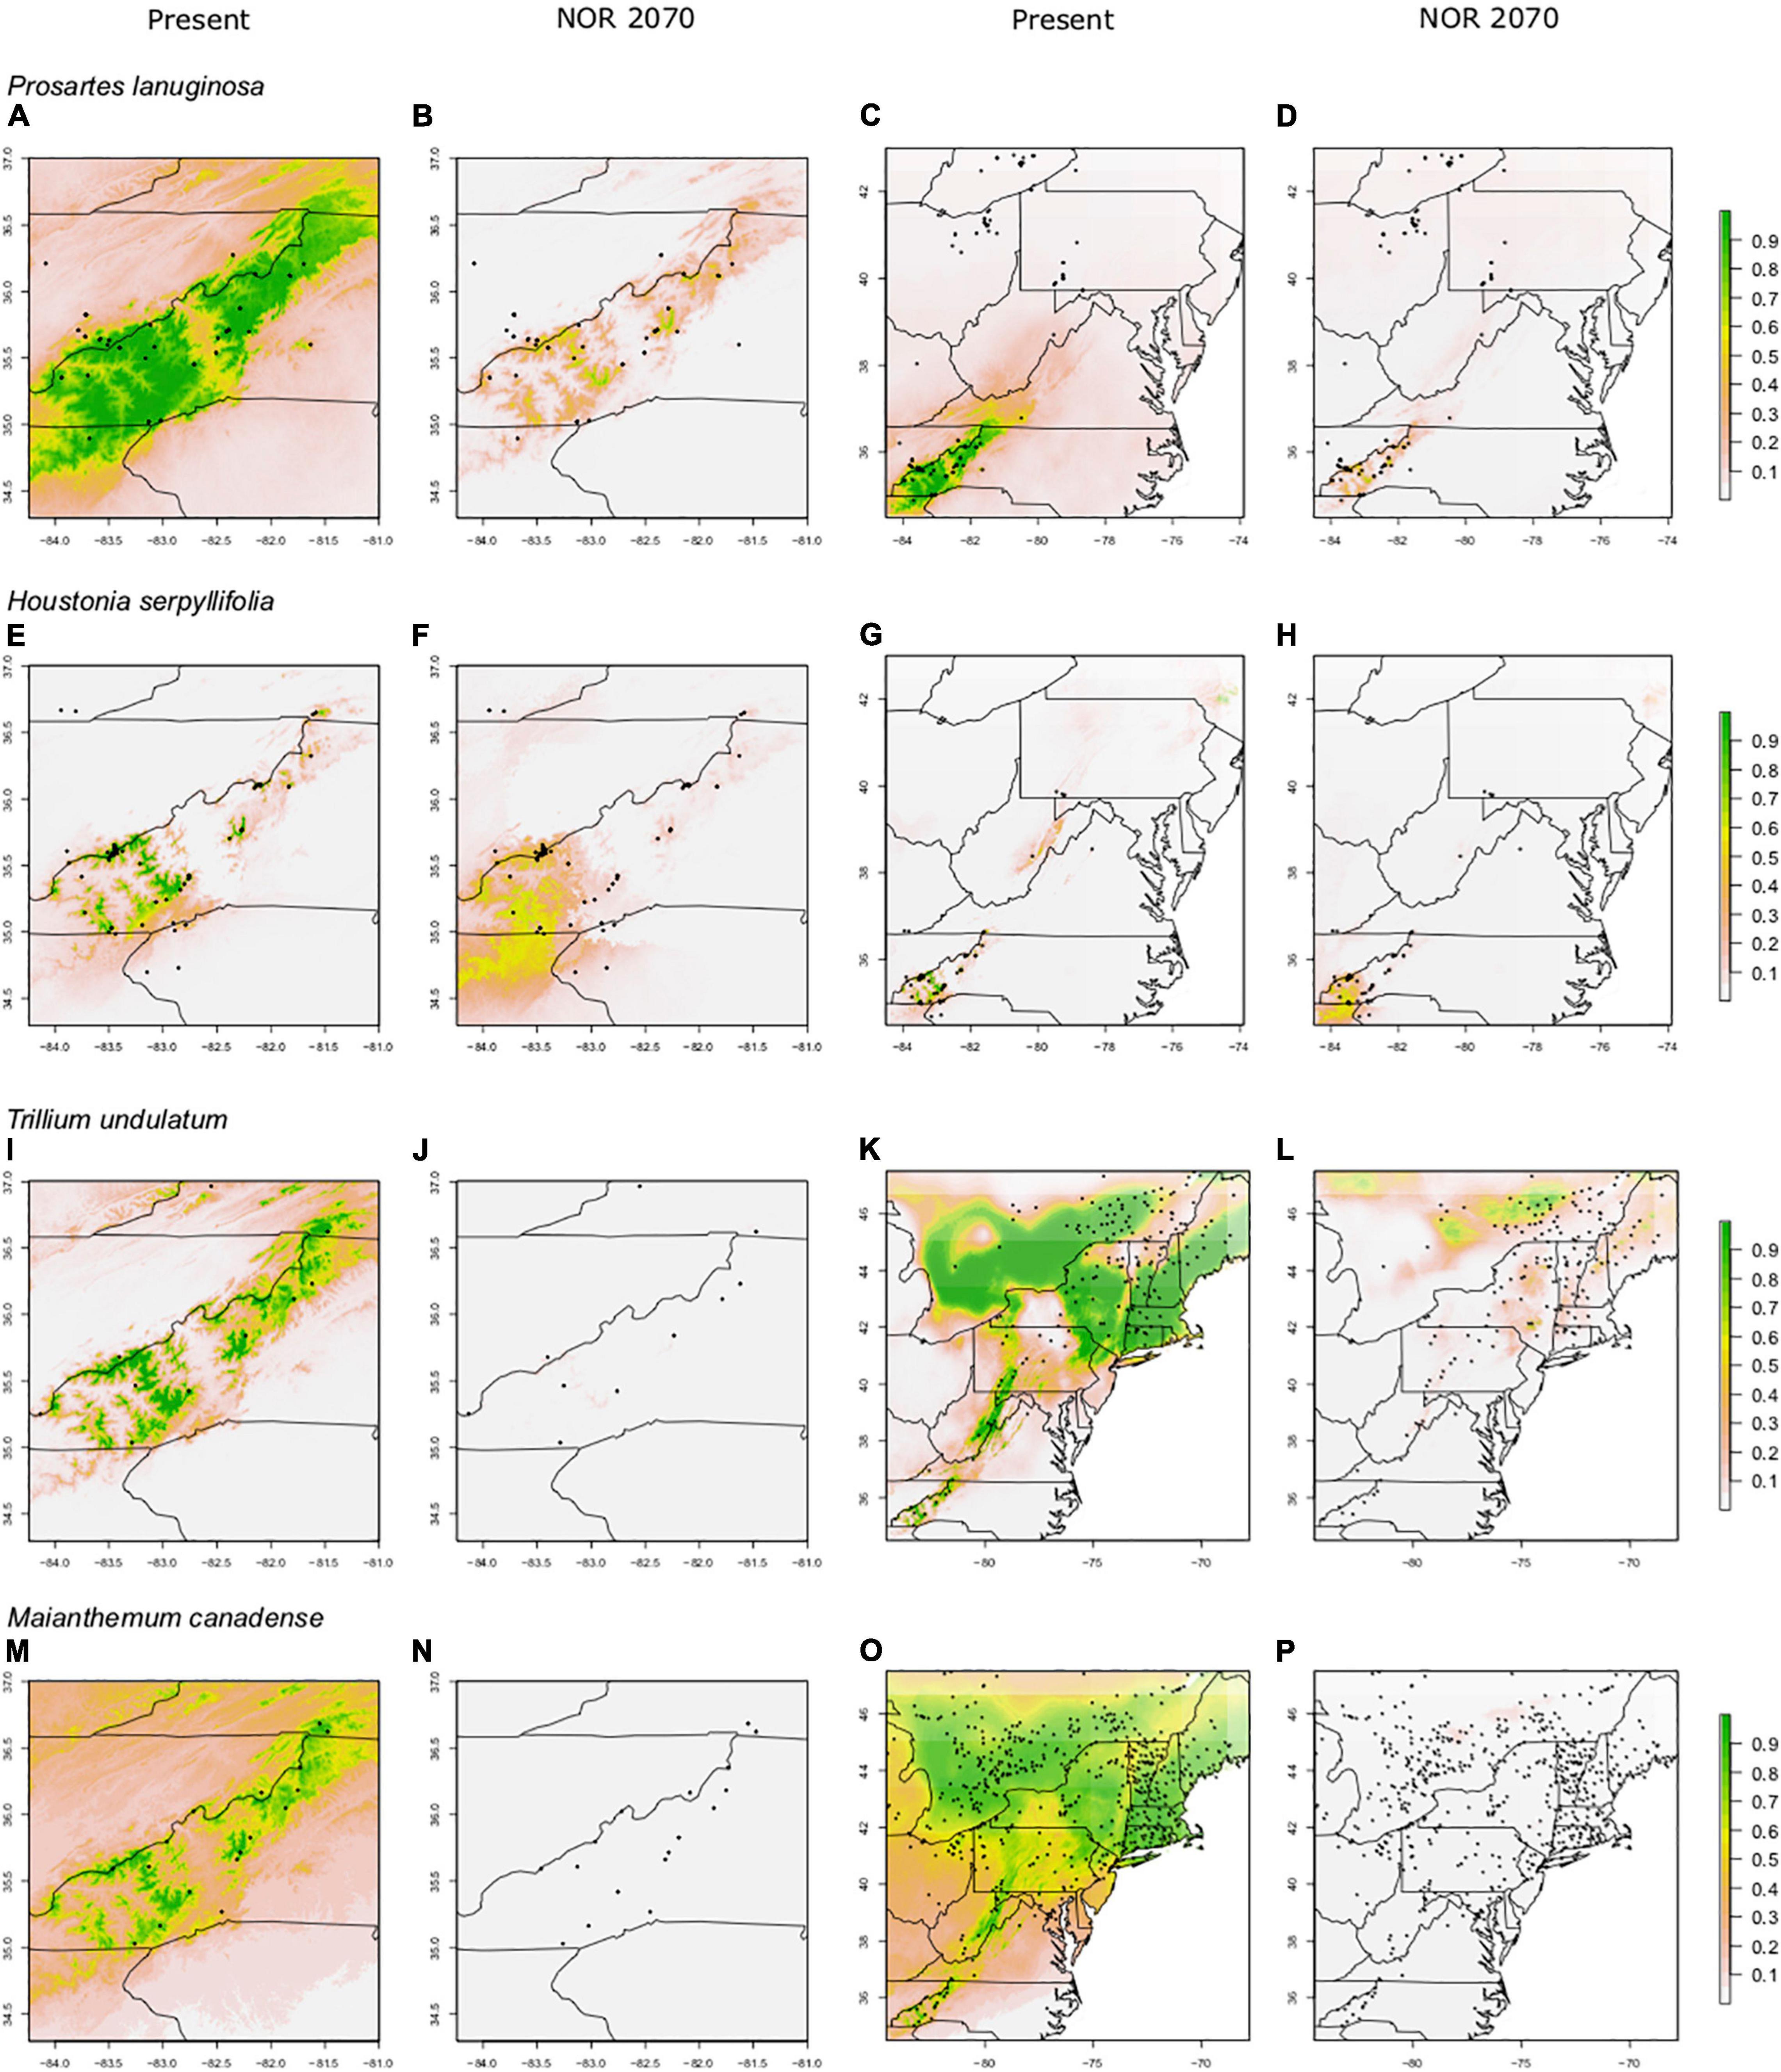
Figure 4. Predicted suitable habitat of SA models for non-endemic species using the maxent modeling method. A portion of the eastern United States is shown; the maps in the first two columns are centered on the border between North Carolina and Tennessee. SA (Southern Appalachian) models were constructed using presence points found only within the Southern Appalachian Mountains. Rows indicate species, columns indicate climate data used. Both present and future climate scenarios are shown. Present and future climate data are taken from WorldClim version 1.4. “NOR” indicates the general circulation model NorESMI-M. Models are projected into the year 2070 using the climate emission scenario rcp8.5. A pseudo Plate Carrée projection is used, which is the default in ArcMap. We refer the reader to particular plots in the text using the letter labels (A–P).
Environmental Predictors and Limiting Factors
Common environmental predictors emerged among models for different species, including temperature of the wettest quarter and of the driest quarter (Supplementary Table 2.2). Based on response curves to all common predictors, species prefer cool temperatures year-round, narrow annual temperature ranges, high precipitation, and low precipitation seasonality.
Three endemics had an area of predicted unsuitable habitat in VA, resulting in a discontinuous distribution along the Appalachians. For all endemics, low precipitation was a key limiting factor in this region (as well as in geographic regions to the north). Low precipitation of the warmest quarter most limited the range of P. fimbriata and D. cymosa, low precipitation of the coldest quarter for T. vaseyi, and low precipitation of the driest month for S. galacifolia.
Discussion
In response to historical and recent climate change, the ranges of many plant species have shifted to higher elevations and to higher latitudes (Jackson and Overpeck, 2000; Kelly and Goulden, 2008; Chen et al., 2011). However, evidence is increasing that for other plant species, particularly small-ranged endemics, there might be large mismatches between species’ realized and potential distributions (Svenning and Skov, 2004, 2007; Van der Veken et al., 2008; Sax et al., 2013). This phenomenon of “poor range-filling capacity” seems likely to trace to long-term dispersal limitation and the existence of biogeographical barriers or disjunctions between occupied vs. suitable-but-unoccupied regions. Our results for a set of four endemic forest herbs from the Southern Appalachian Mountains (SAM) of the eastern U.S. indicate that this dynamic may explain the restricted distributions of some endemic species, and could be important for gauging these species’ capacities to respond to modern climate change.
Past work showed that the majority of narrow-ranged forest herbs overlap the SAM biodiversity hotspot in distribution (Bellemare and Moeller, 2014). However, it has been unclear as to whether that concentration of diversity reflects dispersal limitation following the last glacial maximum vs. specialization to the Southern Appalachian climate. Species distribution models (SDMs) revealed areas of high predicted habitat suitability up to 1140 km north of the endemic species’ current ranges in the SAM. For example, with the endemics P. fimbriata and D. cymosa, large areas of currently suitable habitat were predicted in northern areas that are disjunct from their restricted native ranges in the southeastern United States. The largest area of predicted suitable habitat for both species, and the closest to the SAM, occurred in the Allegheny Mountains of West Virginia (WV). This region was also identified as the most suitable region for the endemic T. vaseyi outside of its native range; however, the predicted level of suitability was lower. In addition, all three of these endemics had areas projected to be suitable in southern New England. For most SA non-endemic models, the Allegheny Mountains were also predicted to be suitable (with 60–100% suitability), indicating agreement among model predictions for a variety of Southern Appalachian Mountain forest herbs. The Allegheny Mountains region receives similar amounts of both annual precipitation and precipitation in the driest month as the SAM and hosts a high diversity of forest plant species, constituting a northern extension of a biodiversity hotspot for temperate forest herbs (Bellemare and Moeller, 2014). Overall, our models identify this region as most climatically similar to the Southern Appalachians and suggest that it might currently allow for the persistence of the endemics if colonized naturally or via “assisted migration.”
Barriers to Northward Migration From the Southern Appalachian Mountains Hotspot
All eight of our SA models (both endemic and non-endemic) predicted highly unsuitable habitat in southwest VA, spanning across the east-west extent of the Appalachians Mountains (ca. 140 km wide from south-to-north). This gap lies just north of the SAM biodiversity hotspot, and just south of the Allegheny Mountains of WV. Without this distinct gap, suitable territory would be continuous along the north-south axis of the Appalachian Mountains for most species investigated. Therefore, this gap could have functioned as a significant barrier to dispersal, preventing northward migration of the endemics following the Pleistocene.
If this gap was important in limiting postglacial migration of the endemic plants investigated, what might explain the presence of ecologically similar non-endemics on both sides of this gap? Recent studies suggest at least two non-exclusive hypotheses for the wide disparity in ranges seen among temperate deciduous forest species. First, non-endemics may differ from endemics in their dispersal capacity, which may have enabled long-distance dispersal for some species across the lower-elevation gap inferred from our models. Based on our current knowledge and small sample size, there is no obvious relationship between dispersal mode and range size (endemics vs. non-endemics) in our pool of species (e.g., the endemic D. cymosa produces fleshy fruits seemingly attractive to birds). Second, the non-endemics might have persisted through the Last Glacial Maximum in northern microrefugia, rather than retreating exclusively to the SAM. Phylogeographic studies have suggested that a variety of taxa may have had northern refugia, closer to the LGM, that allowed for rapid recolonization of northern areas and formerly glaciated regions (McLachlan et al., 2005; Beatty and Provan, 2011; Li et al., 2013). Projections of our models for the LGM suggested that endemic species had highly suitable habitat only south of the Virginia gap; whereas, projections for one of the wider-ranged, non-endemic species (M. canadense) suggested that populations could have potentially persisted to the north of the gap (Supplementary Figure 6.1). Overall, widespread plants of this biome may have expanded their ranges following the last glacial maximum from multiple refugia. It is therefore possible that the endemic species’ ranges may have simply contracted more severely during the late Pleistocene and become isolated and stranded on mountains south of the VA gap.
Predicting Poleward Range Expansion
We constructed SDMs for a set of more widespread forest herbs using (1) occurrences from across the full range (FR models) and (2) occurrences only in the Southern Appalachians (SA models). Specifically, we asked whether SA models (having a Wallacean shortfall) successfully predicted known occurrences to the north and the extent to which they differed from the FR models (i.e., to what extent do FR models exhibit a Hutchinsonian shortfall). Overall, predictive performance was fair to moderate when we tested whether SA models predicted occurrences to the north of the SAM. These results suggest that Hutchinsonian shortfalls likely compromised predictive capacity beyond the range. Such Hutchinsonian shortfalls are evident from the niche overlap analyses, which showed that SAM occurrences reflected a subset of the overall climate niche of each species. This discrepancy was more pronounced for T. undulatum and M. canadense. Nevertheless, for those two species, we found similar predictions of the geographic extent of suitable habitat outside of the SAM from the FR and SA models. Overall, our niche analyses and SDMs suggest that projections of suitable habitat to the north of current ranges can be challenging because the range where models were trained includes only a subset of environmental variation to the north. Although our models may not identify all of the potentially suitable areas beyond the range, they do predict a fraction of them, and those areas could be targeted for conservation efforts like assisted migration.
Climate Change and Implications for Conservation
Species with low dispersal and poor range-filling capacity may be especially threatened by modern climate change because they are unlikely to migrate quickly enough to keep pace with changing climate (Thomas, 2011). In some cases, their realized and potential distributions might shift apart entirely, exposing them to high risk of extinction (Sax et al., 2013). In this context, many endemics might be particularly susceptible, as their distributions often reflect past marginalization by climate change (e.g., Pleistocene glaciations), and their current distributions are often restricted to unusual habitats (high elevations, north slopes) in southern areas that are surrounded by warmer, unsuitable habitat (Ohlemüller et al., 2008). Conservation of such endemics may require assisted migration (McLachlan et al., 2007). However, in the case of endemic forest herbs of the SAM, it has been unclear whether suitable habitat already exists outside their native ranges.
Our models based on current climates predicted suitable habitat north of the range margins of three endemics, suggesting that assisted migration could be successful currently and that single, larger-scale translocations might be feasible, rather than “many small steps” moving incrementally northward over decades. It is important to note that SDMs are correlative and may not be effective at predicting suitable habitats in future environments or beyond the range. Moreover, predictors in SDMs may not have a causal relationship to the distribution of suitable habitat even in the calibration range. Important predictors in models could be correlated with one or more variables that were eliminated. Nevertheless, we found that similar areas of potentially suitable habitat north of the SAM were identified for different species whose models were built with different environmental variables.
By the year 2070, the native ranges of the endemics were predicted to become almost completely unsuitable, with the exception of D. cymosa, whose range receded to the southern half of its current distribution. In the southern half of its range, there is projected to be a large decrease in the temperature of the driest quarter; this variable remains unchanged in the northern half of its range. Additionally, in the northern half of its range, temperature of the wettest quarter is projected to increase, and this variable remains unchanged in the southern half of its range. Outside of native ranges, only P. fimbriata retained predicted suitable habitat in the more northern areas where we projected our models (upstate NY, northern New England, and Canada). Notably, D. cymosa and S. galacifolia are known to survive, reproduce, and recruit new adults in parts of New England where they have been transplanted decades ago, making these patterns plausible (J. Bellemare, pers. obs.). For non-endemics, the FR models predicted strong declines in suitable habitat within the SAM for both T. undulatum and M. canadense, but more modest changes for P. lanuginosa and H. serpyllifolia. Although species’ responses are clearly individualistic, the underlying trend toward poleward movement of suitable habitat, and decline within current ranges, is generally consistent across species.
Species distribution models presume a close match between species’ current native distributions and their fundamental climate tolerances. However, it is possible that rapid evolution could alter species’ tolerances to novel climatic conditions in the future, allowing populations to persist in situ despite altered conditions. Rapid evolution in response to climate change, though well-documented in some plant species (Franks et al., 2007), appears insufficient to counter the rapid pace of modern climate change (Franks et al., 2018). Rapid evolution may be particularly unlikely for long-lived perennials with protracted generation times, like the forest plant endemics investigated in this study. Beyond rapid evolution, it is also conceivable that the fundamental niches of some plant species, especially small-ranged endemics, might already include tolerances for abiotic conditions beyond those inferred from their current native ranges (Sax et al., 2013). In the case of the endemics investigated here, our LGM projections suggest that they could have persisted near their present-day distributions in the SAM even during the colder climatic conditions of the Pleistocene (Supplementary Figure 6.1). This pattern is consistent with horticultural observations that narrow endemics of the SAM often survive and reproduce in gardens far to the north. However, this Pleistocene context might not suggest a similar likelihood for pre-existing tolerance to the significantly warmer conditions projected for the future given that they would be unprecedented in the recent geological past.
In the absence of rapid evolution or preexisting tolerances, poleward migration might be necessary for the long-term survival of the endemic species investigated here. However, natural dispersal to northern areas for endemic species may be particularly unlikely, given their apparent lack of substantial northward migration during the Holocene. Diffenbaugh and Field (2013) predicted that range shifts of several kilometers per year would be needed to shift in response to warming climate for species’ whose range limits are closely matched to current climate. The endemic species in our study would need to be able to disperse at least 2.7 km per decade in order to reach predicted suitable habitat in eastern WV by 2070, if dispersal was diffuse. However, it is important to note that for D. cymosa and P. fimbriata suitable habitat in WV disappeared by 2070. This area may be a crucial stepping-stone in northward migration, but its future unsuitability could further minimize the probability of natural northward range shifts. Given the severity of reductions in suitable habitat within the range and the disjunct nature of suitable habitat outside the range, assisted migration may be an important strategy for long-term conservation (Hoegh-Guldberg et al., 2008). An important next step in evaluating these SDMs is to confront predictions of habitat suitability with estimates of fitness and population growth from transplant experiments. Our efforts in that area are ongoing.
Data Availability Statement
The raw data supporting the conclusions of this article will be made available by the authors, without undue reservation.
Author Contributions
SKE collected field data, developed and evaluated models, and wrote an initial draft of the manuscript. JB assisted in providing field data and contributed to writing the manuscript. DAM assisted in project design, model development and evaluation, and contributed to writing the manuscript. All authors contributed to the article and approved the submitted version.
Funding
Funding was provided by awards from the University of Minnesota to SKE: (Anderson Grant, Crosby Award, and Dayton Bell Museum Fund) and to DAM (John Hall Memorial Fund). SKE was supported in part by a grant from the National Science Foundation to DAM (DEB-1255141).
Conflict of Interest
The authors declare that the research was conducted in the absence of any commercial or financial relationships that could be construed as a potential conflict of interest.
Publisher’s Note
All claims expressed in this article are solely those of the authors and do not necessarily represent those of their affiliated organizations, or those of the publisher, the editors and the reviewers. Any product that may be evaluated in this article, or claim that may be made by its manufacturer, is not guaranteed or endorsed by the publisher.
Acknowledgments
For assistance with obtaining locality information, we thank A Weakley, UNC Chapel Hill Herbarium, North Carolina Botanical Garden; Great Smoky Mountains National Park; K. Mathews, Director of Western Carolina University Herbarium; M. Brock, L. Estes, and D. Rodgers, Austin Peay State University Herbarium; EU Wofford, University of Tennessee Knoxville Herbarium, T. Wieboldt, Curator of Massey Herbarium, Virginia Tech; M. Ellis, NC Division of Parks and Recreation; Coweeta Hydrologic Laboratory, Southern Research Station. We also thank R. Briscoe Runquist and T. Lake for helpful discussions of species distribution models and B. Epstein for assistance with running analyses. Last, we thank the Minnesota Supercomputing Institute for providing computing resources.
Supplementary Material
The Supplementary Material for this article can be found online at: https://www.frontiersin.org/articles/10.3389/fevo.2021.751728/full#supplementary-material
Footnotes
References
Allouche, O., Tsoar, A., and Kadmon, R. (2006). Assessing the accuracy of species distribution models: prevalence, kappa and the true skill statistic (TSS). J. Appl. Ecol. 43, 1223–1232.
Beatty, G. E., and Provan, J. (2011). Phylogeographic analysis of North American populations of the parasitic herbaceous plant Monotropa hypopitys L. reveals a complex history of range expansion from multiple late glacial refugia. J. Biogeogr. 38, 1585–1599.
Bellard, C., Bertelsmeier, C., Leadley, P., Thuiller, W., and Courchamp, F. (2012). Impacts of climate change on the future of biodiversity. Ecol. Lett. 15, 365–377. doi: 10.1111/j.1461-0248.2011.01736.x
Bellemare, J., and Moeller, D. A. (2014). “Climate change and the herbaceous layer of temperate deciduous forests,” in The Herbaceous Layer in Forests of Eastern North America, 2nd Edn, ed. F. S. Gilliam (New York, NY: Oxford University Press), 460–480. doi: 10.1093/acprof:osobl/9780199837656.003.0021
Betancourt, J. L., Van Devender, T. R., and Martin, P. S. (1990). Packrat Middens: The Last 40,000 Years of Biotic Change. Tucson, AZ: University of Arizona Press.
Briscoe Runquist, R. D., Lake, T. A., and Moeller, D. A. (2021). Improving predictions of range expansion for invasive species using joint species distribution models and surrogate co-occurring species. J. Biogeogr. 48, 1693–1705.
Briscoe Runquist, R. D., Lake, T., Tiffin, P., and Moeller, D. A. (2019). Species distribution models predict late but not early stages of the invasion process for Palmer amaranth, a native invader and agricultural pest. Sci. Rep. 9:2426.
Broennimann, O., Fitzpatrick, M. C., Pearman, P. B., Petitpierre, B., Pellissier, L., Yoccoz, N. G., et al. (2012). Measuring ecological niche overlap from occurrence and spatial environmental data. Glob. Ecol. Biogeogr. 21, 481–497. doi: 10.1111/j.1466-8238.2011.00698.x
Chen, I. C., Hill, J. K., Ohlemüller, R., Roy, D. B., and Thomas, C. D. (2011). Rapid range shifts of species associated with high levels of climate warming. Science 333, 1024–1026. doi: 10.1126/science.1206432
Dainese, M., Aikio, S., Hulme, P. E., Bertolli, A., Prosser, F., and Marini, L. (2017). Human disturbance and upward expansion of plants in a warming climate. Nat. Clim. Change 7:577. doi: 10.1038/nclimate3337
Di Cola, V., Broennimann, O., Petitpierre, B., Breiner, F. T., d’Amen, M., Randin, C., et al. (2017). ecospat: an R package to support spatial analyses and modeling of species niches and distributions. Ecography 40, 774–787. doi: 10.1111/ecog.02671
Diffenbaugh, N. S., and Field, C. B. (2013). Changes in ecologically critical terrestrial climate conditions. Science 341, 486–492. doi: 10.1126/science.1237123
Dullinger, S., Gattringer, A., Thuiller, W., Moser, D., Zimmermann, N. E., Guisan, A., et al. (2012). Extinction debt of high-mountain plants under twenty-first-century climate change. Nat. Clim. Change 2, 619–622. doi: 10.1038/nclimate1514
Ehrlén, J., and Morris, W. F. (2015). Predicting changes in the distribution and abundance of species under environmental change. Ecol. Lett. 18, 303–314. doi: 10.1111/ele.12410
Elith, J., Graham, C. H., Anderson, R. P., Dudík, M., Ferrier, S., Guisan, A., et al. (2006). Novel methods improve prediction of species’ distributions from occurrence data. Ecography 29, 129–151.
Elith, J., Kearney, M., and Phillips, S. (2010). The art of modelling range-shifting species. Methods Ecol. Evol. 1, 330–342. doi: 10.1111/j.2041-210X.2010.00036.x
Elith, J., Leathwick, J. R., and Hastie, T. (2008). A working guide to boosted regression trees. J. Anim. Ecol. 77, 802–813. doi: 10.1111/j.1365-2656.2008.01390.x
ESRI (2016). ArcGIS Desktop: Release 10.5.1. Redlands, CA: Environmental Systems Research Institute.
Estill, J. C., and Cruzan, M. B. (2001). Phytogeography of rare plant species endemic to the Southeastern United States. Castanea 66, 3–23.
Franklin, J. (2010). Mapping Species Distribution: Spatial Inference and Prediction. Cambridge: Cambridge University Press, 320.
Franks, S. J., Hamann, E., and Weis, A. E. (2018). Using the resurrection approach to understand contemporary evolution in changing environments. Evol. Appl. 11, 17–28. doi: 10.1111/eva.12528
Franks, S. J., Sim, S., and Weis, A. E. (2007). Rapid evolution of flowering time by an annual plant in response to a climate fluctuation. Proc. Natl. Acad. Sci. U.S.A. 104, 1278–1282. doi: 10.1073/pnas.0608379104
Freeman, E. A., and Moisen, G. G. (2008). A comparison of the performance of threshold criteria for binary classification in terms of predicted prevalence and kappa. Ecol. Modelling 217, 48–58. doi: 10.1016/j.ecolmodel.2008.05.015
Gaston, K. J. (2003). The Structure and Dynamics of Geographic Ranges. Oxford: Oxford University Press.
Gleason, H. A., and Cronquist, A. (1991). Manual of Vascular Plants of Northeastern United States and Adjacent Canada, 2nd Edn. Bronx, NY: New York Botanical Garden.
Hijmans, R. J., and Graham, C. H. (2006). The ability of climate envelope models to predict the effect of climate change on species distributions. Glob. Change Biol. 12, 2272–2281. doi: 10.1111/j.1365-2486.2006.01256.x
Hijmans, R. J., Cameron, S. E., Parra, J. L., Jones, P. G., and Jarvis, A. (2005). Very high resolution interpolated climate surfaces for global land areas. Int. J. Climatol. 25, 1965–1978. doi: 10.3390/s20051316
Hijmans, R. J., Phillips, S., Leathwick, J., Elith, J., and Hijmans, M. R. J. (2017). Package ‘dismo’. Circles 9, 1–68.
Hoegh-Guldberg, O., Hughes, L., McIntyre, S., Lindenmayer, D. B., Parmesan, C., Possingham, H. P., et al. (2008). Assisted colonization and rapid climate change. Science 321, 345–346. doi: 10.1126/science.1157897
Jackson, S. T., and Overpeck, J. T. (2000). Responses of plant populations and communities to environmental changes of the late Quaternary. Paleobiology 26, 194–220. doi: 10.1017/s0094837300026932
Jansson, R. (2003). Global patterns in endemism explained by past climatic changes. Proc. R. Soc. B Biol. Sci. 270, 583–590. doi: 10.1098/rspb.2002.2283
Keith, D. A., AkÃğakaya, H. R., Thuiller, W., Midgley, G. F., Pearson, R. G., Phillips, S. J., et al. (2008). Predicting extinction risks under climate change: coupling stochastic population models with dynamic bioclimatic habitat models. Biol. Lett. 4, 560–563. doi: 10.1098/rsbl.2008.0049
Kelly, A. E., and Goulden, M. L. (2008). Rapid shifts in plant distribution with recent climate change. Proc. Natl. Acad. Sci. U.S.A. 105, 11823–11826. doi: 10.1073/pnas.0802891105
Lake, T. A., Briscoe Runquist, R. D., and Moeller, D. A. (2020). Predicting range expansion of invasive species: pitfalls and best practices for obtaining biologically realistic projections. Divers. Distrib. 26, 1767–1779. doi: 10.1111/ddi.13161
Li, P., Li, M., Shi, Y., Zhao, Y., Wan, Y., Fu, C., et al. (2013). Phylogeography of North American herbaceous Smilax (Smilacaceae): combined AFLP and cpDNA data support a northern refugium in the Driftless Area. Am. J. Bot. 100, 801–814. doi: 10.3732/ajb.1200250
Loarie, S. R., Duffy, P. B., Hamilton, H., Asner, G. P., Field, C. B., and Ackerly, D. D. (2009). The velocity of climate change. Nature 462, 1052–1055.
McLachlan, J. S., Clark, J. S., and Manos, P. S. (2005). Molecular indicators of tree migration capacity under rapid climate change. Ecology 86, 2088–2098. doi: 10.1890/04-1036
McLachlan, J. S., Hellmann, J. J., and Schwartz, M. W. (2007). A framework for debate of assisted migration in an era of climate change. Conserv. Biol. 21, 297–302. doi: 10.1111/j.1523-1739.2007.00676.x
McSweeney, C. F., and Jones, R. G. (2016). How representative is the spread of climate projections from the 6 CMIP5 GCMs used in ISI-MIP? Clim. Serv. 1, 24–29. doi: 10.1016/j.cliser.2016.02.001
Médail, F., and Diadema, K. (2009). Glacial refugia influence plant diversity patterns in the Mediterranean Basin. J. Biogeogr. 36, 1333–1345. doi: 10.1111/j.1365-2699.2008.02051.x
Ohlemüller, R., Anderson, B. J., Araújo, M. B., Butchart, S. H., Kudrna, O., Ridgely, R. S., et al. (2008). The coincidence of climatic and species rarity: high risk to small-range species from climate change. Biol. Lett. 4, 568–572. doi: 10.1098/rsbl.2008.0097
Petranka, J. (1998). Salamanders of the United States and Canada. Washington, DC: Smithsonian Institution Press, 587.
Phillips, S. J., and Dudiík, M. (2008). Modeling of species distributions with Maxent: new extensions and a comprehensive evaluation. Ecography 31, 161–175. doi: 10.1111/j.0906-7590.2008.5203.x
Phillips, S. J., Anderson, R. P., and Schapire, R. E. (2006). Maximum entropy modeling of species geographic distributions. Ecol. Modelling 190, 231–259. doi: 10.1016/j.ecolmodel.2005.03.026
Phillips, S. J., Anderson, R. P., Dudiìk, M., Schapire, R. E., and Blair, M. E. (2017a). Opening the black box: an open-source release of Maxent. Ecography 40, 887–893. doi: 10.1111/ecog.03049
Phillips, S. J., Dudík, M., and Schapire, R. E. (2004). “A maximum entropy approach to species distribution modeling,” in Proceedings of the Twenty-First International Conference on Machine Learning (New York, NY: AMC Press), 655–662.
Phillips, S. J., Dudiìk, M., and Schapire, R. E. (2017b). Maxent Software For Modeling Species Niches and Distributions (Version 3.4.1). Available online at: http://biodiversityinformatics.amnh.org/open_source/maxent/ (accessed Aug 30, 2017).
R Core Team (2017). R: A Language and Environment For Statistical Computing. Vienna: R Foundation for Statistical Computing.
Sandel, B., Arge, L., Dalsgaard, B., Davies, R. G., Gaston, K. J., Sutherland, W. J., et al. (2011). The influence of late Quaternary climate-change velocity on species endemism. Science 334, 660–664. doi: 10.1126/science.1210173
Sax, D. F., Early, R., and Bellemare, J. (2013). Niche syndromes, species extinction risks, and management under climate change. Trends Ecol. Evol. 28, 517–523. doi: 10.1016/j.tree.2013.05.010
Scherrer, D., and Körner, C. (2011). Topographically controlled thermal-habitat differentiation buffers alpine plant diversity against climate warming. J. Biogeogr. 38, 406–416. doi: 10.1111/j.1365-2699.2010.02407.x
Stein, B. A., Kutner, L. S., Hammerson, G. A., Master, L. L., and Morse, L. E. (2000). “State of the states: geographic patterns of diversity, rarity, and endemism,” in Precious Heritage: The Status of Biodiversity in the United States, eds B. A. Stein, L. S. Kutner, and J. S. Adams (New York, NY: Oxford University Press), 119–158.
Svenning, J. C., and Skov, F. (2004). Limited filling of the potential range in European tree species. Ecol. Lett. 7, 565–573. doi: 10.1111/j.1461-0248.2004.00614.x
Svenning, J. C., and Skov, F. (2005). The relative roles of environment and history as controls of tree species composition and richness in Europe. J. Biogeogr. 32, 1019–1033. doi: 10.1111/j.1365-2699.2005.01219.x
Svenning, J. C., and Skov, F. (2007). Could the tree diversity pattern in Europe be generated by postglacial dispersal limitation? Ecol. Lett. 10, 453–460. doi: 10.1111/j.1461-0248.2007.01038.x
Thomas, C. D. (2011). Translocation of species, climate change, and the end of trying to recreate past ecological communities. Trends Ecol. Evol. 26, 216–221. doi: 10.1016/j.tree.2011.02.006
Thomas, C. D., Cameron, A., Green, R. E., Bakkenes, M., Beaumont, L. J., Collingham, Y. C., et al. (2004). Extinction risk from climate change. Nature 427, 145–148. doi: 10.1038/nature02121
Van der Veken, S., Hermy, M., Vellend, M., Knapen, A., and Verheyen, K. (2008). Garden plants get a head start on climate change. Front. Ecol. Environ. 6:212–216. doi: 10.1890/070063
Wang, W. J., He, H. S., Thompson, F. R. III, Spetich, M. A., and Fraser, J. S. (2018). Effects of species biological traits & environmental heterogeneity on simulated tree species distribution shifts under climate change. Sci. Total Environ. 634, 1214–1221. doi: 10.1016/j.scitotenv.2018.03.353
Warren, D. L., and Seifert, S. N. (2011). Ecological niche modeling in Maxent: the importance of model complexity and the performance of model selection criteria. Ecol. Appl. 21, 335–342. doi: 10.1890/10-1171.1
Warszawski, L., Frieler, K., Huber, V., Piontek, F., Serdeczny, O., and Schewe, J. (2014). The inter-sectoral impact model intercomparison project (ISI-MIP): project framework. Proc. Natl. Acad. Sci. U.S.A. 111, 3228–3232. doi: 10.1073/pnas.1312330110
Webb, T. III (1986). Is vegetation in equilibrium with climate? How to interpret late-Quaternary pollen data. Vegetatio 67, 75–91. doi: 10.1007/bf00037359
Keywords: assisted migration, biogeographical barriers, dispersal limitation, endemic species, forest herbs, geographic range limits, range expansion, species distribution models
Citation: Erlandson SK, Bellemare J and Moeller DA (2021) Limited Range-Filling Among Endemic Forest Herbs of Eastern North America and Its Implications for Conservation With Climate Change. Front. Ecol. Evol. 9:751728. doi: 10.3389/fevo.2021.751728
Received: 01 August 2021; Accepted: 04 November 2021;
Published: 08 December 2021.
Edited by:
Amy L. Angert, University of British Columbia, CanadaReviewed by:
Daniel Scherrer, Swiss Federal Institute for Forest, Snow and Landscape Research (WSL), SwitzerlandSeyed Mahdi Kazemi, Islamic Azad University, Qom, Iran
Copyright © 2021 Erlandson, Bellemare and Moeller. This is an open-access article distributed under the terms of the Creative Commons Attribution License (CC BY). The use, distribution or reproduction in other forums is permitted, provided the original author(s) and the copyright owner(s) are credited and that the original publication in this journal is cited, in accordance with accepted academic practice. No use, distribution or reproduction is permitted which does not comply with these terms.
*Correspondence: David A. Moeller, bW9lbGxlckB1bW4uZWR1