 Nicol Rueda-M
 Fabian C. Salgado-Roa
 Carlos H. Gantiva-Q
 Carolina Pardo-Díaz
 Camilo Salazar
- 1Department of Biology, Faculty of Natural Sciences, Universidad del Rosario, Bogotá, Colombia
- 2School of BioSciences, University of Melbourne, Melbourne, VIC, Australia
- 3Instituto de Ciencias Naturales, Universidad Nacional de Colombia, Bogotá, Colombia
Studying how the environment shapes current biodiversity patterns in species rich regions is a fundamental issue in biogeography, ecology, and conservation. However, in the Neotropics, the study of the forces driving species distribution and richness, is mostly based on vertebrates and plants. In this study, we used 54,392 georeferenced records for 46 species and 1,012 georeferenced records for 38 interspecific hybrids of the Neotropical Heliconius butterflies to investigate the role of the environment in shaping their distribution and richness, as well as their geographic patterns of phylogenetic diversity and phylogenetic endemism. We also evaluated whether niche similarity promotes hybridization in Heliconius. We found that these insects display five general distribution patterns mostly explained by precipitation and isothermality, and to a lesser extent, by altitude. Interestingly, altitude plays a major role as a predictor of species richness and phylogenetic diversity, while precipitation explains patterns of phylogenetic endemism. We did not find evidence supporting the role of the environment in facilitating hybridization because hybridizing species do not necessarily share the same climatic niche despite some of them having largely overlapping geographic distributions. Overall, we confirmed that, as in other organisms, high annual temperature, a constant supply of water, and spatio-topographic complexity are the main predictors of diversity in Heliconius. However, future studies at large scale need to investigate the effect of microclimate variables and ecological interactions.
Introduction
Understanding how the environment shapes species distribution and affects patterns of biological diversity is still a challenging task, especially in species rich regions, such as the Neotropics (Hawkins et al., 2003; Gotelli et al., 2009; Brown et al., 2020). To date, information on this topic is mostly based on vertebrates and plants, and suggest that the combination of high annual temperature with a constant supply of water and spatio-topographic complexity are the main predictors of species distribution, richness, and endemism (Hawkins et al., 2003; Kreft and Jetz, 2007; Qian, 2010; Vasconcelos et al., 2019). Within the Neotropics, the Amazon and the foothills of the North-eastern Andes are examples of regions that combine these conditions, and consequently, they exhibit high levels of species richness and phylogenetic diversity in monkeys, snakes, birds, amphibians, palms, and vascular plants (Kreft and Jetz, 2007; Fenker et al., 2014; Vallejos-Garrido et al., 2017; Velazco et al., 2021). Similarly, regions such as the Biogeographic Choco, Costa Rica, and the Amazon show high levels of phylogenetic endemism (e.g., Rosauer and Jetz, 2014; López-Aguirre et al., 2019; Varzinczak et al., 2020). However, these patterns have not been deeply evaluated in Neotropical invertebrates, and particularly butterflies (Pearson and Carroll, 2001; Mullen et al., 2011).
The environment, and especially climatic niche, has also been suggested to have an effect on gene flow. For example, phylogenetic discordance in multiple loci in beetles of the genus Mesocarabus seems to be the result of hybridization between species sharing the same climatic niche (Andújar et al., 2014), while in armadillos of the genus Dasypus, asymmetric gene flow appears to be facilitated by niche conservatisms at both sides of a geographic barrier (Arteaga et al., 2011). Additionally, climatic-based selection likely plays a role in maintaining mosaic hybrid zones in Quercus oaks, where climatic heterogeneity favors the co-occurrence of parental species and their hybrids (Swenson et al., 2008; Ortego et al., 2014).
Heliconius butterflies are a diverse insect group found across southern United States, Central, and South America, where they occupy divergent habitats (Jiggins, 2017). Due to the recent radiation of this butterfly genus, species pairs have different levels of reproductive isolation, which are used as proxies for different stages of speciation (Kronforst et al., 2013; Martin et al., 2013). In total, ∼25% of Heliconius species are known to hybridize in nature (Mallet et al., 1998, 2007), but the role of abiotic variables in facilitating or hampering such hybridization has been poorly studied (Mallet et al., 1990; Rosser et al., 2014).
In this study, we combined an extensive database of occurrences of species and hybrids in Heliconius as well as environmental data to investigate: (1) how the environment shapes the distribution of Heliconius at a regional scale, (2) how the environment molds species richness, phylogenetic diversity, and phylogenetic endemism in these butterflies, and (3) whether niche similarity promotes hybridization.
Materials and Methods
Species Data and Environmental Variables
We included occurrence data of 46 species of Heliconius and generated a database of the localities where these butterflies have been collected across their entire distribution range. The data were obtained from: (1) entomological collections and (2) the Heliconiinae checklist of Rosser et al. (2012). For those regions in Colombia that we identified as under-sampled, we conducted field trips to improve our geographic coverage. The nomenclature of all records was updated to the most recent taxonomic checklist when needed (Lamas and Jiggins, 2017). We also included occurrence data for all interspecific hybrids documented in Heliconius. All individuals were photographed and identified based on their color pattern. We used the point-radius method to georeference specimens with missing coordinates following Wieczorek et al. (2004). Although Heliconius is widely represented in databases, such as global biodiversity information Facility (GBIF), we did not include such records to ensure the use of data that have been curated by specialists both in terms of georeference and taxonomy, or that have images of each specimen that would allow us to confirm the taxonomy.
We used the 19 climatological variables from climatologies at high resolution for the earth’s land surface areas (CHELSA) at spatial resolution of 1 km (Karger et al., 2017) to characterize climatic variation across the occurrence range of Heliconius, and altitude was obtained from Jarvis et al. (2008). Collinearity between variables was avoided by estimating the Pearson correlation coefficient among all 20 variables, and the absolute value of this correlation was used to create a dissimilarity matrix (1-correlation values). We used this matrix to perform a hierarchical clustering analysis with the hclust function in R (R Core Team, 2021). We then chose one variable per cluster that had a pairwise distance <0.5. Using the selected variables, we calculated the variance inflation factor (VIF) (Dormann et al., 2013) with the HH package in R (Heiberger, 2020) and chose those variables with VIF <5 (Kubota et al., 2015).
Species Distribution Modeling and Environmental Variables Importance
First, we used R pipelines (Assis, 2020) to reduce sampling bias and spatial autocorrelation among occurrences in our species distribution models using the variables that passed the filters mentioned before. The minimum non-significant autocorrelated distances were used to prune species databases. H. nattereri and H. tristero were not modeled because they had <32 occurrence records.
Then, we generated a second database that included pseudo-absences data following Phillips et al. (2009), Soberón and Nakamura (2009), Barbet-Massin et al. (2012), and Lake et al. (2020). Because Heliconius is a very well-sampled genus we had enough information to select pseudo-absences points for each species in places where: (i) Heliconius other than the focal species have been collected, (ii) environmental conditions may not be optimal for its occurrence, and (iii) absence is not caused by dispersal limitation. Using these criteria, we defined a minimum convex polygon with a 50 km buffer area for each species and selected 10,000 pseudo-absences only in this buffer.
Then, we estimated the ensemble species distribution models (ESDMs) of Heliconius with the R package stacked species distribution models (SSDM) (Schmitt et al., 2017), equally weighting presences and pseudo-absences (prevalence weights = 0.5). Individual species distribution models (SDM) were implemented using four algorithms that optimize the use of pseudo-absences in a similar way (Barbet-Massin et al., 2012): (1) Generalized Linear Models (GLMs) (McCullagh and Nelder, 1989), (2) Generalized Boosting Models (GBMs) (Friedman et al., 2000), (3) Maximum Entropy Models (MAXENT) (Phillips et al., 2006), and (4) Generalized additive model (GAM) (Hastie and Tibshirani, 1990). Each algorithm was run 10 times. In each run, models were calibrated using 75% of the occurrence data and their accuracy was evaluated with the remaining 25%; the “holdout” method was used to ensure independence between training and evaluation sets. The data set randomly changes between runs. An ensemble model (ESDM) was obtained for each species by averaging the best SDM outputs (highest Area Under the Curve—AUC—score), and the ensemble models were evaluated with the AUC score and the Cohen’s Kappa coefficient (k). Following Smith and Santos (2020), we did not model species with n < 32 or that occupy >70% of the background region (i.e., entire distribution range for the genus).
We used the relative importance values of the variables provided by SSDM to evaluate the influence of each of them within all models. The importance is estimated with a randomization process, where SSDM calculates the correlation between a prediction using all variables and a prediction where the independent variable being tested is randomly removed; this is repeated for each variable. The calculation of the relative importance is made by subtracting this correlation from one, therefore higher values are the best variables for the model (Schmitt et al., 2017).
Diversity Metrics: Species Richness, Diversity, Endemism Phylogenetic Maps, and Environmental Variables Importance
Species richness, phylogenetic diversity, and phylogenetic endemism were calculated by superimposing the distribution maps of all species using the R package phyloregion (Daru et al., 2020b). In order to avoid overestimation of the diversity metrics, we created alpha hulls with the R package rangeBuilder (Davis Rabosky et al., 2016) and following (Paz et al., 2021). Briefly, we used occurrence data available for all species (54,392 georeferenced records) that had more than 10 locality points, a dynamic selection of alpha for each species, and an alpha that varied in steps of 1 (Meyer et al., 2017). We next generated a community matrix using the alpha hulls of all species with the function polys2comm in the R package phyloregion (Daru et al., 2020b).
We used the community matrix to calculate species richness by summing all species present in each cell, and also, with this matrix and the best Maximum Likelihood tree estimated with 20 nuclear and 2 mitochondrial loci for Heliconius (Kozak et al., 2015), we estimated phylogenetic diversity and phylogenetic endemism (Faith, 1992; Rosauer et al., 2009), with the functions phylogenetic diversity (PD) and phylo_endemism of the R package phyloregion (Daru et al., 2020b). To investigate whether these metrics are scale dependent, we performed the above analyses at three consecutive grain sizes (5, 10, and 20 km). We performed a linear regression model using phylogenetic diversity as response variable and species richness as predictor variable to investigate their relationship and plotted the residuals to highlight areas where these metrics are different.
We also used four machine learning algorithms to generate correlative models and then we created an ensemble prediction of each diversity metric to identify the environmental variables that best explain them (Paz et al., 2021). The algorithms used were: Random Forests (Liaw and Wiener, 2002), Neural Network (Venables and Ripley, 2002), Support Vector Machines (Karatzoglou et al., 2004), and GLM (McCullagh and Nelder, 1989). The models were built with the R package caret 6.0-86 (Kuhn, 2008), and we used the varImp function to compute the weighted average of the contribution of each variable.
Evaluating the Environmental Effect in the Hybridization on Heliconius Butterflies
We estimated the Schoener’s niche equivalency test (D) and Warren’s niche background test (I) between pairs of hybridizing species to determine if they share environmental niches. We used the R package humboldt (Brown and Carnaval, 2019) and we followed the concept of environmental niche sensu (Phillips et al., 2006; Soberón and Nakamura, 2009), where the niche consists of the subset of conditions currently occupied and where environmental conditions at the occurrence localities constitute samples from the realized niche. The niche overlap metric Schoener’s D ranges between 0 and 1, meaning no overlap and complete overlap, respectively (Rödder and Engler, 2011). The environmental overlap was visualized with a principal component analysis (PCA). We tested the significance of this metric by comparing the realized niche overlap against a null distribution of 1,000 overlaps randomly generated from the reshuffled occurrence dataset and tested whether niche background and niche equivalency were different from those expected by chance at α = 0.05 (Brown and Carnaval, 2019). This was done using the entire distribution of the entities under comparison (niche overlap test = NOT) and using only the area where they overlap (niche divergence test = NDT) (Brown and Carnaval, 2019).
Results
Species Data, Species Distribution Modeling, and Environmental Variables Importance
We collected a total of 68,877 records for 46 species (n = 67,865), 37 cases interspecific hybrids (n = 164), and 34 cases of intraspecific hybrids (n = 848) in Heliconius (Supplementary Tables 1, 2).
From the species records we discarded 13,476 records as they could not be reliably georeferenced, thus leaving us with 54,392 records. For species modeling, these were further subject to pruning, which left a total of 13,671 records (Supplementary Table 3). There was considerable variation in the sampling effort across the phylogeny. For example, species of the erato and silvaniform clades are well-represented, whereas species from the aoede clade had the lowest number of records (Supplementary Figure 1). The variables retained and used to model species distributions and diversity metrics were: (i) minimum temperature of coldest month, (ii) altitude, (iii) precipitation of coldest quarter, (iv) isothermality, and (v) precipitation seasonality (Supplementary Figure 2). The maximum absolute pairwise correlation between minimum temperature of coldest month and precipitation of coldest quarter was 0.436. The four algorithms we implemented were accurate in predicting the distribution of species, but their combination (ensemble) was the most accurate (Supplementary Figure 3). In total, we generated 44 species distribution models for Heliconius species. These are deposited in ZENODO.1
We found that environmental variables are better predictors of the distribution of Heliconius compared to topography. For instance, current temperature (isothermality) explains the distribution of 14 species (Figures 1A,B) and precipitation explains the distribution of 24 species (Figures 1C,D). In contrast, altitude explains the distribution of only five species (Figure 1E). No single variable was correlated with the entire distribution of the genus (Figure 1F), but we observed some general patterns. For example, isothermality explained the distribution of widely distributed species and trans-Andean species (i.e., west of the Andes; Figures 1A,B). Also, precipitation of the coldest quarter explains the distribution of species that occur in the biogeographic Choco + Costa Rica while precipitation seasonality explains the distribution of cis-Andean species (i.e., east of the Andes) + the Pacific of Ecuador (Figures 1C,D). Altitude explains the distribution of species restricted to the eastern foothills of the Andes and highland Andean species (Figure 1E). Interestingly, we did not find a single variable that was better correlated with the distribution of H. charitonia (Supplementary Table 4).
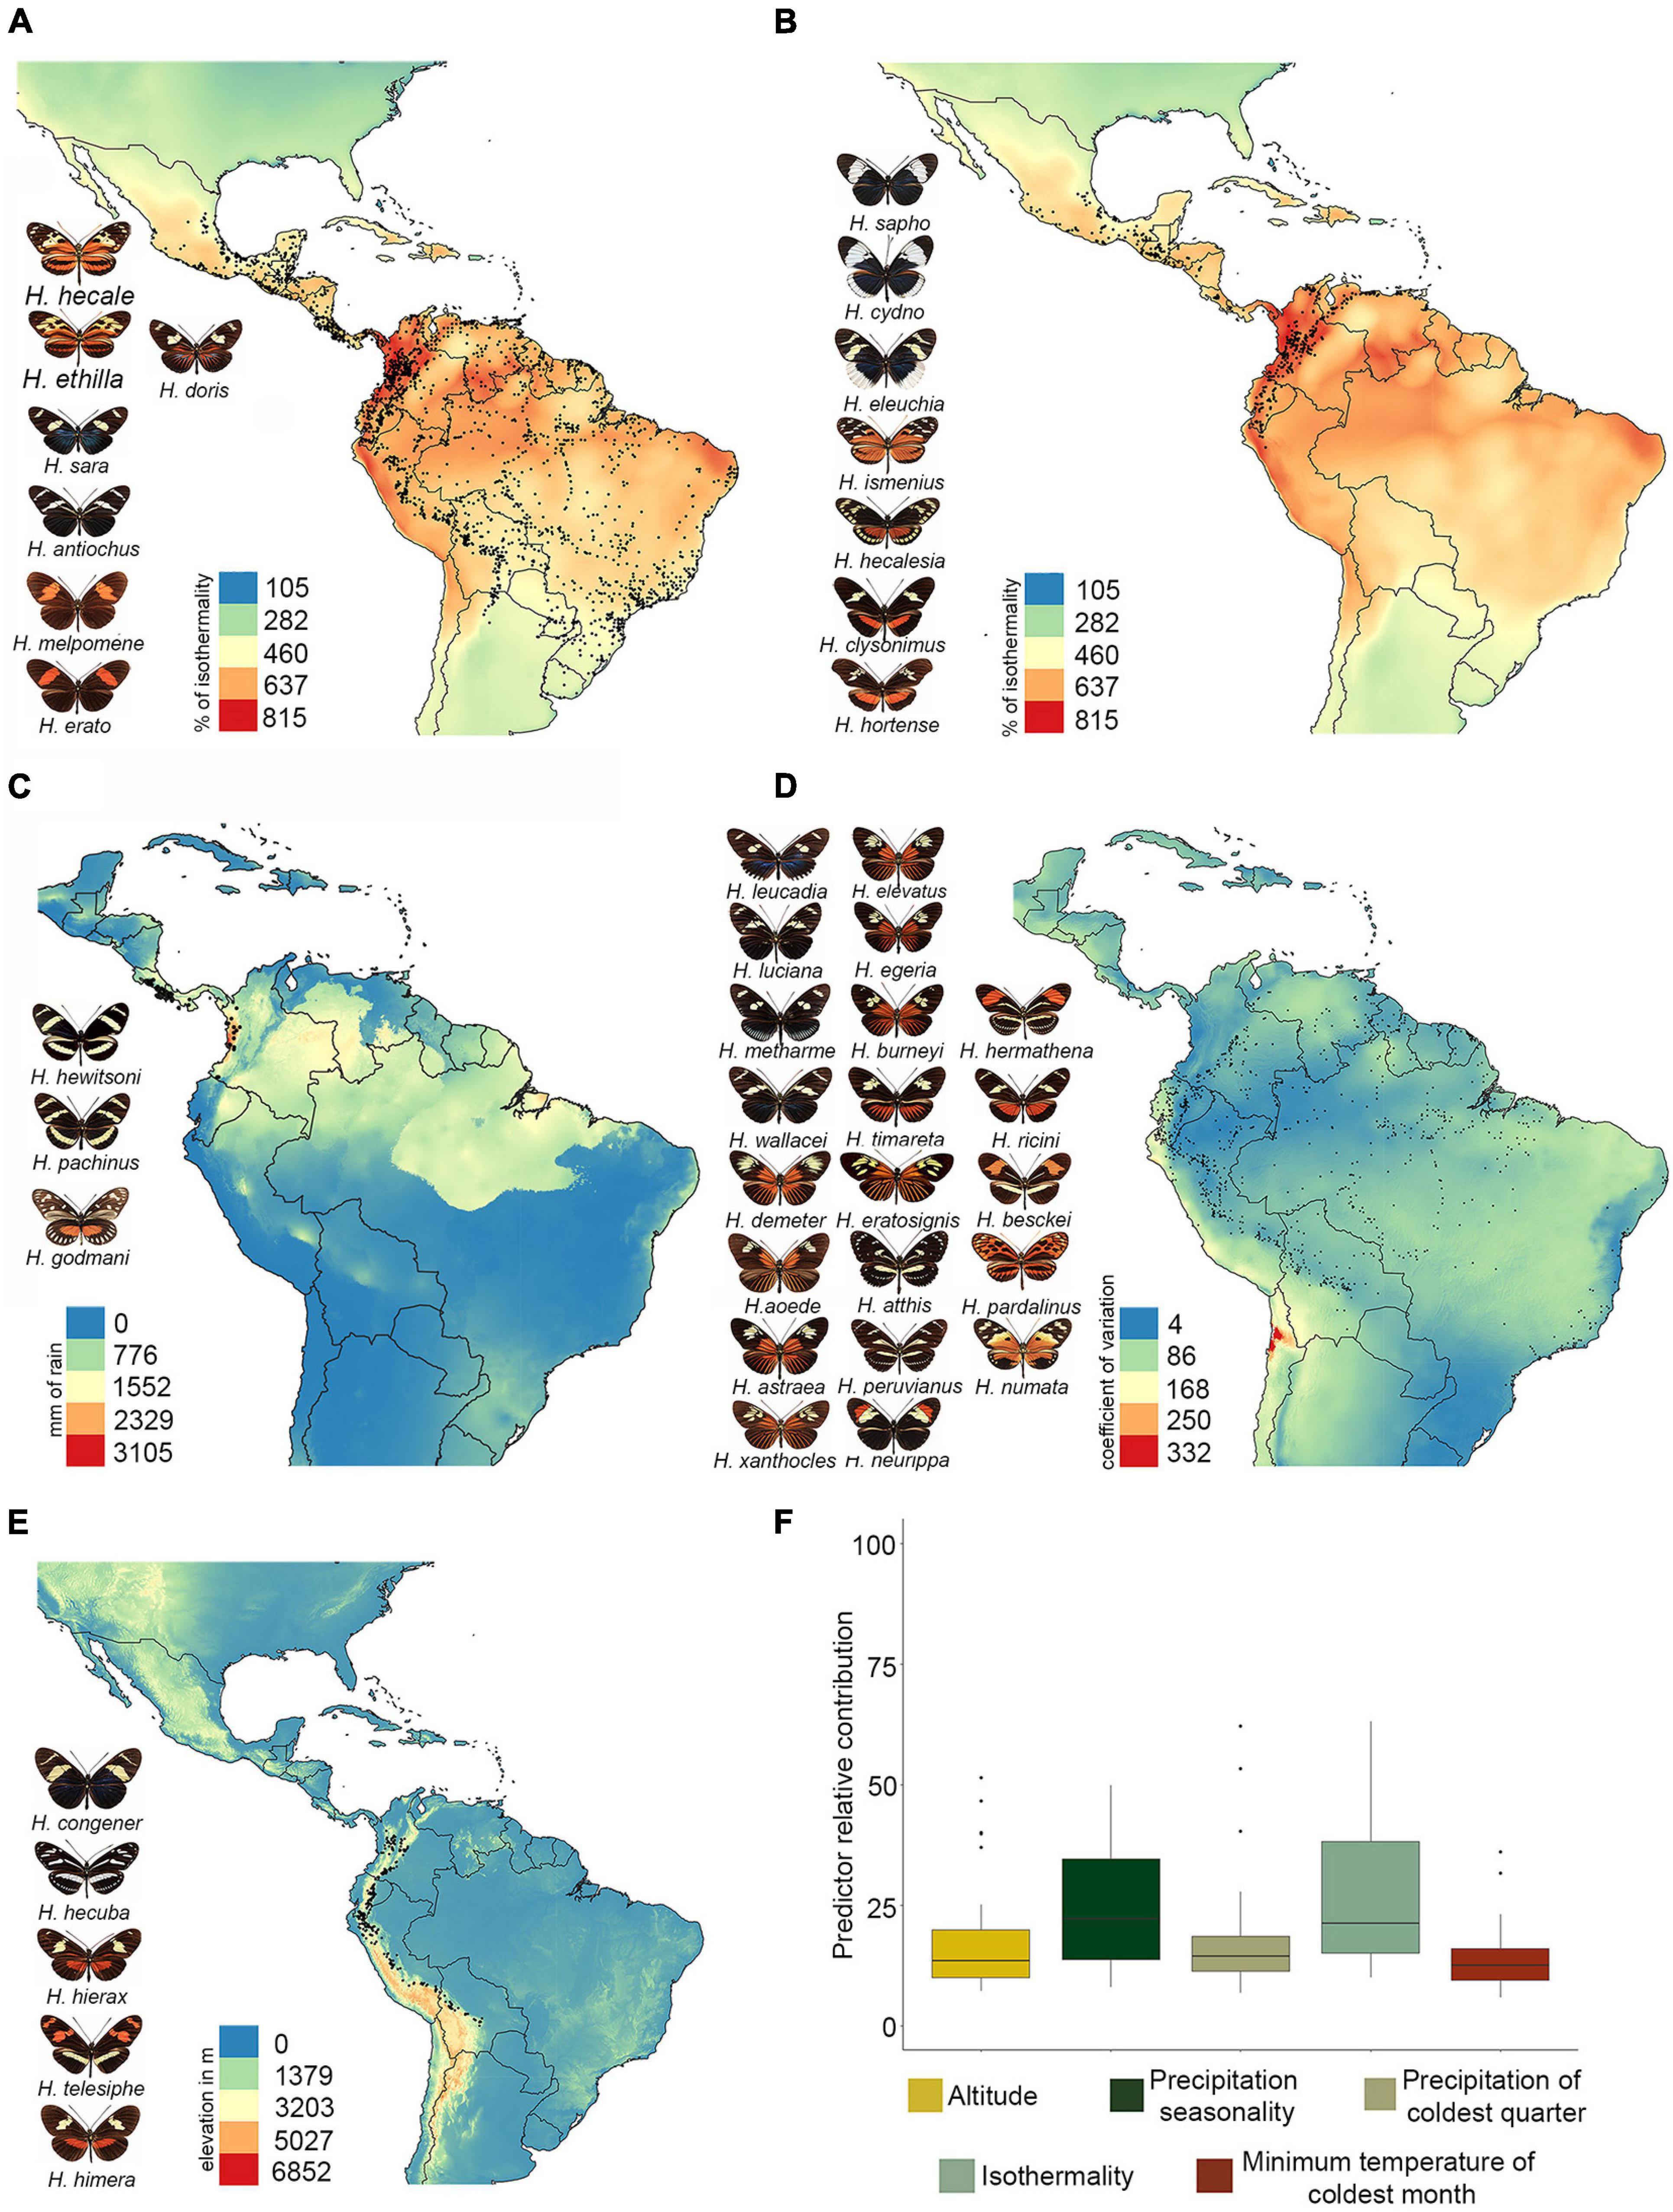
Figure 1. Distribution patterns of Heliconius species based on environmental variables. (A) Species with wide distribution (explained by isothermality); (B) species with trans-Andean distribution (explained by isothermality); (C) species distributed in the biogeographic Choco + Costa Rica (explained by precipitation of coldest quarter); (D) species distributed in the cis-Andes + Pacific of Ecuador (explained by precipitation seasonality); (E) species distributed in highlands of the Andes (explained by altitude); (F) relative importance of environmental variables receiver operating characteristic (ROC) that are predictors of diversity in Heliconius. Color scale in panels (A–E) indicates the variable gradient. Distribution maps for each of the species can be found at: https://doi.org/10.5281/zenodo.5149294.
Diversity Metrics: Species Richness, Diversity, Endemism Phylogenetic Maps, and Environmental Variables Importance
We found that higher values of Heliconius species richness are concentrated in the foothills of the eastern Andes from Colombia to Ecuador, and into the Amazon basin mainly along the course of the Amazon River (Figure 2A). These results were consistent but more striking in the phylogenetic diversity maps (Figure 2B). Also, species richness has a strong and significant effect on phylogenetic diversity (adjusted R2 0.9887, p ≤ 2e-16; Supplementary Figure 4). Interestingly, the residuals map showed values of phylogenetic diversity below those expected from species richness in the same regions, indicating that phylogenetic diversity, although high, is underestimated (blue grids; Figure 2C). In contrast, this metric was overestimated mainly in the Central Andes, the southern Amazon in Brazil, and the northern Chaco in Bolivia (red grids; Figure 2C). The highest values of phylogenetic endemism were concentrated in: (i) the Pacific coast of Costa Rica and Panama, (ii) the central foothills of the Eastern Cordillera in Colombia, and (iii) the biogeographic Choco of Colombia (Figure 2D). The pattern of these metrics was not scale dependent, and the results were highly congruent at 5, 10 (Supplementary Figures 5, 6, respectively), and 20 km (Figure 2C).
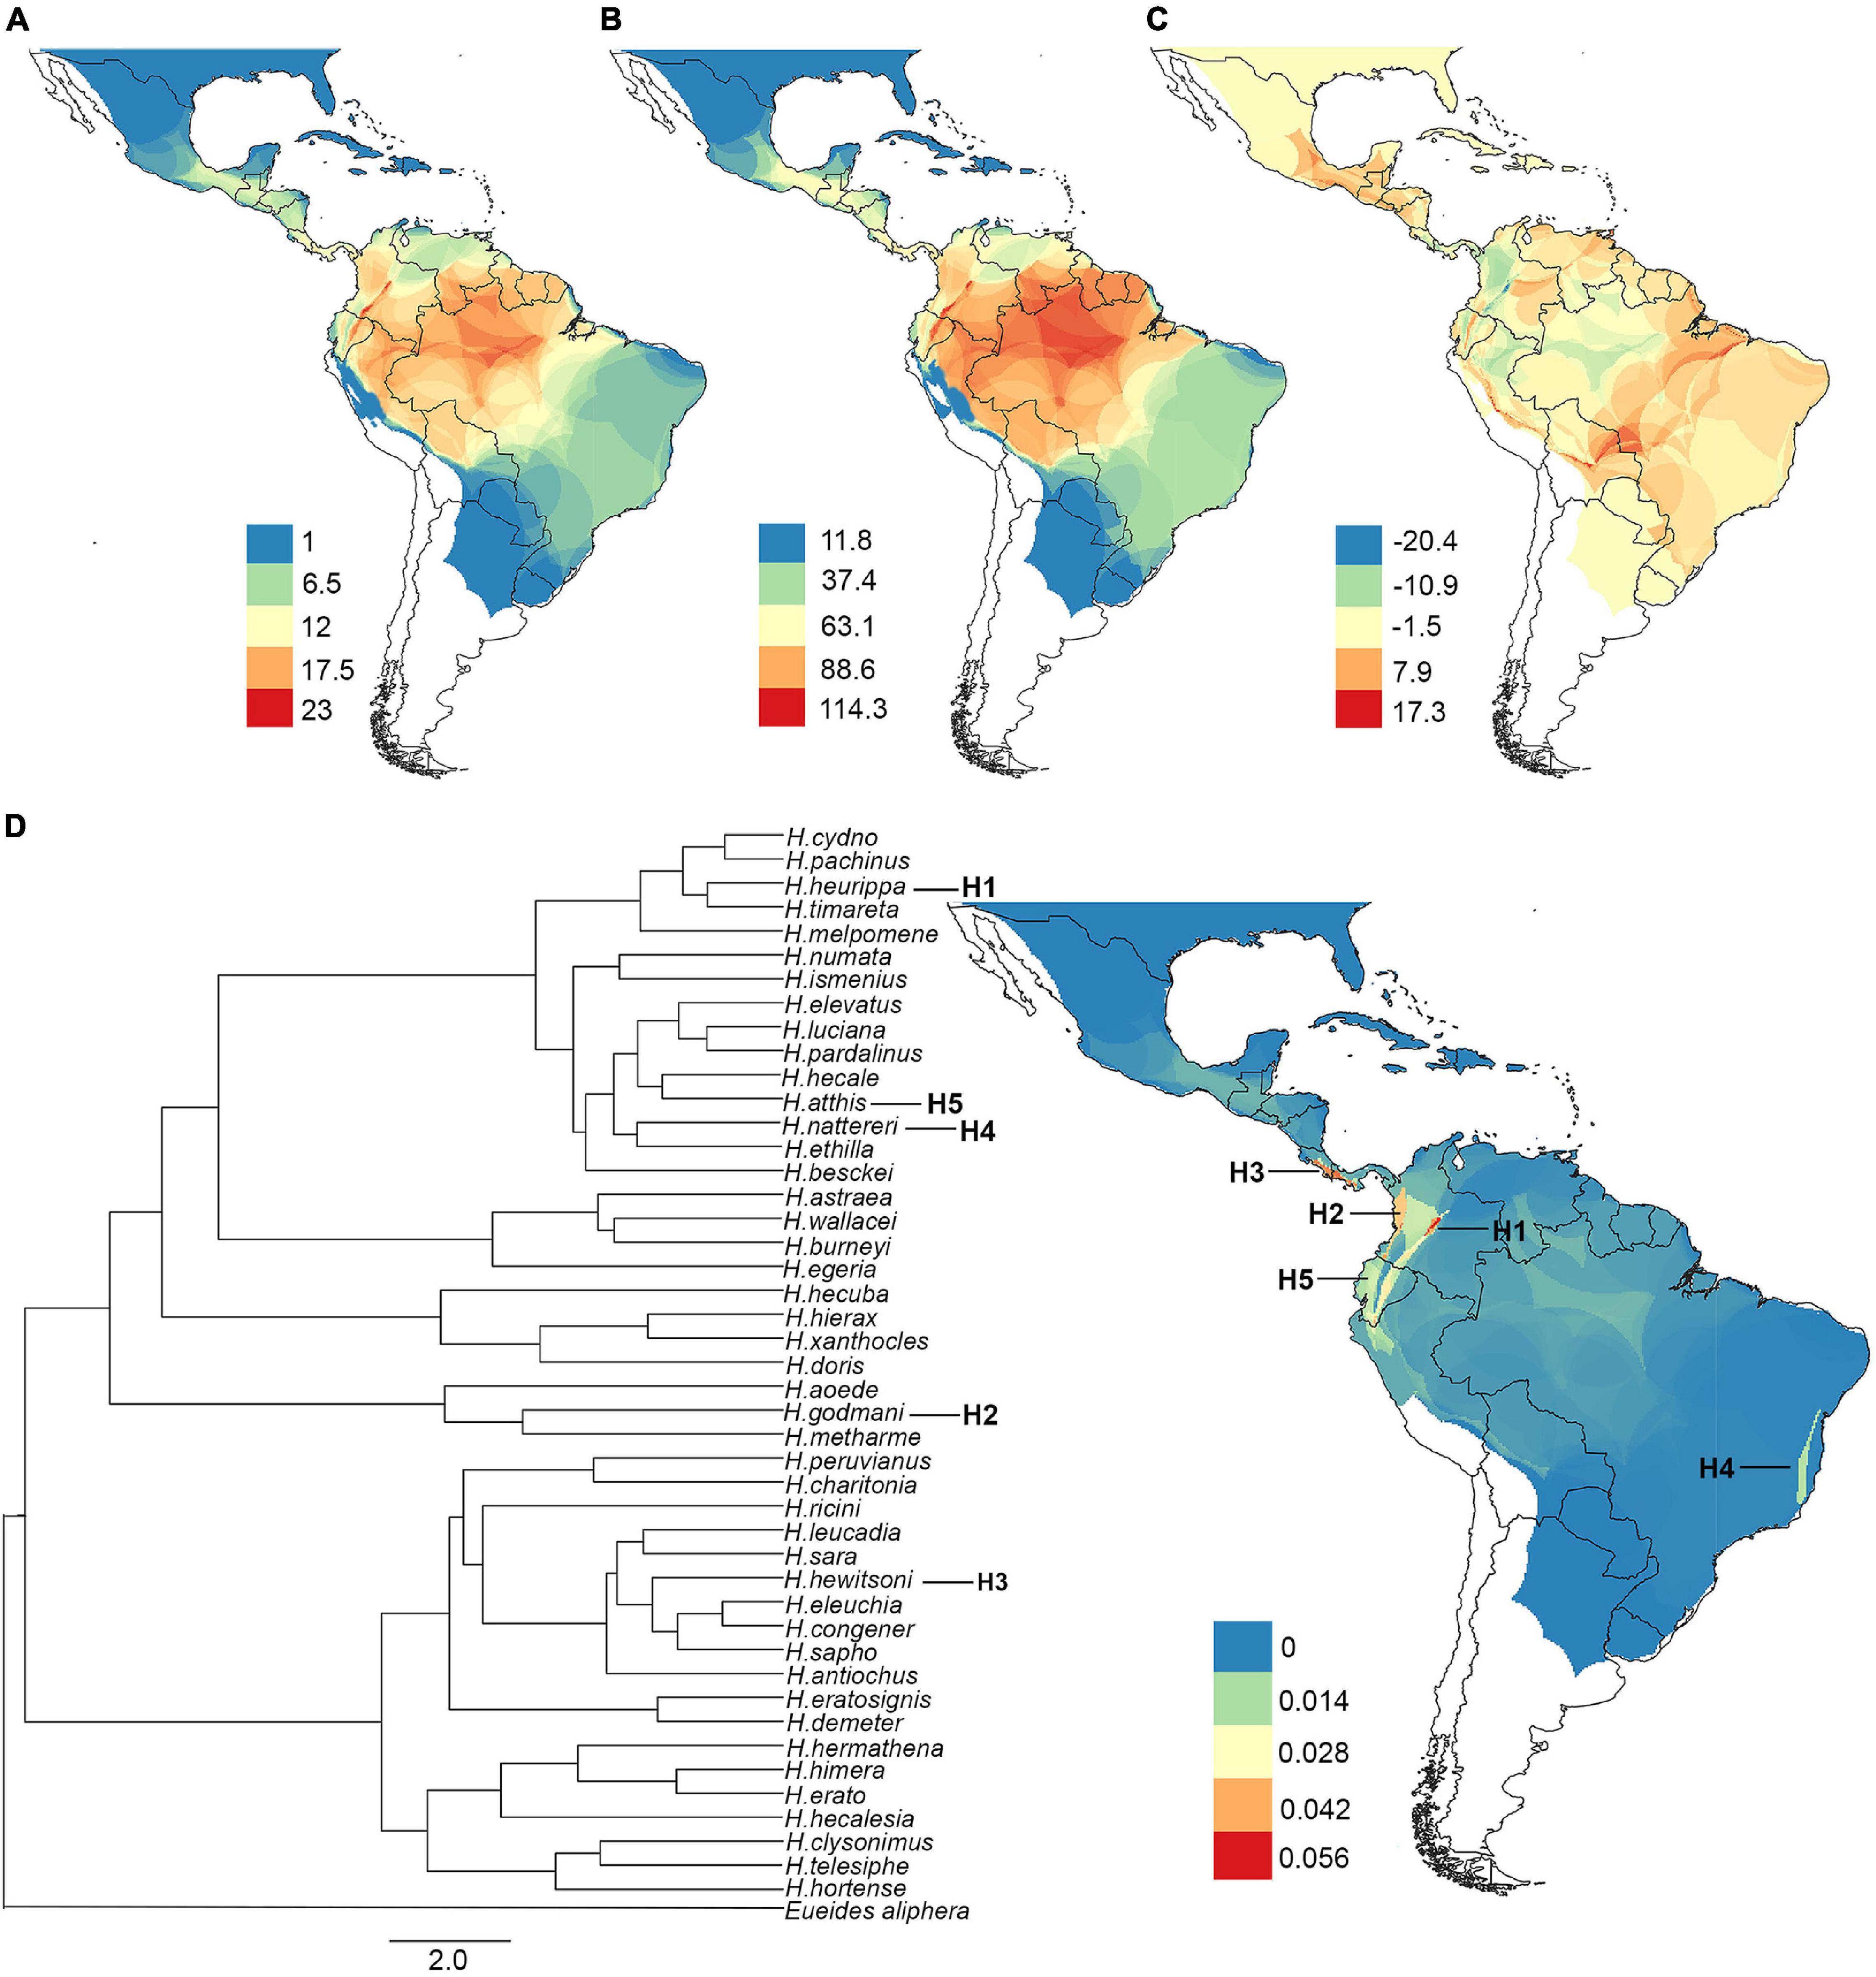
Figure 2. Maps of diversity metrics. (A) Species richness, (B) phylogenetic diversity, (C) residuals of phylogenetic diversity regressed on species richness, and (D) phylogenetic endemism. Warm colors indicate higher values, while cold colors are indicative of lower values. The phylogeny shown in panel (D) was modified from Kozak et al. (2015), and branches that contribute the most to the phylogenetic endemism are labeled as H1–H5, both in the phylogeny and the map. All maps were plotted in grid cells of 20 km × 20 km.
The ability of the machine learning models to predict species richness, phylogenetic diversity, and phylogenetic endemism varied between algorithms (Supplementary Figure 7). The best algorithms for all diversity metrics were the ensemble model followed by random forest, while the GLM algorithm had the lowest predictive accuracy in all metrics (Supplementary Figure 7). The best models predicted that altitude and isothermality were the most important variables for species richness and phylogenetic diversity (Figures 3A,B). In contrast, the most important variable for phylogenetic endemism was precipitation seasonality, followed by isothermality (Figure 3C). Finally, the residuals from the spatial regression between phylogenetic diversity (response variable) and species richness (predictor variable) were explained by isothermality (Figure 3D).
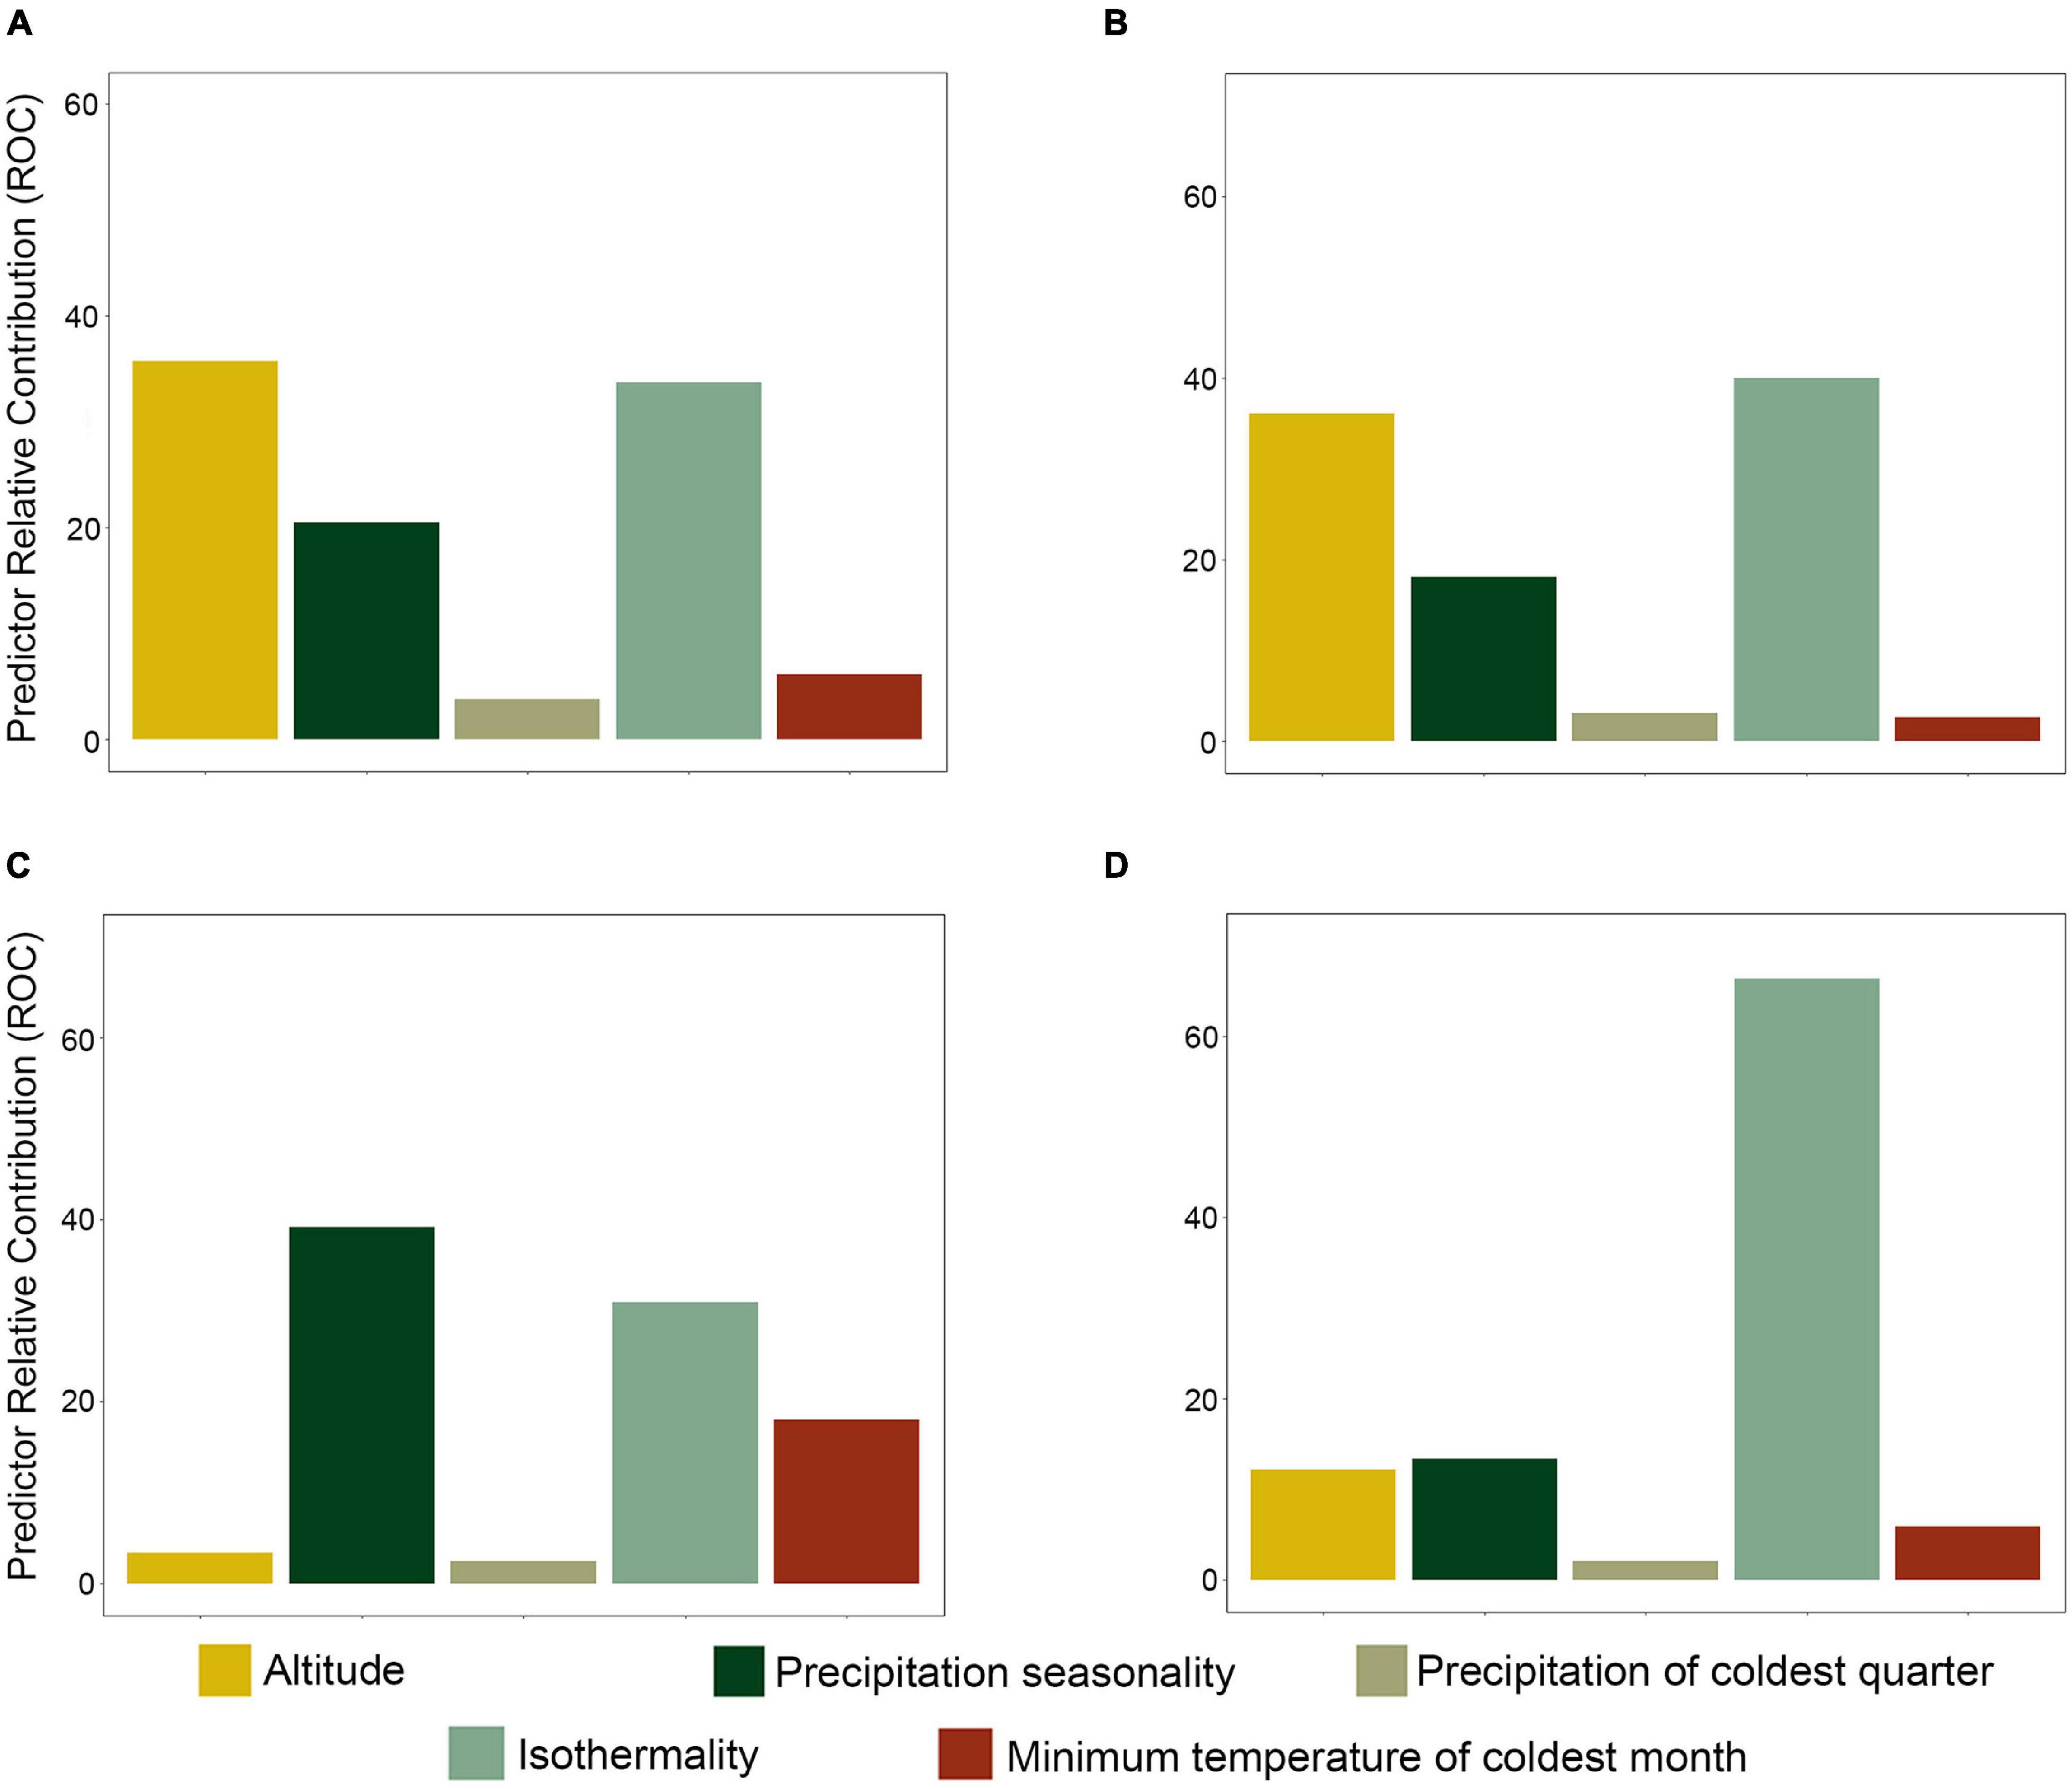
Figure 3. Relative importance of predictors (environmental variables) of diversity. (A) Species richness, (B) phylogenetic diversity, (C) phylogenetic endemism, and (D) residuals of the phylogenetic diversity/species richness regression.
Evaluating the Environmental Effect on Hybridization in Heliconius
We found 18 pairs of hybridizing species in Heliconius. The results of the NOT and NDT tests based on Schoener’s D revealed that the niches of three of these pairs (H. melpomene/H. cydno, H. melpomene/H. hecale, and H. hecalesia/H. hortense) are equivalent (Figure 4 and Table 1) and overlap climatically (D > 0.40). In contrast, 12 of these pairs did not show evidence of niche equivalency. These included both pairs that have extensive geographic overlap (such as H. ethilla and H. numata) (Supplementary Figure 8) and pairs with a narrow overlap (such as H. erato and H. himera) (Figure 5). The remaining three pairs (H. beskei/H. ethila, H. timareta/H. melpomene, and H. charitonia/H. peruvianus) showed inconclusive results (Figure 4 and Table 1). The results of these analyses were deposited in ZENODO (see text footnote 1).
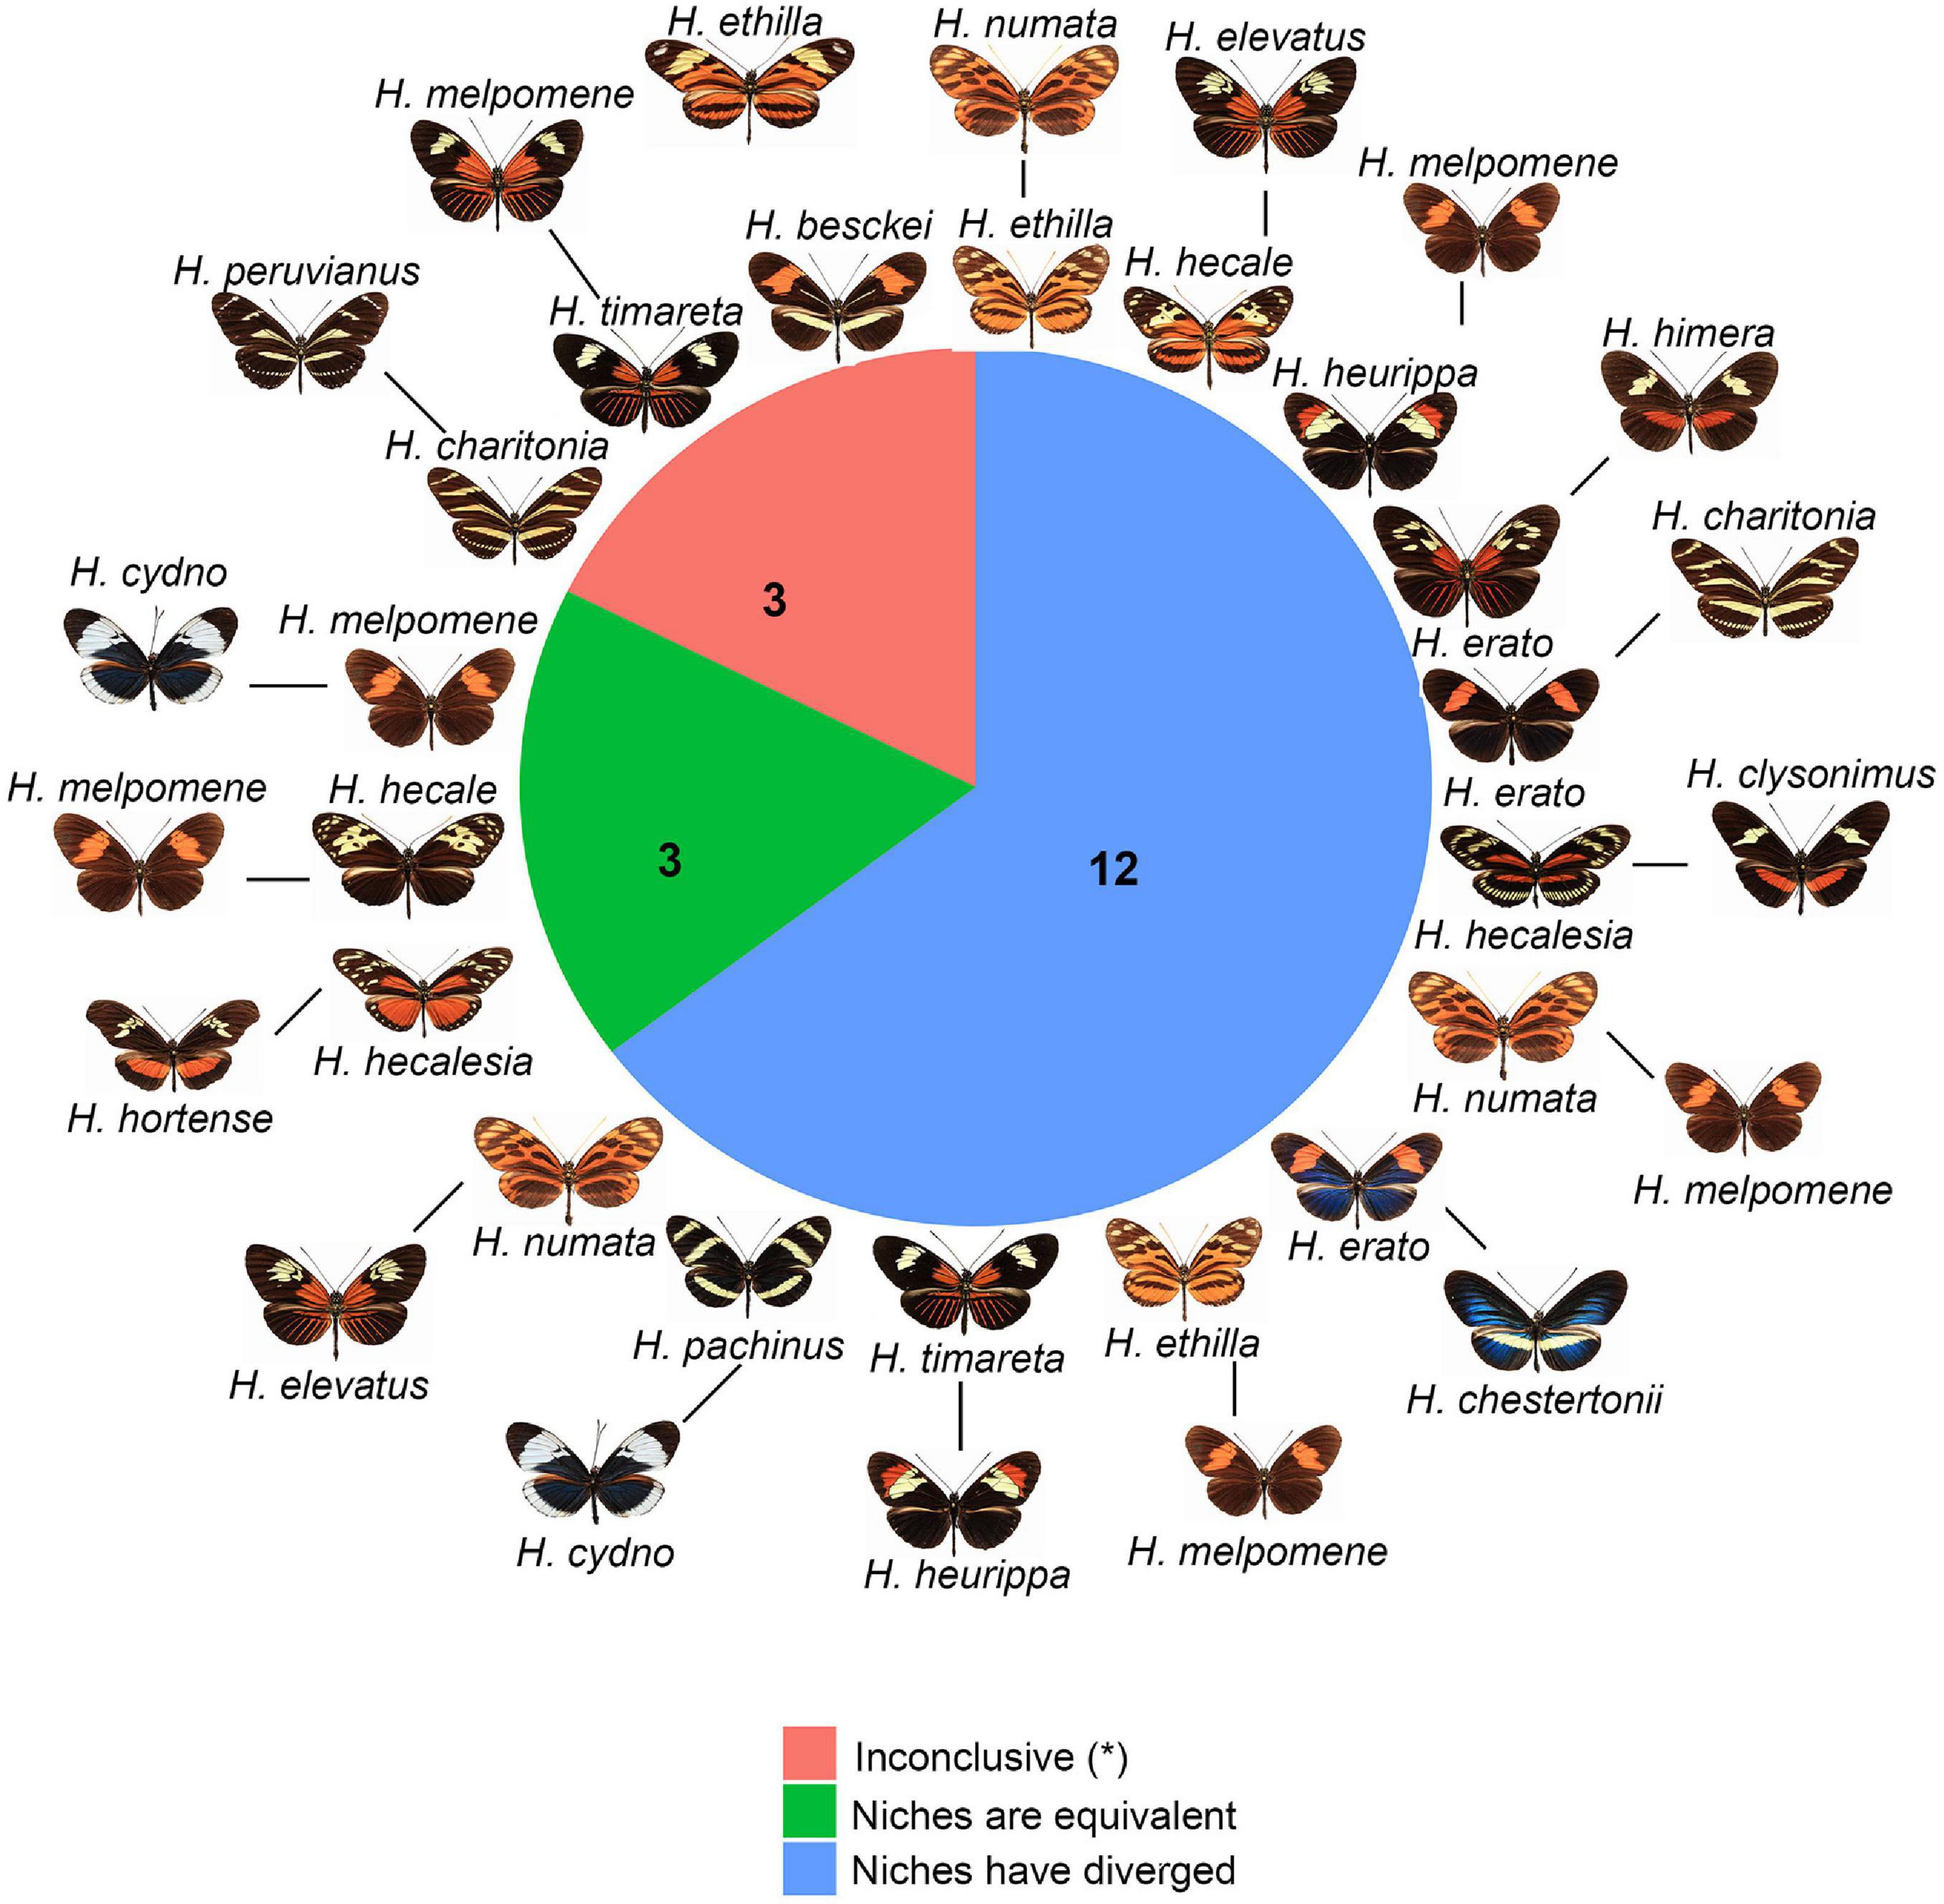
Figure 4. Co-occurring and hybridizing species of Heliconius. Green: species pairs with equivalent environmental niches, blue: species pairs with divergent environmental niches, and salmon: species pairs with inconclusive results. Numbers indicate the pairs of species falling into each category.
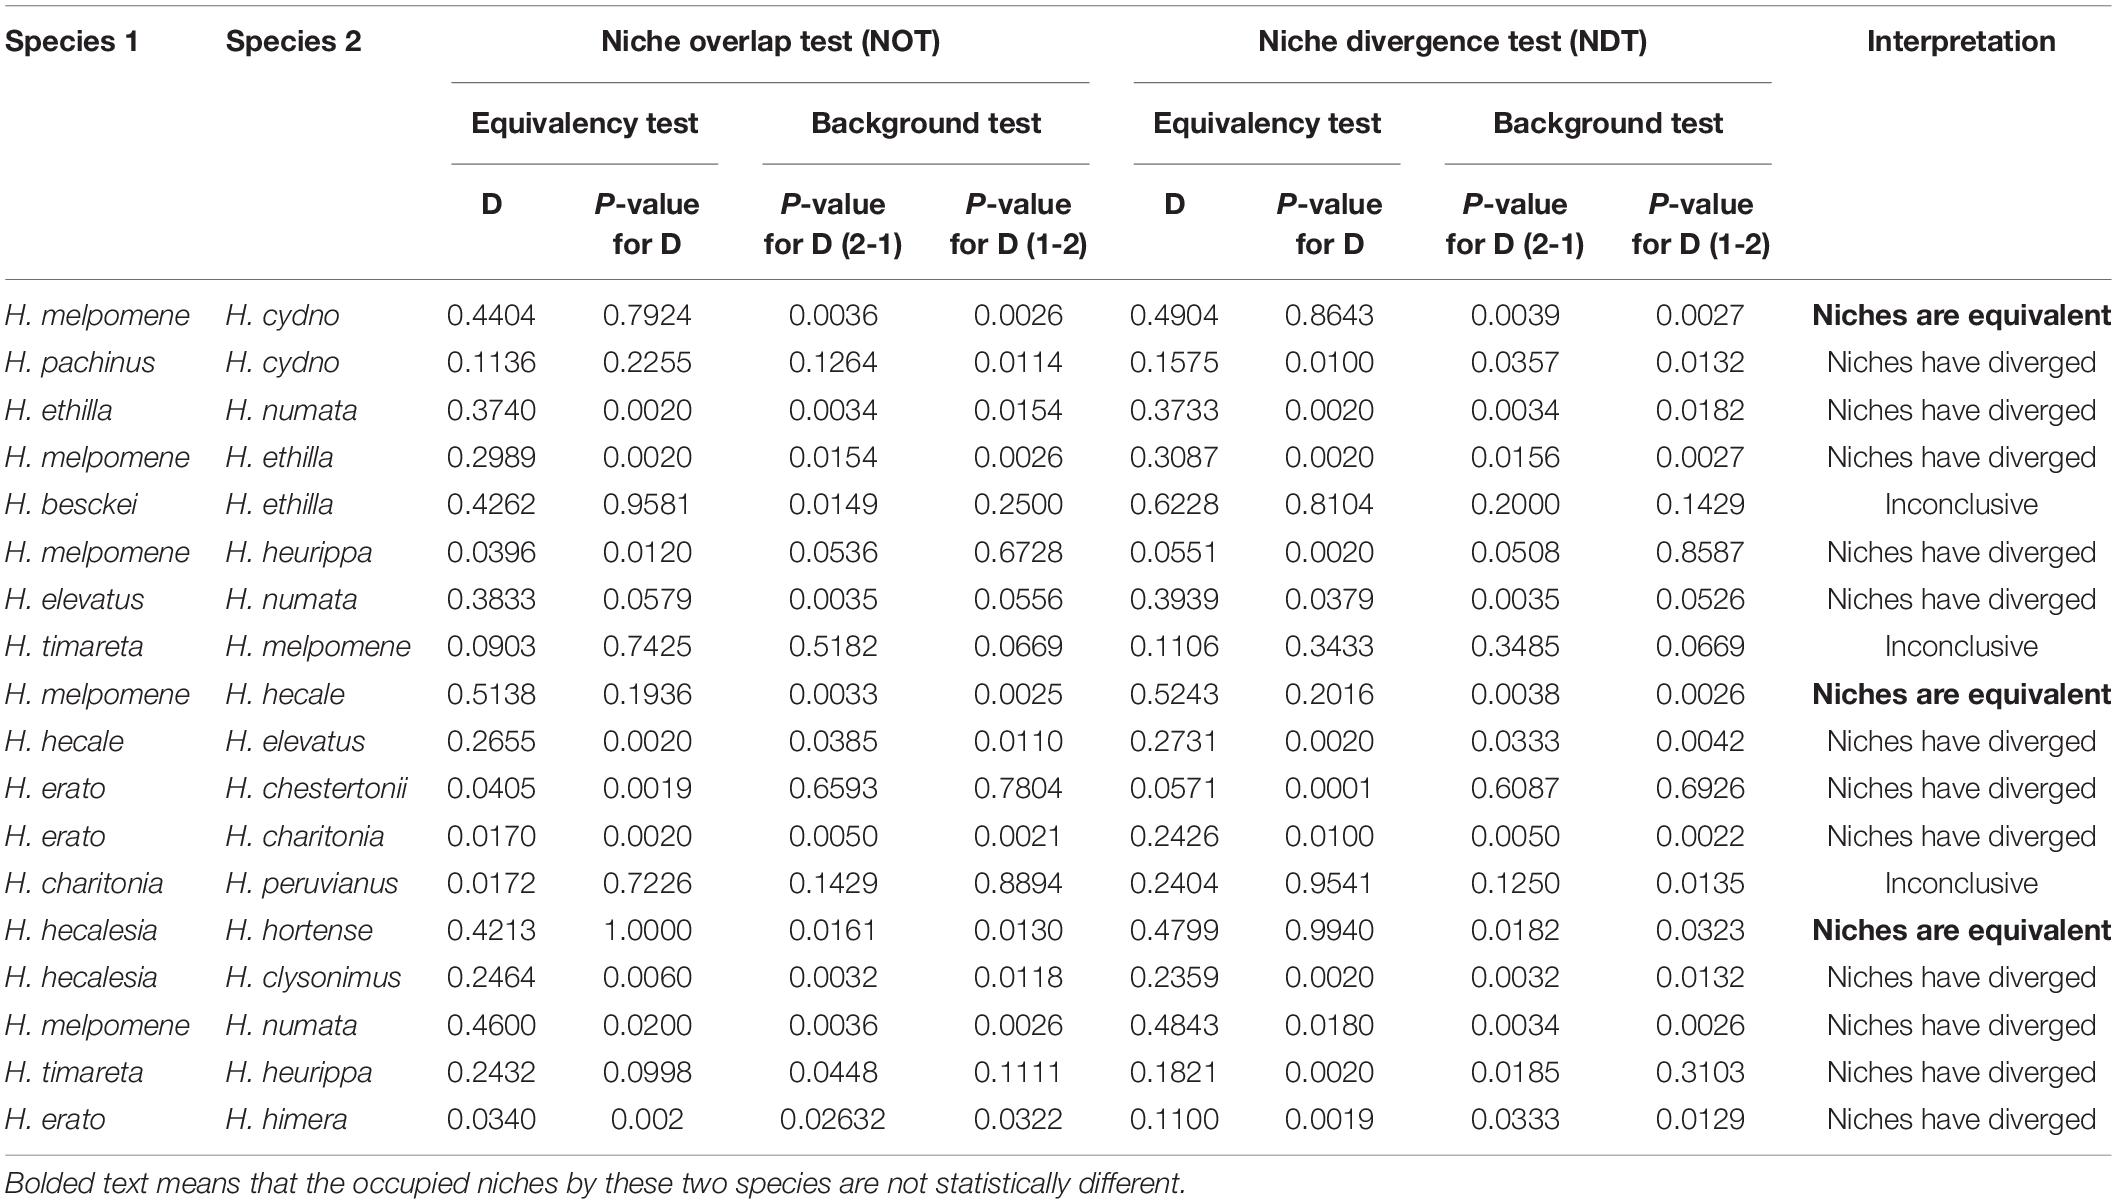
Table 1. Niche overlap test (NOT) and niche divergence test (NDT) between hybridizing species.
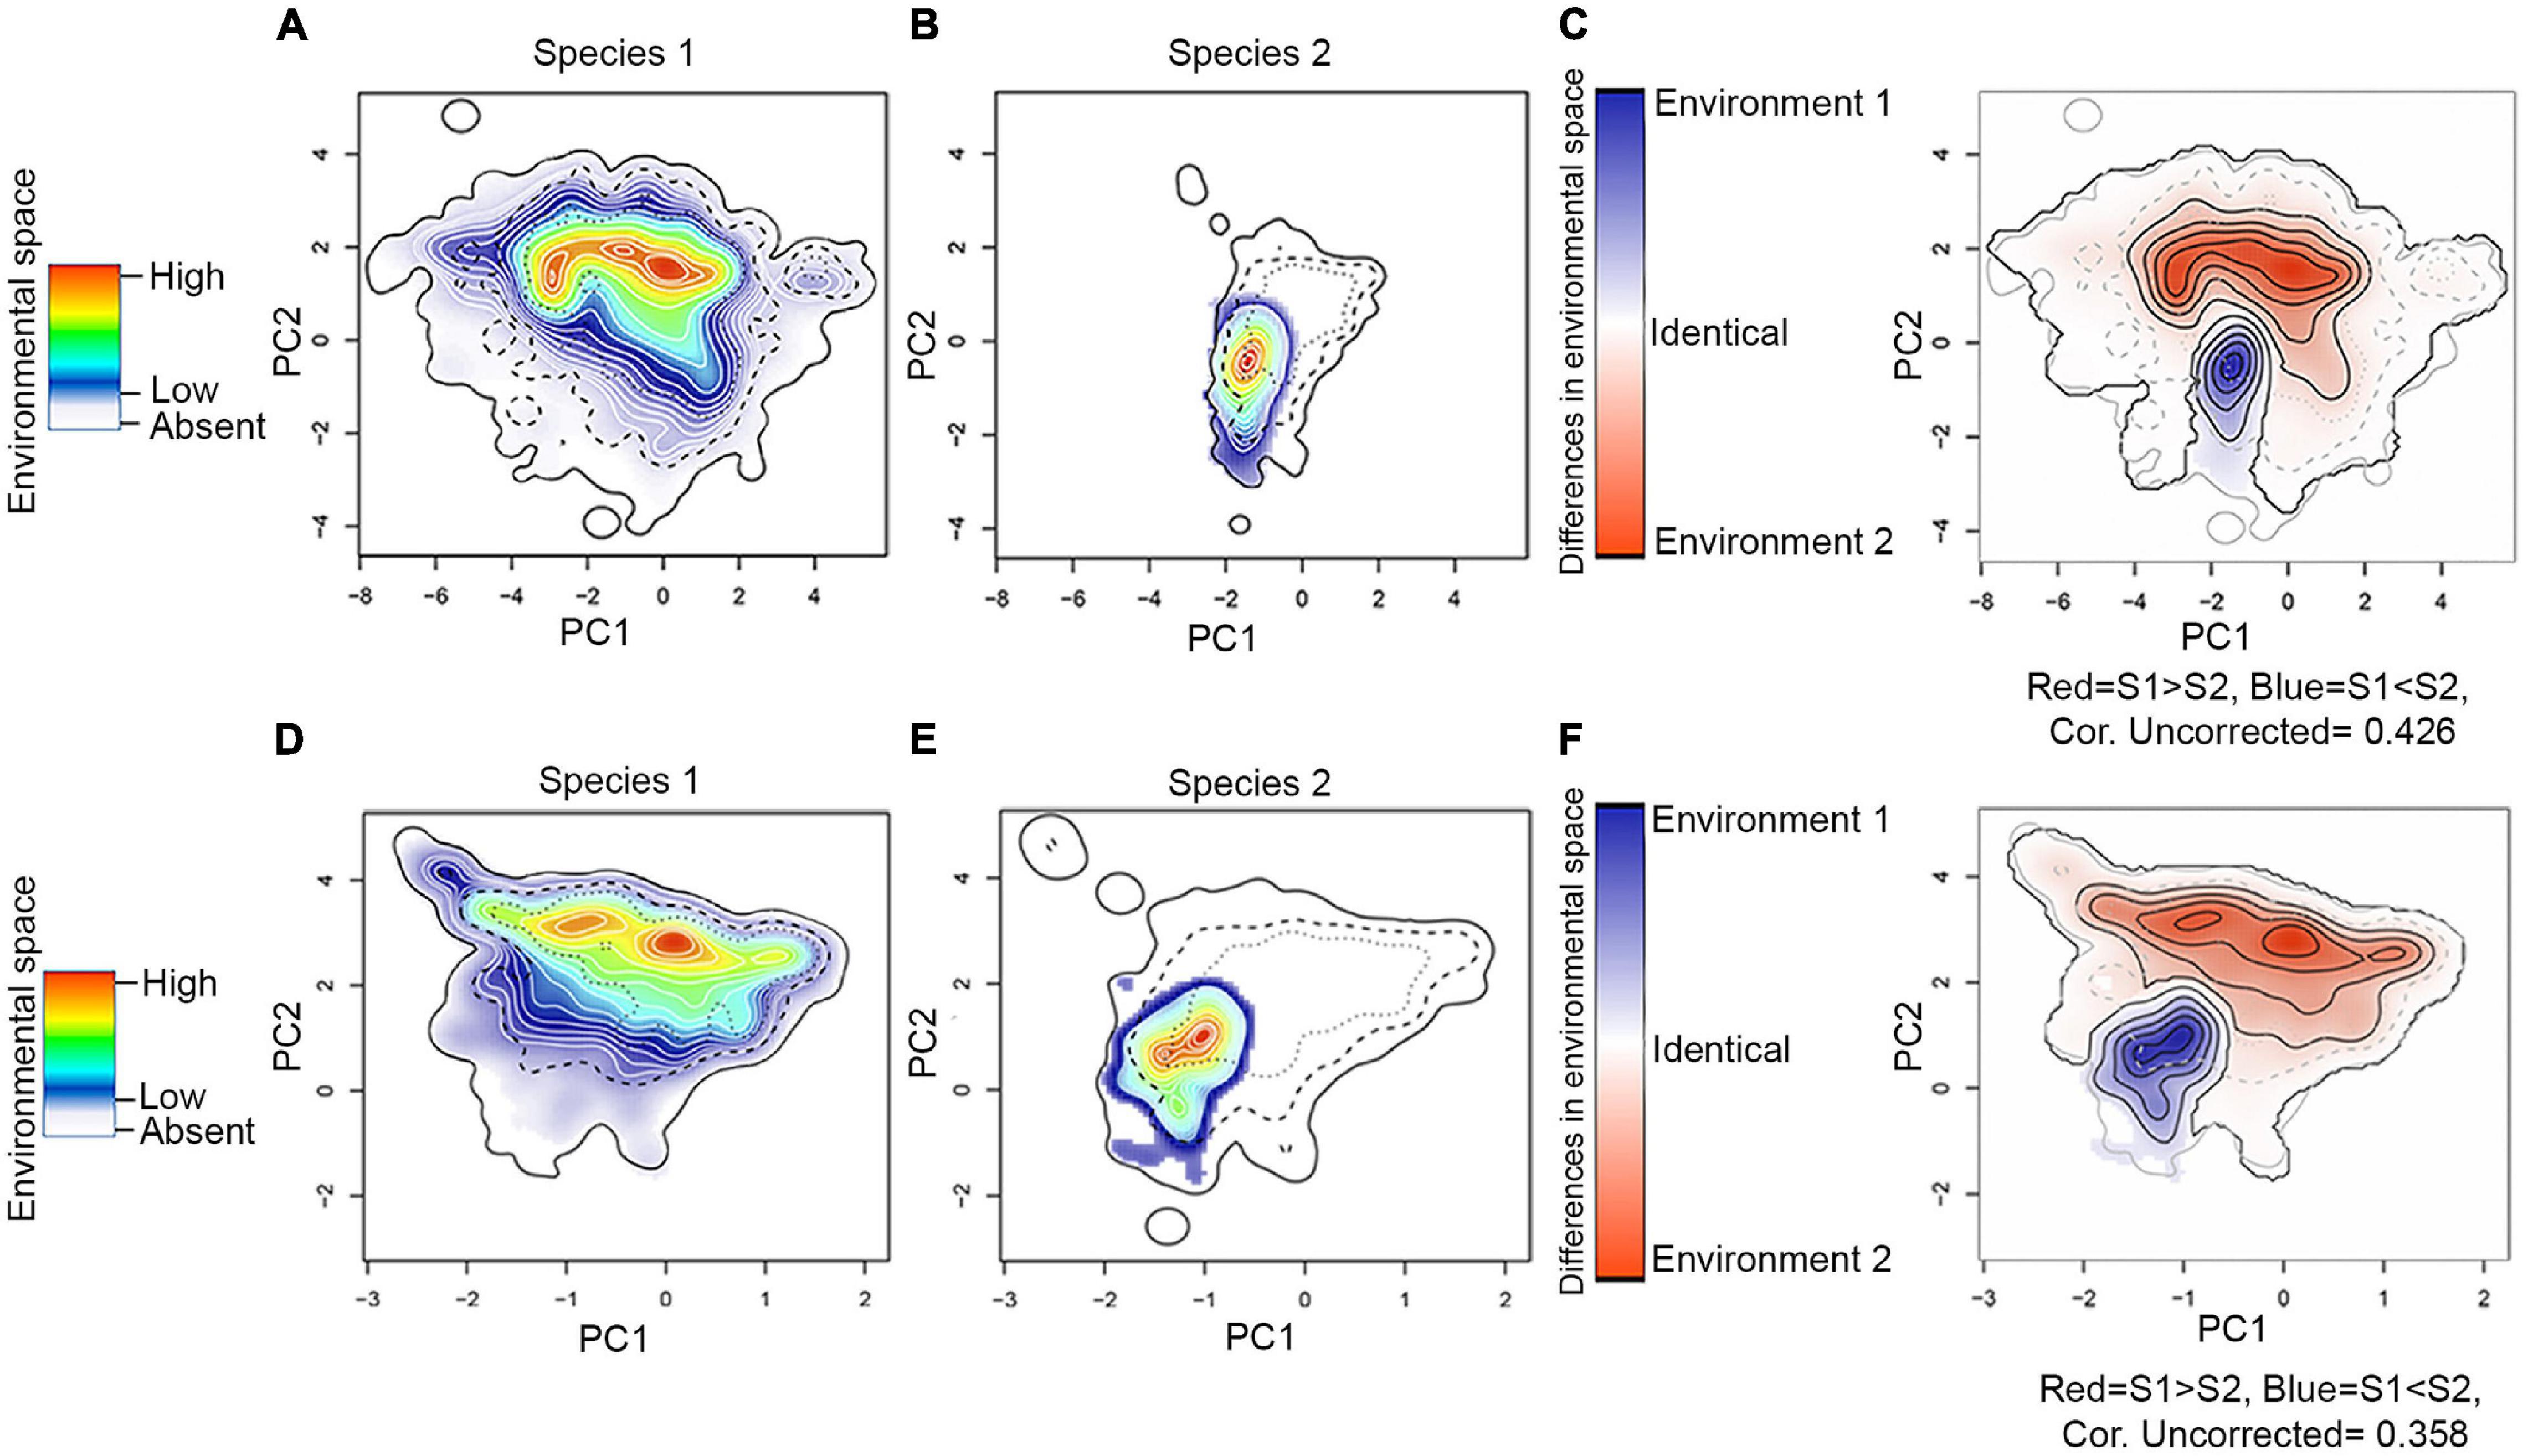
Figure 5. Assessment of niche similarity. As an example, we show the Niche Overlap Test (NOT–top row) and Niche Divergence Test (NDT–bottom row) between H. erato (species 1) and H. himera (species 2), but other comparisons can be found in ZENODO (https://doi.org/10.5281/zenodo.5149294). (A,D) Environmental space of species 1; (B,E) environmental space of species 2; and (C,F) difference in the environmental space (E-space) of two species and Niche E-space Correlation Index (NECI). When NECI was higher than 0.5, we corrected species occupied niches by the frequency of E-space in accessible environments. Significance of NOT and NDT can be found in Table 1. Equivalency statistic and niche background statistic for each NOT and NDT can be found in https://doi.org/10.5281/zenodo.5149294.
Discussion
We found that Heliconius butterflies display five general distribution patterns, namely: (i) wide distribution, (ii) trans-Andes, (iii) biogeographic Choco + Costa Rica, (iv) cis-Andes + Pacific of Ecuador, and (v) highland Andes. We also found that three variables (isothermality, precipitation and altitude) explain these patterns. Isothermality is a variable that quantifies how daily temperatures oscillate relative to the annual oscillations (O’Donnell and Ignizio, 2012), and its importance as one of the most explanatory variables of species distribution is not without precedent. For example, this variable explains the distribution of frugivorous bats (Chattopadhyay et al., 2019), mealybugs (Heya et al., 2020), Opiliones (Simó et al., 2014), and American monkeys (Vallejos-Garrido et al., 2017). Although all Heliconius species are strongly affected by isothermality, its effect seems to be stronger for widely distributed species and those with trans-Andean distribution. Interestingly, these species occur in regions with high and medium isothermality (>460%), that is, in regions that experience temperature changes throughout the day but keep a constant temperature throughout the year (O’Donnell and Ignizio, 2012). This suggests that these butterflies are particularly sensitive to long term changes in temperature, thus limiting their range to tropical areas.
The distribution of species occurring in the biogeographic Choco of Colombia, Costa Rica, cis-Andes and the Pacific of Ecuador is also strongly limited by precipitation. Consistently, these regions have either rainforest, monsoon, or savanna climate, and they are the Neotropical regions with the highest precipitation [precipitation in the driest month (Pdry) > 60 mm] (Beck et al., 2018). Previous studies have suggested that cloudiness and precipitation decrease flying bout duration in butterflies and, consequently, limit their dispersal (Cormont et al., 2011). Therefore, exceptionally high levels of precipitation in such regions may act as population traps, preventing butterflies from flying over longer distances and keeping them in a single region (Rosser et al., 2014). This finding agrees with previous studies in South America, where precipitation shapes the distribution of multiple vertebrates and invertebrates (Atauchi et al., 2017; Amundrud et al., 2018; Schivo et al., 2019; de Oliveira da Conceição et al., 2020).
In addition, altitude was the best predictor for the distribution of Heliconius species that can reach elevations up to 2,600 masl, which is considerably higher than the elevational range occupied by other members of the genus (<2,200) (Rosser et al., 2012). Therefore, it is likely that these highland species have morphological or physiological modifications that allow them to expand their elevational range and occupy new niches. In fact, highland Heliconius are known to have rounder wings compared to lowland species, and this has been suggested to aid them flying dense cloud forest or compensate for the lower air pressure found at higher altitudes (Montejo-Kovacevich et al., 2019). Also, comparisons among different populations of Heliconius have revealed that highland populations are less tolerant to heat (Montejo-Kovacevich et al., 2020), which may limit their distribution range.
The foothills of the eastern Andes and the Amazon basin appeared as the regions with highest Heliconius species richness, which confirms the findings of a previous study done for the subfamily Heliconiine at a higher scale (50 km) (Rosser et al., 2012). Interestingly, both of these regions are known to present unusual concentrations of contact zones and hybrid zones (i.e., suture zones) (Dasmahapatra et al., 2010; Rosser et al., 2021), which may explain the richness they exhibit. Also, altitude, isothermality, and precipitation were the variables best correlated with this metric. This may be due to the elevational gradient found at the foothills of the eastern Andes, which offers multiple ecological niches thus favoring diversification rates (Rahbek and Graves, 2001; Jetz and Rahbek, 2002; Davies et al., 2007; Keppel et al., 2016). Additionally, there are several climate-based hypotheses that seek to explain broad-scale diversity patterns, and water and energy have emerged as crucial influencers of species richness (Silva-Flores et al., 2014). In particular, the water-energy dynamics hypothesis argues that species richness increases in places where liquid water and optimal energy conditions provide the greatest capacity for biotic dynamics (Svenning et al., 2008). The Amazon and foothills of the eastern Andes are regions with near constant hot-warm temperature throughout the year and have a permanent liquid water supply (Rosser et al., 2014; Vallejos-Garrido et al., 2017) thus ensuring an optimal water-energy dynamic. The latter translates into constant availability of plants for butterflies, including host plants for immature and pollen for adults, and continual interactions between individuals, which may be correlated with the high species richness we detected.
Similar to other studies, patterns of phylogenetic diversity were similar (although not identical) to richness (Davies Jonathan and Buckley, 2011; Fenker et al., 2014; Mendoza and Arita, 2014; Guedes et al., 2018). Interestingly, areas with highest species richness got low phylogenetic diversity (Figure 2C, blue grids), which may be a consequence of the recent increase in diversification rate in Heliconius (4.5 Ma) and the consequent co-occurrence of multiple young species in the Amazon and foothills of the eastern Andes (Rosser et al., 2012; Kozak et al., 2015). In agreement with this observation, previous research in both animals and plants have found high phylogenetic diversity in the eastern Andes of Colombia, Peru, and Ecuador (Fenker et al., 2014; Mendoza and Arita, 2014; Guedes et al., 2018; Arango et al., 2021; Velazco et al., 2021).
The highest phylogenetic endemism was found in the central eastern Andes of Colombia, and this result is possibly due to the restricted range of the species Heliconius heurippa (Figure 2D, area H1). However, we cannot rule out this result as an overestimation since the phylogenetic tree that we used (Kozak et al., 2015) considers this taxon as a separate species and not as part of H. timareta (as recently hypothesized). If H. heurippa had been included within H. timareta, which has a wider distribution range, it is likely this result on phylogenetic endemism does not hold. Additionally, the pacific region of Costa Rica, Panama and Colombia show intermediate values of phylogenetic endemism that resulted from the presence of species that have reduced geographic range and are either long-branch species (e.g., Heliconius godmani) or species for which no close relatives are known (e.g., Heliconius hewitsoni) (Figure 2D, area H2 and H3, respectively). These regions were previously described as highly endemic phylogenetically for plants (Sandel et al., 2020), terrestrial mammals (Rosauer and Jetz, 2014), birds and amphibians (Daru et al., 2020a). Interestingly, there were several species that, although are considered as geographically endemic within Heliconius, exhibited low values of phylogenetic endemism. However, it is important to acknowledge that phylogenetic endemism is a concept based on linages rather than species, and thus, if an endemic species has a narrow range but it is closely related to a widespread species, its phylogenetic endemism will not necessarily be low (Rosauer et al., 2009). An example of this is Heliconius nattereri, an endemic species from Brazil’s Atlantic Forest that, despite having a narrow distribution, is sister to the widely distributed Heliconius ethilla (Figure 2D, area H4). Similarly, Heliconius atthis is restricted to the Ecuadorian and Peruvian Pacific, but it is sister to the widely distributed Heliconius hecale (Figure 2D, area H5). In our study we found that high precipitation and near constant hot-warm temperature throughout the year are strongly correlated with phylogenetic endemism, which agrees with studies that point a role for temperature in promoting endemism by reducing extinction rates and increasing population sizes in small areas (Jetz et al., 2004; Rosauer and Jetz, 2014; Varzinczak et al., 2020).
Our environmental niche analysis showed that hybridizing species do not necessarily share the same climatic space despite some of them having largely overlapping geographic distributions. This is the case of H. ethilla and H. numata, which frequently co-occur throughout their distribution, but there are some regions with an extreme climate, such as the Pacific coast of Colombia (a humid jungle) and the Colombian Magdalena valley (which has a marked precipitation gradient, being humid in the north and dry in the south), where H. ethilla but not H. numata occur (Supplementary Figure 9). This suggests that the former species has a broader climatic tolerance. We also detected differences in the environmental niche between pairs of hybridizing species that rarely overlap geographically, but when they do, they hybridize. For example, H. erato and H. himera occupy contrasting environmental niches in Ecuador (Jiggins et al., 1997), where H. himera lives in dry forests while H. erato inhabits wet forests of the Andes (Figure 5). Similarly, the hybridizing H. erato (H. e. venus) and H. chestertonii meet in an environmental transition zone between wet and dry forest in the Colombian Andes (Muñoz et al., 2010; Supplementary Figure 8).
In summary, we confirmed that, at large scales, the distribution of Heliconius, its richness, diversity, and phylogenetic endemism are mainly shaped by a combination of high annual energy (i.e., hot-warm temperature), constant water supply, and an extraordinary topographic complexity. However, species distributions are thought to result from dynamics occurring at multiple spatial scales. Therefore, including microclimate variables and ecological interactions would provide an in-depth understanding of the multiscale drivers of distribution, niche range and phylogenetic processes (Montejo-Kovacevich et al., 2020; Paz and Guarnizo, 2020). Our study confirms the richness and diversity of areas already identified in other taxa, thus strengthening the importance for their conservation as strategic hotspots of biodiversity.
Data Availability Statement
The datasets presented in this study can be found in online repositories. The names of the repository/repositories and accession number(s) can be found below: https://doi.org/10.5281/zenodo.5149294.
Author Contributions
NR-M and CS conceived the study. NR-M and FS-R analyzed the data. NR-M and CG-Q curated the databases. NR-M, CS, CP-D, FS-R, and CG-Q collected the specimens in regions poorly sampled in Colombia. NR-M, CS, and CP-D drafted the manuscript. All authors read and approved the final version.
Funding
NR-M was funded by the Ministerio de Ciencia Tecnología e Innovación (MinCiencias) Grant 727-2016, and the Universidad del Rosario Doctoral Student Fellowships. CS and CP-D were funded by the Universidad del Rosario Big-Grant IV-FGD005/IV-FGI006.
Conflict of Interest
The authors declare that the research was conducted in the absence of any commercial or financial relationships that could be construed as a potential conflict of interest.
Publisher’s Note
All claims expressed in this article are solely those of the authors and do not necessarily represent those of their affiliated organizations, or those of the publisher, the editors and the reviewers. Any product that may be evaluated in this article, or claim that may be made by its manufacturer, is not guaranteed or endorsed by the publisher.
Acknowledgments
We thank Chris Jiggins for providing us with photos of some specimens. We also thank “Autoridad Nacional de Licencias Ambientales—ANLA” for granting Universidad del Rosario the collecting permit 530. Also, the High-Performance Computing Service of Universidad del Rosario provided free computing time.
Supplementary Material
The Supplementary Material for this article can be found online at: https://www.frontiersin.org/articles/10.3389/fevo.2021.750703/full#supplementary-material
Footnotes
References
Amundrud, S. L., Videla, M., and Srivastava, D. S. (2018). Dispersal barriers and climate determine the geographic distribution of the helicopter damselfly Mecistogaster modesta. Freshw. Biol. 63, 214–223. doi: 10.1111/fwb.13054
Andújar, C., Arribas, P., Ruiz, C., Serrano, J., and Gómez-Zurita, J. (2014). Integration of conflict into integrative taxonomy: fitting hybridization in species delimitation of Mesocarabus (Coleoptera: Carabidae). Mol. Ecol. 23, 4344–4361. doi: 10.1111/mec.12793
Arango, A., Villalobos, F., Prieto-Torres, D. A., and Guevara, R. (2021). The phylogenetic diversity and structure of the seasonally dry forests in the Neotropics. J. Biogeogr. 48, 176–186. doi: 10.1111/jbi.13991
Arteaga, M. C., Mccormack, J. E., Eguiarte, L. E., and Medell, R. A. (2011). Genetic admixture in multidimensional enviromental space : asymetrical niche similarity promotes gene flow in Armadillos (Dasypus Novemcinctus). Evolution 65, 2470–2480. doi: 10.1111/j.1558-5646.2011.01329.x
Assis, J. (2020). R Pipelines to Reduce the Spatial Autocorrelation in Species Distribution Models. the MarineDataScientist. Available online at: https://github.com/jorgeassis/spatialAutocorrelation (accessed April 20, 2021).
Atauchi, P. J., Peterson, T., and Flanagan, J. (2017). Species distribution models for Peruvian plantcutter improve with consideration of biotic interactions. J. Avian Biol. 49:jav-01617.
Barbet-Massin, M., Jiguet, F., Albert, C. H., and Thuiller, W. (2012). Selecting pseudo-absences for species distribution models: how, where and how many? Methods Ecol. Evol. 3, 327–338. doi: 10.1111/j.2041-210X.2011.00172.x
Beck, H. E., Zimmermann, N. E., McVicar, T. R., Vergopolan, N., Berg, A., and Wood, E. F. (2018). Present and future köppen-geiger climate classification maps at 1-km resolution. Sci. Data 5, 1–12. doi: 10.1038/sdata.2018.214
Brown, J. L., and Carnaval, A. C. (2019). A tale of two niches: methods, concepts, and evolution. Front. Biogeogr. 11:e44158. doi: 10.21425/F5FBG44158
Brown, J. L., Paz, A., Reginato, M., Renata, C. A., Assis, C., Lyra, M., et al. (2020). Seeing the forest through many trees: multi-taxon patterns of phylogenetic diversity in the Atlantic forest hotspot. Divers. Distrib. 26, 1160–1176. doi: 10.1111/ddi.13116
Chattopadhyay, B., Garg, K. M., Ray, R., and Rheindt, F. E. (2019). Fluctuating fortunes: genomes and habitat reconstructions reveal global climate-mediated changes in bats’ genetic diversity. Proc. R. Soc. B Biol. Sci. 286, 1–10. doi: 10.1098/rspb.2019.0304
Cormont, A., Malinowska, A. H., Kostenko, O., Radchuk, V., Hemerik, L., WallisDeVries, M. F., et al. (2011). Effect of local weather on butterfly flight behaviour, movement, and colonization: significance for dispersal under climate change. Biodivers. Conserv. 20, 483–503. doi: 10.1007/s10531-010-9960-4
Daru, B. H., Karunarathne, P., and Schliep, K. (2020b). phyloregion: R package for biogeographical regionalization and macroecology. Methods Ecol. Evol. 11, 1483–1491. doi: 10.1111/2041-210X.13478
Daru, B. H., Farooq, H., Antonelli, A., and Faurby, S. (2020a). Endemism patterns are scale dependent. Nat. Commun. 11, 1–11. doi: 10.1038/s41467-020-15921-6
Dasmahapatra, K. K., Lamas, G., Simpson, F., and Mallet, J. (2010). The anatomy of a “suture zone” in Amazonian butterflies: a coalescent-based test for vicariant geographic divergence and speciation. Mol. Ecol. 19, 4283–4301. doi: 10.1111/j.1365-294X.2010.04802.x
Davies, R. G., Orme, C. D. L., Storch, D., Olson, V. A., Thomas, G. H., Ross, S. G., et al. (2007). Topography, energy and the global distribution of bird species richness. Proc. R. Soc. B Biol. Sci. 274, 1189–1197. doi: 10.1098/rspb.2006.0061
Davies Jonathan, T., and Buckley, L. B. (2011). Phylogenetic diversity as a window into the evolutionary and biogeographic histories of present-day richness gradients for mammals. Philos. Trans. R. Soc. B Biol. Sci. 366, 2414–2425. doi: 10.1098/rstb.2011.0058
Davis Rabosky, A. R., Cox, C. L., Rabosky, D. L., Title, P. O., Holmes, I. A., Feldman, A., et al. (2016). Coral snakes predict the evolution of mimicry across New World snakes. Nat. Commun. 7, 1–9. doi: 10.1038/ncomms11484
de Oliveira da Conceição, E., Mantovano, T., de Campos, R., Rangel, T. F., Martens, K., Bailly, D., et al. (2020). Mapping the observed and modelled intracontinental distribution of non-marine ostracods from South America. Hydrobiologia 847, 1663–1687. doi: 10.1007/s10750-019-04136-6
Dormann, C. F., Elith, J., Bacher, S., Buchmann, C., Carl, G., Carré, G., et al. (2013). Collinearity: a review of methods to deal with it and a simulation study evaluating their performance. Ecography 36, 27–46. doi: 10.1111/j.1600-0587.2012.07348.x
Faith, D. P. (1992). Conservation evaluation and phylogenetic diversity. Biol. Conserv. 61, 1–10. doi: 10.1016/0006-3207(92)91201-3
Fenker, J., Tedeschi, L. G., Pyron, R. A., Nogueira, C., and de, C. (2014). Phylogenetic diversity, habitat loss and conservation in South American pitvipers (Crotalinae: Bothrops and Bothrocophias). Divers. Distrib. 20, 1108–1119. doi: 10.1111/ddi.12217
Friedman, J. H., Hastie, T., and Tibshirani, R. (2000). Additive logistic regression: a statistical view of boosting. Ann. Stat. 28, 337–407.
Gotelli, N. J., Anderson, M. J., Arita, H. T., Chao, A., Colwell, R. K., Connolly, S. R., et al. (2009). Patterns and causes of species richness: a general simulation model for macroecology. Ecol. Lett. 12, 873–886. doi: 10.1111/j.1461-0248.2009.01353.x
Guedes, T. B., Sawaya, R. J., Zizka, A., Laffan, S., Faurby, S., Pyron, R. A., et al. (2018). Patterns, biases and prospects in the distribution and diversity of Neotropical snakes. Glob. Ecol. Biogeogr. 27, 14–21. doi: 10.1111/geb.12679
Hawkins, B. A., Field, R., Cornell, H. V., Currie, D. J., Guégan, J. F., Kaufman, D. M., et al. (2003). Energy, water, and broad-scale geographic patterns of species richness. Ecology 84, 3105–3117. doi: 10.1890/03-8006
Heiberger, R. M. (2020). HH: Statistical Analysis and Data Display: Heiberger and Holland. R Package Version 3. Available online at: https://CRAN.R-project.org/package=HH (accessed February 15, 2021).
Heya, H. M., Khamis, F. M., Onyambu, G. K., Akutse, K. S., Mohamed, S. A., Kimathi, E. K., et al. (2020). Characterization and risk assessment of the invasive papaya mealybug, Paracoccus marginatus, in Kenya under changing climate. J. Appl. Entomol. 144, 1–17. doi: 10.1111/jen.12748
Jarvis, A., Reuter, H. I., Nelson, A., and Guevara, E. (2008). Hole-Filled SRTM for the Globe Version 4, the CGIAR-CSI SRTM 90m Database. Available online at: http://srtm.csi.cgiar.org (accessed January 30, 2021).
Jetz, W., and Rahbek, C. (2002). Geographic range size and determinants of avian species richness. Science 297, 1548–1551. doi: 10.1126/science.1072779
Jetz, W., Rahbek, C., and Colwell, R. K. (2004). The coincidence of rarity and richness and the potential signature of history in centres of endemism. Ecol. Lett. 7, 1180–1191. doi: 10.1111/j.1461-0248.2004.00678.x
Jiggins, C. (2017). The Ecology and Evolution of Heliconius Butterflies. Oxford: Oxford University Press.
Jiggins, C., Mcmillan, W. O., and Mallet, J. (1997). Host plant adaptation has not played a role in the recent speciation of Heliconius himera and Heliconius erato. Ecol. Entomol. 22, 361–365. doi: 10.1046/j.1365-2311.1997.00067.x
Karatzoglou, A., Hornik, K., Smola, A., and Zeileis, A. (2004). kernlab - An S4 package for kernel methods in R. J. Stat. Softw. 11, 1–20. doi: 10.18637/jss.v011.i09
Karger, D. N., Conrad, O., Böhner, J., Kawohl, T., Kreft, H., Soria-Auza, R. W., et al. (2017). Climatologies at high resolution for the earth’s land surface areas. Sci. Data 4:170122. doi: 10.1038/sdata.2017.122
Keppel, G., Gillespie, T. W., Ormerod, P., and Fricker, G. A. (2016). Habitat diversity predicts orchid diversity in the tropical south-west Pacific. J. Biogeogr. 43, 2332–2342. doi: 10.1111/jbi.12805
Kozak, K. M., Wahlberg, N., Neild, A. F., Dasmahapatra, K. K., Mallet, J., and Jiggins, C. D. (2015). Multilocus species trees show the recent adaptive radiation of the mimetic Heliconius butterflies. Syst. Biol. 64, 505–524.
Kreft, H., and Jetz, W. (2007). Global patterns and determinants of vascular plant diversity. Proc. Natl. Acad. Sci. U.S.A. 104, 5925–5930. doi: 10.1073/pnas.0608361104
Kronforst, M. R., Hansen, M. E., Crawford, N. G., Gallant, J. R., Zhang, W., Kulathinal, R. J., et al. (2013). Hybridization reveals the evolving genomic architecture of speciation. Cell Rep. 14, 666–677. doi: 10.1016/j.celrep.2013.09.042
Kubota, Y., Shiono, T., and Kusumoto, B. (2015). Role of climate and geohistorical factors in driving plant richness patterns and endemicity on the east Asian continental islands. Ecography 38, 639–648. doi: 10.1111/ecog.00981
Kuhn, M. (2008). Building predictive models in R using the caret package. J. Stat. Softw. 28, 1–26. doi: 10.18637/jss.v028.i05
Lake, T. A., Briscoe Runquist, R. D., and Moeller, D. A. (2020). Predicting range expansion of invasive species: pitfalls and best practices for obtaining biologically realistic projections. Divers. Distrib. 26, 1767–1779. doi: 10.1111/ddi.13161
Lamas, G., and Jiggins, C. D. (2017). “Taxonomic list,” in The Ecology and Evolution of Heliconius Butterflies, ed. C. D. Jiggins (Oxford: Oxford University Press), 214–244.
López-Aguirre, C., Hand, S. J., Laffan, S. W., and Archer, M. (2019). Zoogeographical regions and geospatial patterns of phylogenetic diversity and endemism of New World bats. Ecography 42, 1188–1199. doi: 10.1111/ecog.04194
Mallet, J., Barton, N., Lamas, G., Santisteban, J., Muedas, M., and Eeley, H. (1990). Estimates of selection and gene flow from measures of cline width and linkage disequilibrium in Heliconius hybrid zones. Genetics 124, 921–936.
Mallet, J., Beltrán, M., Neukirchen, W., and Linares, M. (2007). Natural hybridization in heliconiine butterflies: the species boundary as a continuum. BMC Evol. Biol. 7:28. doi: 10.1186/1471-2148-7-28
Mallet, J., McMillan, W. O., and Jiggins, C. D. (1998). “Mimicry and warning color at the boundary between races and species,” in Endless Forms: Species and Speciation, eds D. Howard and S. Berlöcher (New York, NY: Oxford University Press), 390–403.
Martin, S. H., Dasmahapatra, K. K., Nadeau, N. J., Salazar, C., Walters, J. R., Simpson, F., et al. (2013). Genome-wide evidence for speciation with gene flow in Heliconius butterflies. Genome Res. 23, 1817–1828. doi: 10.1101/gr.159426.113
Mendoza, A. M., and Arita, H. T. (2014). Priority setting by sites and by species using rarity, richness and phylogenetic diversity: the case of neotropical glassfrogs (Anura: Centrolenidae). Biodivers. Conserv. 23, 909–926. doi: 10.1007/s10531-014-0642-5
Meyer, L., Diniz-Filho, J. A. F., and Lohmann, L. G. (2017). A comparison of hull methods for estimating species ranges and richness maps. Plant Ecol. Divers. 10, 389–401. doi: 10.1080/17550874.2018.1425505
Montejo-Kovacevich, G., Martin, S. H., Meier, J. I., Bacquet, C. N., Monllor, M., Jiggins, C. D., et al. (2020). Microclimate buffering and thermal tolerance across elevations in a tropical butterfly. J. Exp. Biol. 223:jeb220426. doi: 10.1242/jeb.220426
Montejo-Kovacevich, G., Smith, J. E., Meier, J. I., Bacquet, C. N., Whiltshire-Romero, E., Nadeau, N. J., et al. (2019). Altitude and life-history shape the evolution of Heliconius wings. Evolution 73, 2436–2450. doi: 10.1111/evo.13865
Mullen, S. P., Savage, W. K., Wahlberg, N., and Willmott, K. R. (2011). Rapid diversification and not clade age explains high diversity in neotropical Adelpha butterflies. Proc. R. Soc. B Biol. Sci. 278, 1777–1785. doi: 10.1098/rspb.2010.2140
Muñoz, A. G., Salazar, C., Castaño, J., Jiggins, C. D., and Linares, M. (2010). Multiple sources of reproductive isolation in a bimodal butterfly hybrid zone. J. Evol. Biol. 23, 1312–1320. doi: 10.1111/j.1420-9101.2010.02001.x
O’Donnell, M. S., and Ignizio, D. A. (2012). Bioclimatic predictors for supporting ecological applications in the conterminous United States. U.S. Geol. Surv. Data Ser. 691, 1–17.
Ortego, J., Gugger, P. F., Riordan, E. C., and Sork, V. L. (2014). Influence of climatic niche suitability and geographical overlap on hybridization patterns among southern Californian oaks. J. Biogeogr. 41, 1895–1908. doi: 10.1111/jbi.12334
Paz, A., Brown, J. L., Cordeiro, C. L. O., Aguirre-Santoro, J., Assis, C., Amaro, R. C., et al. (2021). Environmental correlates of taxonomic and phylogenetic diversity in the Atlantic forest. J. Biogeogr. 48, 1377–1391. doi: 10.1111/jbi.14083
Paz, A., and Guarnizo, C. E. (2020). Environmental ranges estimated from species distribution models are not good predictors of lizard and frog physiological tolerances. Evol. Ecol. 34, 89–99. doi: 10.1007/s10682-019-10022-3
Pearson, D. L., and Carroll, S. S. (2001). Predicting patterns of tiger beetle (Coleoptera : Cicindelidae) species richness in Northwestern South America. Stud. Neotrop. Fauna Environ. 36, 125–136.
Phillips, S. J., Anderson, R. P., and Schapire, R. E. (2006). Maximum entropy modeling of species geographic distributions. Ecol. Model. 190, 231–259. doi: 10.1016/j.ecolmodel.2005.03.026
Phillips, S. J., Dudík, M., Elith, J., Graham, C. H., Lehmann, A., Leathwick, J., et al. (2009). Sample selection bias and presence-only distribution models: implications for background and pseudo-absence data. Ecol. Appl. 19, 181–197. doi: 10.1890/07-2153.1
Qian, H. (2010). Environment-richness relationships for mammals, birds, reptiles, and amphibians at global and regional scales. Ecol. Res. 25, 629–637. doi: 10.1007/s11284-010-0695-1
Rahbek, C., and Graves, G. R. (2001). Multiscale assessment of patterns of avian species richness. Proc. Natl. Acad. Sci. U.S.A. 98, 4534–4539. doi: 10.1073/pnas.071034898
Rödder, D., and Engler, J. O. (2011). Quantitative metrics of overlaps in Grinnellian niches: advances and possible drawbacks. Glob. Ecol. Biogeogr. 20, 915–927. doi: 10.1111/j.1466-8238.2011.00659.x
Rosauer, D., Laffan, S. W., Crisp, M. D., Donnellan, S. C., and Cook, L. G. (2009). Phylogenetic endemism: a new approach for identifying geographical concentrations of evolutionary history. Mol. Ecol. 18, 4061–4072. doi: 10.1111/j.1365-294X.2009.04311.x
Rosauer, D. F., and Jetz, W. (2014). Phylogenetic endemism in terrestrial mammals. Glob. Ecol. Biogeogr. 24, 168–179. doi: 10.1111/geb.12237
Rosser, N., Dasmahapatra, K. K., and Mallet, J. (2014). Stable Heliconius butterfly hybrid zones are correlated with a local rainfall peak at the edge of the Amazon basin. Evolution 68, 3470–3484.
Rosser, N., Phillimore, A., Huertas, B., Willmott, K., and Mallet, J. (2012). Testing historical explanations for gradients in species richness in heliconiine butterflies of tropical America. Biol. J. Linn. Soc. 105, 479–497. doi: 10.1111/j.1095-8312.2011.01814.x
Rosser, N., Shirai, L. T., Dasmahapatra, K. K., Mallet, J., and Freitas, A. V. L. (2021). The Amazon river is a suture zone for a polyphyletic group of co-mimetic heliconiine butterflies. Ecography 44, 177–187. doi: 10.1111/ecog.05282
Sandel, B., Weigelt, P., Kreft, H., Keppel, G., van der Sande, M. T., Levin, S., et al. (2020). Current climate, isolation and history drive global patterns of tree phylogenetic endemism. Glob. Ecol. Biogeogr. 29, 4–15. doi: 10.1111/geb.13001
Schivo, F., Bauni, V., Krug, P., and Quintana, R. D. (2019). Distribution and richness of amphibians under different climate change scenarios in a subtropical region of South America. Appl. Geogr. 103, 70–89. doi: 10.1016/j.apgeog.2019.01.003
Schmitt, S., Pouteau, R., Justeau, D., de Boissieu, F., and Birnbaum, P. (2017). ssdm: an r package to predict distribution of species richness and composition based on stacked species distribution models. Methods Ecol. Evol. 8, 1795–1803. doi: 10.1111/2041-210X.12841
Silva-Flores, R., Pérez-Verdín, G., and Wehenkel, C. (2014). Patterns of tree species diversity in relation to climatic factors on the Sierra Madre Occidental, Mexico. PLoS One 9:e105034. doi: 10.1371/journal.pone.0105034
Simó, M., Guerrero, J. C., Giuliani, L., Castellano, I., and Acosta, L. E. (2014). A predictive modeling approach to test distributional uniformity of Uruguayan harvestmen (Arachnida: Opiliones). Zool. Stud. 53, 1–13. doi: 10.1186/s40555-014-0050-2
Smith, A. B., and Santos, M. J. (2020). Testing the ability of species distribution models to infer variable importance. Ecography 43, 1801–1813. doi: 10.1111/ecog.05317
Soberón, J., and Nakamura, M. (2009). Niches and distributional areas: concepts, methods, and assumptions. Proc. Natl. Acad. Sci. U.S.A. 106, 19644–19650. doi: 10.1073/pnas.0901637106
Svenning, J. C., Borchsenius, F., Bjorholm, S., and Balslev, H. (2008). High tropical net diversification drives the New World latitudinal gradient in palm (Arecaceae) species richness. J. Biogeogr. 35, 394–406. doi: 10.1111/j.1365-2699.2007.01841.x
Swenson, N. G., Fair, J. M., and Heikoop, J. (2008). Water stress and hybridization between Quercus gambelii and Quercus grisea. West. North Am. Nat. 68, 498–507.
Vallejos-Garrido, P., Rivera, R., Inostroza-Michae, O., Rodríguez-Serrano, E., and Hernández, C. E. (2017). Historical dynamics and current environmental effects explain the spatial distribution of species richness patterns of New World monkeys. PeerJ 5, 2–27. doi: 10.7717/peerj.3850
Varzinczak, L. H., Zanata, T. B., Moura, M. O., and Passos, F. C. (2020). Geographical patterns and current and short-term historical correlates of phylogenetic diversity and endemism for New World primates. J. Biogeogr. 47, 890–902. doi: 10.1111/jbi.13767
Vasconcelos, T. S., da Silva, F. R., dos Santos, T. G., Prado, V. H. M., and Provete, D. B. (2019). Biogeographic Patterns of South American Anurans. Berlin: Springer, doi: 10.1007/978-3-030-26296-9
Velazco, S. J. E., Svenning, J. C., Ribeiro, B. R., and Laureto, L. M. O. (2021). On opportunities and threats to conserve the phylogenetic diversity of Neotropical palms. Divers. Distrib. 27, 512–523. doi: 10.1111/ddi.13215
Keywords: species distribution models, phylogenetic diversity, species richness, phylogenetic endemism, climatic niches, hybridization
Citation: Rueda-M N, Salgado-Roa FC, Gantiva-Q CH, Pardo-Díaz C and Salazar C (2021) Environmental Drivers of Diversification and Hybridization in Neotropical Butterflies. Front. Ecol. Evol. 9:750703. doi: 10.3389/fevo.2021.750703
Received: 31 July 2021; Accepted: 04 October 2021;
Published: 22 October 2021.
Edited by:
Gengping Zhu, Tianjin Normal University, ChinaReviewed by:
Vijay Barve, Florida Museum of Natural History, United StatesPedro Tarroso, Centro de Investigacao em Biodiversidade e Recursos Geneticos (CIBIO-InBIO), Portugal
Copyright © 2021 Rueda-M, Salgado-Roa, Gantiva-Q, Pardo-Díaz and Salazar. This is an open-access article distributed under the terms of the Creative Commons Attribution License (CC BY). The use, distribution or reproduction in other forums is permitted, provided the original author(s) and the copyright owner(s) are credited and that the original publication in this journal is cited, in accordance with accepted academic practice. No use, distribution or reproduction is permitted which does not comply with these terms.
*Correspondence: Camilo Salazar, Y2FtaWxvLnNhbGF6YXJAdXJvc2FyaW8uZWR1LmNv