 Loren L. Fardell
 Catherine E. M. Nano
 Chris R. Pavey
 Christopher R. Dickman
94% of researchers rate our articles as excellent or good
Learn more about the work of our research integrity team to safeguard the quality of each article we publish.
Find out more
ORIGINAL RESEARCH article
Front. Ecol. Evol., 03 December 2021
Sec. Urban Ecology
Volume 9 - 2021 | https://doi.org/10.3389/fevo.2021.750094
Human activity can impose additional stressors to wildlife, both directly and indirectly, including through the introduction of predators and influences on native predators. As urban and adjacent environments are becoming increasingly valuable habitat for wildlife, it is important to understand how susceptible taxa, like small prey animals, persist in urban environments under such additional stressors. Here, in order to determine how small prey animals’ foraging patterns change in response to habitat components and distances to predators and human disturbances, we used filmed giving-up density (GUD) trials under natural conditions along an urban disturbance gradient. We then ran further GUD trials with the addition of experimentally introduced stressors of: the odors of domestic cat (Felis catus)/red fox (Vulpes vulpes) as predator cues, light and sound as human disturbance cues, and their combinations. Small mammals were mostly observed foraging in the GUD trials, and to a lesser degree birds. Animals responded to proximity to predators and human disturbances when foraging under natural conditions, and used habitat components differently based on these distances. Along the urban disturbance gradient situation-specific responses were evident and differed under natural conditions compared to additional stressor conditions. The combined predator with human disturbance treatments resulted in responses of higher perceived risk at environments further from houses. Animals at the urban-edge environment foraged more across the whole site under the additional stressor conditions, but under natural conditions perceived less risk when foraging near predators and further from human disturbance (houses). Contrastingly, at the environments further from houses, foraging near human disturbance (paths/roads) when close to a predator was perceived as lower risk, but when foraging under introduced stressor conditions these disturbances were perceived as high risk. We propose that sensory and behavioral mechanisms, and stress exposure best explain our findings. Our results indicate that habitat components could be managed to reduce the impacts of high predation pressure and human activity in disturbed environments.
Urban development is a major cause of environmental change and biodiversity loss (McDonald et al., 2008; Madsen et al., 2010; Seto et al., 2012). Environments transformed by development usually have an altered vegetation structure that can change flora and fauna assemblages, through removing or creating suboptimal habitats for some species whilst providing habitat opportunities for other species to exploit (Grimm et al., 2008). If suitable conditions prevail, however, then novel urban ecosystems may present the best or only available habitat for local biotas (Hobbs et al., 2013), as has been observed in several urban habitats that serve as hotspots for native flora and fauna (Cincotta et al., 2000; Seto et al., 2012; Ives et al., 2016; Wintle et al., 2019). The conservation value of “green spaces,” which are largely defined as any open vegetated area of nature amongst urban development (Taylor and Hochuli, 2017), are therefore increasing. It follows then, that as human populations spread and development continues into natural habitats, the trajectory of native flora and fauna may depend on sympathetic management that accommodates their needs in human dominated landscapes (Ives et al., 2016; Soanes and Lentini, 2019).
Areas of habitat that support wildlife in novel urban ecosystems are typically small and disconnected (Gehrt, 2010), potentially constraining prey within the ranges of predators (Gese et al., 2012), and increasing inter- and intra-specific competition (Kim et al., 2004). This may put additional stress on small prey species and impede their ability to persist in novel urban ecosystems. Some prey taxa can alter their foraging patterns to mitigate the stressors of predation (Brown and Kotler, 2007), human disturbance (Valcarcel and Fernández-Juricic, 2009), and resource competition (Mitchell et al., 1990; Yunger et al., 2002). However, as such stressors often occur simultaneously in novel urban ecosystems (Fardell et al., 2020), responses and trade-offs by prey to maintain fitness are likely to be complex. Understanding these stressors and how prey animals respond to them is an important goal for the conservation management of urban biodiversity.
Human activity can increase predator activity in urban areas by supporting introduced predators, including pet dogs (Canis familiaris) and domestic cats (Felis catus; Woods et al., 2003; Morgan et al., 2009; Young et al., 2011; Doherty et al., 2017). Human activity can also increase native predator activity via attraction to supplementary food sources (Newsome et al., 2015), and to the prey utilizing urban habitats (Fleming and Bateman, 2018). Resultantly, prey may gain more introduced and/or native predators and experience increased encounter rates with them in novel urban ecosystems. Human activity in itself also creates further stressors that are analogous to predator pressures (e.g., Frid and Dill, 2002; Rehnus et al., 2014; Patten and Burger, 2018). High human activity may even deter some wild predators (Suraci et al., 2019) via the “super predator” effect (Darimont et al., 2015), and provide a “human shield” for prey or smaller predators (Leighton et al., 2010; Kuijper et al., 2015). As stressors imposed on prey by human activity and increased predator activity have the potential to be additive, they could result in increased risks to the survival of some prey species in urban habitats (Fardell et al., 2020).
Strong predation risk, or equivalent pressures exerted from human activity, can alter the foraging routines of prey species. This primarily occurs through stress-induced energy exhaustion (i.e., the predation stress hypothesis: Boonstra et al., 1998; Clinchy et al., 2004; Romero, 2004) or foraging compromises that reduce nutrition intake (Brown and Kotler, 2004; Clinchy et al., 2016), and both ultimately result in poor health and low reproduction. In combination, predators (or predator like pressures) and food resource availability can control ecosystems and affect their stability. Such impacts are strongest when food resources are depleted and predation risk is greatly increased (i.e., the predator-sensitive food hypothesis: Sinclair and Arcese, 1995). The restricted size and possibly increased competition and predation conditions of novel urban ecosystems increase the likelihood that such control could occur. The extent, however, would depend on the use of supplementary food, water, and shelter resources by both predators and prey, as well as how they use the natural habitat components.
Understanding which habitat components are associated with the risks of encountering fear inducing stressors, like predators, when foraging, should allow for mapping “landscapes of fear” and hence the identification of safe areas for prey species (Jones et al., 2016; Bleicher, 2017; Fardell et al., 2020). The landscapes of fear concept postulates that prey perceive microhabitat patches associated with high and low predation risk (Laundré et al., 2001, 2010; Shrader et al., 2008; van der Merwe and Brown, 2008). This concept provides a useful framework for understanding and mitigating the twin stressors of increased predators and human disturbances, as it suggests that urban food webs could be maintained through habitat component, or vegetation, management. For example, appropriate vegetation management such as increasing native vegetation and/or understorey volume may increase safe-site foraging opportunities (low predator/human encounter risk), as well as, increase invertebrate food sources for secondary consumers, and increase habitat suitability for a broad range of wildlife (Andruskiw et al., 2008; Gorini et al., 2012; Threlfall et al., 2017). Understanding how small prey animals use habitat components when foraging in urban environments is, therefore, an important step to drafting practical wildlife conservation options.
The aims of our study were twofold. Firstly, we sought to investigate whether small prey animals, restrict their foraging in proximity to predators and/or human activity, as would be expected in a landscape of fear. Secondly, we sought to identify habitat components that may be utilized to reduce the impacts of such stressors, especially any that could be managed to support native wildlife in urban ecosystems. We were particularly interested in small mammal responses, as they are more restricted in urban habitats due to their movement ranges. We carried out surveys along an urban disturbance gradient in coastal New South Wales, Australia. The gradient consisted of three environments: a green space remnant forest patch between houses and a sports oval (“close environment”), a heavily vegetated empty plot of state-owned land that abuts a conservation area and is bordered by roads (“mid environment”), and a relatively undisturbed remnant forest within a state conservation area (“far environment”). We tested three predictions:
1) Proximity to a predator and to human disturbances will influence foraging decisions associated with habitat components across the three environments.
2) Some habitat components will be perceived as less stressful for foraging, as indicated by differences in habitat use when foraging under natural conditions compared to under the experimental stressors of introduced predator and/or human disturbance cues.
3) Responses to (1) and (2) will differ according to proximity to human development along the urban disturbance gradient.
In general, we expected small prey animals to maximize foraging effort under conditions they perceived to be safe, such as, away from naturally occurring predator and human disturbance cues, and where habitat components afford the greatest chance of detecting and avoiding approaching predators/people, thus reducing risk. We anticipated that disturbance cues would diminish from the close to the far end of the urban gradient, but also manipulated disturbance cues experimentally to better understand animal responses should the disturbances naturally increase.
Our study was conducted in the suburb of Whitebridge, in the Lake Macquarie district of New South Wales, Australia. Details are also given in our previous study in this area on the movements of pet cats (Fardell et al., 2021). This area was chosen as it is dominated by National Parks and Conservation Areas (49.49%), but also includes low density environmental living (12.2%), low density urban residential (16.01%), medium density urban residential (5.84%), and recreation areas (5.48%). Whitebridge has a population of 2,612 people in an area of 5.356 km2 (Australian Bureau of Statistics, 2016). In our study, in 2019, temperatures ranged from 9°C in winter to 42°C in summer; annual rainfall was 100 mm, with the largest falls in February and June (Bureau of Meteorology Australian Government, 2021). At the time of study, the urban residential areas in Whitebridge and the connecting suburbs were interspersed with numerous green spaces, including corridors and large pockets of heavily vegetated state-owned land. Most of these green spaces connect to Glenrock State Conservation Area (GSCA) or to Awabakal Nature Reserve (ANR), although they were often intersected by roads. The GSCA spans 534 ha along the coast and links to the large ANR in the south. The GSCA has a floristic diversity index of 72.26 species per ha, placing it in the top five conservation areas in the Sydney Basin (Department of Environment Climate Change and Water [DECCW], 2010). The conservation area, nature reserve and many of the green spaces are remnant vegetation patches consisting of wet and dry sclerophyll forests and rainforests that pre-date European disturbance and vegetation changes (Department of Environment Climate Change and Water [DECCW], 2010; Bell, 2016).
These areas support a diversity of birds, reptiles, and terrestrial and arboreal mammals, including five threatened bird species and four threatened mammal species (Department of Environment Climate Change and Water [DECCW], 2010). The apex native predator throughout this area is the powerful owl (Ninox strenua, weight: 1,240–1,700 g, wing span: 112–135 cm; Department of Environment Climate Change and Water [DECCW], 2010). The only native mesopredators are two large reptiles, the lace monitor (Varanus varius, weight: 14 kg, snout-vent length: 76.5 cm) and diamond python (Morelia spilota spilota, weight: 15 kg, size: 2–4 m; Department of Environment Climate Change and Water [DECCW], 2010). Both of these species consume small mammalian prey, but occasionally consume those up to the size of possums (700–4,500 g) and bandicoots (500–3,100 g; Slip and Shine, 1988; Jessop et al., 2010). The GSCA has high recreational value due to the many tracks used by horse riders, walkers, runners, mountain bikers, and for regular competition events of these activities, each of which has the potential to alter wildlife activity (Gander and Ingold, 1997; Frid and Dill, 2002; Larson et al., 2016; Bleicher and Rosenzweig, 2018). The prevalence of invasive species, including feral or pet domestic cats (weight: 2.5–7.3 kg, snout-vent length: 38–74 cm) and the European red fox (Vulpes vulpes, weight: 4–8.3 kg, snout-vent length: 57–74 cm) pose additional potential threats to native fauna (Lake Macquarie City Council [LMCC], 2012). The Lake Macquarie district is one of the fastest growing areas in the Hunter Region (Lake Macquarie City Council [LMCC], 2011), and as such, land development represents an additional and potentially severe threat to native wildlife, increasing the need for effective management of biodiversity in the novel urban ecosystems.
Our study area comprised three “environments” that internally were largely uniform, as described below and depicted in Figure 1.
1) The “close environment” was a patch of dry sclerophyll forest, in a 58,600 m2 green space, that was surrounded by houses on three sides and a large grass sports oval that was in use day and night on the fourth side. It had a dry creek bed within the study transect and a wet dam near to it. This remnant forest was dissected by recreational tracks that surrounded our survey transects. Each track was used regularly by walkers and cyclists with and without dogs. An open grass powerline corridor lay between the green space and houses to the north, and led east to the second environment but was intersected by a moderately used two-lane road.
2) The “mid environment” was dry sclerophyll forest within an empty block of state-owned crown land that was contiguous with the 534 ha GSCA on the eastern side. The nearest regularly used single lane road was immediately to the south; a busier two-lane road was located to the west (toward the close environment) and had houses behind it. A heavily used recreation track occurred on the north side of the study site.
3) The “far environment” was a remnant rainforest patch along a narrow and shallow ephemeral creek line, in the 534 ha GSCA. It was surrounded by extensive dry sclerophyll forest on all sides. The closest roads were those near the mid environment. A little-used fire trail ran near the southern border of this site and extended between the two roads. The area between the mid and far environments and the two-lane road was more vegetated than depicted in Figure 1, with dry sclerophyll forest covering much of the area north of the mid environment and a dense high-grass landing covering the area south of the far environment, up to the two-lane road.
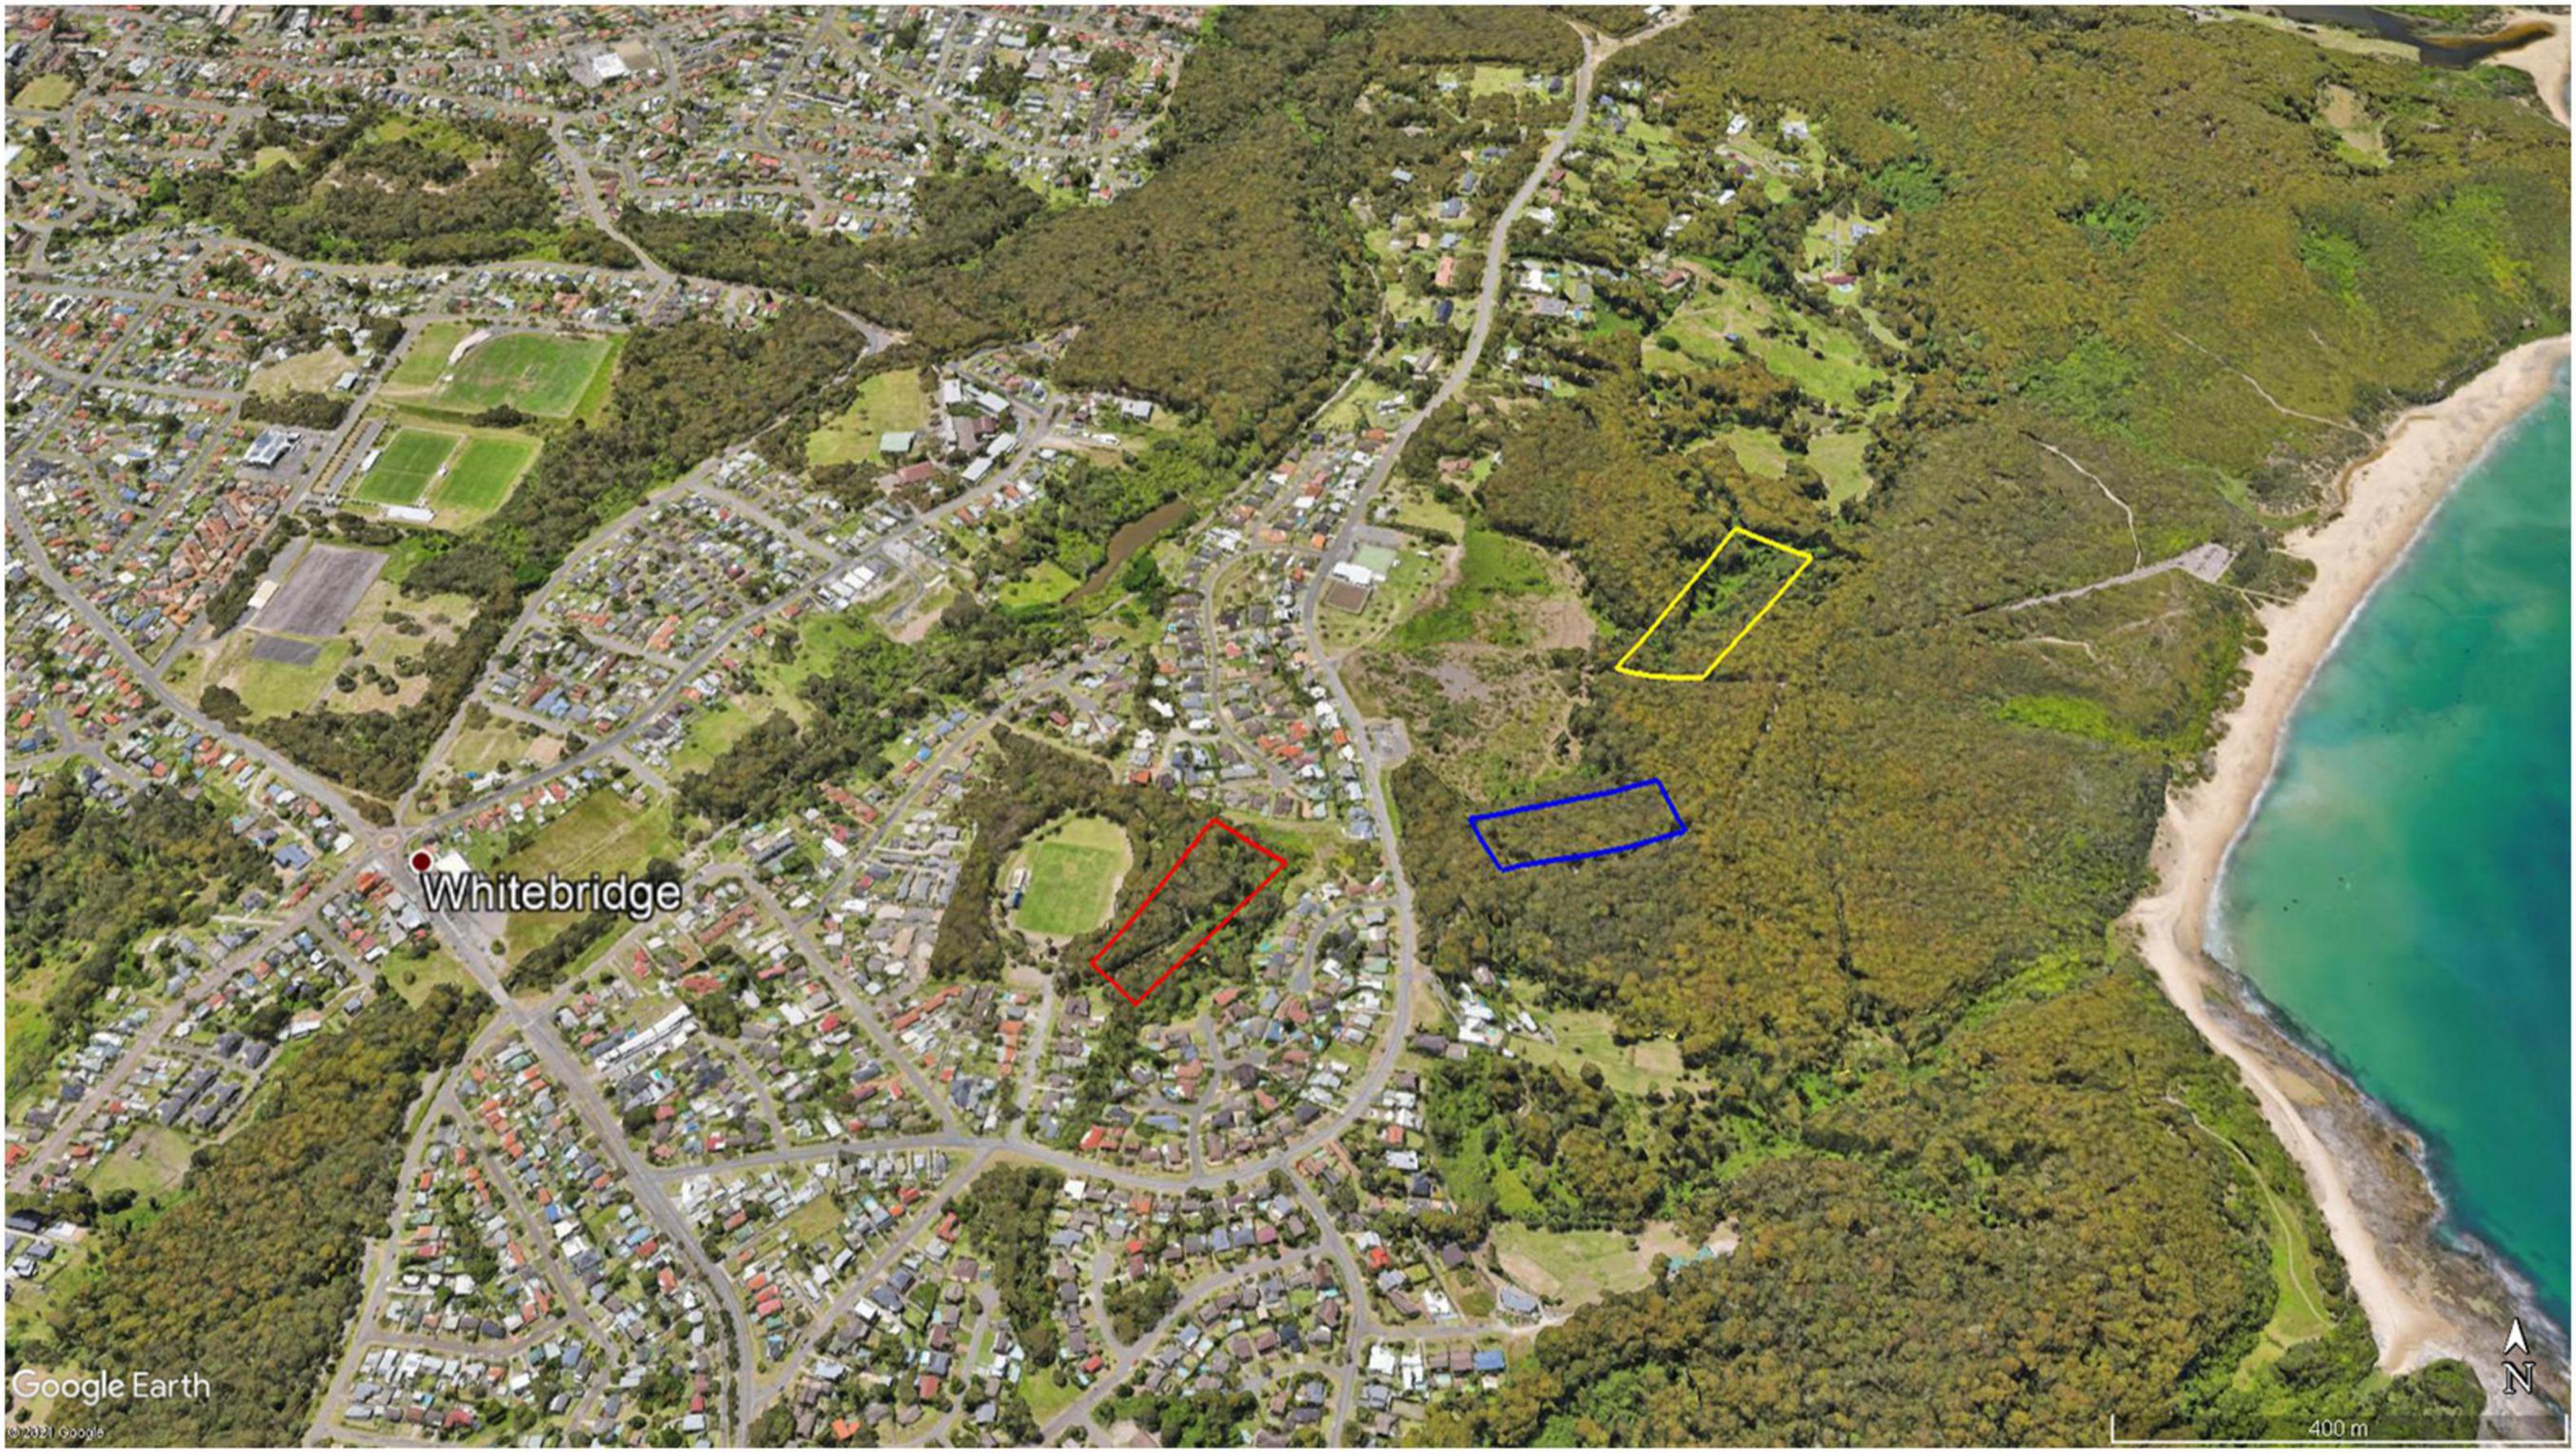
Figure 1. Map depicting the broad area of each study site, within the suburb of Whitebridge, New South Wales, Australia. The “close environment,” an urban green space, is depicted in red. The “mid environment,” a state-owned heavily vegetated patch of land on the edge of a conservation area, is depicted in blue. The “far environment,” a remnant rainforest in a conservation area, is depicted in yellow. Glenrock State Conservation Area is the large forested area between the beach and the main road. Map sourced from Google Earth.
The monitoring of wildlife in situ was conducted under animal ethics approval from the University of Sydney (2017/1275), and under a New South Wales Scientific License (SL102024). Small mammal foraging behavior was examined using nocturnal giving-up density (GUD) trials (Brown, 1988) in each environment. Standardized GUD trials assume that optimal foraging behavior occurs and that the harvest rate depletes as more food is consumed, and thus the forager should quit when the benefits of harvesting no longer outweigh the costs (Brown, 1988). The costs include metabolic energy expended in foraging, predation risk, and the missed opportunity costs of not foraging elsewhere (Brown, 1988). The amount of food left in a food patch (i.e., the GUD), will be greater in patches where foragers perceive more risk.
Survey methods are summarised in Figure 2. Broadly following van der Merwe and Brown (2008), GUD stations (food patches) were set ∼10 m apart with a total of 24 stations in a grid of 6 × 4 or 8 × 3, depending on what the area and microhabitats could accommodate in each study environment. The GUD stations were set in different microhabitats of a tree, log or sparse to moderate low vegetation, though there was some variation in the vegetation/cover type between the three environments. Each GUD station comprised a feeding tray; a clear, rectangular plastic tray buried ∼10 cm deep into the ground with ∼3 cm left above ground level. The trays were half-filled with 2 L of medium-grade vermiculite that was replaced each survey session to reduce any risks of olfactory contamination. A standardized amount of food, 20 mealworms (Tenebrio molitor larvae), was mixed in the vermiculite each evening an hour before sunset to avoid interrupting the foraging activities of the target small mammals. This combination of container dimensions, food and substrate amounts was successful in pilot trials. To assess foraging behavior and identify small mammals, and other animals that used the feeding trays, we used Scoutguard infra-red motion-sensor cameras that were set to take continuous 60 s videos upon being triggered. Cameras were secured to a tree or metal post hammered into the ground at a position of ∼20 cm above ground on a ∼10° angle (Fleming et al., 2014), and at a distance of 150–200 cm from each feeding tray. Cameras were turned on when GUD stations were set up each afternoon, and off when they were checked the next morning.
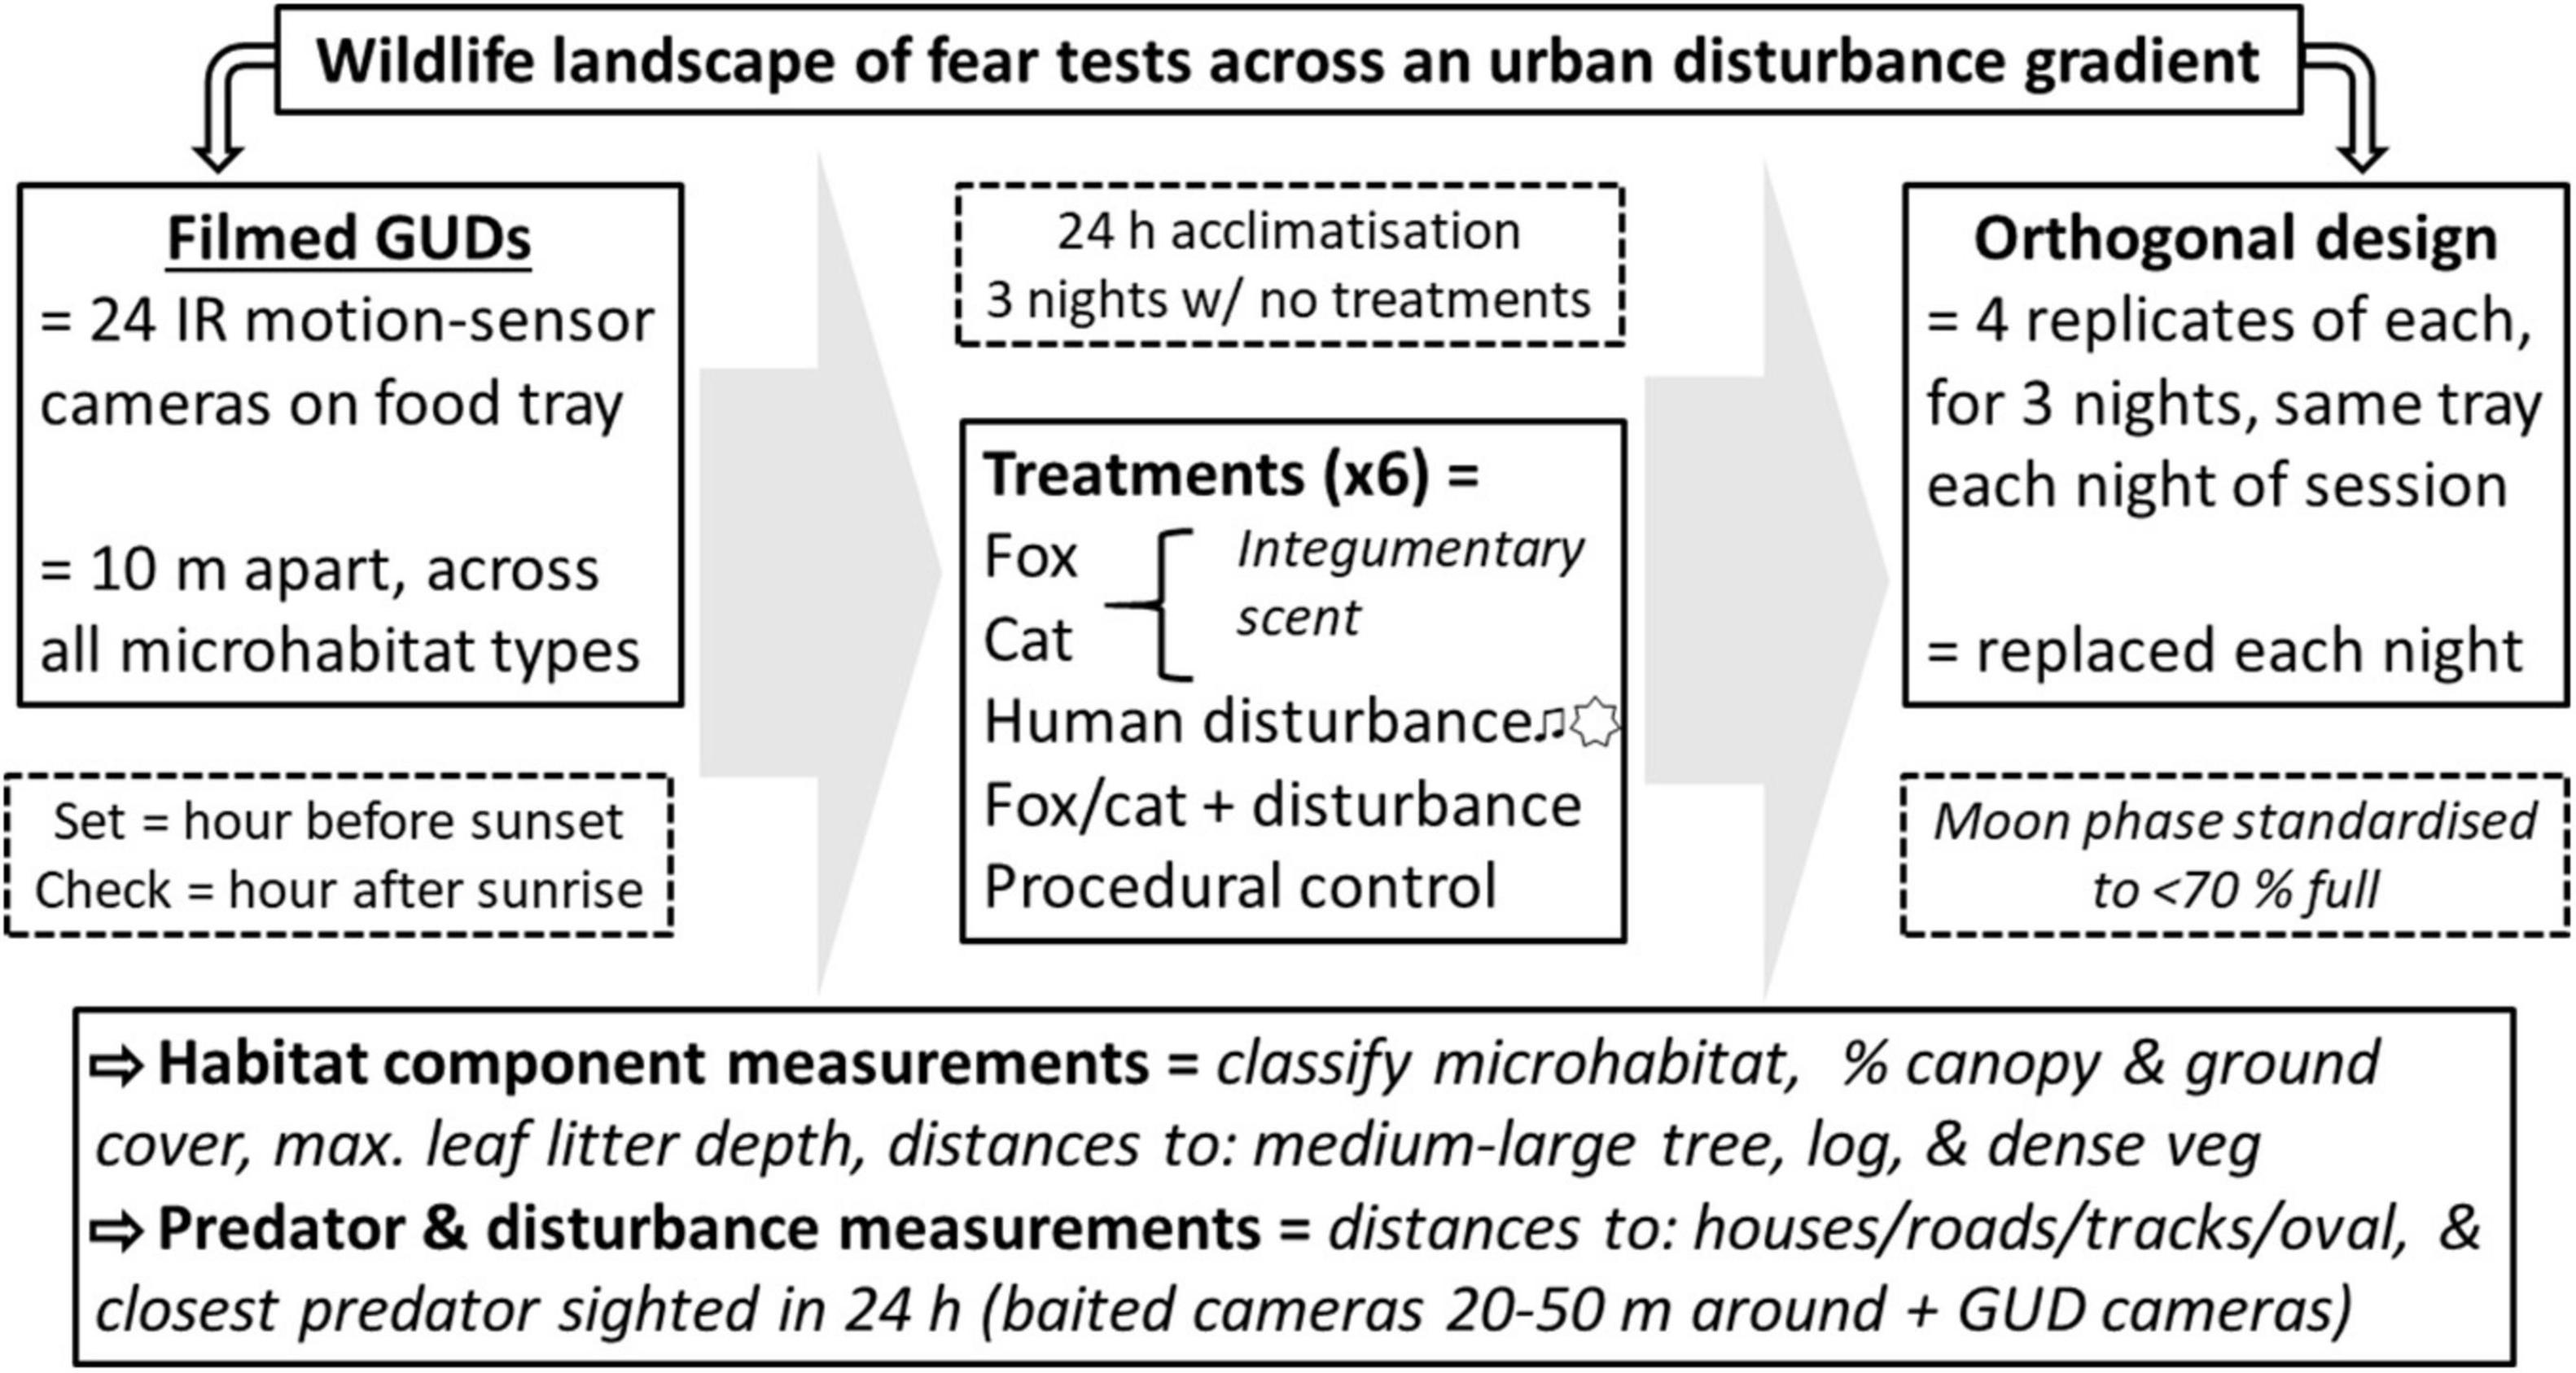
Figure 2. Summary of the survey methods employed to observe small prey animal landscapes of fear across an urban disturbance gradient, relative to habitat component use and distances to the stressors of predators and human disturbances. Measurements and filmed giving-up density (GUD) trials were conducted across three locations (“close environment,” “mid environment,” and “far environment”) along an urban disturbance gradient for three nights of pre-treatment conditions and three nights of treatment conditions replicated across four survey sessions in 1 year (n = 288 per GUD trial). Treatments included: red fox scent, domestic cat scent, 12 h of continual sound and light as cues for human disturbance, red fox with human disturbance cues, domestic cat with human disturbance cues, and a procedural control.
Trials were conducted in each of the three study environments independently, for four sessions between January and September 2019 (n = 288 for each environment). On the first night of each session, cameras were turned on and a peanut butter-honey-oat bait ball was crumbled on top of a closed GUD tray to allow animals to acclimatize to the set-up, and to determine which species were present in the area compared to those that used the GUD stations. Trials then proceeded for three consecutive nights, under natural “pre-treatment” conditions, with stations opened and set with 20 fresh mealworms in fresh vermiculite each day to establish baseline results. Immediately after, “treatment trials” were run for a further three consecutive nights to assess the effect on GUDs of increased predator and human disturbance cues. There were six treatments: (1) “fox”— integumentary scent of red fox; (2) “cat”— integumentary scent of domestic cat; (3) “human disturbance”— 12 h of music and spoken-word playback and diffused torch light pointed at the ground; (4) fox with human disturbance cues combined; (5) cat with human disturbance cues combined; and (6) procedural control— non-scented towel, with the addition of a torch and speaker unit that were both turned off. Treatments were applied to GUD stations in a six-factor orthogonal design, with four replicates per treatment, per night. Treatment GUD stations were re-set with new treatment materials, including fresh vermiculite, each day. Treatment allocation was randomized for each of the four sessions at each environment, and was replicated over the three nights of each session (n = 48 for each treatment at each environment). During all trials, each GUD station was set every day within an hour of sunset, and was checked and closed the following morning within an hour from sunrise. Moon-phase was standardized across trials to exclude periods of 70 to 100% full moon, as this can affect foraging behavior in small mammals (Navarro-Castilla and Barja, 2014). Extreme weather events, such as strong winds and high rainfall, were also avoided.
Prior to the commencement of the study the ∼10 m distance between GUD stations was tested for independence of the treatments; neither the light nor sound could be detected by human observers from any neighboring stations. Integumentary predator odors were selected as they are more representative of high-risk odor cues that would be encountered by small mammals in the field (Bytheway et al., 2013). Fox and cat odors were collected by placing cotton towels in the sleeping area of each target animal, at private residences, for 2 weeks. Upon collection, the towels were handled using fresh nitrile gloves for each scent and placed in zip-lock bags that were then stored in a freezer (-20°C) until use. Freezing reduced the chance of the scents losing valance (Hoffmann et al., 2009). Clean towels subject to the same handling and storage techniques were used as controls. Before use in the trials, each towel was cut into 4 cm × 10 cm strips using clean gloves, a sterilized surface and equipment for each scent. A strip of towel was placed across the top middle (shortest distance) of the appropriate GUD trays, using fold-back clips to secure it to the edge of the tray, with clean gloves again used for each scent to avoid any cross-contamination.
To determine whether or not habitat influenced foraging by small prey animals, we measured habitat components in each of the three environments, at each GUD station. Microhabitat was categorized (tree, log, snag, open, dense low strata vegetation, or vines and grasses). The percentage canopy cover and ground cover were measured (from head height at the GUD tray using Canopy App; University of New Hampshire). The maximum leaf litter depth was determined (by inserting a ruler in the same six points within a 1.5 m square around the GUD). Distances from each GUD station to the closest medium-large tree (≥20 cm dbh), log and dense ground-level vegetation were taken (either by tape-measure, or using the Moasure App; 3D Technologies). To determine the impact of human activity on small prey animal foraging, we measured distances from each GUD station to the human disturbances of houses, tracks, roads, and sports ovals (either by tape-measure, the Moasure App; 3D Technologies, or by GPS with ArcMap 10.7). To assess the effects of predator presence on small prey animal foraging, we identified predators that were active during the GUD trials using six Reconyx motion sensor cameras set 20–50 m from the perimeter of each site. The cameras were fixed to trees 1 m above ground at a 10° downward angle. Within the field of view of each camera we crumbled a peanut butter-honey-oat bait ball and sprinkled a scent lure of fish oil on the ground and leaf litter. Both the bait and fish oil were reapplied after 3 days. The cameras were set to take a quick-burst of 10 images when triggered, both day and night, over the duration of each trial. Following review of these images, and from sightings of predators recorded on the GUD station cameras, we measured the distance from each GUD station to the nearest predator within a 24-h period, using ArcMaps 10.7. To consistently determine the species recorded, one of us (LF) scored all videos and photos.
We used regression decision trees (CARTs) to quantify the effects of experimental treatments and habitat components on the collective foraging decisions (GUDs). Developed by Breiman et al. (1984), CARTs use recursive partitioning to split data into groups based on similar response values using the best explanatory variables to minimize the total sum of squared estimate errors (SSE); each split depends on the splits made previously (Boehmke and Greenwell, 2019). The most important variable explaining responses is identified in the first split, as it produces the largest reduction in SSE; other variables diminish in importance down the tree to the terminal nodes (Boehmke and Greenwell, 2019). Although simple in design, CARTs robustly describe variation in response variables based on numerous explanatory variables (De’ath and Fabricius, 2000). The advantages of CARTs, besides being easily interpretable, are that they are non-linear (but can approximate linear relationships) and they can handle mixed data formats (multiple types of covariates), missing data, and collinearity (De’ath and Fabricius, 2000; Boehmke and Greenwell, 2019).
Ecosystems are in constant flux, especially novel ones such as urban ecosystems. Thus, we fitted descriptive decision trees, not predictive ones (De’ath and Fabricius, 2000). We fitted CART-based regression trees using the rpart package (Therneau and Atkinson, 2019) in R (R Core Team, 2020) to test our three predictions. Regression trees were pruned by finding the lowest error associated with the minimum number of data points required to split and the maximum number of internal nodes between the root and terminal nodes, via the application of a grid search of all possible combinations (Boehmke and Greenwell, 2019). To ensure that trees were not over-fitted, tree size cost-complexity was assessed via 10-fold cross validation to confirm that trees with the smallest error were selected (Boehmke and Greenwell, 2019). We initially fitted individual regression trees for each of the three study environments using the natural (pre-treatment) GUD results as the response variable, and the explanatory variables: distance to a predator, houses, a path, the nearest road, and the sports oval (at the close environment only) to test our first prediction; and microhabitat, maximum leaf litter depth, canopy cover, ground cover, and distances to nearest log, nearest tree, and nearest dense vegetation to test our second prediction. Next, we built trees using the treatment GUD results with the above-listed explanatory variables and the treatments as additional explanatory variables (cues of fox, cat, human disturbance, fox with human disturbance, cat with human disturbance, and control), as a further test of our second prediction. We then observed the patterns of data division in each of the decision trees for each of the three environments to test our third prediction and determine if the same variables were considered in similar ways along the disturbance gradient. In all analyses, data from the four sessional trials were pooled.
Habitat component measurements were within close range of one another for each environment, though there were some minor differences (Table 1). Distances to human disturbances were, as would be expected along the disturbance gradient, reduced at the close and increased at the further environments (Table 1). Distances to predators were within similar ranges across the environments, though at the mid and far environments predators were more often than not, not observed within a 24 h period, but at the close environment were more than often within 75 m of the GUD stations (Table 1). Potential prey species that ate from, observed, foraged around, or moved past the GUD stations in the three study environments totaled 7 mammal species and 9 bird species (Table 2). Not all visitors filmed at the GUD stations foraged in them, but most did (Table 2). Most species that were observed during the acclimatization period were also observed foraging at the GUD stations. The exceptions to this were red fox, lace monitor, and common ringtail possum (Pseudocheirus peregrinus) – each of which inspected the GUD stations occasionally but did not forage.
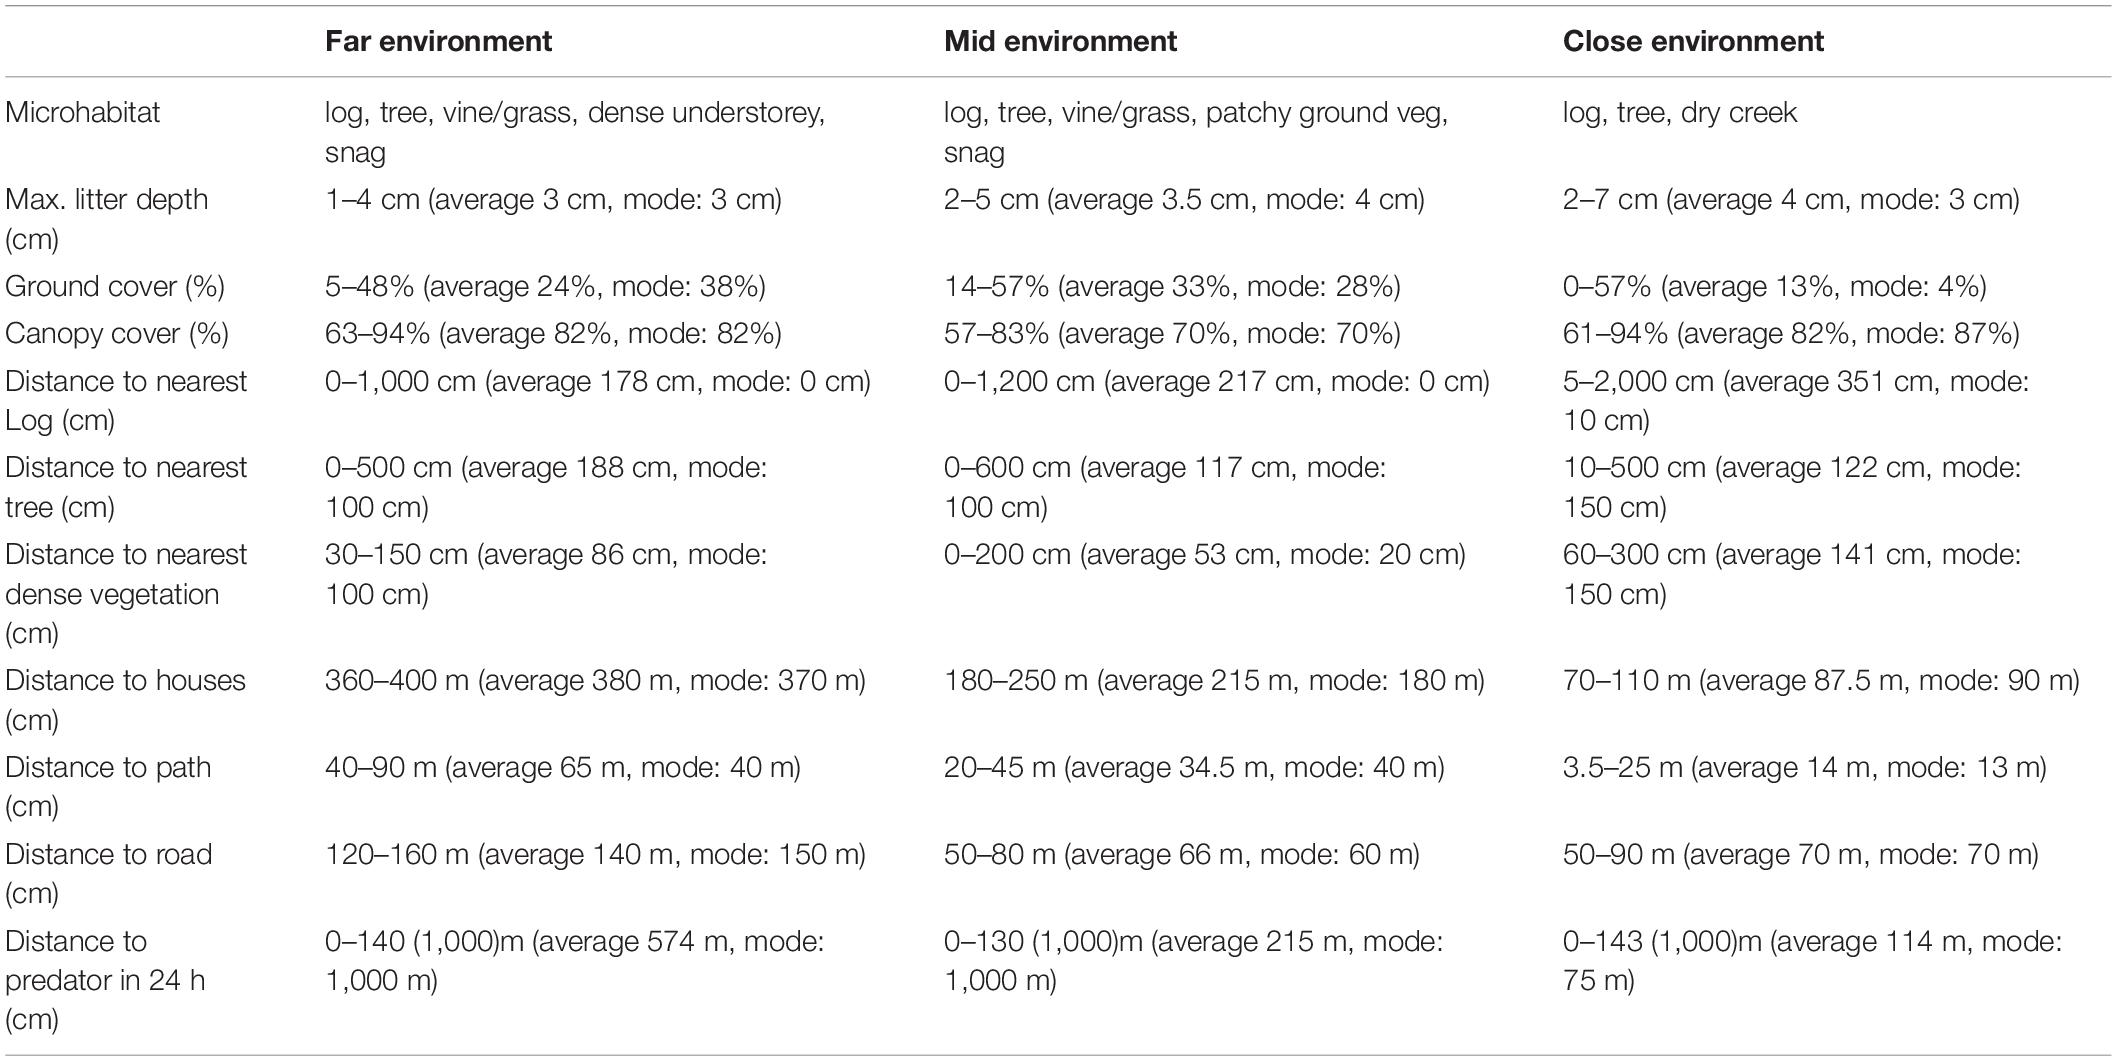
Table 1. Summary of the habitat component and distances to human disturbances and predator measurements, taken across three locations (“close environment,” “mid environment,” and “far environment”) along an urban disturbance gradient. The range (lowest to highest measurements), average, and mode (the value that appeared most often in the collected data) are given for each of the variables measured. The 1,000 m measurement given for the distance to predator was repeatedly recorded for 24 h periods in which a predator was not sighted in range of a GUD station at that environment. Therefore, the ranges outside of this measurement are given with this maximum in parentheses. The mid and far environments, with mode of 1,000 m for distance to predators, indicates that more often than not no predators where sighted within range of the GUD stations in these environments.
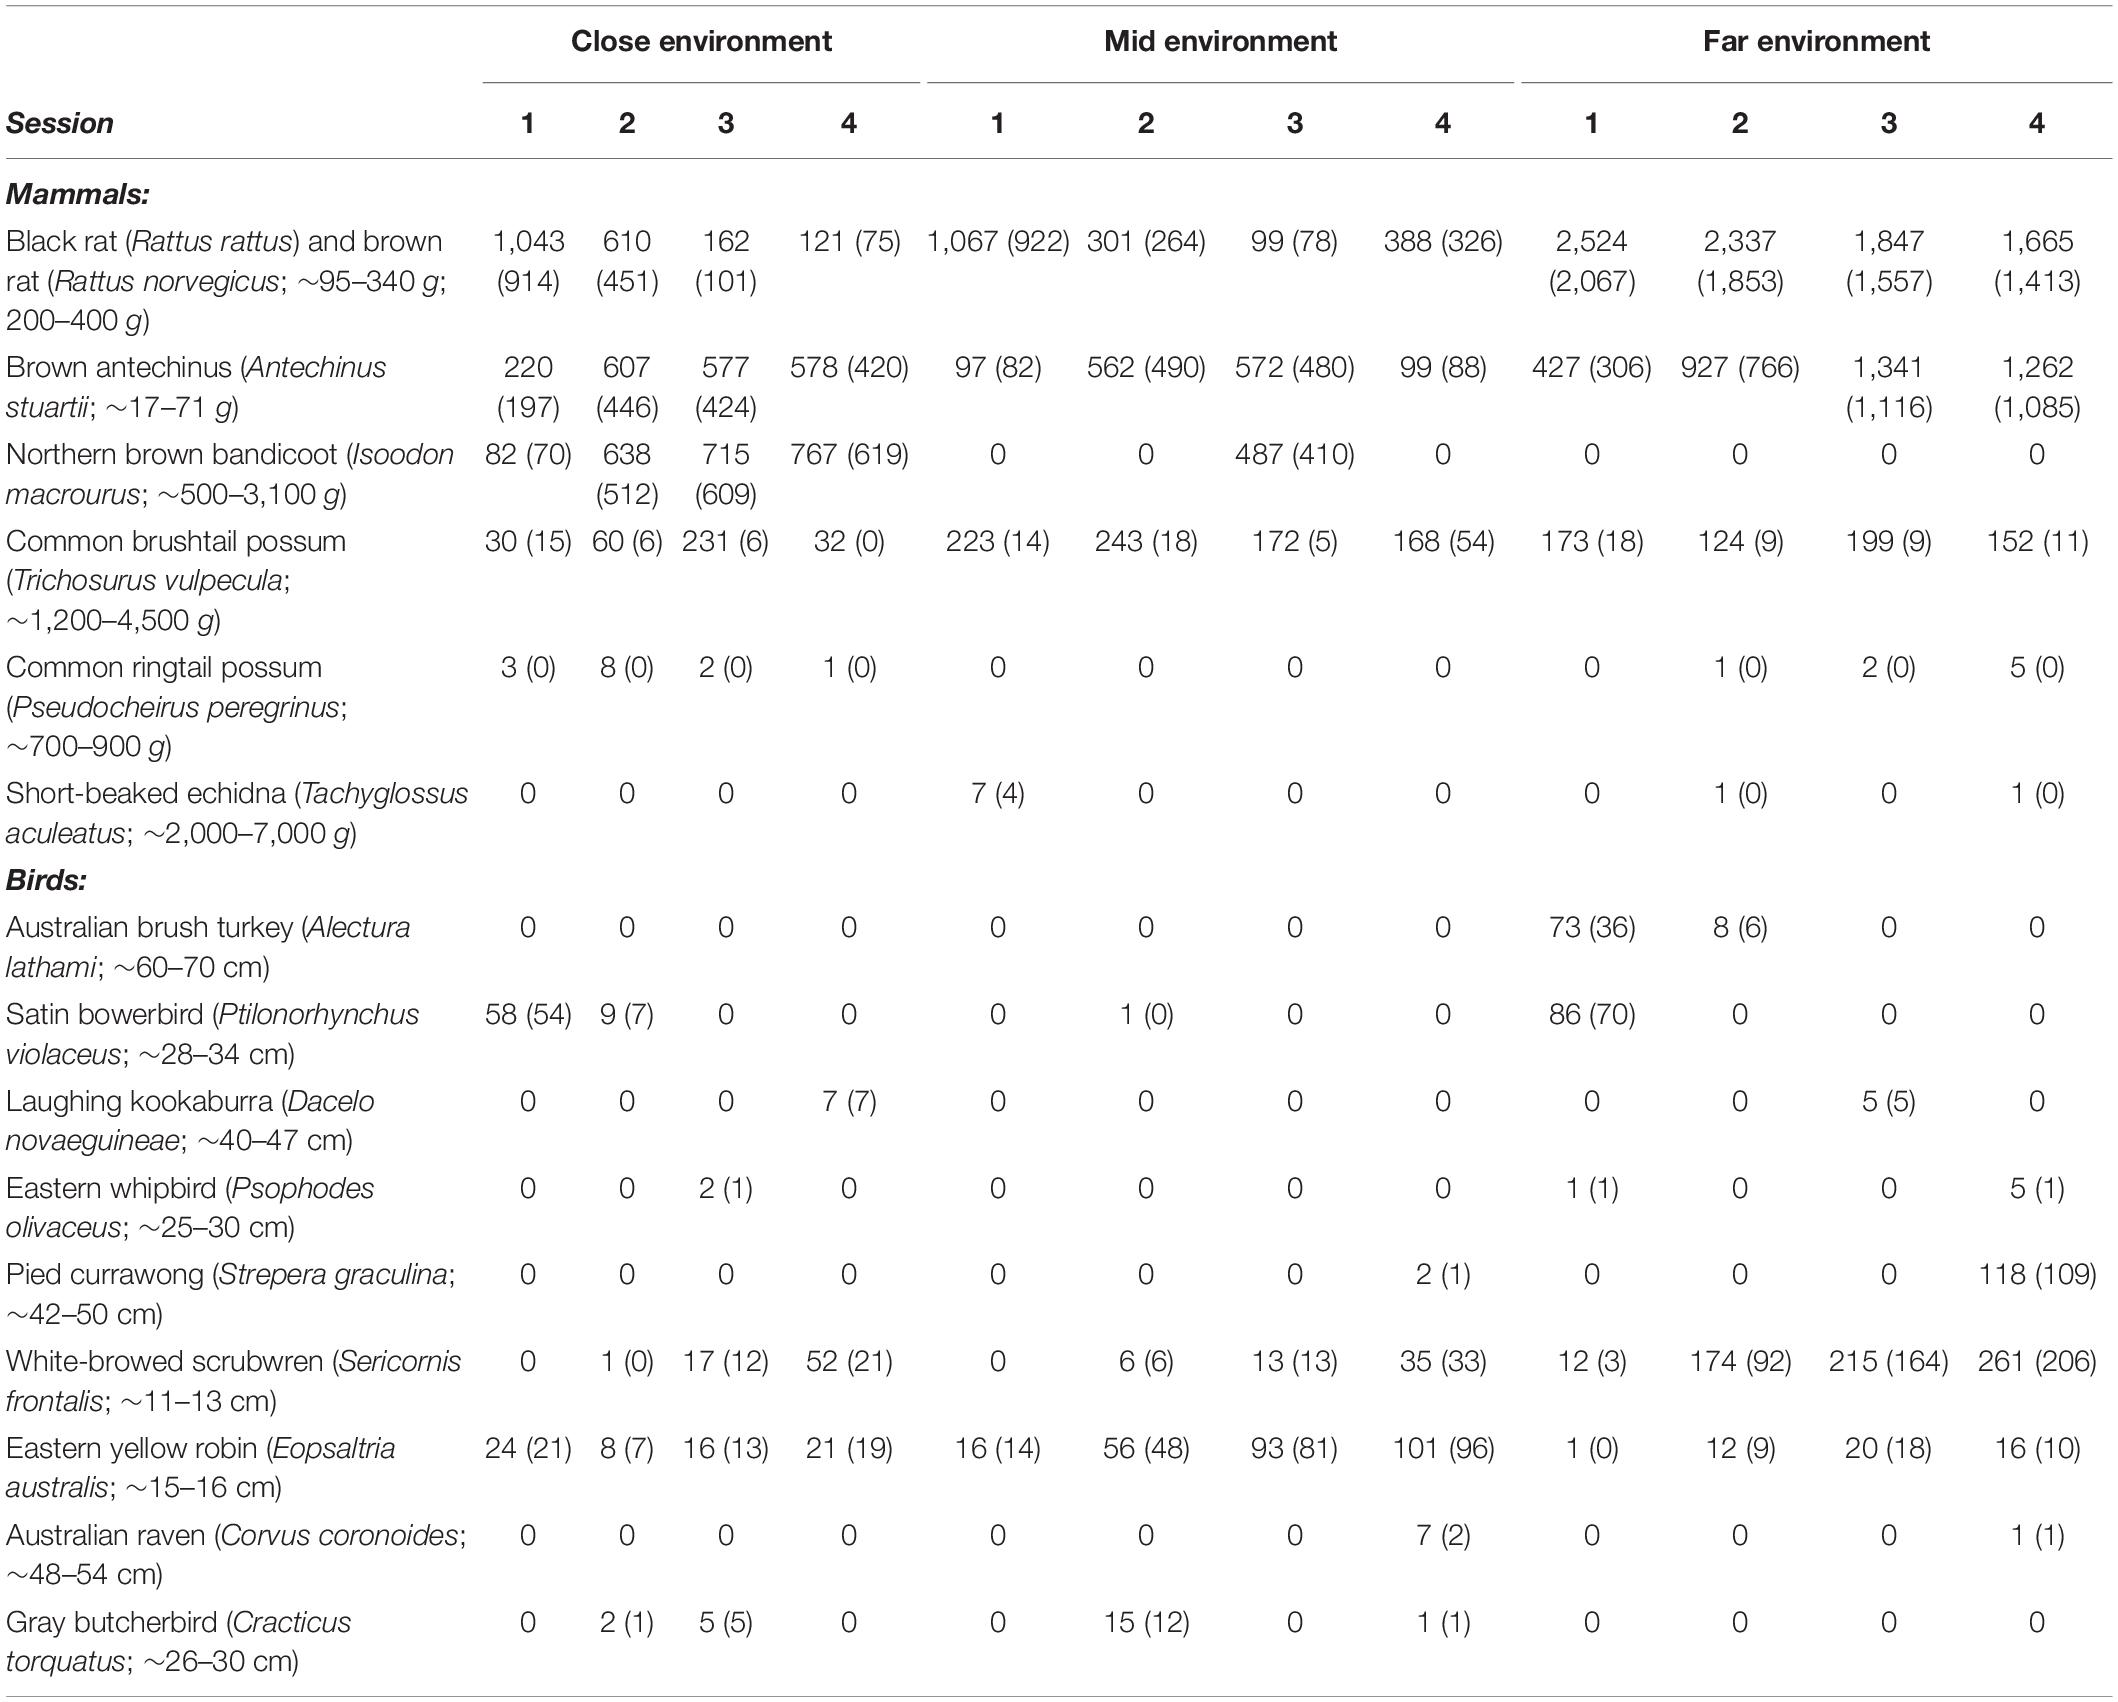
Table 2. The number of videos of potential prey species obtained using infra-red motion-sensor cameras at three locations (“close environment,” “mid environment,” and “far environment”) along an urban disturbance gradient for three nights of pre-treatment conditions and three nights of treatment conditions replicated across four survey sessions in 1 year. The numbers given in parentheses are the number of videos out of the total, given above, that involved foraging in the GUD feeding tray. The remaining number of videos were of the animals in various behaviors in the area surrounding the GUD tray. Weights of mammals are as recorded in Van Dyck et al. (2013). Sizes of birds are as recorded in Morcombe (2012). Additional videos scored were of passing predators, or animals under the acclimatization period.
The far environment recorded most GUD videos, followed by the close, then the mid environments (Table 3). The black rat (Rattus rattus), brown rat (Rattus norvegicus), and brown antechinus (Antechinus stuartii) were observed frequently in all environments every session, as was the common brushtail possum (Trichosurus vulpecula), albeit less frequently (Table 2). The northern brown bandicoot (Isoodon macrourus) occurred frequently during each survey session at the close environment, frequently during the third session only at the mid environment (Table 2), and only once during the acclimatization period (not shown in Table 2) at the far environment. The common ringtail possum was occasionally observed at the close and far environments, as was the short-beaked echidna (Tachyglossus aculeatus) at the mid and far environments (Table 2). Various bird species inspected the GUD stations and/or ate from them irregularly to an equivalent degree in the three environments (Table 2). As their GUD results could not be disentangled from the small mammal GUD results they are presented here together. The eastern yellow robin (Eopsaltria australis) was the most consistently observed bird species (Table 2). Ratios of video records of native to introduced mammals and birds that were observed foraging at the GUD station were different across the three environments (Table 3).
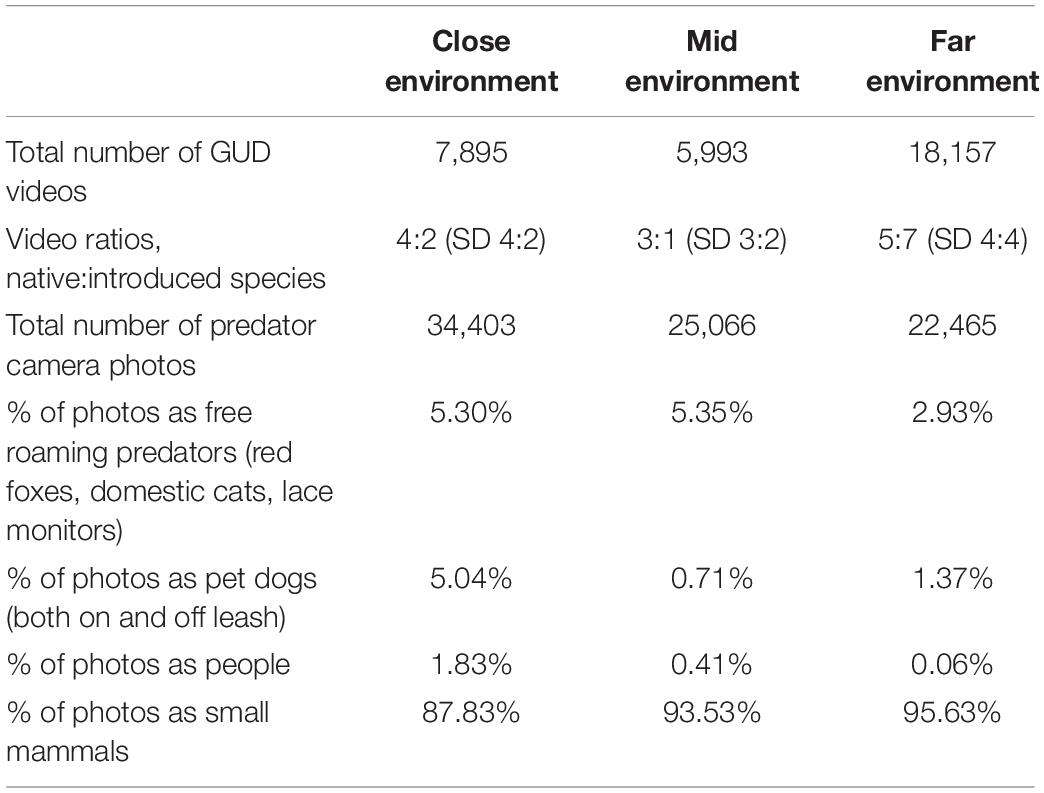
Table 3. The summary of the total number of GUD videos and baited predator camera photos obtained using infra-red motion-sensor cameras at three locations (“close environment,” “mid environment,” and “far environment”) along an urban disturbance gradient for three nights of pre-treatment conditions and three nights of treatment conditions replicated across four survey sessions in 1 year (n = 288 per GUD trial).
The close environment had the highest number of baited predator camera photos, followed by the mid, then the far environments (Table 3). Red foxes, dogs and lace monitors were ubiquitous; however, the latter was not observed on camera at the close environment but was observed on two occasions when setting up the study. Domestic cats, wearing collars and not (possibly feral), were observed in the close environment only, and on occasions both domestic cats and red foxes were sighted at the same locations within a 24 h period. Small mammals were observed the most on the predator cameras, followed by free roaming predators (red foxes, domestic cats, and lace monitors), then dogs (on or off-leash but accompanied by a person), and people (Table 3). The angle and height of both the GUD and baited predator cameras protected the identity of people from being captured, as only feet and in some cases up to below the knee were in frame of the cameras.
Under the pre-treatment conditions, reduced distances to a predator resulted in the lowest GUDs, and when houses were closer (<105 m) and canopy cover was not high (<85%), then reduced distances to predators (<97 m) again resulted in lower GUDs (Figure 3A). Increased distance to houses resulted in the lowest GUDs, when distances to a predator were small (<111.5 m; Figure 3A). In the treatment trials, short distance to a predator (<91.5 m) resulted in low GUDs, but further distances (>562.5 m) resulted in the lowest GUDs, with highest GUDs at intermediate distances; distances to disturbances were not influential under these conditions (Figure 3B).
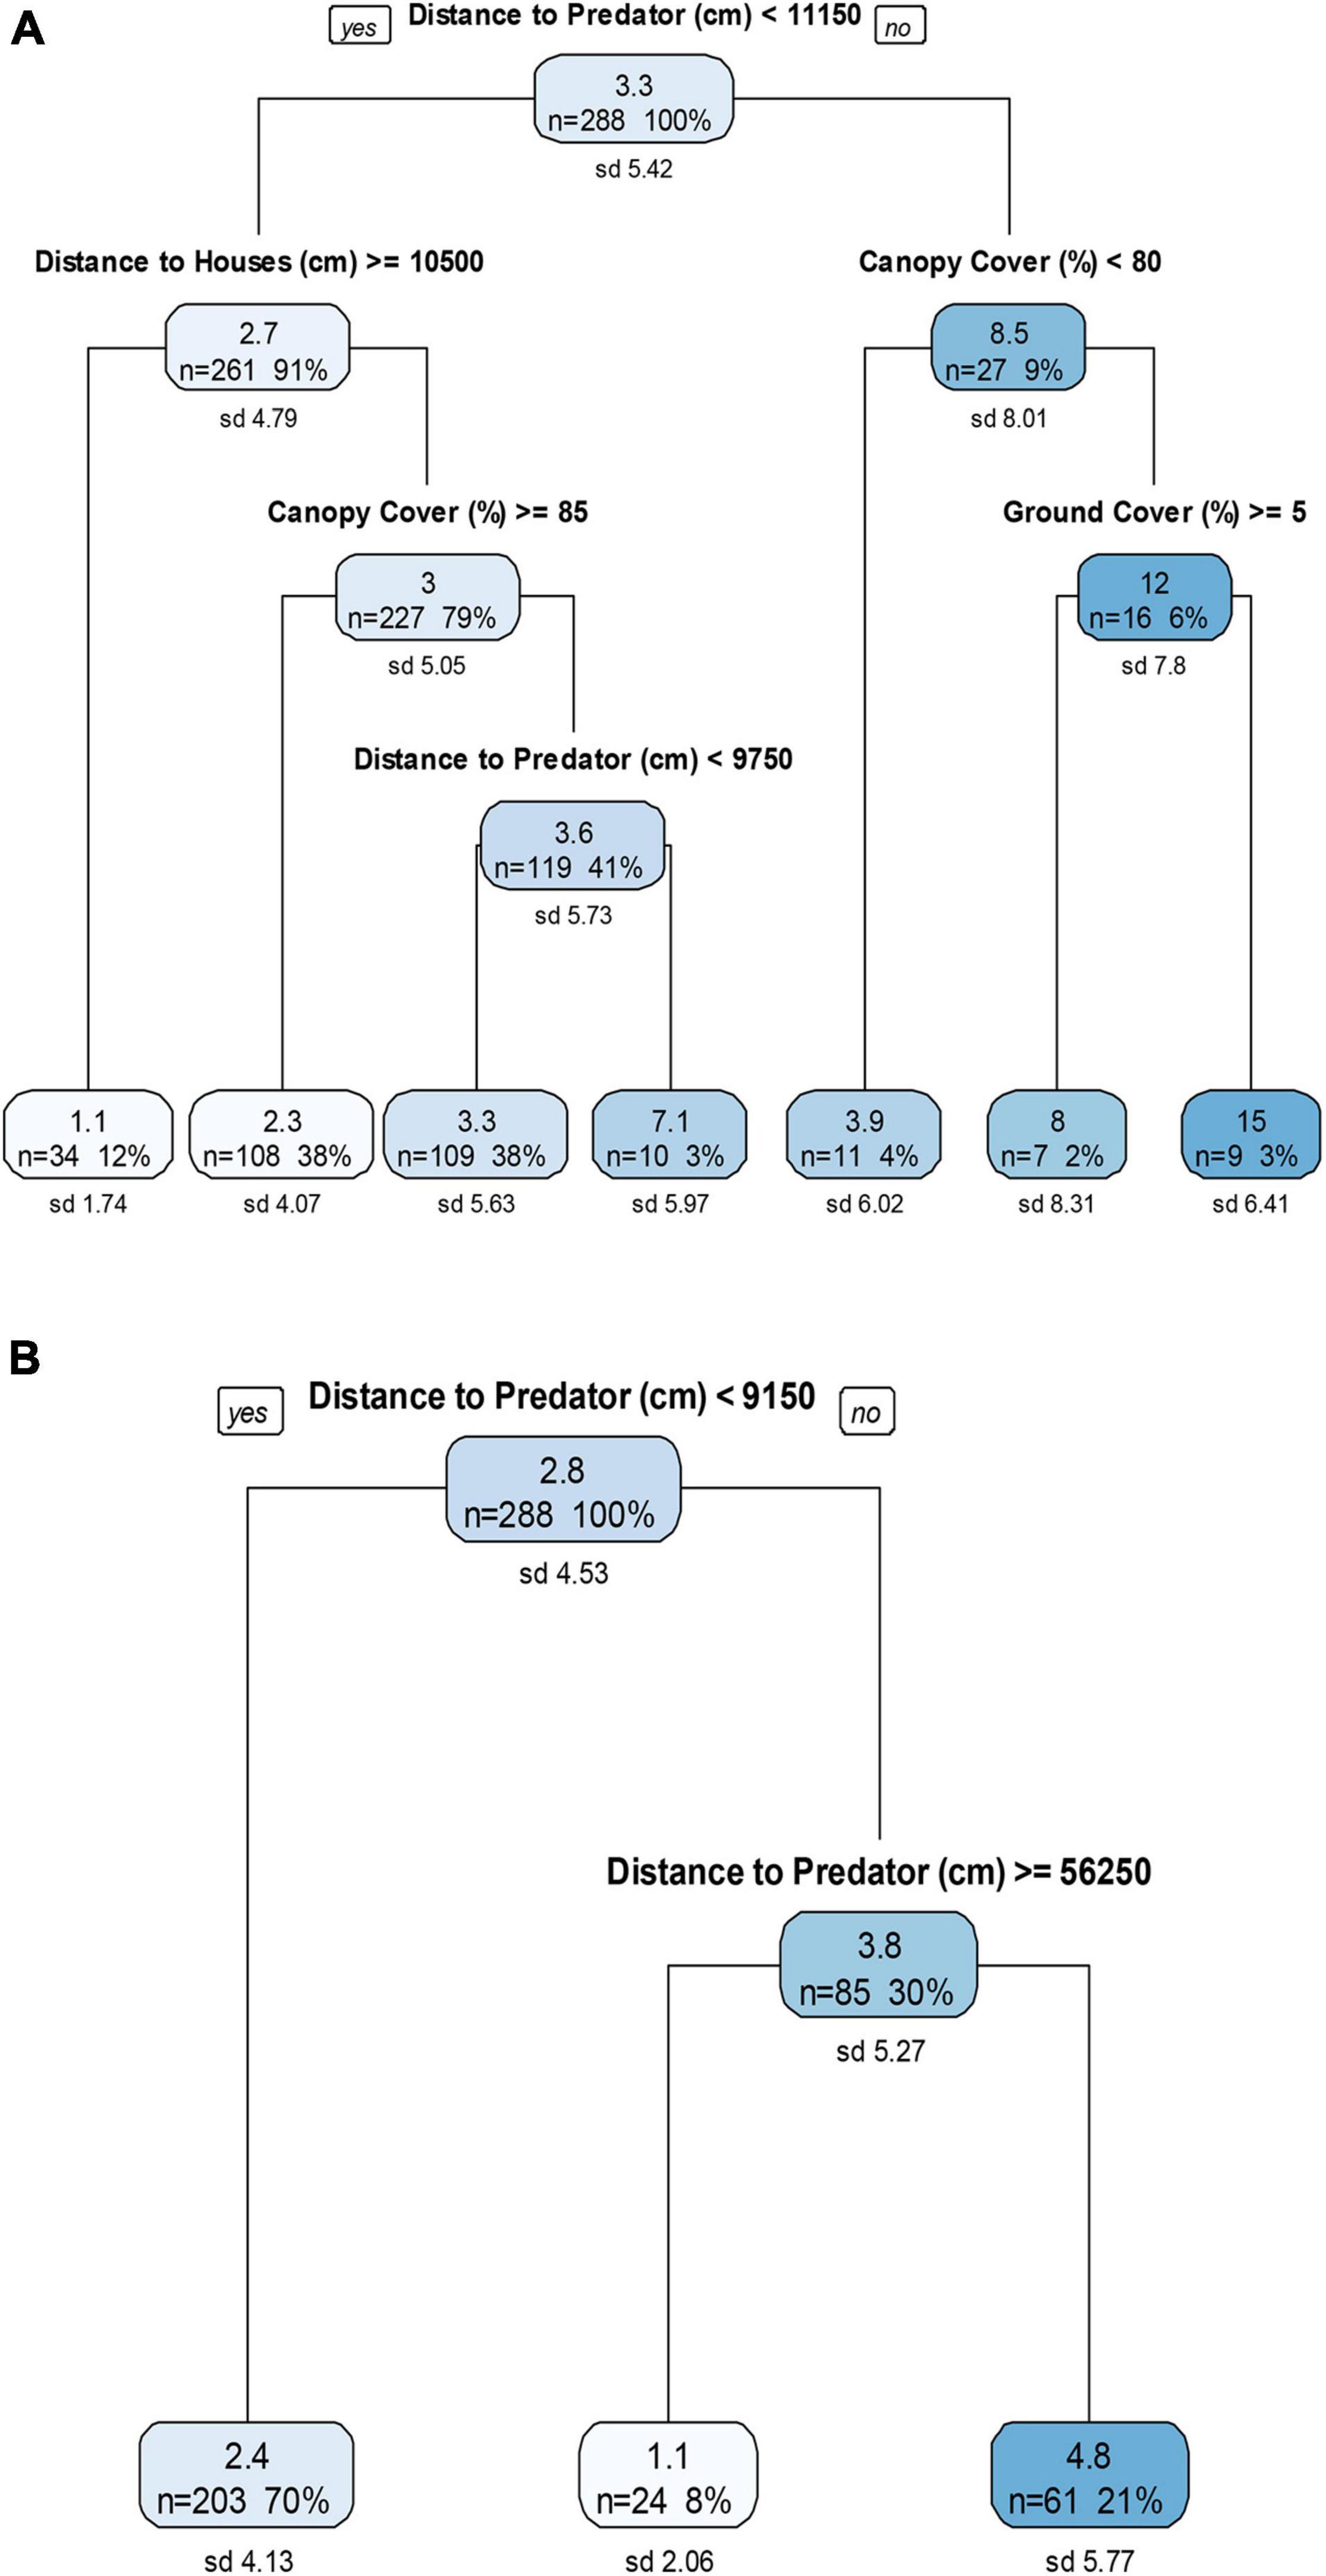
Figure 3. Descriptive regression decision trees for four sessions of three nights each of (A) pre-treatment and (B) treatment giving-up density (GUD) trials at the close environment, an urban-edge disturbed forest green space. The top number in each node is the GUD, the mean number of mealworms left in the tray (after ∼12 h nocturnal exposure). The number of GUD station surveys included in the data split at each node is given by the “n” number. The “%” value is its corresponding percentage from the full data set (n = 288). The standard deviation of the mean number of mealworms left at each node is given by the “sd” value. The six treatments in (B) included: control, domestic cat cue, red fox cue, human disturbance cue (sound and light), and combined human disturbance and cat or fox cues.
Habitat components were influential in the pre-treatment trials but not the treatment trials. Under the pre-treatment conditions, when canopy cover was not high (<80%) and distance to predator was increased (>111.5 m), GUDs were low (Figure 3A). However, when distance to predator was low (<111.5 m) and distance to houses was low (<105 m), then moderate canopy cover (<85%) resulted in slightly higher GUDs at different distances to predators (Figure 3A). High ground cover (>5%) resulted in lower GUDs when distances to predators were increased (>111.5 m) and canopy cover was high (>80%; Figure 3A).
Under pre-treatment conditions, distance to a predator produced the primary split in the data, with further distances (>565 m) resulting in very low GUDs, but when distance to a predator was <35 m, it resulted in lower GUDs than when a predator was 35–565 m distant (Figure 4A). Distance to road was also influential when a predator was <35 m away, and resulted in lower GUDs when the distance to the road was close (Figure 4A). In the treatment conditions of human disturbance and the combined fox/cat with human disturbance, increased distance to a predator (>550 m) resulted in lower GUDs when the nearest tree was >15 m away, but distances to human disturbances were not influential under these conditions (Figure 4B).
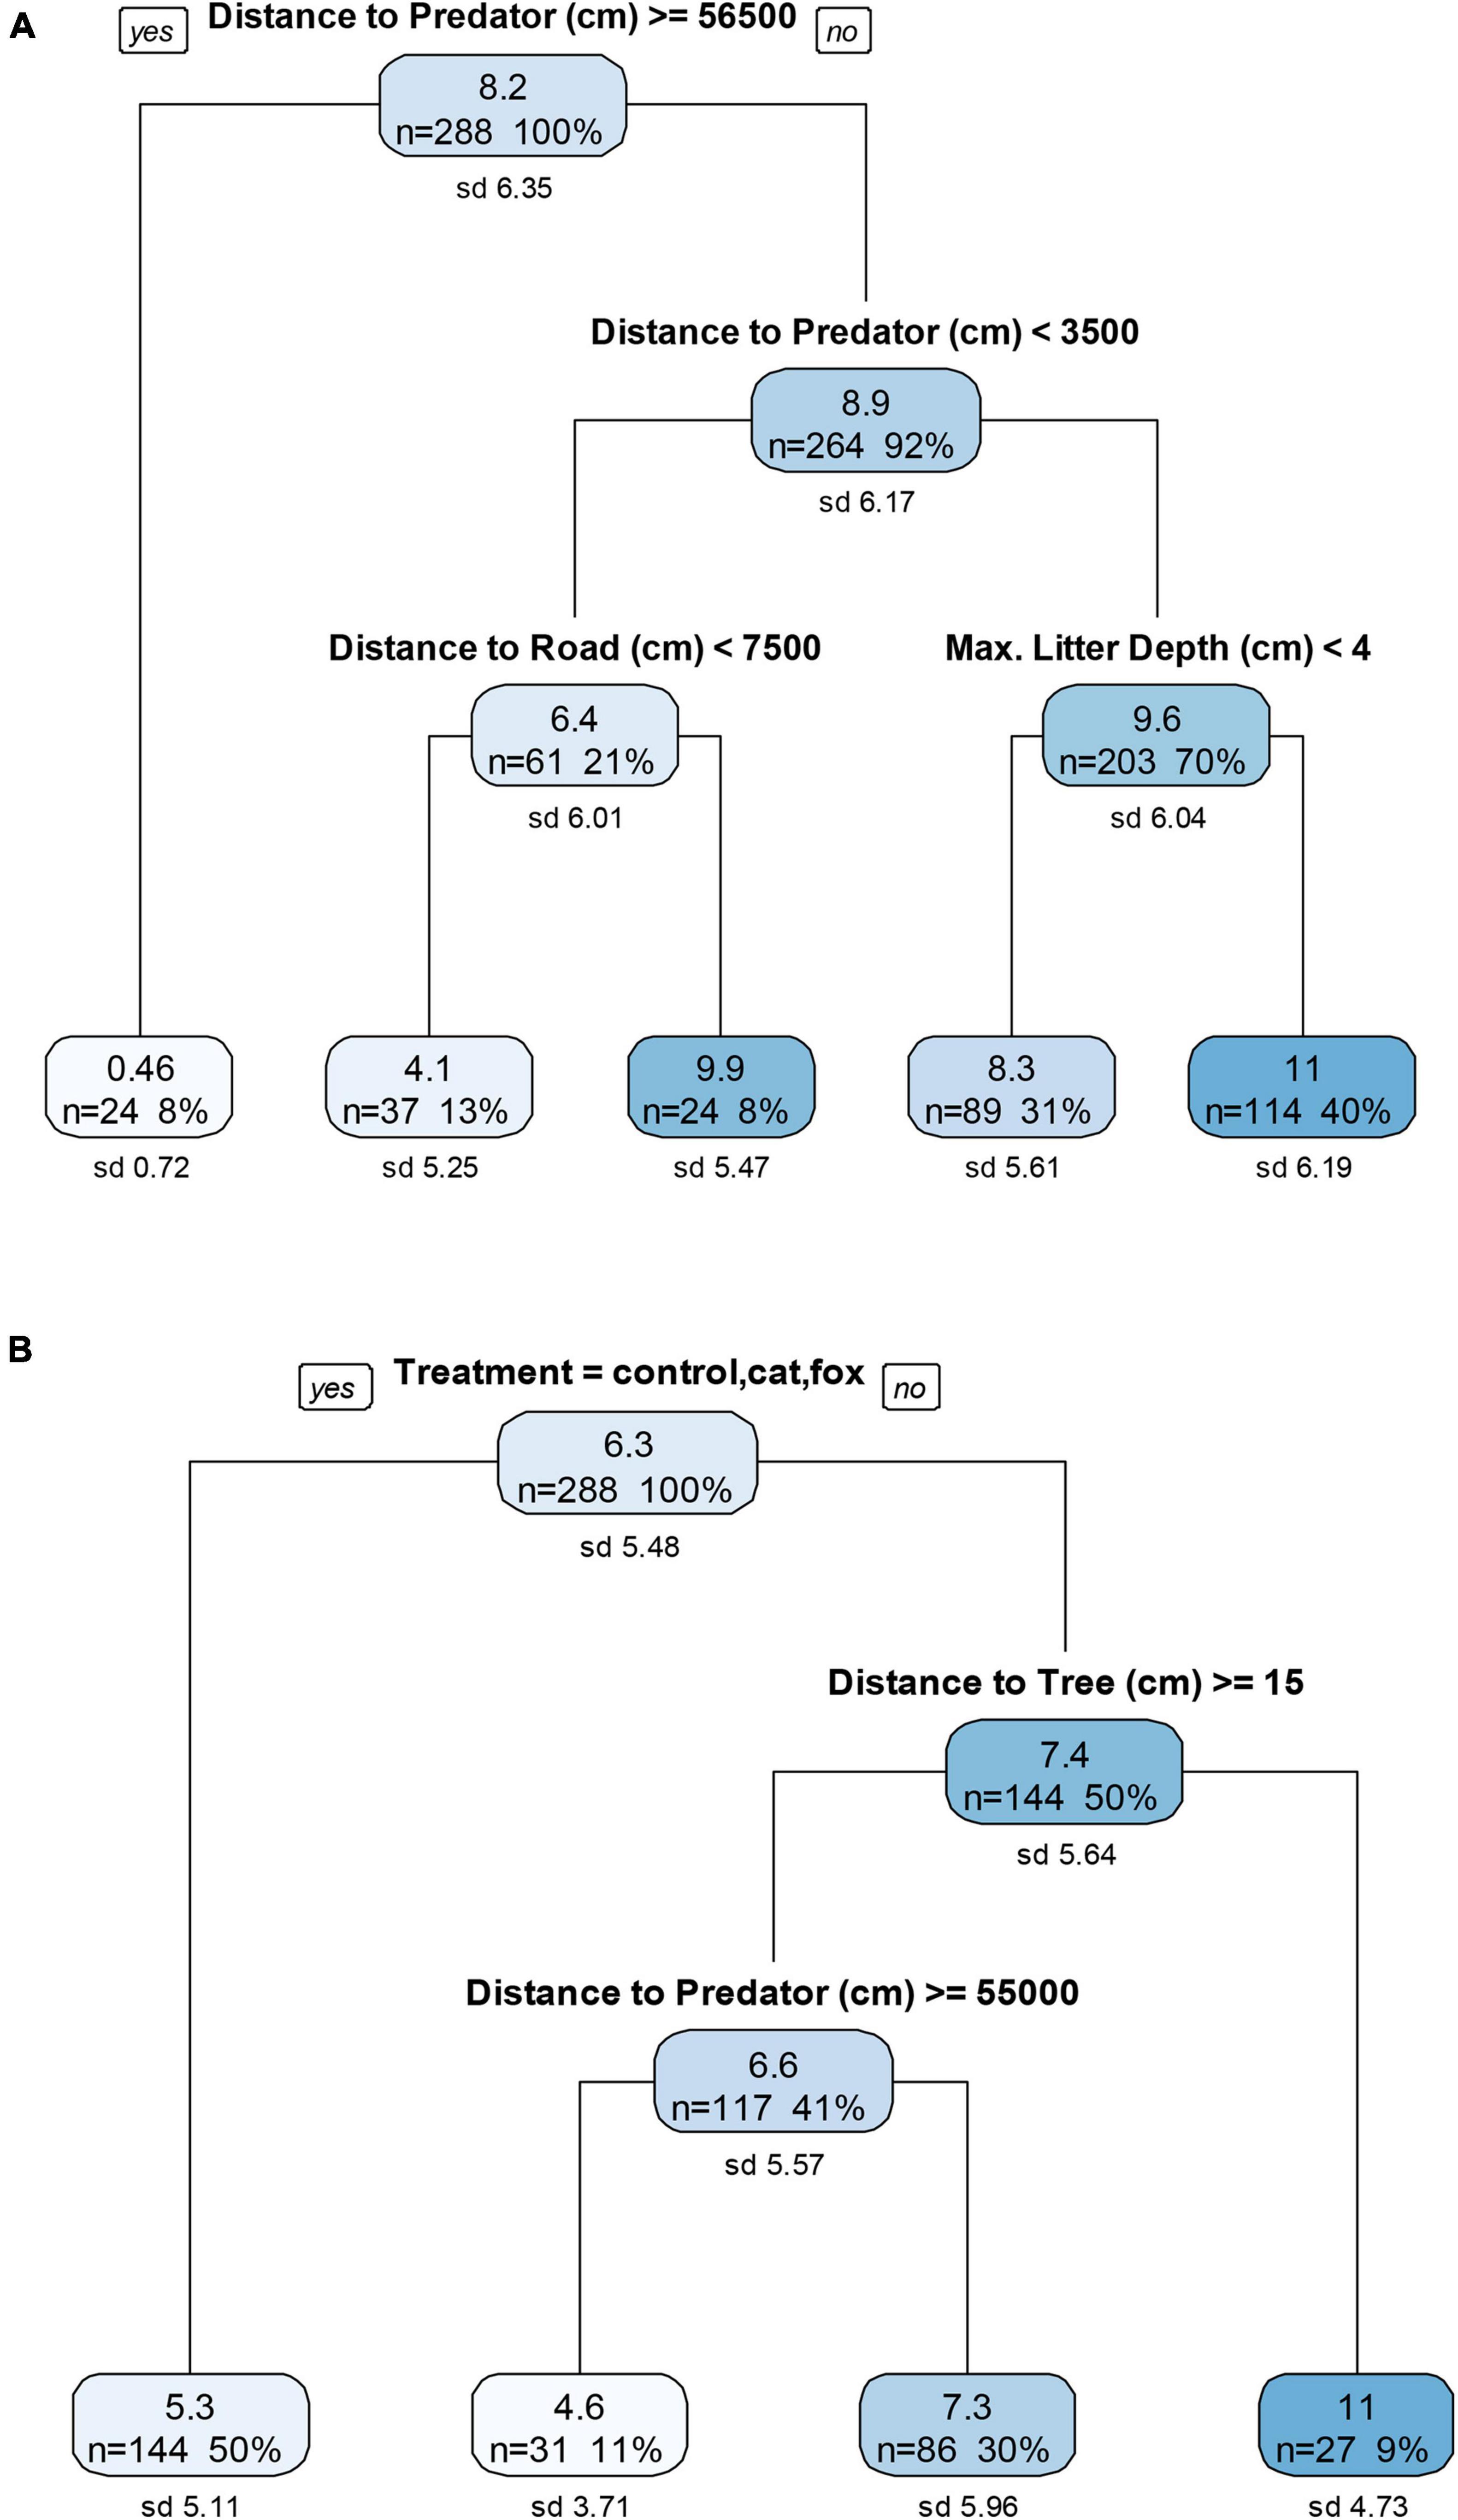
Figure 4. Descriptive regression decision trees for four sessions of three nights each of (A) pre-treatment and (B) treatment giving-up density (GUD) trials at the mid environment, a remnant forest on undeveloped heavily vegetated state-owned land on the edge of a conservation area. The top number in each node is the GUD, the mean number of mealworms left in the tray (after ∼12 h nocturnal exposure). The number of GUD station surveys included in the data split at each node is given by the “n” number. The “%” value is its corresponding percentage from the full data set (n = 288). The standard deviation of the mean number of mealworms left at each node is given by the “sd” value. The six treatments in (B) included: control, domestic cat cue, red fox cue, human disturbance cue (sound and light), and combined human disturbance and cat or fox cues.
There were mixed responses to habitat in the pre-treatment and treatment trials. Under pre-treatment conditions shallow leaf litter resulted in lower GUDs, when a predator was 35 to 565 m away (Figure 4A). Under the treatment conditions of human disturbance and combined fox/cat with human disturbance, increased distance to a tree resulted in lower GUDs, especially when the distance to a predator was >550 m (Figure 4B). A canopy cover of 81 to 83% was repeatedly observed at only two GUD stations in the mid environment, and may be why no response was observed at this environment to canopy cover, as there was in the other environments.
Under pre-treatment conditions, distance to a predator and close proximity to a path (with trees >2 m away and ground cover >25%) each resulted in low GUDs (Figure 5A). In the treatment trials, only distance to path (with ground cover < 42%) was considered in the best-fit tree, with further distances resulting in lower GUDs; under the combination treatments of fox/cat with human disturbance, distance to predator was not influential (Figure 5B).
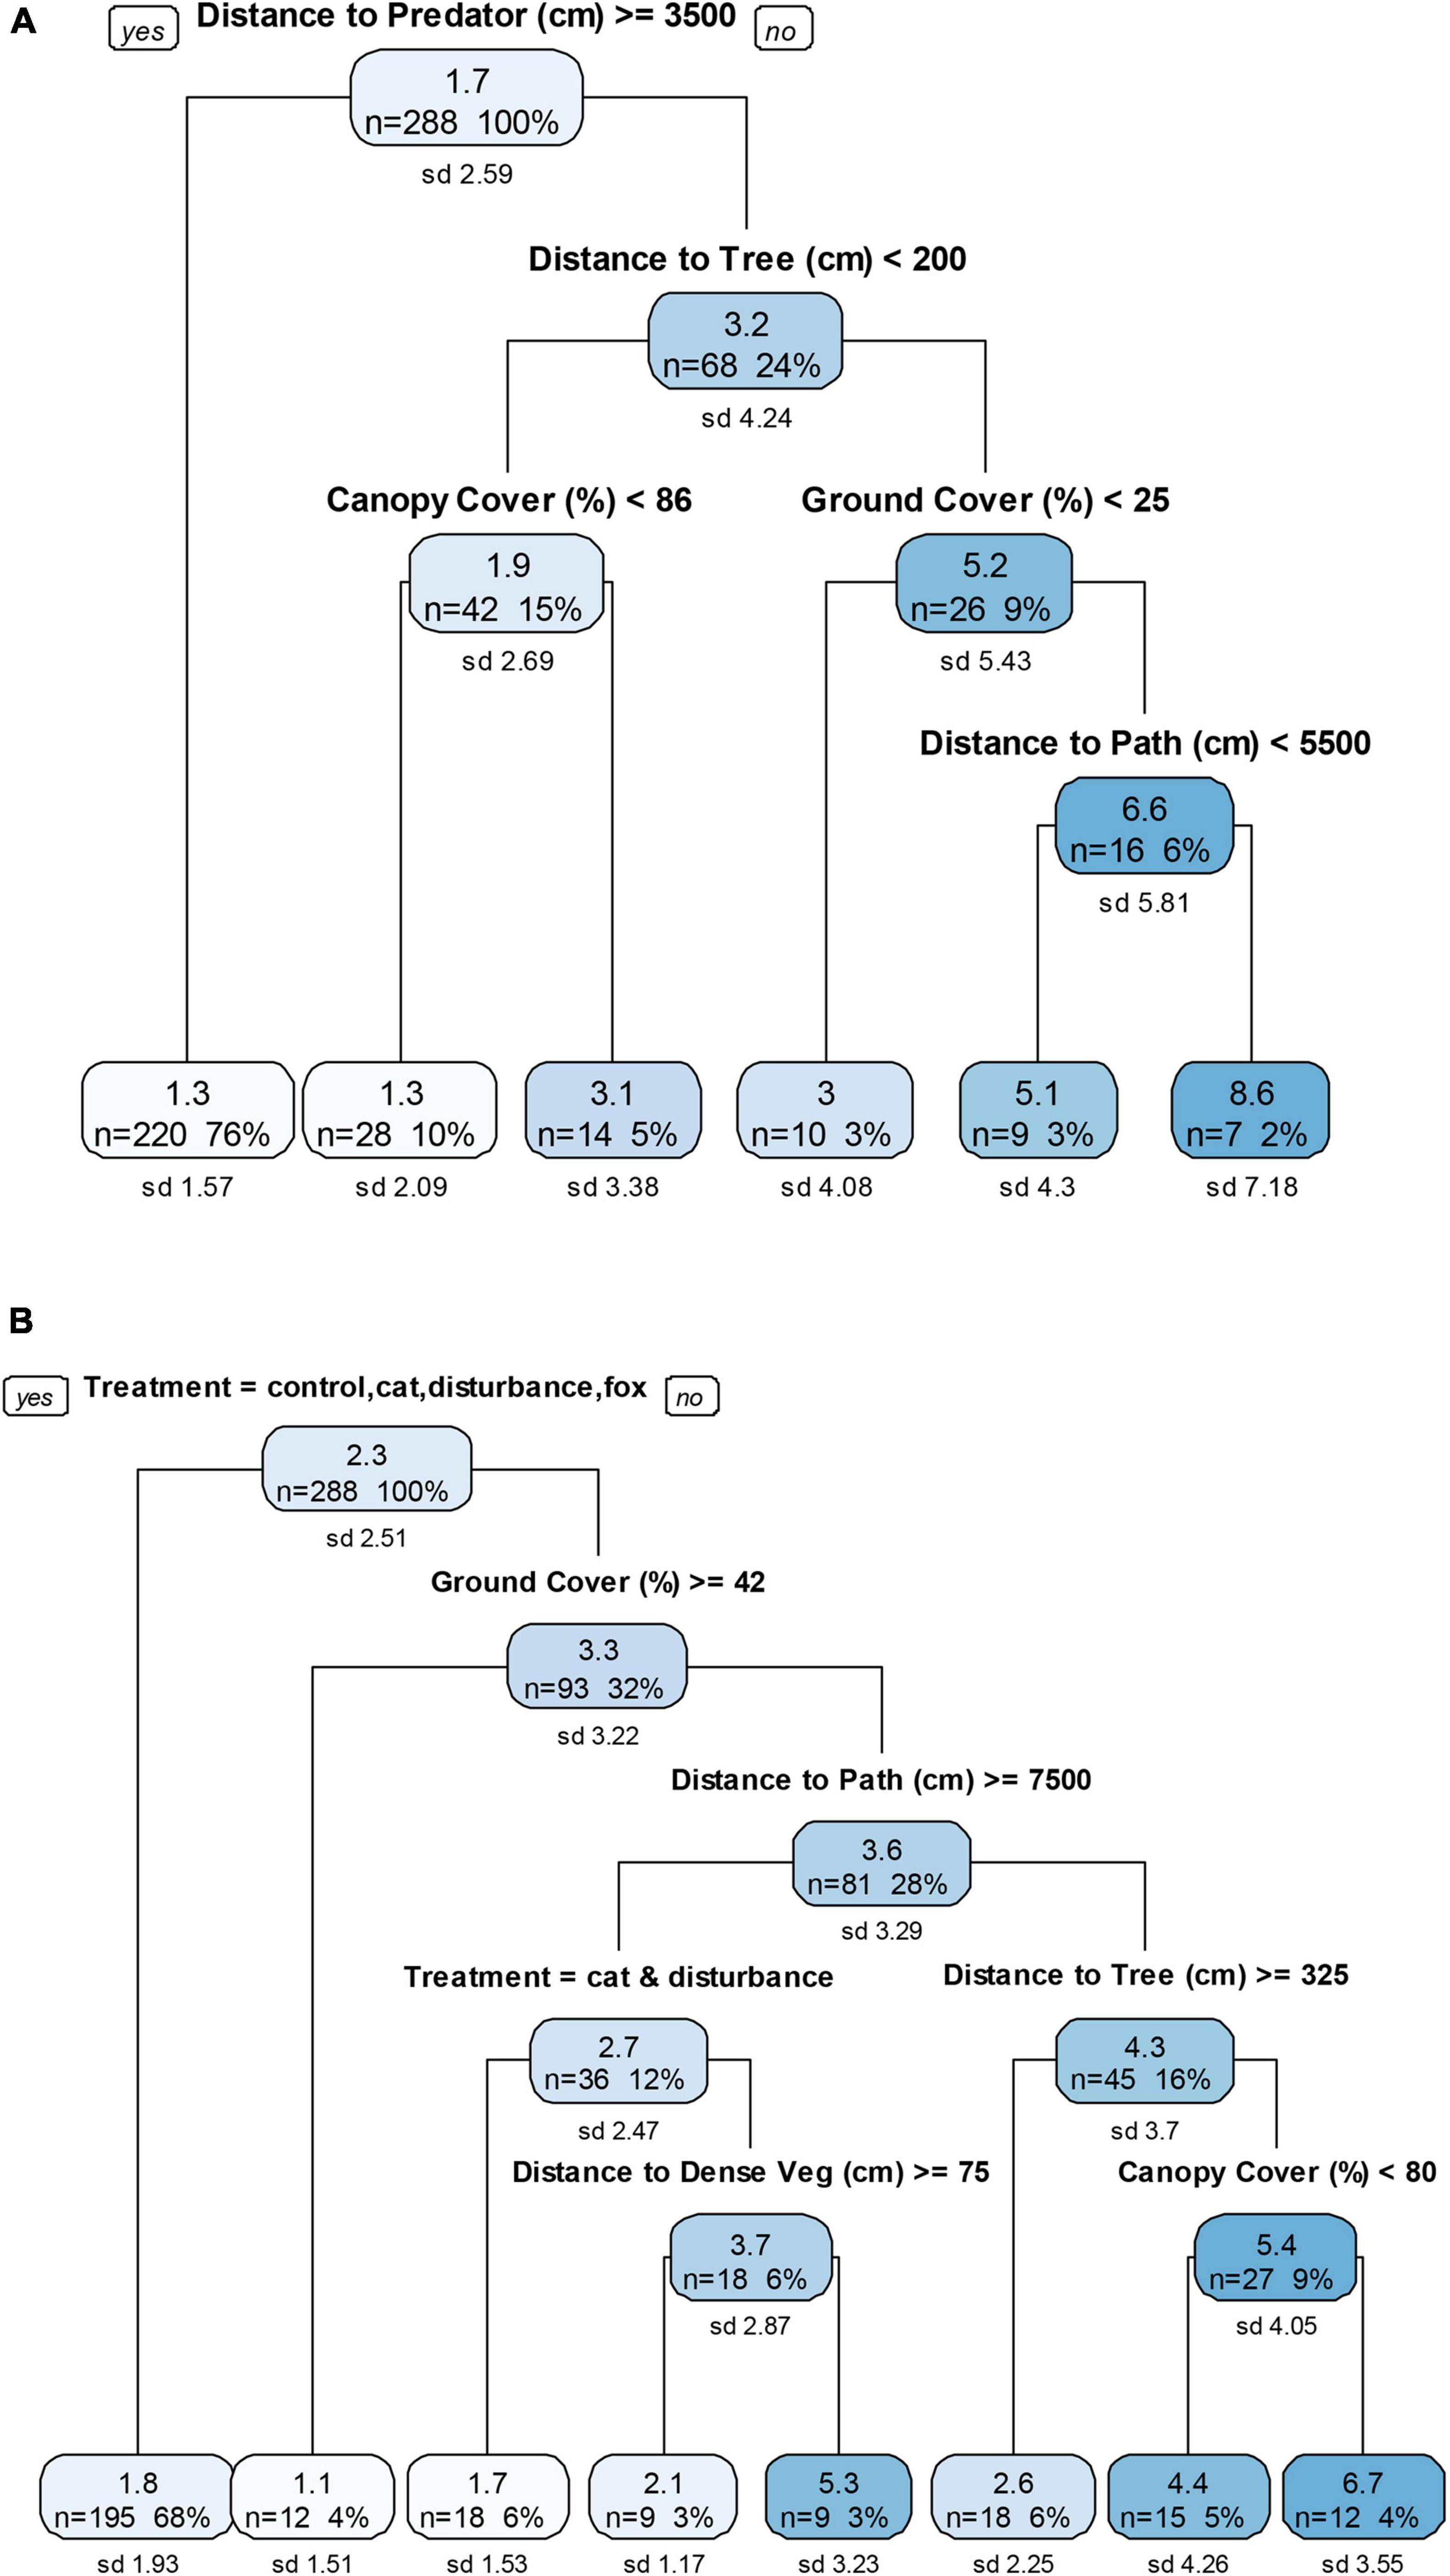
Figure 5. Descriptive regression decision trees for four sessions of three nights each of (A) pre-treatment and (B) treatment giving-up density (GUD) trials at the far environment, a remnant rainforest in a conservation area. The top number in each node is the GUD, the mean number of mealworms left in the tray (after ∼12 h nocturnal exposure). The number of GUD station surveys included in the data split at each node is given by the “n” number. The “%” value is its corresponding percentage from the full data set (n = 288). The standard deviation of the mean number of mealworms left at each node is given by the “sd” value. The six treatments in (B) included: control, domestic cat cue, red fox cue, human disturbance cue (sound and light), and combined human disturbance and cat or fox cues.
There were mixed responses to habitat in the pre-treatment and treatment trials. Under pre-treatment conditions, proximity to trees, reduced ground cover and reduced canopy cover all resulted in lower GUDs when the distance to a predator was <35 m (Figure 5A). In the treatment trials, increased distance to a tree, increased ground cover, and reduced canopy cover each resulted in lower GUDs when under the combined treatments of fox/cat with human disturbance (Figure 5B). Under the combined condition of fox with human disturbance only, an increased distance to dense vegetation also resulted in a low GUD.
As the disturbance gradient was not replicated spatially, the results may have been produced by idiosyncrasies of the chosen locations. However, comparisons across all regression trees suggest situation-specific relationships between perceived foraging risks (GUDs) and habitat components, predator proximity and human disturbances. These relationships changed when disturbance-based treatments were added. Distance to predator was identified as the most important variable in most decision trees, the exception being under the treatment conditions in the far environment where habitat components were more influential. Distance to human disturbance was identified in all the pre-treatment regression trees, and in the treatment regression tree for the far environment. There was no single clear trend along the urban gradient for perceived risk-vegetation relationships, although canopy cover, distance to medium-large trees, and ground cover were often identified. The complexity of foraging choices reduced with decreasing distance to houses and human activity, as fewer variables influenced GUDs and the data were accordingly less split in the decision trees.
Considering the increasing value of urban environments to wildlife (Ives et al., 2016; Wintle et al., 2019), we measured small prey animal foraging activity across an urban disturbance gradient and related it to differences in habitat components and distances to predators and human disturbances. We then tested the foraging responses to additional experimentally introduced stressors of introduced predators (cat/fox) and/or human disturbance (sound and light). Small prey animals that were frequently observed foraging in our study trials were small mammals and to a lesser degree birds. Due to the smaller numbers of birds observed foraging in our trials, and to their ability to fly to escape stressors, we focus the discussion of the results on small mammals. Our results provide some support for each of our three predictions. Small prey animals appeared to include information on proximity to predators and human disturbances in their foraging decisions, resulting in selection of different habitat components. Habitat components were used differently with and without the experimentally introduced stressors across the three environments, indicating that the perception of risk associated with these habitat components varies with the types or levels of stressors that are present. Responses to both naturally occurring and introduced predator and human disturbance cues, and the relative utilization of different habitat components, appeared inconsistent across the three environments, although some similarities were evident.
The small mammals observed in our study recognized and associated cat and fox scents with some level of risk, as habitat components and stressor considerations differed between the natural (pre-treatment) and introduced stressor treatment conditions. This was particularly evident in the far environment where distinctly different responses to fox and cat odor cues in the combined treatments were observed. Exposure to the combined experimentally introduced stressors, of a predator cue with simulated human disturbance, largely resulted in higher GUDs at both the far and mid environments, than under the individual or control treatments, suggesting that their impacts are indeed additive (Fardell et al., 2020).
At both the far and mid environments, small prey animals appeared to perceive safety in foraging near to human disturbance when close to a predator, but perceived more risk when foraging under additional stressors. Species at risk of predation may benefit by foraging close to human activity. This phenomenon – the “human shield” effect – occurs when predators routinely avoid human activities despite living in close proximity (Berger, 2007), as is evident in red foxes (Díaz-Ruiz et al., 2016; Moll et al., 2018), and feral domestic cats (Bradshaw et al., 1999; Gosling et al., 2013). The unpredictability of the moderate to low (relative to the environments) human disturbances that were observed both day and night, however, appears to be a stressor that small prey animals are aware of and accommodate when foraging under additional stressor conditions, by distancing themselves from them. This is not surprising considering that generalized threatening stimuli, such as loud noises, rapid on-coming individuals/groups, and threatening/novel scents naturally elicit short-term responses in prey adapted to evading predators (Frid and Dill, 2002). Such stimuli are relevant to human disturbances too, but responses to them may vary depending on the perceived risk and other factors like predation (i.e., the risk-disturbance hypothesis: Frid and Dill, 2002).
At the close environment, by contrast, under the natural stress (pre-treatment) conditions, increased distance to houses and decreased distance to predators yielded the lowest GUDs. This is not indicative of a human shield effect (Berger, 2007). Rather, it suggests that the presence of predators may be associated with distances and times that are safe from the threat of persistent human disturbances at houses, which red foxes have been observed to keep (Díaz-Ruiz et al., 2016; Moll et al., 2018). In addition, consumption of anthropogenic food subsidies by mesopredators may reduce predation pressure, and hence risk, on prey species in the surrounding area (e.g., Reshamwala et al., 2018). This also could reflect the effects of a narrow landscape between disturbances increasing predator-prey interactions and resulting in desensitized responses to predator cues. Reduced responses to chronic, or frequently encountered stressors, such as predator cues, occur in rodents, and are likely driven by the benefits of reducing energy expenditure to maintain basic functions (Yin et al., 2017). Alternatively, it is possible that foraging activities in the close environment were driven by other variables not captured in this study, such as increased inter- and intra-specific competition among prey species (e.g., Hughes et al., 1994).
In response to proximity to predators and human disturbances, there was some evidence in the three environments of awareness of the peaks and troughs of risks associated with habitat components when foraging, which altered when under the higher level of introduced stressors imposed by the experimental treatments. A landscape of fear response was most obviously observed at the far environment. Here, under natural (pre-treatment) conditions, reduced distances to a predator were mitigated through use of habitat components. With the addition of the experimentally introduced stressors, notably the combined cat/fox with human disturbance treatments, distance to predator was not influential but habitats were utilized differently for foraging. Habitat components were used similarly at the mid environment, but to a lesser degree. As anti-predator vigilance often relies on use of all senses to assess risks, particularly for mammals (Beauchamp, 2015), foraging habitat choices would likely then be affected by how well the senses can detect risk. The response that we observed, with small prey animals perceiving further distances to medium-large trees as less risky when under the combined treatments containing human disturbance cues (sound and light), supports this. At the far environment increased distance to dense vegetation was similarly perceived as less risky. The sound disturbance likely impeded animals’ ability to hear predator threats; visual cues could then have become more important but would have been impeded by trees or dense vegetation. Gerbils similarly find microhabitats with blocked horizontal or vertical sightlines to be riskier for foraging in the presence of foxes or owls, respectively (Embar et al., 2011). The extent and structure of these microhabitats could visually conceal a red fox or domestic cat, both of which are mostly solitary stalk/sit-and-wait pounce hunters (Henry, 2013; Dickman and Newsome, 2015).
Small prey animal responses to distance to predator in the close environment, with the experimentally introduced stressors, did not reflect a linear response, but may offer further insight into how small mammals rely on their senses under high stress conditions. Rats for example, use multiple sensory inputs to gain information about their environment, threats, and socialization (Burn, 2008). In the close environment at distances >562.5 m, risk was perceived to be low as predators were perhaps out of sensory range. At distances of <91.5 m, all senses potentially could detect predator presence, thus priming animals for increased vigilance or avoidance behaviors and reducing predation risk. At the in-between distances, however, one or multiple senses may reach their detection limit, thus reducing the chance of detecting an approaching predator reliably. The close environment was the only one in which domestic cats were observed, and lace monitors were not detected on camera. This perhaps contributed to the observed differences in response to predator distances. Further, this environment had the highest and most frequent observations of northern brown bandicoots, and such prey species assemblage differences could have also played a part in the differences observed along the disturbance gradient. Research into the effect of species on these responses, based on behavioral video analyses of the data collected during this study, and for similar future research, will be beneficial in strengthening such interpretations.
Mammalian prey species may need to be especially cued to eavesdropping on predators (Apfelbach et al., 2005; Peake, 2005) in urban habitat patches owing to the limited size of patches and opportunities for predator avoidance. Our results offer some support for this possibility, as distance to predator was identified as a key factor in foraging decisions at both the close and mid environments, under both the natural (pre-treatment) and treatment conditions. The consistent response to proximity to predators may reflect the narrow band of suitable habitat between the disturbances (paths, roads, houses, and sports oval), which would increase edge effects and predation risk (Lidicker, 1999). Opportunistic predation may be more likely at the closer environments as mammalian mesopredators, like red foxes and domestic cats, frequently utilize walking tracks when traversing their ranges (Claridge, 1998; Morgan et al., 2009; Towerton et al., 2016), and would be attracted to the olfactory cues of prey species (Hughes et al., 2010) in the narrow strips of habitat beside the paths. The numbers of predator videos, and percentages of predators in them, support this possibility, as more predators were observed in close proximity to urban development with fewest at the far environment.
The close environment was the only site where, in the treatment trials, distance to a predator alone influenced foraging by small prey animals, and the only site where the experimental treatments were not explicitly influential. The lowest GUDs were observed in this environment under the additional stressors, and were noticeably lower than under the natural (pre-treatment) conditions. This may be reflect the energetic costs of responding to persistently higher stressors (Segerstrom, 2007), resulting in higher foraging under at-risk conditions to meet nutritional needs (Lima, 1998). Increased levels of disturbance may elicit physiological stress responses but elevated familiarity to human associated disturbances, as has been observed for some species of birds in human-disturbed environments (Blumstein, 2014), may allow behaviorally mediated additional feeding responses to meet energetic costs. Exposure to stress during adolescence in small mammals can result in phenotypic changes that enhance foraging efficiency and food consumption under stress (Chaby et al., 2015). Behavioral adjustments, such as increased vigilance or frequent movement with more visits for less time at each GUD station, as observed by Chaby et al. (2015), may also have been used to cope with the additional stressors associated with the close environment. Future research is required, both in general and on the videos collected during this study, to explore whether such behaviors occur when foraging under varying stress levels along urban disturbance gradients. The results would assist management of wildlife in human-disturbed environments, as it may better support or offer an alternative to the vegetation management ideas we propose below. Additional research to compare the levels of urban stressors, wildlife behaviors, and levels of stress hormones in prey species along urban disturbance gradients, would also be beneficial in determining how well prey species cope with urban stressors (Palme, 2019). The results may indicate a need to intervene to mitigate urban stressor impacts more rapidly than present.
On average, foragers in the far environment returned the lowest GUDs, with the exception of the close environment under the treatment conditions. The mid environment had the highest average GUDs, which could be due to reduced population sizes resulting in fewer visitors to the GUD stations, as suggested by the smaller number of videos at this environment. The average GUDs under the natural (pre-treatment) and treatment conditions were relatively similar for the mid and far environments. In the close environment average GUDs were higher under the natural (pre-treatment) conditions than under the treatment conditions, with the latter producing the simplest decision tree observed. In the close and mid environments, the reduced complexity of the decision trees under the experimentally introduced stressors, as shown by fewer divisions of the data, is likely indicative of increased risks taken by small prey animals to meet their energetic needs (Preisser et al., 2005). This is possibly driven by the depletion of food in the GUD trays (Sinclair and Arcese, 1995). The more complex decision tree, with more divisions in the data, obtained in the experimentally introduced stressor trials in the far environment, suggests that animals there have fewer natural stressors and can use habitat components to mitigate them. The differences in regression tree complexity could also be attributed to the higher proportion of introduced animals relative to natives at the far environment, compared to the mid and close environments that had more native animals. Introduced species such as black and brown rats may be less naïve to disturbances than native species and thus may respond differently to them when foraging, especially considering that they co-evolved with red foxes and domestic cats, and are often commensal with humans (Puckett et al., 2020).
Our results highlight the importance of both the close and the mid environments in supporting populations of small native animals; for example, the northern brown bandicoot occurred largely in the close environment. Although heavily disturbed, the close environment benefits from supplementary watering and run-off from the surrounding sports oval and houses, which may increase soil moisture and food resources such as invertebrates and fungi (Mulder, 2006) that comprise part of the bandicoot’s diet (McClelland et al., 1999). The preservation of remnant habitats in disturbed areas can therefore be seen as an important complement to the preservation of adjacent larger areas of natural environment that are often classified more formally as conservation areas or nature reserves.
Generally, wildlife populations in urbanized environments could be expected to benefit from increased habitat heterogeneity in respect to canopy and ground cover, as this may mitigate the risk of population decline due to predator/people stress impacts. Management of invasive plant species may be one such way of creating open patches. In our research environments, foraging small prey animals used habitat components differently along the urban disturbance gradient. Proximity to walking paths in the far environment negatively affected foraging in the presence of additional stressors, perhaps due to the increased likelihood of encountering predators or people. Deep leaf litter was associated with high GUDs at the mid environment, suggesting higher perceived risk with this habitat component. Across all three environments, medium-large trees, dense vegetation and a relatively closed canopy were perceived as risky, likely because they aid in concealing predators, including nocturnal avian predators (Davey and Einoder, 2001; Kavanagh, 2002). Considering that the dominant animals observed in our study, and the native apex predator — the powerful owl, represent a typical assemblage for much of south-eastern Australia and as far north as Brisbane, i.e., for large parts of urbanized Australia, our specific management prescriptions may be of use in these wider areas.
Management prescriptions to reduce perceived threats and increase the efficiency of foraging of small prey animals in the urban environment should also assist in maintaining their populations and those of the native predators present too. In the first instance, minimizing construction of new paths and reducing activity on existing paths should serve to reduce both predator and anthropogenic impacts. Ostensibly too, retention of vegetation that provides patches with full canopy cover and cover less than 80% would apparently provide varied foraging opportunities for small mammals. However, full canopy cover (>85%) is likely to be beneficial on the edges of forest remnants to mitigate external threats such as artificial light (Hölker et al., 2010). Similarly, managing for patches of reduced ground cover (<25%) interspersed between patches of moderate ground cover (>42%) would allow for natural and stress-adjusted foraging, respectively, as observed at the far environment and is suggested by related studies on other species that use complex habitat components in which to hide or escape (Miritis et al., 2020; Wheatley et al., 2020). A caveat, however, is that under high canopy cover (>80%) patches of increased ground cover (>5%) may be required to reduce perceived risks, by facilitating escape, as in the close environment. Maintaining patches of shallow leaf litter (<4 cm deep) would create less risky microhabitats for foraging, as observed in the mid environment. Shallow leaf litter may improve foraging success (Kaufman and Kaufman, 1990); reduce competition between small mammal species such as antechinuses and rats that both forage in leaf litter (Hall, 1980; Moro, 1991; Cox et al., 2000); and reduce opportunities for concealment of nocturnal predatory reptiles like death adders (Acanthopsis antarcticus) that occurred at our study sites.
We note that our management insights are based on the foraging decisions (GUDs) of the entire small mammal and, to a lesser degree, bird communities that were present in our study region, and that the requirements of native predators in these environments also need to be considered. More focused management activities may be needed if individual mammal species are targeted for conservation. Further, due to logistical and financial constraints, only one urban disturbance gradient area was observed in our study. As such, the results may be used as an indication of potential patterns evident in wider areas, but further replicated research is needed to determine if similar patterns occur elsewhere and are applicable to other species.
Wildlife persists in many urban environments where suitable habitat is available (Hobbs et al., 2013), but sustaining it often requires informed management (Shaffer, 2018; Soanes et al., 2019; Lambert and Donihue, 2020). We have shown that small mammals, and to a lesser degree birds, in disturbed urban environments and adjacent conservation areas, forage in landscapes of fear due to human activity and proximity to predators, and use habitat components differently to reduce risks associated with these stressors. These responses varied along the disturbance gradient, most likely owing to the additional stressors already in place in each environment. Landscape of fear effects were most obviously managed by prey species through changes in use of habitat components in the far environment that was exposed to fewer stressors. At the mid and close environments, by contrast, where greater disturbances occur, it appeared that behaviors were used primarily to manage these stressors. Although further investigation is needed to confirm these patterns and interpretations, our results highlight the importance of managing disturbed environments to reduce the impacts of multiple stressors, and in turn sustain prey species and biodiversity more broadly. We suggest that active vegetation management is a simple and potentially effective way to achieve these conservation goals.
The raw data supporting the conclusions of this article will be made available by the authors, without undue reservation. Requests to access these data should be directed to LF, bG9yZW4uZmFyZGVsbEBnbWFpbC5jb20=.
The monitoring of wildlife in situ was conducted under the animal ethics approval from the University of Sydney (2017/1275) and under a New South Wales Scientific License (SL102024). Written informed consent was obtained from the owners of the animals used to collect scent cues for this study.
LF, CD, CP, and CN conceived the study. LF performed the field work and statistical analyses. LF wrote the initial manuscript draft. All authors edited and contributed to subsequent the drafts.
This research was supported by a Holsworth Wildlife Research Endowment, and a Lake Macquarie Environmental Research Grant funded by Lake Macquarie City Council and other sponsors, which in 2018–2019 included Hunter Water Corporation, Delta Electricity and Origin Energy. LF was supported by an Australian Government Research Training Program Stipend, and a University of Sydney Merit Award Scholarship.
The authors declare that the research was conducted in the absence of any commercial or financial relationships that could be construed as a potential conflict of interest.
All claims expressed in this article are solely those of the authors and do not necessarily represent those of their affiliated organizations, or those of the publisher, the editors and the reviewers. Any product that may be evaluated in this article, or claim that may be made by its manufacturer, is not guaranteed or endorsed by the publisher.
We acknowledge the traditional owners of country throughout Australia and recognize the continuing connection to lands, waters and communities. We pay our respect to Aboriginal and Torres Strait Islander cultures; and to Elders past, present and emerging. We recognize and acknowledge the Aboriginal people, known today as the Awabakal, as the traditional Custodians of the land presently known as the suburb of Whitebridge. We are grateful to John Clulow for stimulating discussions on urban wildlife in the Lake Macquarie area and for his direction to sites of high wildlife activity. We are also grateful to Lauren Young for stimulating discussions on spatial and statistical analyses. We are also grateful to Bobby Tamayo for his endless support and direction both logistically and in creative problem solving for in-field research.
Andruskiw, M., Fryxell, J. M., Thompson, I. D., and Baker, J. A. (2008). Habitat-mediated variation in predation risk by the American marten. Ecology 89, 2273–2280. doi: 10.1890/07-1428.1
Apfelbach, R., Blanchard, C. D., Blanchard, R. J., Hayes, R. A., and McGregor, I. S. (2005). The effects of predator odors in mammalian prey species: a review of field and laboratory studies. Neurosci. Biobehav. Rev. 29, 1123–1144.
Australian Bureau of Statistics (2016). Census QuickStats. Avaialble Online at: https://quickstats.censusdata.abs.gov.au/census_services/getproduct/census/2016/quickstat/SSC14276?opendocument (accessed February 10, 2021).
Beauchamp, G. (2015). Animal vigilance: monitoring predators and competitors. Cambridge, Massachusetts: Academic Press.
Bell, S. A. J. (2016). Volume 2: vegetation Community Profiles, Lake Macquarie Local Government area. Working Draft v2. Unpublished Report to Lake Macquarie City council. March 2016. Australia: Eastcoast Flora Survey.
Berger, J. (2007). Fear, human shields and the redistribution of prey and predators in protected areas. Biol. Lett. 3, 620–623. doi: 10.1098/rsbl.2007.0415
Bleicher, S. S. (2017). The landscape of fear conceptual framework: definition and review of current applications and misuses. PeerJ 5:e3772. doi: 10.7717/peerj.3772
Bleicher, S. S., and Rosenzweig, M. L. (2018). Too much of a good thing? A landscape-of-fear analysis for collared peccaries (Pecari tajacu) reveals hikers act as a greater deterrent than thorny or bitter food. Can. J. Zool. 96, 317–324.
Blumstein, D. T. (2014). “Attention, habituation, and antipredator behaviour: implications for urban birds,” in Avian Urban Ecology, eds D. Gil and H. Brumm (New York: Oxford University Press).
Boonstra, R., Hik, D., Singleton, G. R., and Tinnikov, A. (1998). The impact of predator-induced stress on the snowshoe hare cycle. Ecol. Monogr. 68, 371–394. doi: 10.1890/0012-9615(1998)068[0371:tiopis]2.0.co;2
Bradshaw, J. W., Horsfield, G. F., Allen, J. A., and Robinson, I. H. (1999). Feral cats: their role in the population dynamics of Felis catus. Appl. Anim. Behav. Sci. 65, 273–283.
Breiman, L., Friedman, J., Stone, C. J., and Olshen, R. A. (1984). Classification And Regression Trees. Boca Raton: CRC press.
Brown, J. S. (1988). Patch use as an indicator of habitat preference, predation risk, and competition. Behav. Ecol. Sociobiol. 22, 37–47. doi: 10.1016/j.beproc.2019.103922
Brown, J. S., and Kotler, B. P. (2004). Hazardous duty pay and the foraging cost of predation. Ecol. Lett. 7, 999–1014.
Brown, J. S., and Kotler, B. P. (2007). “Foraging and the ecology of fear,” in Foraging Behavior and Ecology, eds D. W. Stephens, J. S. Brown, and R. C. Ydendberg (Chicago, IL: University of Chicago Press).
Bureau of Meteorology Australian Government (2021). Climate Data Online. Available Online at: http://www.bom.gov.au/climate/data/index.shtml (accessed April 22, 2021).
Burn, C. C. (2008). What is it like to be a rat? Rat sensory perception and its implications for experimental design and rat welfare. Appl. Anim. Behav. Sci. 112, 1–32. doi: 10.1016/j.applanim.2008.02.007
Bytheway, J. P., Carthey, A. J., and Banks, P. B. (2013). Risk vs reward: how predators and prey respond to aging olfactory cues. Behav. Ecol. Sociobiol. 67, 715–725.
Chaby, L. E., Sheriff, M. J., Hirrlinger, A. M., and Braithwaite, V. A. (2015). Does early stress prepare individuals for a stressful future? Stress during adolescence improves foraging under threat. Anim. Behav. 105, 37–45.
Cincotta, R. P., Wisnewski, J., and Engelman, R. (2000). Human population in the biodiversity hotspots. Nature 404, 990–992. doi: 10.1038/35010105
Claridge, A. W. (1998). Use of tracks and trails by introduced predators: an important consideration in the study of native ground-dwelling mammals. Vic. Nat. 115, 88–93.
Clinchy, M., Zanette, L., Boonstra, R., Wingfield, J. C., and Smith, J. N. (2004). Balancing food and predator pressure induces chronic stress in songbirds. Proc. R. Soc. B Biol. Sci. 271, 2473–2479. doi: 10.1098/rspb.2004.2913
Clinchy, M., Zanette, L. Y., Roberts, D., Suraci, J. P., Buesching, C. D., Newman, C., et al. (2016). Fear of the human “super predator” far exceeds the fear of large carnivores in a model mesocarnivore. Behav. Ecol. 27, 1826–1832.
Cox, M. P. G., Dickman, C. R., and Cox, W. G. (2000). Use of habitat by the black rat (Rattus rattus) at North Head, New South Wales: an observational and experimental study. Austral Ecol. 25, 375–385. doi: 10.1046/j.1442-9993.2000.01050.x
Darimont, C. T., Fox, C. H., Bryan, H. M., and Reimchen, T. E. (2015). The unique ecology of human predators. Science 349, 858–860.
Davey, C., and Einoder, L. (2001). Predation of house mice by the tawny frogmouth ’Podargus strigoides’. Aust. Field Ornithol. 19, 103–104.
De’ath, G., and Fabricius, K. E. (2000). Classification and regression trees: a powerful yet simple technique for ecological data analysis. Ecology 81, 3178–3192. doi: 10.1890/0012-9658(2000)081[3178:cartap]2.0.co;2
Department of Environment Climate Change and Water [DECCW] (2010). Glenrock State Conservation Area Plan of Management. New South Wales. Australia: DECCW.
Díaz-Ruiz, F., Caro, J., Delibes-Mateos, M., Arroyo, B., and Ferreras, P. (2016). Drivers of red fox (Vulpes vulpes) daily activity: prey availability, human disturbance or habitat structure? J. Zool. 298, 128–138.
Dickman, C. R., and Newsome, T. M. (2015). Individual hunting behaviour and prey specialisation in the house cat Felis catus: implications for conservation and management. Appl. Anim. Behav. Sci. 173, 76–87. doi: 10.1016/j.applanim.2014.09.021
Doherty, T. S., Dickman, C. R., Glen, A. S., Newsome, T. M., Nimmo, D. G., Ritchie, E. G., et al. (2017). The global impacts of domestic dogs on threatened vertebrates. Biol. Conserv. 210, 56–59. doi: 10.1016/j.biocon.2017.04.007
Embar, K., Kotler, B. P., and Mukherjee, S. (2011). Risk management in optimal foragers: the effect of sightlines and predator type on patch use, time allocation, and vigilance in gerbils. Oikos 120, 1657–1666. doi: 10.1111/j.1600-0706.2011.19278.x
Fardell, L. L., Pavey, C. R., and Dickman, C. R. (2020). Fear and stressing in predator–prey ecology: considering the twin stressors of predators and people on mammals. PeerJ 8:e9104. doi: 10.7717/peerj.9104
Fardell, L. L., Young, L. I., Pavey, C. R., and Dickman, C. R. (2021). Habitat use by wandering pet cats (Felis catus) in a patchy urban environment. J. Urban Ecol. 7:juab019. doi: 10.1093/jue/juab019
Fleming, P., Meek, P., Ballard, G., Banks, P., Calridge, A., Sanderson, J., et al. (2014). camera trapping: wildlife management and research. Victoria: CSIRO Publishing.
Fleming, P. A., and Bateman, P. W. (2018). Novel predation opportunities in anthropogenic landscapes. Anim. Behav. 138, 145–155. doi: 10.1016/j.anbehav.2018.02.011
Frid, A., and Dill, L. (2002). Human-caused disturbance stimuli as a form of predation risk. Conserv. Ecol. 6:11.
Gander, H., and Ingold, P. (1997). Reactions of male alpine chamois Rupicapra r. rupicapra to hikers, joggers and mountainbikers. Biol. Conserv. 79, 107–109. doi: 10.1016/s0006-3207(96)00102-4
Gehrt, S. D. (2010). “The urban ecosystem,” in Urban carnivores: ecology, conflict, and conservation, eds S. D. Gehrt, S. P. D. Riley, and B. L. Cypher (Baltimore, MD: The Johns Hopkins University Press).
Gese, E. M., Morey, P. S., and Gehrt, S. D. (2012). Influence of the urban matrix on space use of coyotes in the Chicago metropolitan area. J. Ethol. 30, 413–425. doi: 10.1007/s10164-012-0339-8
Gorini, L., Linnell, J. D., May, R., Panzacchi, M., Boitani, L., Odden, M., et al. (2012). Habitat heterogeneity and mammalian predator–prey interactions. Mamm. Rev. 42, 55–77. doi: 10.1111/j.1365-2907.2011.00189.x
Gosling, L., Stavisky, J., and Dean, R. (2013). What is a feral cat? Variation in definitions may be associated with different management strategies. J. Feline Med. Surg. 15, 759–764. doi: 10.1177/1098612X13481034
Grimm, N. B., Faeth, S. H., Golubiewski, N. E., Redman, C. L., Wu, J., Bai, X., et al. (2008). Global change and the ecology of cities. Science 319, 756–760.
Hall, S. (1980). The diets of two coexisting species of Antechinus (Marsupialia: dasyuridae). Aust. Wildl. Res. 7, 365–378.
Hobbs, R. J., Higgs, E. S., and Hall, C. (2013). Novel Ecosystems: intervening In The New Ecological World Order. West Sussex: John Wiley and Sons.
Hoffmann, F., Musolf, K., and Penn, D. J. (2009). Freezing urine reduces its efficacy for eliciting ultrasonic vocalizations from male mice. Physiol. Behav. 96, 602–605. doi: 10.1016/j.physbeh.2008.12.014
Hölker, F., Wolter, C., Perkin, E. K., and Tockner, K. (2010). Light pollution as a biodiversity threat. Trends Ecol. Evol. 25, 681–682. doi: 10.1016/j.tree.2010.09.007
Hughes, J. J., Ward, D., and Perrin, M. R. (1994). Predation risk and competition affect habitat selection and activity of Namib Desert gerbils. Ecology 75, 1397–1405. doi: 10.2307/1937463
Hughes, N. K., Price, C. J., and Banks, P. B. (2010). Predators are attracted to the olfactory signals of prey. PLoS One 5:e13114. doi: 10.1371/journal.pone.0013114
Ives, C. D., Lentini, P. E., Threlfall, C. G., Ikin, K., Shanahan, D. F., Garrard, G. E., et al. (2016). Cities are hotspots for threatened species. Glob. Ecol. Biogeogr. 25, 117–126. doi: 10.1111/geb.12404
Jessop, T. S., Urlus, J., Lockwood, T., and Gillespie, G. (2010). Preying possum: assessment of the diet of lace monitors (Varanus varius) from coastal forests in southeastern Victoria. Biawak 4, 59–63.
Jones, M. E., Apfelbach, R., Banks, P. B., Cameron, E. Z., Dickman, C. R., Frank, A., et al. (2016). A nose for death: integrating trophic and informational networks for conservation and management. Front. Ecol. Evol. 4:124. doi: 10.3389/fevo.2016.00124
Kaufman, D. W., and Kaufman, G. A. (1990). Influence of plant litter on patch use by foraging Peromyscus maniculatus and Reithrodontomys megalotis. Am. Midl. Nat. 124, 195–198.
Kavanagh, R. P. (2002). “Comparative diets of the powerful owl (Ninox strenua), sooty owl (Tyto tenebricosa) and masked owl (Tyto novaehollandiae) in southeastern Australia,” in Ecology and Conservation of Owls, eds I. Newtown, R. Kavanagh, J. Olsen, and I. Taylor (Victoria: CSIRO Publishing).
Kim, J. W., Brown, G. E., and Grant, J. W. (2004). Interactions between patch size and predation risk affect competitive aggression and size variation in juvenile convict cichlids. Anim. Behav. 68, 1181–1187. doi: 10.1016/j.anbehav.2003.11.017
Kuijper, D. P., Bubnicki, J. W., Churski, M., Mols, B., and Van Hooft, P. (2015). Context dependence of risk effects: wolves and tree logs create patches of fear in an old-growth forest. Behav. Ecol. 26, 1558–1568. doi: 10.1093/beheco/arv107
Lake Macquarie City Council [LMCC] (2011). City of Lake Macquarie Annual Report 2010-2011. Lake Macquarie: Lakemac Print.
Lake Macquarie City Council [LMCC] (2012). City of Lake Macquarie City Council Vertebrate Pest Management Strategy 2012-2018. Lake Macquarie: Lakemac Print.
Lambert, M. R., and Donihue, C. M. (2020). Urban biodiversity management using evolutionary tools. Nat. Ecol. Evol. 4, 903–910. doi: 10.1038/s41559-020-1193-7
Larson, C. L., Reed, S. E., Merenlender, A. M., and Crooks, K. R. (2016). Effects of recreation on animals revealed as widespread through a global systematic review. PLoS One 11:e0167259. doi: 10.1371/journal.pone.0167259
Laundré, J. W., Hernández, L., and Altendorf, K. B. (2001). Wolves, elk, and bison: re-establishing the” landscape of fear” in Yellowstone National Park, USA. Can. J. Zool. 79, 1401–1409. doi: 10.1139/z01-094
Laundré, J. W., Hernández, L., and Ripple, W. J. (2010). The landscape of fear: ecological implications of being afraid. Open Ecol. J. 3, 1–7. doi: 10.2174/1874213001003030001
Leighton, P. A., Horrocks, J. A., and Kramer, D. L. (2010). Conservation and the scarecrow effect: can human activity benefit threatened species by displacing predators? Biol. Conserv. 143, 2156–2163. doi: 10.1016/j.biocon.2010.05.028
Lidicker, W. Z. (1999). Responses of mammals to habitat edges: an overview. Landsc. Ecol. 14, 333–343.
Lima, S. L. (1998). Stress and decision-making under the risk of predation: recent developments from behavioral, reproductive, and ecological perspectives. Adv. Study Behav. 27, 215–290. doi: 10.1016/s0065-3454(08)60366-6
Madsen, B., Carroll, N., and Moore Brands, K. (2010). State of Biodiversity Markets Report: offset and Compensation Programs Worldwide. Available Online at: http://www.ecosystemmarketplace.com/documents/acrobat/sbdmr.pdf (accessed February 8, 2021).
McClelland, K. L., Hume, I. D., and Soran, N. (1999). Responses of the digestive tract of the omnivorous northern brown bandicoot, Isoodon macrourus (Marsupialia: peramelidae), to plant-and insect-containing diets. J. Comp. Physiol. B. 169, 411–418. doi: 10.1007/s003600050237
McDonald, R. I., Kareiva, P., and Forman, R. T. (2008). The implications of current and future urbanization for global protected areas and biodiversity conservation. Biol. Conserv. 141, 1695–1703.
Miritis, V., Rendall, A. R., Doherty, T. S., Coetsee, A. L., and Ritchie, E. G. (2020). Living with the enemy: a threatened prey species coexisting with feral cats on a fox-free island. Wildl. Res. 47, 633–642. doi: 10.1071/wr19202
Mitchell, W. A., Abramsky, Z., Kotler, B. P., Pinshow, B., and Brown, J. S. (1990). The effect of competition on foraging activity in desert rodents: theory and experiments. Ecology 71, 844–854.
Moll, R. J., Cepek, J. D., Lorch, P. D., Dennis, P. M., Robison, T., Millspaugh, J. J., et al. (2018). Humans and urban development mediate the sympatry of competing carnivores. Urban Ecosyst. 21, 765–778. doi: 10.1007/s11252-018-0758-6
Morgan, S. A., Hansen, C. M., Ross, J. G., Hickling, G. J., Ogilvie, S. C., and Paterson, A. M. (2009). Urban cat (Felis catus) movement and predation activity associated with a wetland reserve in New Zealand. Wildl. Res. 36, 574–580. doi: 10.1071/wr09023
Moro, D. (1991). The distribution of small mammal species in relation to heath vegetation near Cape Otway, Victoria. Wildl. Res. 18, 605–617.
Mulder, C. (2006). Driving forces from soil invertebrates to ecosystem functioning: the allometric perspective. Naturwissenschaften 93, 467–479. doi: 10.1007/s00114-006-0130-1
Navarro-Castilla, Á, and Barja, I. (2014). Does predation risk, through moon phase and predator cues, modulate food intake, antipredatory and physiological responses in wood mice (Apodemus sylvaticus)? Behav. Ecol. Sociobiol. 68, 1505–1512. doi: 10.1007/s00265-014-1759-y
Newsome, T. M., Dellinger, J. A., Pavey, C. R., Ripple, W. J., Shores, C. R., Wirsing, A. J., et al. (2015). The ecological effects of providing resource subsidies to predators. Glob. Ecol. Biogeogr. 24, 1–11.
Palme, R. (2019). Non-invasive measurement of glucocorticoids: advances and problems. Physiol. Behav. 199, 229–243. doi: 10.1016/j.physbeh.2018.11.021
Patten, M. A., and Burger, J. C. (2018). Reserves as double-edged sword: avoidance behavior in an urban-adjacent wildland. Biol. Conserv. 218, 233–239.
Peake, T. (2005). “Eavesdropping in communication,” in Animal Communication Networks, ed. P. McGregor (Cambridge: Cambridge University Press).
Preisser, E. L., Bolnick, D. I., and Benard, M. F. (2005). Scared to death? The effects of intimidation and consumption in predator–prey interactions. Ecology 86, 501–509.
Puckett, E. E., Orton, D., and Munshi-South, J. (2020). Commensal rats and humans: integrating rodent phylogeography and zooarchaeology to highlight connections between human societies. Bioessays 42:1900160. doi: 10.1002/bies.201900160
R Core Team (2020). R: a Language And Environment For Statistical Computing. Vienna, Austria: R Foundation for Statistical Computing.
Rehnus, M., Wehrle, M., and Palme, R. (2014). Mountain hares Lepus timidus and tourism: stress events and reactions. J. Appl. Ecol. 51, 6–12.
Reshamwala, H. S., Shrotriya, S., Bora, B., Lyngdoh, S., Dirzo, R., and Habib, B. (2018). Anthropogenic food subsidies change the pattern of red fox diet and occurrence across Trans-Himalayas, India. J. Arid Environ. 150, 15–20.
Romero, L. M. (2004). Physiological stress in ecology: lessons from biomedical research. Trends Ecol. Evol. 19, 249–255. doi: 10.1016/j.tree.2004.03.008
Segerstrom, S. C. (2007). Stress, energy, and immunity: an ecological view. Curr. Dir. Psychol. Sci. 16, 326–330.
Seto, K. C., Güneralp, B., and Hutyra, L. R. (2012). Global forecasts of urban expansion to 2030 and direct impacts on biodiversity and carbon pools. Proc. Natl. Acad. Sci. U. S. A. 109, 16083–16088. doi: 10.1073/pnas.1211658109
Shrader, A. M., Brown, J. S., Kerley, G. I., and Kotler, B. P. (2008). Do free-ranging domestic goats show ‘landscapes of fear’? Patch use in response to habitat features and predator cues. J. Arid Environ. 72, 1811–1819.
Sinclair, A. R. E., and Arcese, P. (1995). Population consequences of predation-sensitive foraging: the Serengeti wildebeest. Ecology 76, 882–891.
Slip, D. J., and Shine, R. (1988). Feeding habits of the diamond python, Morelia s. spilota: ambush predation by a boid snake. J. Herpetol. 22, 323–330. doi: 10.2307/1564156
Soanes, K., and Lentini, P. E. (2019). When cities are the last chance for saving species. Front. Ecol. Environ. 17:225–231. doi: 10.1002/fee.2032
Soanes, K., Sievers, M., Chee, Y. E., Williams, N. S., Bhardwaj, M., Marshall, A. J., et al. (2019). Correcting common misconceptions to inspire conservation action in urban environments. Conserv. Biol. 33, 300–306. doi: 10.1111/cobi.13193
Suraci, J. P., Clinchy, M., Zanette, L. Y., and Wilmers, C. C. (2019). Fear of humans as apex predators has landscape-scale impacts from mountain lions to mice. Ecol. Lett. 22, 1578–1586. doi: 10.1111/ele.13344
Taylor, L., and Hochuli, D. F. (2017). Defining greenspace: multiple uses across multiple disciplines. Landsc. Urban Plan. 158, 25–38. doi: 10.1016/j.landurbplan.2016.09.024
Therneau, T., and Atkinson, B. (2019). rpart: recursive Partitioning and Regression Trees. R package version 4.1-15. Available Online at: https://CRAN.R-project.org/package=rpart (accessed March 10, 2021).
Threlfall, C. G., Mata, L., Mackie, J. A., Hahs, A. K., Stork, N. E., Williams, N. S., et al. (2017). Increasing biodiversity in urban green spaces through simple vegetation interventions. J. Appl. Ecol. 54, 1874–1883. doi: 10.1111/1365-2664.12876
Towerton, A. L., Kavanagh, R. P., Penman, T. D., and Dickman, C. R. (2016). Ranging behaviour and movements of the red fox in remnant forest habitats. Wildl. Res. 43, 492–506. doi: 10.1186/s40462-019-0156-6
Valcarcel, A., and Fernández-Juricic, E. (2009). Antipredator strategies of house finches: are urban habitats safe spots from predators even when humans are around? Behav. Ecol. Sociobiol. 63, 673–685. doi: 10.1007/s00265-008-0701-6
van der Merwe, M., and Brown, J. S. (2008). Mapping the landscape of fear of the cape ground squirrel (Xerus inauris). J. Mammal. 89, 1162–1169. doi: 10.1644/08-mamm-a-035.1
Van Dyck, S., Gynther, I., and Baker, A. (2013). Field companion to the mammals of Australia. Sydney: New Holland Publishers.
Wheatley, R., Pavlic, T. P., Levy, O., and Wilson, R. S. (2020). Habitat features and performance interact to determine the outcomes of terrestrial predator–prey pursuits. J. Anim. Ecol. 89, 2958–2971. doi: 10.1111/1365-2656.13353
Wintle, B. A., Kujala, H., Whitehead, A., Cameron, A., Veloz, S., Kukkala, A., et al. (2019). Global synthesis of conservation studies reveals the importance of small habitat patches for biodiversity. Proc. Natl. Acad. Sci. U. S. A. 116, 909–914. doi: 10.1073/pnas.1813051115
Woods, M., McDonald, R. A., and Harris, S. (2003). Predation of wildlife by domestic cats Felis catus in Great Britain. Mamm. Rev. 33, 174–188. doi: 10.1046/j.1365-2907.2003.00017.x
Yin, B., Gu, C., Lu, Y., Hegab, I. M., Yang, S., Wang, A., et al. (2017). Repeated exposure to cat urine induces complex behavioral, hormonal, and c-fos mRNA responses in Norway rats (Rattus norvegicus). Sci. Nat. 104, 1–8. doi: 10.1007/s00114-017-1484-2
Young, J. K., Olson, K. A., Reading, R. P., Amgalanbaatar, S., and Berger, J. (2011). Is wildlife going to the dogs? Impacts of feral and free-roaming dogs on wildlife populations. Bioscience 61, 125–132.
Keywords: predator-prey, risk-sensitive foraging, habitat complexity, urban biodiversity, vegetation management, green space, wild space
Citation: Fardell LL, Nano CEM, Pavey CR and Dickman CR (2021) Small Prey Animal Habitat Use in Landscapes of Fear: Effects of Predator Presence and Human Activity Along an Urban Disturbance Gradient. Front. Ecol. Evol. 9:750094. doi: 10.3389/fevo.2021.750094
Received: 30 July 2021; Accepted: 15 November 2021;
Published: 03 December 2021.
Edited by:
Rusty Gonser, Indiana State University, United StatesReviewed by:
Sonja Knapp, Helmholtz Centre for Environmental Research (UFZ), GermanyCopyright © 2021 Fardell, Nano, Pavey and Dickman. This is an open-access article distributed under the terms of the Creative Commons Attribution License (CC BY). The use, distribution or reproduction in other forums is permitted, provided the original author(s) and the copyright owner(s) are credited and that the original publication in this journal is cited, in accordance with accepted academic practice. No use, distribution or reproduction is permitted which does not comply with these terms.
*Correspondence: Loren L. Fardell, bG9yZW4uZmFyZGVsbEBnbWFpbC5jb20=
Disclaimer: All claims expressed in this article are solely those of the authors and do not necessarily represent those of their affiliated organizations, or those of the publisher, the editors and the reviewers. Any product that may be evaluated in this article or claim that may be made by its manufacturer is not guaranteed or endorsed by the publisher.
Research integrity at Frontiers
Learn more about the work of our research integrity team to safeguard the quality of each article we publish.