
94% of researchers rate our articles as excellent or good
Learn more about the work of our research integrity team to safeguard the quality of each article we publish.
Find out more
ORIGINAL RESEARCH article
Front. Ecol. Evol., 11 October 2021
Sec. Coevolution
Volume 9 - 2021 | https://doi.org/10.3389/fevo.2021.734126
This article is part of the Research TopicEvolution and Function of Acoustic and Visual Signals in Avian Brood ParasitismView all 17 articles
 David C. Lahti1,2*
Egg appearance is notable for its variation and as a source of recognition cues in bird species that are subject to egg-mimicking brood parasitism. Here I analyze the egg appearance of an East African weaverbird species that has variable eggs and is a host of brood parasitism by an egg-mimicking cuckoo, in order to (1) compare population variation to variation within a clutch as a measure of the distinctiveness of eggs; (2) assess modularity versus correlation among egg appearance traits as an indication of the complexity of egg signatures; and (3) address whether the eggs are discretely polymorphic or continuously variable in appearance. I also compare three methods of assessing egg coloration: reduction of spectral data to orthogonal components, targeted spectral shape variables, and avian visual modeling. Then I report the results of egg replacement experiments that assess the relationship between egg rejection behavior and the difference in appearance between own and foreign eggs. Rüppell’s weaver (Ploceus galbula) eggs are variable in appearance between individuals and consistent within a clutch, but vary widely in the distinctiveness of particular traits. Most aspects of color and spotting are decoupled from each other, including coloration likely to derive from different pigments. Egg ground color is bimodal, with a broad continuous class of off-white/UV eggs and another broad class of blue-green eggs. Variation in all other traits is unimodal and usually normal in distribution. Females reject foreign eggs on the basis of the difference in brightness of the ground color and spotting of foreign eggs relative to their own, and the difference in degree to which spots are aggregated at the broad end of the egg. This aggregation is among the most distinctive features of their eggs, but the brightness of the ground color and spotting brightness are not; the birds’ use of brightness rather than the more distinctive chromatic variation to recognize eggs might reflect the salience of achromatic contrast in a dim enclosed nest.
Dramatic and stable trait variation between individuals of the same species, sex, and age living in the same environment has always been compelling to evolutionary biologists, as it requires a more complex analysis than a singular prediction from optimality (Poulton, 1884; Dobzhansky, 1951; Ford, 1965). Bird egg appearance is one of the traits that has consistently been considered in this context, with hypotheses for its variation including drift in the absence of function (Moreau, 1960), parental recognition of eggs when laying sites are crowded (Tschanz, 1959), a toss-up in the face of different selective agents (Kim et al., 1995), and previously unrecognized environmental variation (Blanco and Bertellotti, 2002). By far, however, the most frequently considered hypotheses for intraspecific bird egg variation arise in the context of brood parasitism, and these are also particularly intriguing scenarios because other organisms are evolving to nullify the function. If the victims of brood parasitism evolve the ability to recognize their own eggs and reject foreign ones, the brood parasites can engage in deceptive or aggressive mimicry of host eggs as a counteradaptation, and brood parasite egg polymorphism can result as a byproduct of differing host specialization between lineages within the same brood parasite species (Baker, 1913; Friedmann, 1928). Variation in the eggs of brood parasites might also be adaptive in itself, if they compete to parasitize the same nests and reject each others’ eggs (Brooker and Brooker, 1990; Spottiswoode, 2013). As for the hosts, one anti-counterfeiting strategy is to evolve distinctive eggs to facilitate egg recognition (Bates, 1911) when the brood parasite exhibits egg mimicry. Egg distinctiveness can be achieved by decreasing intraclutch variation and increasing variation between individuals in egg appearance (Davies and Brooke, 1989). To the extent that this phenomenon is occurring, host egg variation has evolved to facilitate self-recognition, since egg appearance traits are an extended phenotype of the mother; although in practicality it can also be considered offspring recognition since the parental trait is physically attached to the offspring and functions in distinguishing them from others. This particular mechanism of egg appearance variation within a species—increasing distinctiveness as a counteradaptation to brood parasitism—has been invoked with evidence as an explanation for increased egg variation in a number of species, such as the great reed warbler (Acrocephalus arundinaceus) (Moskát et al., 2002), blackcap (Sylvia atricapilla) (Honza et al., 2004), village weaver (Ploceus cucullatus) (Lahti, 2005), white-plumed honeyeater (Landstrom et al., 2010), tawny-flanked prinia (Prinia subflava) (Spottiswoode and Stevens, 2012), red-billed leiothrix (Leiothrix lutea) (Yang et al., 2014), and Paradoxornis parrotbills (Yang et al., 2015). Here I introduce a new brood parasite - host system, where the host is known to have variable eggs between individuals.
Rüppell’s weaver (Ploceus galbula) is a small passerine endemic to the Horn of Africa (Ash and Atkins, 2009) and the Arabian peninsula (Shirihai and Svensson, 2018; Figure 1). It is a member of the clade of true weavers (Ploceinae), named for the proficient nestbuilding of the males. The Rüppell’s weaver male is yellow with a striped back, dark rusty mask, and red eyes. The female is a drab green typical of the genus, but lays eggs of any of a variety of pastel colors maculated with speckles and blotches ranging from tawny to nearly black. The species is common within its restricted range, but has received little research attention. Its literature so far consists, besides breeding records and species accounts, of brief treatments of its behavior (O’Grady and O’Grady, 1990; Al-Safadi, 1996; Lahti, 2013), the effect of light on eggshell color (Navarro and Lahti, 2014), and its range expansion in Arabia (Alshamlih et al., 2020). Rüppell’s weaver can be considered an associative nester (Lahti, 2013), in the sense that where one is nesting usually one or more others will also be in close proximity, whether conspecifics, or congeners such as the lesser masked weaver (P. intermedius). A male builds the enclosed basket-like pendant nest, and the female lines it with greenery and soft material and then lays her eggs.
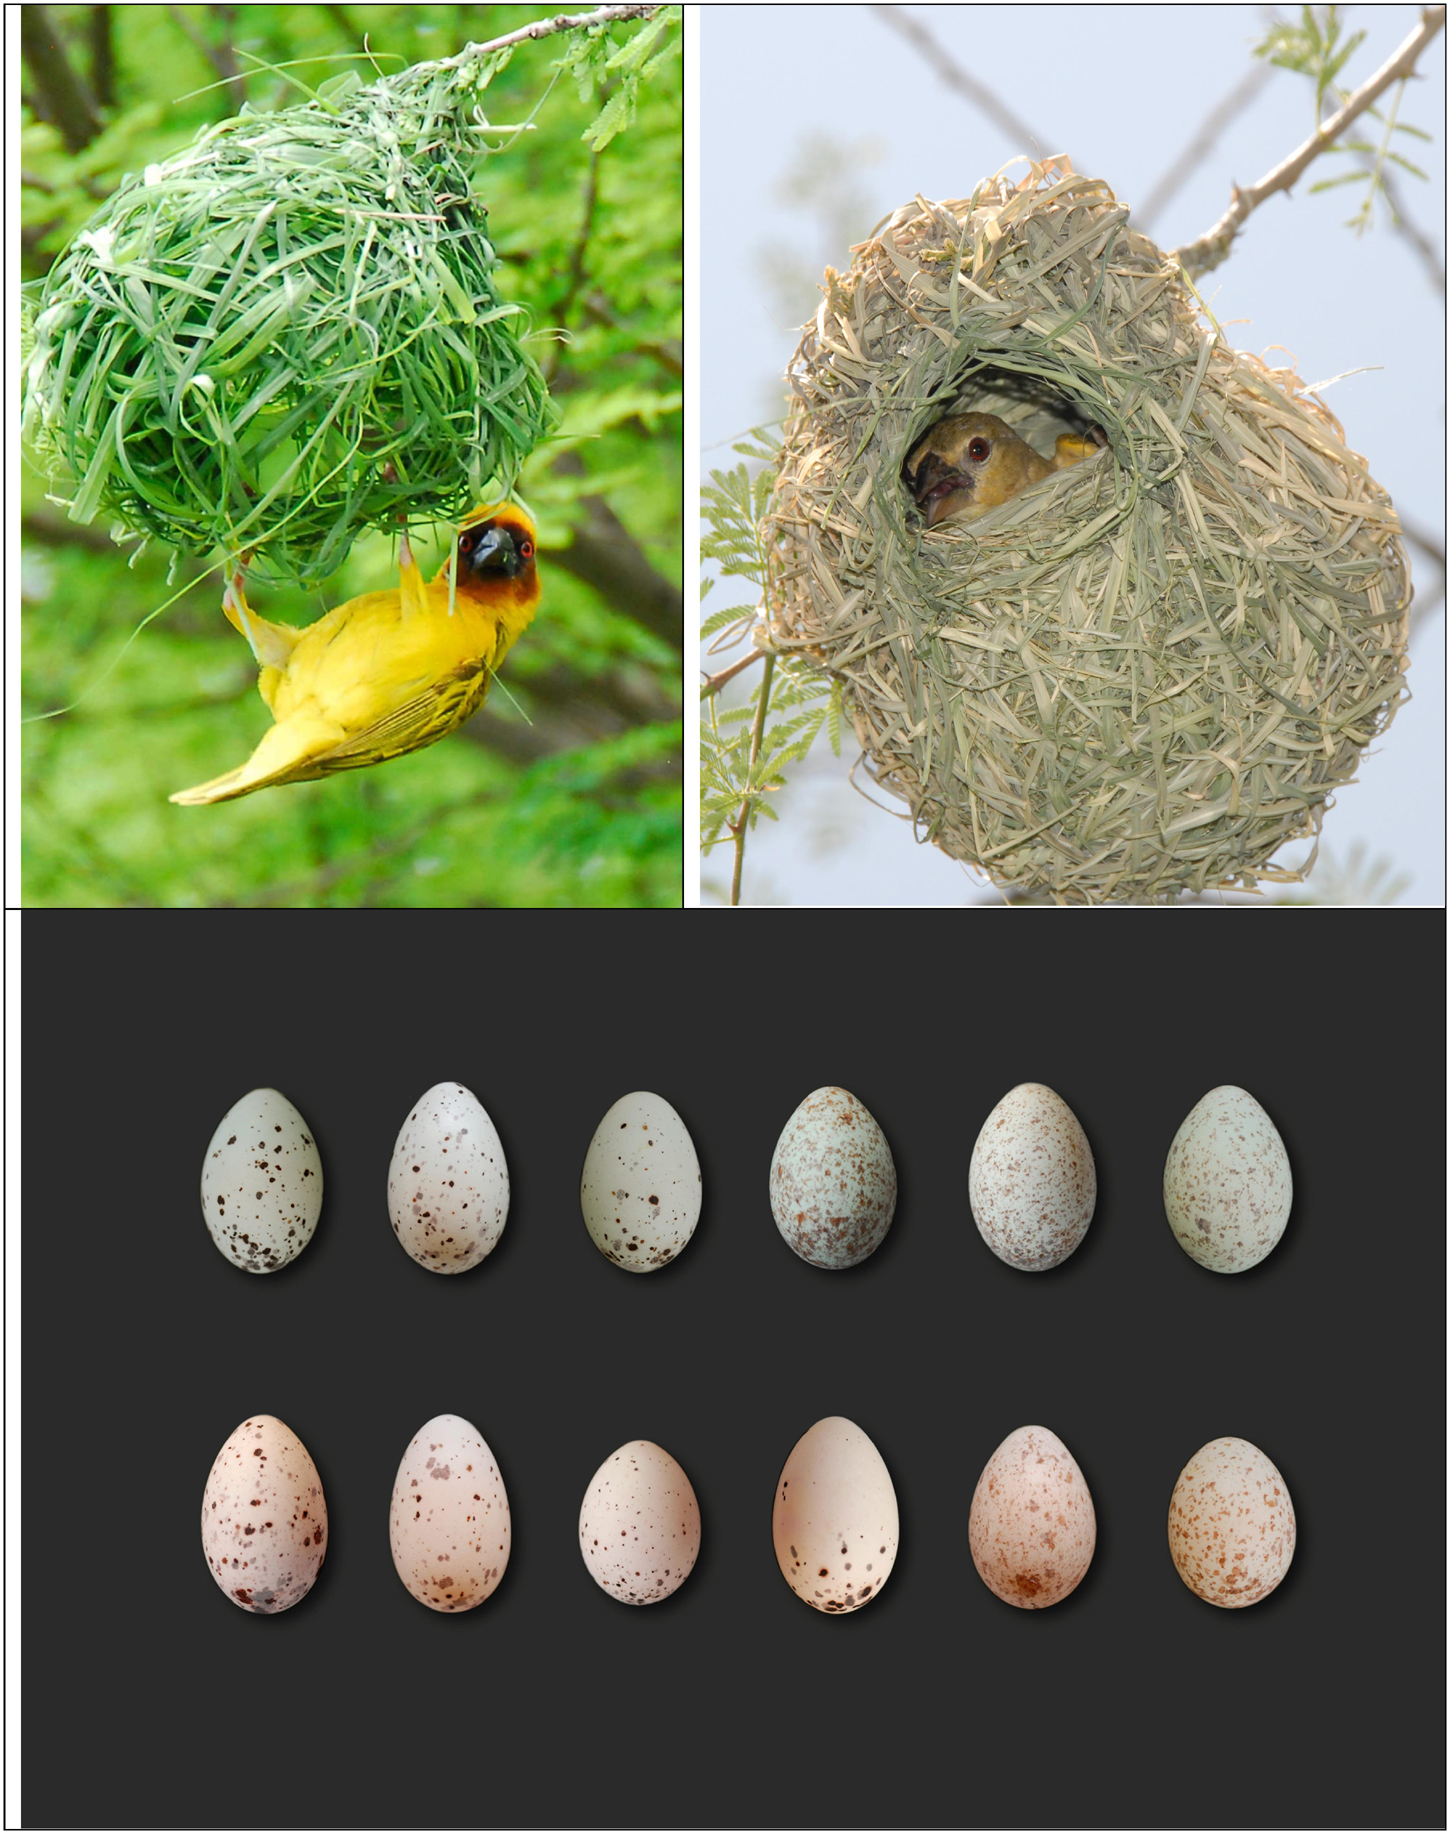
Figure 1. Rüppell’s weaver (Ploceus galbula). Top left: a male at the nest; top right: a female inside the nest. Bottom: sample eggs, each laid by a different female.
Like many other weavers, Rüppell’s has been reported to be subject to brood parasitism by the diederik cuckoo (Chrysococcyx caprius) (Jennings, 2010; Erritzøe et al., 2012; Eriksen and Porter, 2017). This cuckoo is an obligate brood parasite, laying eggs in the nests primarily of weavers (Ploceidae) (Payne, 2005). A young diederik cuckoo upon hatching, usually before the host chicks do, ousts the weaver eggs or nestlings from the nest, and begs for food from its foster parent. Thus, successful parasitism by the cuckoo results in the total loss of a reproductive attempt by the weaver. Some weavers, such as the village weaver (Ploceus cucullatus), are known to use various egg appearance traits in connection with refined egg recognition as an anti-counterfeiting strategy, detecting foreign eggs, and removing them from their nests (Victoria, 1972; Lahti, 2006). The egg appearance traits that have been shown to be effective cues for discrimination in village weavers are egg ground color and spotting pattern (Lahti and Lahti, 2002). The refinement of egg appearance traits and egg recognition is especially necessary because the diederik cuckoo has evolved mimicry of weaver eggs (Payne, 1967), and diverged into apparent egg races, or gentes, that are specialized on different host egg morphs (Jensen and Vernon, 1970). In some weavers, individuals parasitize each other (Jackson, 1992a), which is not as detrimental as cuckoo parasitism as it merely adds an individual to the clutch; nevertheless it might still impose selection for egg recognition (Samaš et al., 2014; Lyon et al., 2015). At least in the village weaver, however, defensive traits function especially in response to interspecific (cuckoo) brood parasitism, as demonstrated by their decay in the absence of the cuckoo (Lahti, 2005, 2006), and the subsequent evolution of egg appearance in accordance with other agents of selection in populations freed from cuckoo parasitism (Lahti, 2008). Rüppell’s weaver is not closely related to the other two weavers that have been studied intensively for egg variation and egg rejection (P. cucullatus and P. taeniopterus), but is in another of three main clades of African Ploceus/Malimbus weavers, each with nearly two dozen species (De Silva et al., 2019; Habig, Childers, and Lahti in prep). Close relatives of Rüppell’s weaver vary widely in whether they have (or are known to have) variable eggs (Freeman, 1988; Urban et al., 2004).
A distinctive feature of egg appearance adaptation to cuckoo brood parasitism is that no particular trait value is expected to be consistently adaptive, because the parasites’ eggs themselves evolve continuously in counteradaptation to host egg evolution (Davies and Brooke, 1988; Spottiswoode and Stevens, 2012). At a given time and place, cuckoo eggs can be expected to be most successful when they are similar (in whatever way leads to acceptance by the host) to the largest possible proportion of current local host eggs. This situation results in mutual frequency-dependent selection between host and parasite. The host’s most adaptive strategy in terms of egg appearance features is not a particular color or spotting pattern per se, but rather individual distinctiveness, consistency, and complexity, traits typically effective in defeating deceptive mimicry (Davies, 2011; Feeney et al., 2012; Caves et al., 2015). Any given weaver’s eggs will be more distinguishable from foreign eggs (whether laid by another weaver or by a cuckoo that has evolved egg mimicry) if they are different in appearance from other prospective host eggs, if they are consistent in appearance with each other, and if egg appearance represents a combination of several components that are limited in their correlation with each other and so can develop (and evolve) independently. Each of these three characteristics would decrease the likelihood that a parasitic egg randomly laid in a weaver nest will resemble the host’s eggs, and would thus increase the effectiveness of egg discrimination by the host. This study assesses egg appearance variation and egg rejection in the Rüppell’s weaver, in order to test whether these predictions are met: whether their eggs are variable between individuals and consistent within a clutch, have multiple modular egg appearance features, and whether the birds attend especially to their eggs’ most distinctive features when detecting a foreign egg.
I also address three auxiliary questions. First, bird egg appearance variation is often described as polymorphic when in fact it could simply be variable; avoiding presumption in this area and distinguishing discrete from continuous variation is a common challenge in trait evolution studies (Rankin et al., 2016; Davison et al., 2019). For weavers in particular, the hypothesis of distinct egg types with rare or absent intermediates is rooted in claims over a century old (Bates, 1911; Swynnerton, 1916), but researchers studying village weaver egg color variation have differed in their adherence to this view (Collias, 1984, 1993; Din, 1992). Pairwise comparisons of eggshell spectra suggest that variation is continuous, except perhaps for white eggs (Lahti and Lahti, 2002; Lahti, 2005), although distributions of particular egg appearance traits were not specifically analyzed. Here I characterize the distributions of egg appearance features in Rüppell’s weaver in order to determine their shape and modality. Second, two egg pigment classes are known to result in egg coloration, biliverdin and protoporphyrin, corresponding roughly to blue-green and reddish-brown coloration (Poole, 1965; Mikšík et al., 1996). Is variation in the production and deposition of these pigments decoupled in weavers, such that they could develop and evolve independently? If so, either no correlation will be found in blue-green and reddish-brown egg coloration between individuals, or a mild negative correlation if the presence of one partly obscures the other. Alternatively, a strong positive correlation between them would suggest a linked production or deposition mechanism; and a strong negative correlation would indicate a trade-off or zero-sum allocation of pigments. Third, three strategies of representing color are commonly used, all based on spectral reflectance, in assessing variation and egg recognition: reduction of all spectral data into objective orthogonal components, spectral shape variables that target spectral peaks or wavelength regions of interest, and avian visual modeling that transforms spectral data according to retinal cone sensitivity. Here I perform all three of these methods and compare the results, especially looking for pros and cons of the approaches. For instance, since birds are looking at their own eggs during egg recognition, does approximating the avian visual system improve the explanatory power of a model of egg rejection?
Breeding Rüppell’s weavers were studied at Awash National Park, Ethiopia (008°53’150”N, 040°02’147”E) in July–August 2010. Males of this species build the nests, to which they attract females, who line the nests, lay their eggs, and solely incubate them (Al-Safadi, 1996). In this study site, Rüppell’s weaver is common, and flocks with other weaver species such as the chestnut weaver (P. rubiginosus), village weaver (P. cucullatus abyssinicus), and lesser masked weaver (P. intermedius). Rüppell’s weavers found at this site resided in single male territories (containing 1–3 nests) or loose aggregations (e.g., 30 nests spread across an area of 25 × 25 m) (Lahti, 2013). Their nests are kidney-shaped and pendulous with an opening on the bottom, hung generally from Acacia trees between 2 and 5 m above the ground. Diederik cuckoos (Chrysococcyx caprius) were seen, and heard singing, throughout this study and in the vicinity of Rüppell’s weaver nests, although no known instance of brood parasitism occurred in study nests over the short period (2–4 days) each was monitored. However, in one case an egg was found in a nest that was very different in appearance from the others, bringing the total number of eggs in the nest to 5, which was not otherwise observed in the sample. Clutch size was determined by repeated nest visits. Clutches were excluded from this assessment if nest or eggs disappeared (presumably to predation), if the nests were abandoned, or if nest visits did not continue at least 1 day following clutch completion.
Egg length (L) and widest width (W) were measured with digital calipers (±0.05 mm); their ratio is considered here as a measure of egg shape. Mass of freshly collected eggs (laid in the previous 1–4 days) was measured with a Pesola spring scale (±0.1 g). These measurements permitted a test of the standard equation for initial mass based on length and width developed by Hoyt (1979).
Egg color was measured with an Ocean Optics JAZ modular UV-VIS spectrophotometer and a pulsed xenon light source. I held a 400-μm reflection probe at a 90° angle 5 mm from the sample. Measurements were standardized with a diffuse tile made of polytetrafluoroethylene that reflects >98% of light over all sampled wavelengths. I performed all measurements under an opaque cloth to avoid an effect of ambient light. Three measurements were taken per egg for ground color. Ground color was measured approximately halfway between the egg poles, in a spot as clear of maculation as possible. In each case the mean of the three measurements was used for analysis.
I assessed the standard error of measurement (SEM) for the spectrophotometric data, on which all ground color variables are based. Both human and instrumental precision in spectral measurements varies, and within-clutch variation can be very small in birds subject to egg-mimicking brood parasitism (Lahti, 2005), possibly approaching the margin of error. The SEM for spectrophotometric data includes imprecision of the measurer and of the spectrophotometric apparatus. SEM also includes any within-egg variation in color that might have been captured by the measurements. In this study, any measures of color variation and any statistically significant egg color morphs are considered potentially biologically relevant only at differences that are greater than the SEM. In this dataset, the global mean SEM for spectral measurements, based on three measurements per egg, was 2.58 (±1.34 across eggs). I also tested whether the relative SEM (mean SEM/mean% reflectance) varies such that it is consistently higher in some spectral regions than in others. The mean relative SEM across wavelengths was 0.048, which indicates that absolute SEM closely tracked% reflectance over the range of 320–700. Therefore the global mean SEM can be used: all measurements of ground color% reflectance should be considered ±2.58 due to random error.
I interpreted reflectance data for color analysis in three ways.
I reduced spectral reflectance values to a few variables with principal components analysis (PCA). The axes in the default output of a PCA are determined so as to maximize the variance explained by the first factor, and then so on for subsequent factors. This often results in brightness (reflectance over all wavelengths) being a highly explanatory first component. I used rotations of the principal component axes, which are equivalent ways to parse the data into factors, to find additional components that were chromatic and had biologically interpretable loading patterns, especially given the range of spectral shapes observed in the population. The original PC1 was preserved for analysis, but the second and third factors were not easily interpretable. Three additional interpretable and explanatory variables were found in another rotation, the varimax. This rotation maximizes the variance of each factor’s squared loadings. For spectral data, this translates into minimizing the overlap between factors in loading on wavelengths, so that a given region of the spectrum will inform only one factor to the greatest extent possible.
I derived univariate measures from the spectral data in an attempt to quantify variation in the observed spectral shapes, using the software Avicol (Gomez, 2006). The spectral features that were distinguished based on visual inspection of the raw spectral data were a peak in the ultraviolet (UV), a peak in the blue-green, and a reddish-brown slope (see “Results” section and Figure 2, top panel). The following variables were derived to describe them, using the shapes (especially inflection points) characteristic of spectra found for this species in the present study (numbers are wavelengths in nm, R = % reflectance):
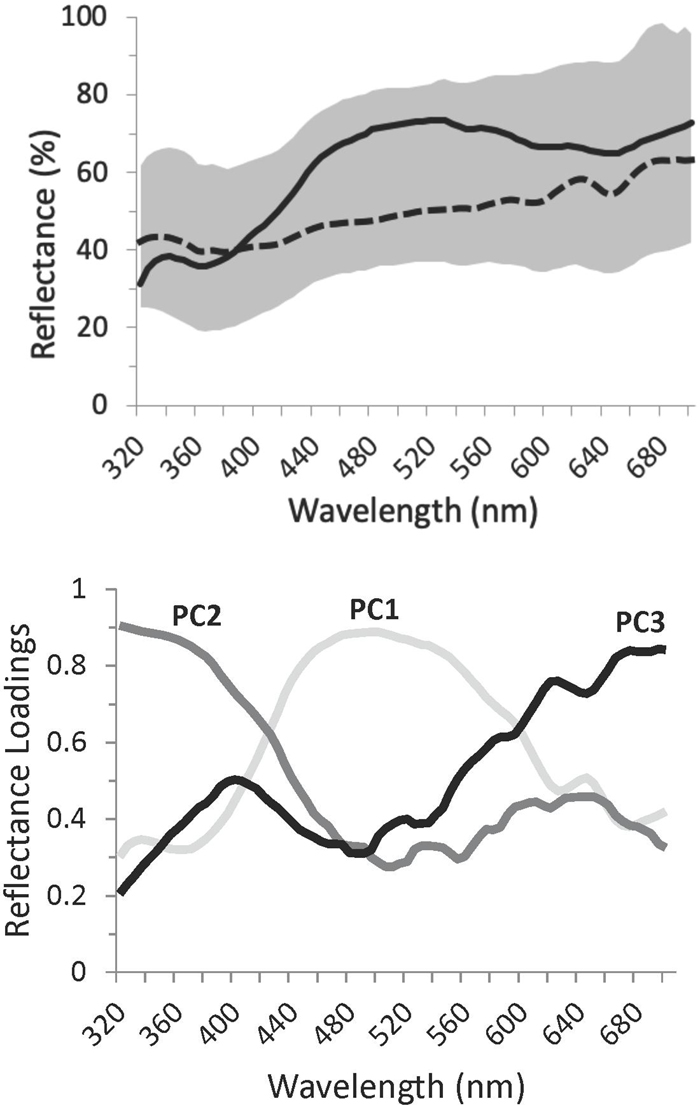
Figure 2. Variation in Rüppell’s weaver eggshell ground color (though influenced to some extent by maculation), in terms of spectral reflectance curves. Top: Range of reflectance in the sample, and two representative egg spectra. The shaded area defines the range of reflectance, across the bird-visible spectrum, of the ground color of 63 eggs in 26 clutches, three or fewer days after laying. The top and bottom edges of this shaded area represent extremes of brightness. To the extent that eggs exhibited chromatic variation in ground color, they were of a bluish hue, indicated by a reflectance hump between 400 and 650 nm, peaking around 500 nm. Extremes of blue chroma in the sample are exemplified by the solid curve (high chroma) and the dashed curve (low chroma). The tendency of the shaded area and the lines to increase in reflectance above about 600 indicates a small degree of reddish-brown in some of the eggs. In many cases this signal resulted from an inability to avoid fine spots when taking spectral measurements of ground color. Bottom: Factor loadings from a Principal Components Analysis of reflectance spectra of all study eggs, indicating three uncorrelated axes of variation: broadly speaking, in blue–green (PC1, explaining 30.8% of the variance), UV (PC2, explaining 23.0% of the variance), and reddish-brown (PC3, explaining 22.6% of the variance). The loading for a particular wavelength indicates the contribution of that wavelength to the respective PC. These curves represent a varimax rotation of the principal components, which distributes variation across the PCs and, in this case, highlights chromatic variation.
The cutoff of 380 nm was chosen because it was approximately the wavelength of minimum reflectance immediately to the right of UV peaks in sample spectra of this species. Generally called “UV chroma,” this term is misleading because the variable is strongly affected by reflectance in other areas of the spectrum besides the UV, including variation that has nothing to do with chromaticity. For instance, increasing reflectance at 700 nm will decrease the value of this variable, and a white egg will have a higher value than a brown egg even if the UV reflectance in both cases is identical and flat. Thus it is better considered simply as proportion UV, in the sense of UV reflectance as a proportion of total reflectance. A second variable focusing on the UV peak is:
where Ruvmax and Ruvmin are the maximum and minimum reflectance between 300 and 380 nm and . This measure focuses on the UV peak without influence by reflectance in other areas of the spectrum. Two further variables focused on blue-green proportional reflectance and peak height:
The cutoffs of 400 and 650 nm were chosen because they approximate the wavelengths of minimal reflectance on either side of the blue-green peak. As a measure of blue-green chroma this has the same issues as proportion UV R above.
following Lahti (2008) where this was used as a measure of blue-green chroma in the eggs of another weaver species. This differs from proportion blue-green R in that it is robust to any variation in the blue-green curve except for peak height, and it is unaffected by variation in other areas of the spectrum.
The cutoff of 650 nm was used because only reflectance above this wavelength can be unambiguously assigned to the red-brown slope rather than the blue-green peak. No more specific red-brown chroma variable was developed for ground color because this would be artifactual: most red-brown chroma was due to an inability to avoid fine dense maculation when gathering a ground color spectral reading. Finally, average reflectance was used to represent brightness:
I used the program TetraColorSpace (Stoddard and Prum, 2008) to convert spectral reflectance to estimated relative photon catches by each of the four cones of a typical UV-sensitive bird’s eye (Goldsmith, 1990; Endler and Mielke, 2005). These cones correspond to maximum sensitivities at 372, 456, 544, and 609 nm, and are represented in TetraColorSpace output by wavelength-indicating variables u (UV), s (short), m (medium), and l (long), respectively (Rüppell’s weaver peak sensitivities might vary from these values, but data are unavailable). These values are represented as proportions, and thus sum to 1. Any color as perceived by a bird can in this way be located in tetrahedral color space, where the value for each variable is maximized (has a value of 1, and all others 0) at one vertex of the tetrahedron, and where all four values are equal at 0.25 at the achromatic origin or centroid of the tetrahedron. TetraColorSpace then converts photon catches into spherical coordinates. From the achromatic center of this tetrahedron, the color vector’s direction, or hue, is defined by two angles θ (the azimuth or horizontal angle away from a plane cutting perpendicular midway between the m and l vertices, ranging from −π to +π) and φ (the elevation or vertical angle from the horizontal plane if the tetrahedron is arranged with the u vertex upward, ranging from −π/2 to +π/2). Since the outside surface of the tetrahedron represents the maximum distance from the achromatic center for a particular direction, the vector’s magnitude r is considered saturation or chromaticity. Because different colors have different maxima, I used the standardized “achieved chroma” (rA) that is scaled to its maximum for a given vector direction (Stoddard and Prum, 2008). I then applied these variables to an assessment of color variation using span analysis, volume analysis, and hue disparity analysis, all available in TetraColorSpace. Span analysis computes the average color contrast in terms of Euclidean distance between two points in the population. Volume analysis defines the three-dimensional size of the space occupied by the population by finding the minimum convex polygon containing all data points. Hue disparity analysis extracts hue (color vector angle) differences from differences in saturation (chromaticity, color vector magnitude), and represents contrast as a proportion, where 0 is the identical hue and 1 is its complementary, and thus maximally different, hue. All three of these measures ignore brilliance or brightness, however, so this feature was analyzed separately. Brilliance analysis in TetraColorSpace is equivalent to brightness analyses in Avicol, values being identical to three significant digits; only Avicol brightness data is presented here.
Four intuitive and quantitative measurements have been used previously to measure the variation in spotting of weaver eggs (Lahti and Lahti, 2002; Lahti, 2005): density, size, color, and aggregation toward the broad pole of the egg. However, in those studies the quantification of just a few eggs provided an index, and the bulk of the sample was assessed qualitatively according to the index. Here I use procedures in Adobe® Photoshop to further specify the method and fully quantify all spotting pattern characterizations. Eggs were photographed with a Nikon D200 digital SLR camera from three perspectives: lateral, and each pole of the egg. An 18% gray card and a ruler were placed in the background, and were used to standardize the image color (via “Curves”) and size (via “Set Measurement Scale”) after import. Spots were isolated in the image with the Magic Wand tool with anti-aliasing, by selecting contiguous ground (non-spot) area, after which spot measurements can be made automatically. In this species, each egg has two and sometimes three layers of spots separated by layers of ground color; these spots were considered separately, but all values are combined in analyses here. For spot density, size, and color, the lateral perspective of the egg was used. Density was calculated as a proportion: the ratio of the area occupied by spots to the total area of the egg in the image. Spot size was calculated as the ratio of the total area of spots to the number of spots counted, which yields the average spot area. Spot color was assessed in terms of brightness only, after spectrophotometry showed that this was the main axis of variation in spotting. Spectrophotometry was not ideal for measuring spots, however, as the area over which the reflection probe takes data is broader than most of the spots in this species. Instead, Photoshop was used to calculate the 8-bit gray value (range: 0–255, black to white) of the spots in the standardized photographs. The mean of this value was used for spot brightness. Spot aggregation toward the broad pole of the egg was assessed using the photographs of the two ends of the egg. The area of spots was calculated for each image, and the degree of aggregation was considered to be 1 − (area of spots at the narrow end/area of spots at the broad end). This yields a range between 0 and 1, where 0 is an even distribution of spots throughout the egg, and 1 is the aggregation of all spots at the broad end of the egg.
Polymorphism in a strong sense would indicate discrete types with no intermediates. A weaker sense of polymorphism might be satisfied merely by a polymodal trait distribution. I tested for polymorphism in this weaker sense, of all egg color, maculation, size, and shape variables described above, using Hartigan’s dip test for unimodality (Hartigan and Hartigan, 1985), along with visual inspection of histograms. Of particular interest was whether eggs that appear to be different colors (e.g., whitish vs. bluish) or have different color spots (light vs. dark) represent egg type morphs or continuous variation.
Distribution shape was examined by skewness and kurtosis; a significant departure from normality was concluded when the absolute value of the ratio of the statistic to its standard error (skewness/SES or kurtosis/SEK) was greater than 2. Significant skewness indicates asymmetry of the distribution around the mean, either to the right (positive values) or left (negative values). Significant kurtosis indicates either that the distribution has longer tails than normal (positive values) or is flatter than normal (negative values).
Trait interactions were investigated by conducting Pearson correlations among the variables, Bonferroni corrected for multiple comparisons. Certain comparisons were of particular interest: whether egg shape is conserved across egg sizes (whether length and width are correlated); whether variation in egg size is achieved primarily in one dimension or the other (whether length/width ratio is correlated with egg mass); whether color or maculation varied with egg size; whether different ways of measuring qualitatively similar color features were highly correlated; and whether any egg color features, such as different spectral peaks, are decoupled from each other.
Based on the range and nature of population variation in egg appearance features, I calculated how much of this variation for each egg appearance trait was between individual (BI) vs. within-clutch (WC), using ANOVA to derive sums of squares, where WC = SS (error) and BI = SS (group, i.e., clutch). This permitted the production of a distinctiveness score D = 1 − (WC/BI) for each egg appearance variable. A score approaching 1 for a given feature indicates very little within-clutch variation compared to great between-individual variation, rendering the eggs within a particular clutch highly distinctive in the population with respect to that feature, and representing the ideal situation for egg discrimination. A score nearing 0 indicates equal within-clutch and between-individual variation, meaning that a random egg in a nest could be own or foreign with equal probability, rendering discrimination impossible on the basis of that feature. Ideally, both BI and WC would be calculated on the basis of the means of complete clutches; I performed this analysis first. This strategy is likely to be relatively accurate for WC, but might underestimate BI and thus distinctiveness in some cases because it restricts the number of clutches that are sampled. Therefore I also calculated D in a second way that is more accurate at assessing BI, via pairwise comparisons. Disparity measurements within a clutch were taken, allowing the inclusion of potentially unfinished clutches: two eggs for each WC comparison were chosen at random from clutches with more than two eggs, and one-egg clutches were excluded. This increased the sample of clutches, increasing the estimate of BI; however, WC was systematically underestimated, perhaps leading to an inflated estimate of egg distinctiveness in some cases. These two ways of estimating within-clutch and between-individual variation translate into D scores that are presented here as endpoints of a range. WC values cannot be considered to account fully for within-individual variation, however, as only one clutch was measured per female.
A single conspecific egg (hereafter, “foreign egg”) was introduced into each experimental Rüppell’s weaver nests (N = 24) to mimic parasitism by conspecifics or the diederik cuckoo. Two cases ultimately had to be discarded for missing egg appearance data. In accordance with the typical behavior of the diederick cuckoo (Friedmann, 1968), a host egg was removed from the nest at the same time, such that there was no change in the number of eggs in the nest as a result of the experimental procedure. The experimental protocol and relevant portions of the data analysis followed Lahti and Lahti (2002) and Lahti (2006) on four populations of another weaver species (the village weaver Ploceus cucullatus), so that results would be comparable between species. I wrote a number for identification on the side of each egg. In six control nests, the eggs were handled and numbered and replaced in the same nest. In five of these cases the female continued to incubate the eggs and did not reject any. In one nest both eggs were gone (the nest was empty) on the day after the manipulation; predation and the weaver’s rejection of both of her own eggs cannot be distinguished in this case, although in no other case did a weaver reject her own eggs but no foreign egg. I checked each nest 24–28 h (n = 13) or 48–52 h (n = 9) after experimental parasitism and noted whether any eggs were damaged or missing, in which case they were considered rejected. A previous study on village weavers showed that all rejections happened within 24 h (Lahti and Lahti, 2002). All egg replacements were performed during or within 3 days after the laying period of the female. Experimental eggs were chosen in real time in order to achieve approximately a 50% rejection rate, as binary logistic regression is only as powerful as the less common of the two response states.
Egg appearance differences between host and foreign eggs were calculated for each variable separately, as the absolute value of the difference between the foreign egg and the host egg that was nearest to the foreign egg in that variable, whether that host egg was already in the nest at the time of the egg replacement or was laid afterward. Thus, different host eggs were compared to the foreign egg for different variables if the host clutch varied in which egg was minimally different from the foreign egg. The reason for comparing the closest egg in the clutch for each appearance variable rather than the mean of all host eggs, as is sometimes done, is to avoid confounding host-foreign clutch differences with host within-clutch variation (Lahti, 2006). For any particular mean value of a host egg appearance variable, a foreign egg is necessarily less distinctive in a host clutch with higher variation around that mean than with lower variation. Using the mean value would ignore this difference. Comparing a foreign egg to the nearest egg in the clutch for each variable is one way of circumventing this issue.
The calculated egg appearance differences included all the variables described above, including three ways of measuring color [PCA of spectra (three variables), reflectance peaks and proportions (five variables), and photon catches in TetraColorSpace (three variables)]; maculation (four variables); and size and shape (four variables). For spectral measures of color, differences were calculated between the reflectance values of the ground color of the two eggs between 320 and 700 nm. A (second) PCA was performed on these values. The spectral differences between host and foreign egg ground color were most interpretable without rotation of the principal components. In this analysis, three factors explained 73.2% of the variation, with no remaining component explaining more than 1.7%. PC1 loaded highly across 400–700 nm, and so represents differences in brightness excluding UV. PC2 loaded positively in UV (max at 355 nm) and negatively in blue (min at 490 nm); thus high and low PC2 values show differences in both blue and UV, but in opposite directions. PC3 loaded negatively on reddish-brown.
Factors potentially influencing egg rejection were analyzed by logistic regression (Hosmer and Lemeshow, 1989) with SYSTAT 10.0 software (SPSS Inc., Chicago IL), following Lahti (2006). The response variable was binary, namely whether or not the female rejected any eggs from her nest. In all cases of rejection, the female ejected at least the foreign egg, and sometimes damaged or ejected one of her own as well. In addition to all egg appearance difference variables, clutch size and whether the weaver laid a new egg after experimental parasitism were also included. First, variables were tested in univariate (single logistic regression) models, candidate variables being chosen on the basis of the log-likelihood of models at convergence; specifically, a likelihood-ratio (G) test was performed on each model, which results in a P-value of that model compared to a constant-only model. For each parameter in a significant model, a t-ratio compared the estimate to the standard error (SE) of the parameter. To correct for possible misspecification of models, covariance matrices were adjusted according to quasi-maximum likelihood (QML) to yield revised SE, t, and parameter-specific P-values (White, 1982). The most appropriate multivariate (multiple logistic regression) model was chosen by forward stepwise regression (with P = 0.15 as the threshold for variable inclusion) followed by comparisons (G tests) of the final model with all nested subsets. Significant models were assessed in two ways. First, McFadden’s Rho-squared (ρ2), sometimes called “pseudo-R2”, was used as an estimate of explained variation or goodness-of-fit; it is similar in interpretation to the R2 of linear regression, but generally with lower values (Long, 1997). Second, sensitivity and specificity assessed the predictive capacity of the model. Sensitivity is the true rate of egg rejection when rejection is predicted by the model; and specificity is the true rate of egg acceptance when acceptance is predicted by the model. For continuous variables except for proportions, each significant model also yielded an odds ratio, the increase in the probability of egg rejection for one unit increase in the parameter. Also reported is the difference in each egg appearance variable in the best univariate and multivariate models to result in egg rejection 50% of the time. This is the LD50, the “median lethal dose” in toxicology; as rejection results in the death of the foreign egg, the concept is directly translatable as the median lethal difference (between the own and foreign eggs).
Each Rüppell’s Weaver clutch usually consisted of three eggs, less often two or four (mode 3, mean 2.74, SD 0.54, N = 23). Using Hoyt’s (1979) equation for egg mass, this species’ mass coefficient was calculated as Kw = 0.499, such that initial mass can be estimated with minimum error as 0.499 × LW2, where L and W are egg length and width, respectively. The error of this estimate (its departure from known egg mass values) is 5.4 ± 4.3%. Length, width, and mass were normally distributed. Egg shape was not conserved across egg sizes (length and width were not correlated). Variation in egg size was not achieved primarily in the length or width dimension (length/width ratio was not correlated with egg mass). Thus, an egg of any particular size was not significantly biased within the observed range of shapes, and an egg of any particular shape was not significantly biased within the range of sizes. Egg size and shape characteristics are listed in Table 1. Egg size and shape features were highly distinctive among clutches, the mean estimates for D scores exceeding 0.80 for length, width, mass, and shape. Egg shape (length/width ratio) was the most distinctive at D = 0.90. Neither egg ground color nor maculation correlated with egg size or shape.
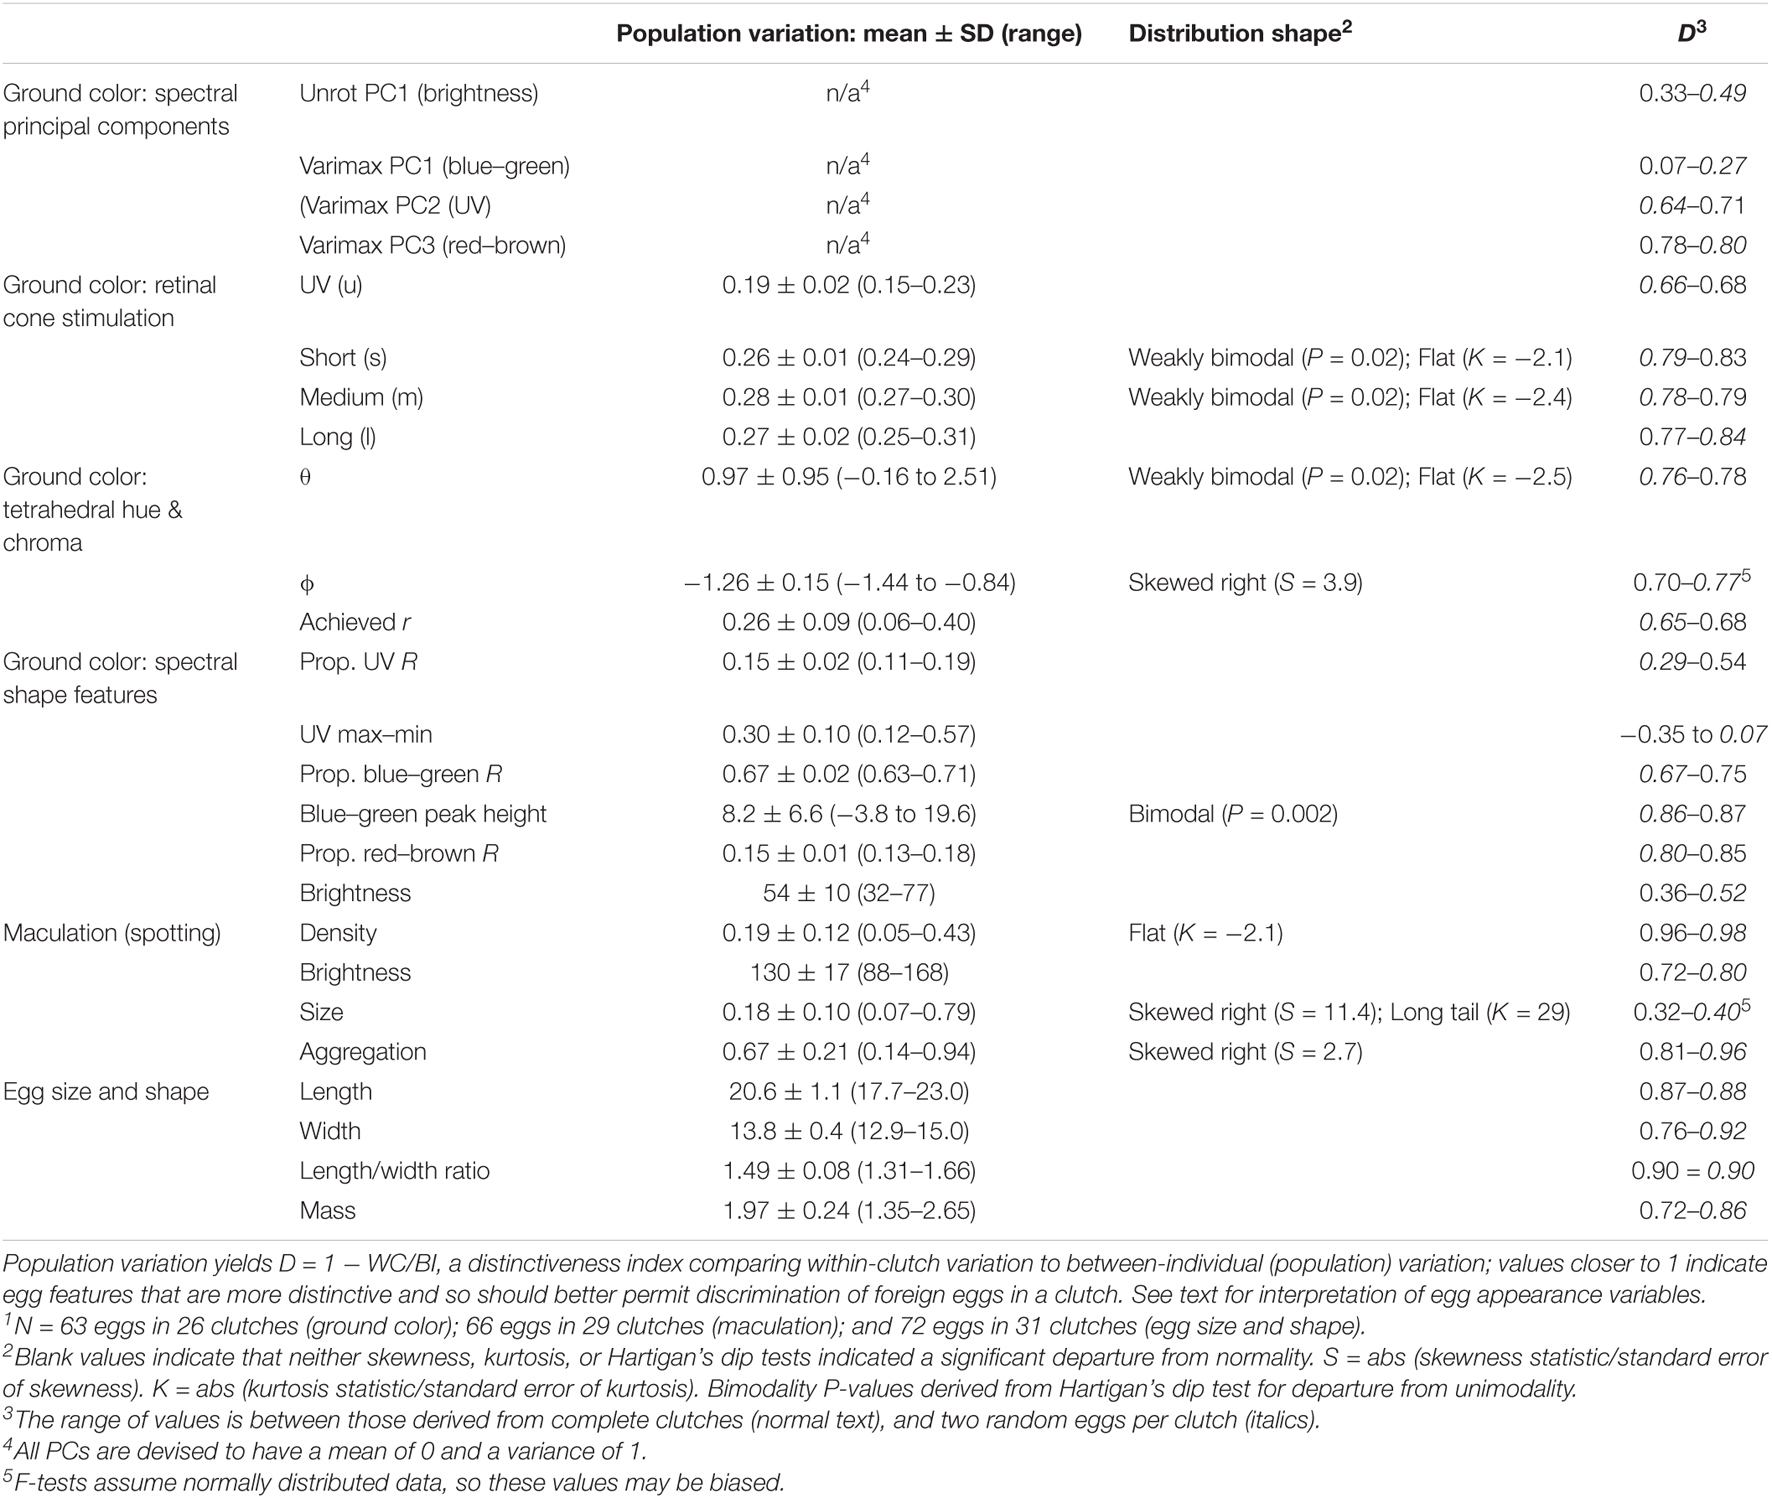
Table 1. Statistics relating to appearance of Rüppell’s weaver (Ploceus galbula) eggs and the structure of their variation1.
Representative Rüppell’s weaver eggs are illustrated in Figure 1 (bottom panel), and the range of reflectance of sample eggs’ ground color over the bird-visible spectrum is illustrated in Figure 2 (top panel). Such graphical representation, although showing variation in brightness (average reflectance) in the sample, obscures chromatic (spectral shape) variation. Examples of the two ends of the continuum of spectral shape in this sample are represented by the two curves in Figure 2 (top panel).
Qualitative assessment of the shapes of the reflectance spectra yielded three main results. First, all eggs have a peak in the bird-visible portion of the ultraviolet (UV) region of the spectrum (320–400 nm), peaking toward the lower end of this range and reaching a minimum around 380 nm. Second, most eggs have another peak around 500 nm, broadly spanning from 400 to 650 nm, corresponding to blue-green (e.g., solid line in Figure 2, top panel). Eggs vary in terms of which of these two peaks is higher. Some eggs have no blue-green peak, resulting in a whitish apparent color, although they are in fact ultraviolet. Third, all eggs have maculation, and in some cases this influences the appearance of the ground color, resulting in a nearly linear (but irregular) inclining curve between 450 and 700 nm (e.g., dashed line in Figure 2, top panel).
Quantitative analysis of color was by reduction of spectral data into orthogonal components, identification of broad spectral shape features, and estimation of bird retinal photon catches. Table 1 contains descriptive statistics, departures from normal distribution, and D scores.
As expected, PC1 in the unrotated principal components output loaded consistently and heavily (0.8–1) over the entire spectrum, and therefore can be considered brightness. This factor explained 67.5% of the variation in the data. Following varimax rotation, such that each wavelength contributes maximally to a single factor, the loading curves strikingly resembled the spectral shapes of particular color patterns observed in the raw data, facilitating biological interpretability and comparison with the other analyses: PC1 (which explained 30.8% of the variance) loaded in a broad peak centered at 500 nm, representing blue-green. PC2 (which explained 23.0% of the variance) rose in its loading as wavelength shortened, into a plateau in the UV. PC3 (which explained 22.6% of the variance) had a loading pattern rising in the long wavelengths, resembling the reflectance of reddish-brown (Figure 2, bottom panel). None of the spectral variation deviated from normality. Distinctiveness of variables was highly variable, and roughly opposite to the amount of explained variation. Thus the two PC1s (brightness and blue-green) conferred very little distinctiveness, but PC2 (UV) was higher (D = 0.64–0.71), as was PC3 (red-brown) (D = 0.78–0.80; Table 1).
Spectral shape variables differed widely in their variation and contribution to distinctiveness. Proportion UV R and UV max-min both measured UV reflectance, but in different ways, the former representing it as a proportion of total reflectance, and the latter in terms of peak height in relation to average UV reflectance only. These variables were completely uncorrelated (r = 0.02). Proportion UV R varied less in terms of standard deviation relative to its mean (CV = 0.13), and conferred distinctiveness to eggs only weakly (D = 0.29–0.54); UV max-min, despite greater relative variation (CV = 0.33), was the least distinctive feature of all egg appearance variables between clutches, generally varying more within a clutch than between individuals (D = −0.35 to 0.07). Blue-green chroma was measured in two ways as well, one as a proportion of total reflectance (Proportion blue-green R) and one as the reflectance difference between the max and min in the short to medium VIS wavelengths (Blue-green chroma peak height). These values were highly correlated (r = 0.91), but differed greatly in their standard deviation relative to the mean, with proportional blue-green CV = 0.03, and the blue-green peak height CV = 0.81, second in magnitude only to the spherical coordinate θ among egg appearance variables. Both measures of blue-green contributed to egg distinctiveness between clutches: D = 0.67–0.75 for Proportion blue-green R, and D = 0.86–0.87 for Blue-green chroma peak height, the highest value among ground color variables. Blue-green chroma peak height also was strongly bimodal (P = 0.002), which is visually evident from the histogram (Figure 3). Red-brown (long wavelength) chroma had a low standard deviation around its mean (CV = 0.07) but nevertheless contributed substantially to distinctiveness (D = 0.80–0.85). Brightness was variable in terms of range (32–77% reflectance), but less so in terms of standard deviation around the mean (CV = 0.19), and conferred only weak to moderate distinctiveness to eggs (D = 0.36–0.52). No spectral shape features besides Blue-green peak height departed from unimodality or normality. Between these measures, proportional measures of blue-green and UV were negatively correlated (r = −0.78), as was the blue-green peak height with the proportional measure of red-brown (r = −0.61).
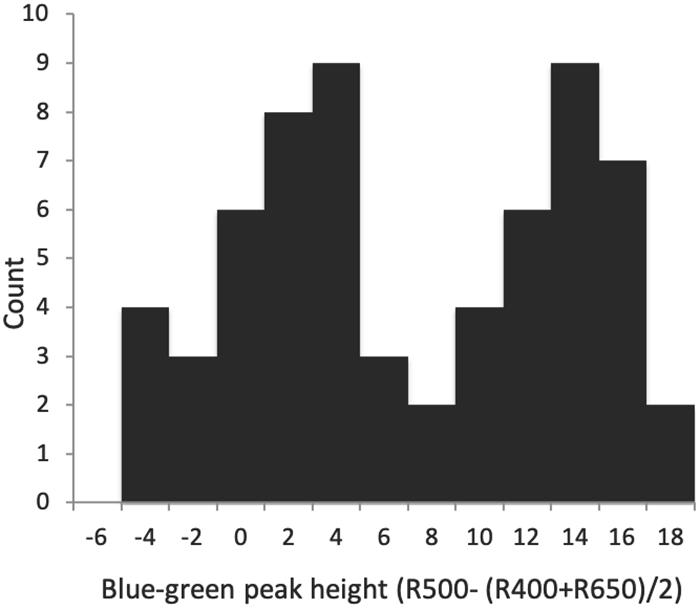
Figure 3. Histogram of blue–green spectral reflectance peak height of Rüppell’s weaver eggs (63 eggs in 26 clutches), suggesting a bimodal distribution of color.
Bird retinal cone stimulation values, as calculated by TetraColorSpace, yielded a quantitative assessment of color that takes into account estimated wavelength-specific photon catches by the four cones of a typical bird retina of the UV sort, i.e., one of whose cones’ maximal sensitivity is in the UV. Mean color span (Euclidean distance in color space) was 0.036 (s2 0.0003); volume (size of a minimum convex polygon enclosing the points in color space) was 0.00002; mean hue disparity (color contrast proportion) was 0.33 (s2 0.052, max 1.0); average brilliance (mean proportional reflectance over 300–700) was 0.54, and average chroma (r) was 0.068 (s2 0.0005). This value is the magnitude of the saturation vector starting at the achromatic origin at the centroid of the tetrahedron, uncorrected for variation in how far from that point a vector can go within a tetrahedron; correction yields an “achieved r” rA of 0.26 (s2 0.008), which is thus the proportion of maximum saturation.
The four wavelength-specific photon catch variables corresponding to retinal cone sensitivities (u = UV, s = short, m = medium, and l = long) are proportional and sum to 1. The three VIS cones had comparable mean stimulation, with the UV cone value being only 70% of these. The variation in all cone catches was remarkably low compared to other variables (CV < 0.1), indicating robustness of the relative stimulation of cones to the spectral variation in the sample. The correlations between these variables can be related to the typical colors observed in the sample: s and m were highly correlated (r = 0.86), reflecting their overlap at the peak of blue-green; l and s were negatively correlated (r = −0.79), as reddish-brown obscures the blue ground. The highest correlation was a negative relationship between m and u (r = −0.93). Despite the low variation in photon catch variables, the spherical coordinate θ varied widely (CV = 0.98). The mean egg hue in this dimension was a 1 (range −0.16 to 2.51) on a −π to + π scale where 0 is at the midpoint between m and l vertices. With respect to the other directional spherical coordinate, φ, which varies from −π/2 to +π/2, the mean egg hue was −1.26 (range −1.44 to −0.84). The chromaticity of the eggs was low, indicated by rA values of 0.26 (range 0.06–0.40), where these values are proportions of maximum saturation. Both s and m, and the angular variable θ, were weakly bimodal (P = 0.02), and flatter than normal (K = −2.1 to −2.5). All of the photon catch variables and the three spherical coordinates were distinctive between clutches: all were in the D = 0.70–0.84 range except for u and the saturation variable rA, which were less distinctive at D = 0.65–0.68 (Table 1). Visualization of photon catch results in tetrahedral space yields a distribution of points nearly in a plane, situated near the achromatic centroid, with variation primarily in two axes: between l and the midpoint of s and m vertices (i.e., between red and blue-green); and in the u (UV) axis (Figure 4). Also evident from visualization is an apparent bimodality, where some eggs are more UV and less blue–green, and others are less UV and more blue–green (Figure 4, right panel).
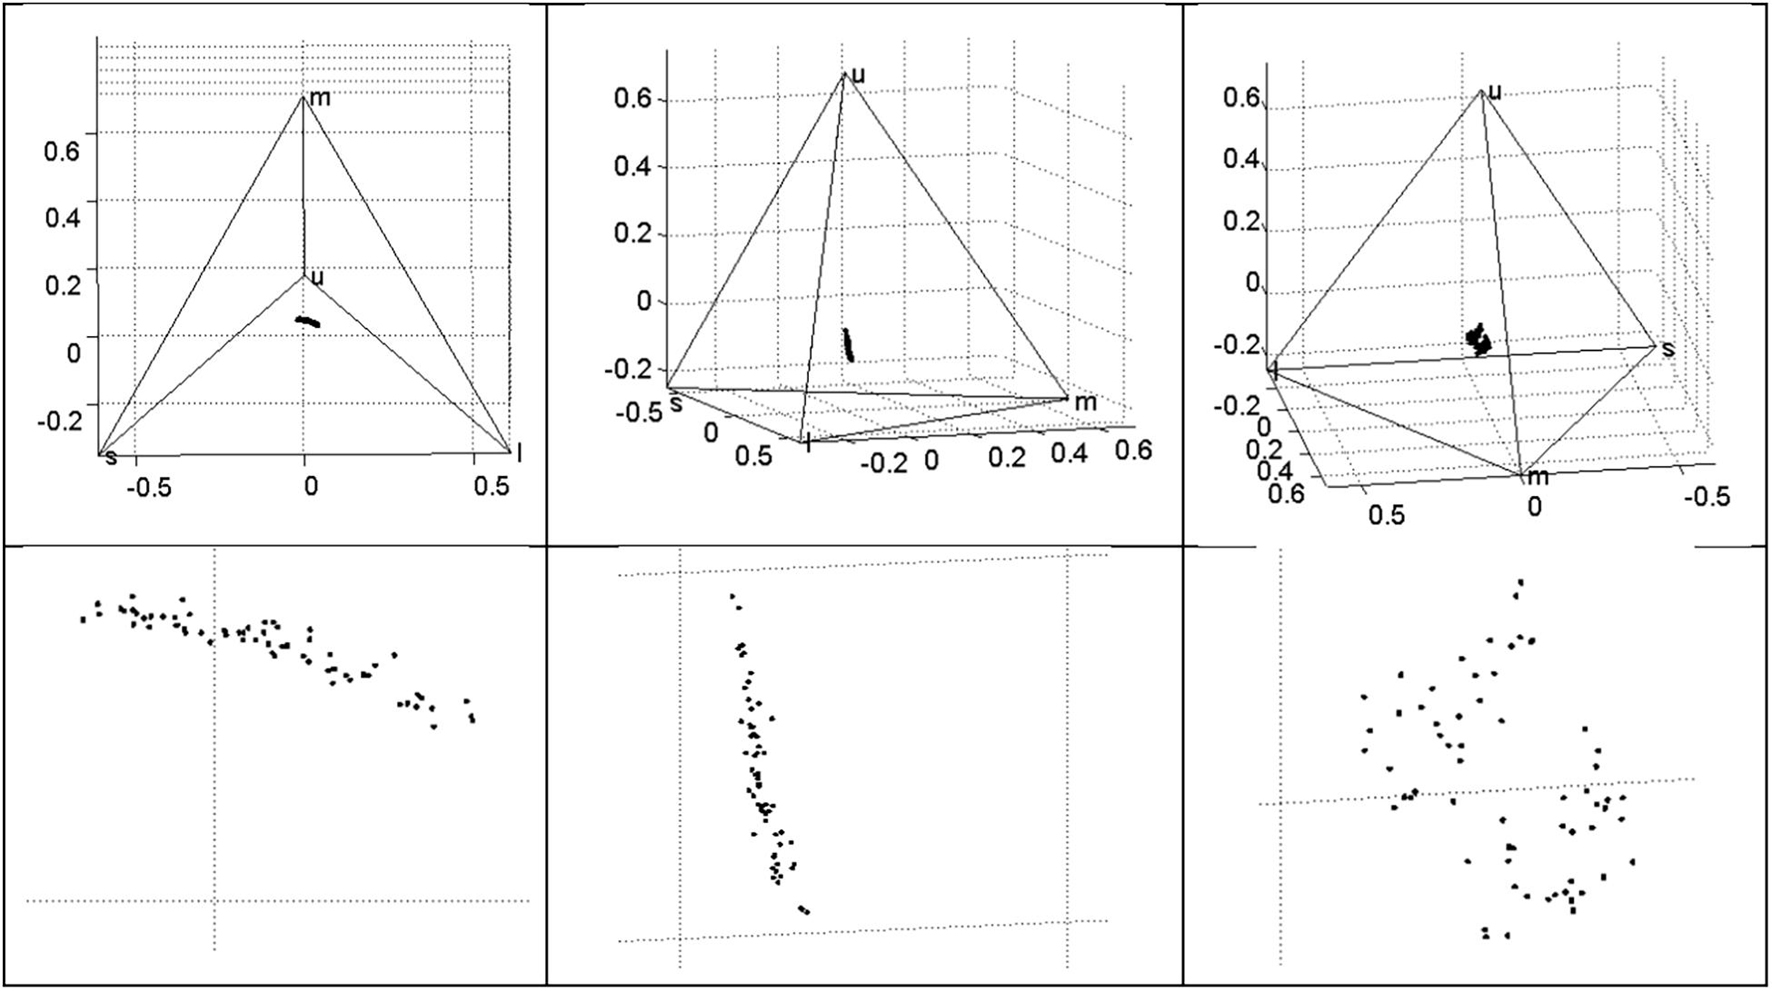
Figure 4. Variation in Rüppell’s weaver eggshell ground color (though influenced to some extent by maculation), in terms of photon catches for an average avian UV-type retina, plotted in tetrahedral space, where each vertex represents a cone type, and where proportional photon catch for a given cone type reaches unity at the vertex. Variation can be characterized as a plane near the achromatic origin (centroid) that varies mostly in the UV axis and the axis between long (red) and short-medium (blue–green) wavelengths. The variation is apparently bimodal (right panel).
The three methods of ground color measurement, as determined by reflectance (based on spectrophotometry with an attempt to avoid spots), yielded largely concordant results, but with a few stark exceptions. For brightness (average reflectance), the unrotated PC1 correlated almost perfectly (r = 0.97) with a direct measure of average reflectance over the 300–700 nm wavelengths, and the latter perfectly agreed (r = 1.00) with automated TetraColorSpace assessment of brilliance. For UV, the varimax PC2, proportional UV reflectance, and the u photon catch in TetraColorSpace were all highly (r > 0.9) correlated with each other; the exception was UV max-min, the reflectance-adjusted UV peak height, which did not correlate. The tetrahedral directional (hue) coordinates were not correlated with UV, but the magnitude (saturation) variable RA was perfectly (r = −1.00) negatively correlated with u. For blue-green, both s and m photon catches, proportional blue–green reflectance, and blue–green peak height measures were all highly correlated (r > 0.8), with blue–green peak height being most strongly correlated with the other measures (r > 0.9). The odd variable out was the varimax-rotated PC1, whose loading indicated blue–green reflectance, but whose values were not significantly correlated with any other variables aimed at blue–green chroma. For red–brown, all three measures (PC3, the proportional reflectance measure, and photon catch variable l) are all highly correlated (r > 0.95). The tetrahedral chromaticity vector rA was again dramatic in its relation to particular colors, having no correlation (r = 0) with reddish-brown (l), but tracking variation in blue-green (m) closely (r = 0.93).
Variation in blue-green and reddish-brown was largely decoupled, all relevant correlations being moderately negative, including the proportional reflectance measures (r = −0.34) photon catch variables m and l (r = −0.28), and red-brown proportional reflectance versus blue-green peak height (r = −0.61).
Maculation was in the form of spots and small blotches (Figure 1, bottom panel). Two layers were typically visible, as has been shown in many birds, being known as primary (darker) and secondary (lighter) spots (Baerends and Drent, 1982; Brown and Sherman, 1989) (Note that the naming of the spot layers was from the perspective of the viewer and opposite to the order of deposition). Although the spots in the different layers appeared to be of the same hue, they were separated by a layer of ground color and so the deeper secondary layer was distinctly fainter than the top primary layer. In some cases, three layers of spots seemed to be present.
The density of maculation ranged widely, covering 5–43% of the surface of the egg; it had the highest standard deviation relative to its mean of any spotting variable (CV = 0.63), and its distribution was significantly flatter (more even) than normal (K = −2.1). Spot density lent the highest distinctiveness to eggs of any egg appearance variable, at D = 0.96–0.98 (Table 1; raw variation shown in Figure 5, first panel).
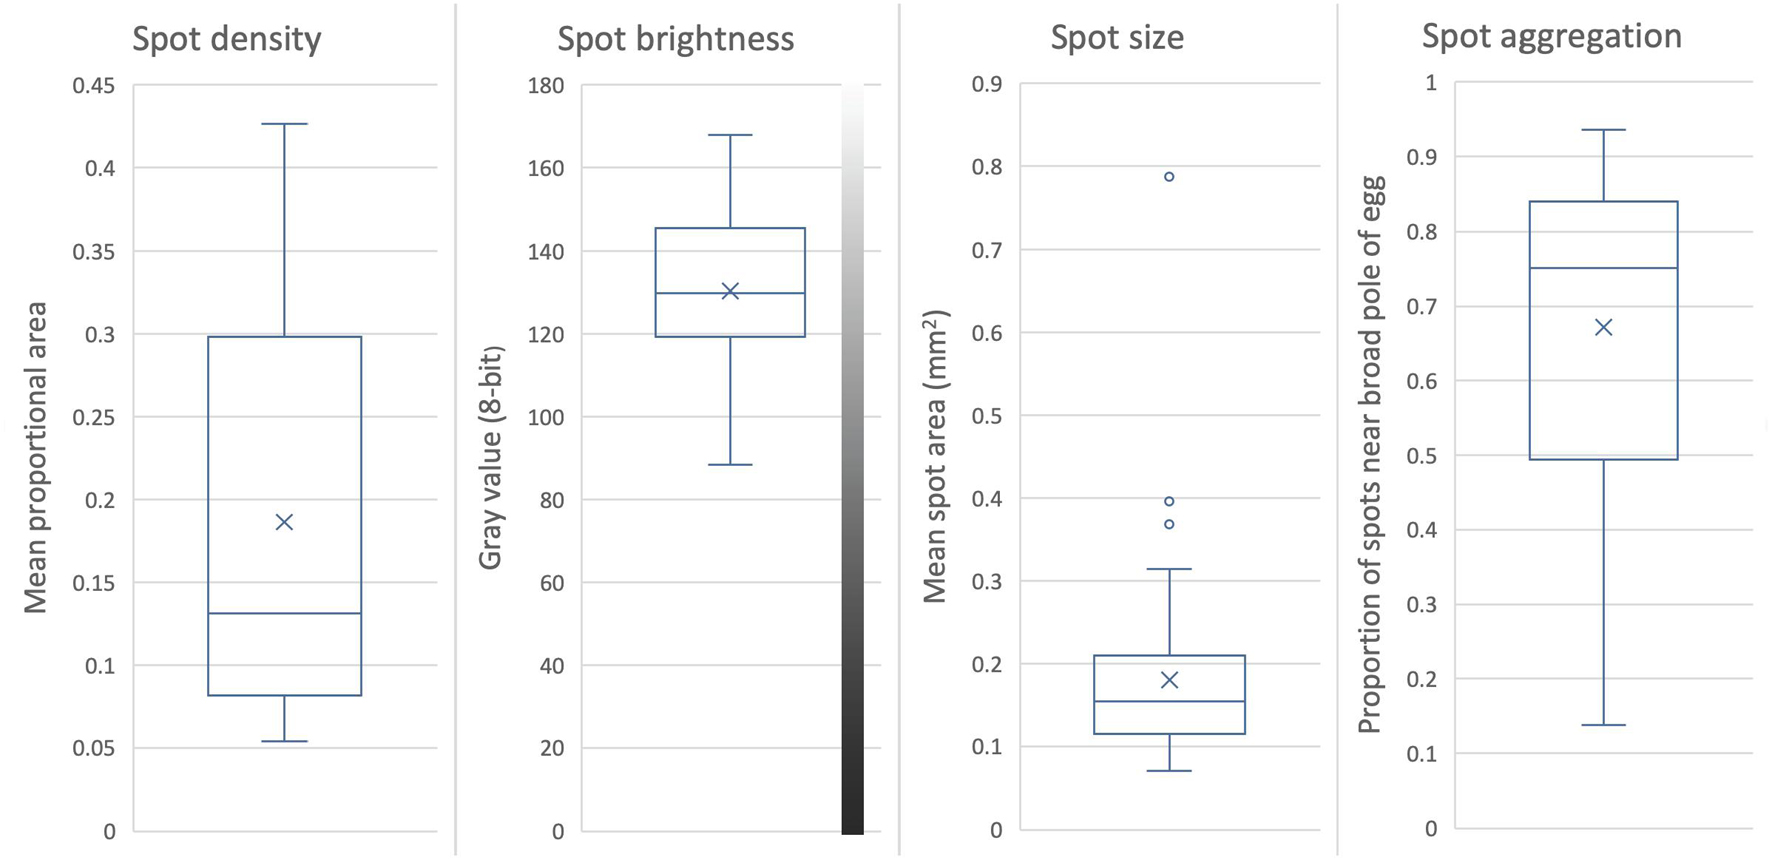
Figure 5. Variation in maculation of Rüppell’s weaver eggs (66 eggs in 29 clutches). Box and whiskers divide the data into quartiles, with the median value indicated by the midline, the mean by an X, and outliers by circles. Maculation on the eggs of this species consists of at least two layers of spots; values here are for all layers combined. Spot density is the mean proportional area of the eggshell covered with spots. Spot size is the mean area of an individual spot. Spot brightness is the mean gray value in 8-bit grayscale, range 0–255. Spot aggregation is the degree to which spots are clustered near the broad pole of the egg (range 0–1), as indicated by 1 – the ratio of the area of spots at the narrow end to the area of spots at the broad end.
To the eye, the brightness of spots had an extensive range of variation across eggs, from a light rust (e.g., Figure 1 bottom row fifth egg) to almost black (e.g., Figure 1 top row first egg). Although brightness in this study was averaged across primary and secondary spots, the mean for an egg still ranged widely, between 88 and 168 on a 256-level scale from black to white. Taking spot brightness variation within an egg into account, the range was much broader, especially in the darker direction (45–172). Nevertheless, brightness had the lowest standard deviation for its mean (CV = 18.5) of the spotting variables. Spot brightness lent only a moderate distinctiveness to eggs (D = 0.72–0.80) (Table 1; raw variation shown in Figure 5, second panel).
The size of spots averaged across an egg ranged widely, from 0.07 to 0.79 mm2 in area, with a standard deviation around its mean second only to spot density for spotting variables (CV = 0.55). Contrasting examples of typical variation in spot size in this species are portrayed in Figure 1, bottom panel, top row, first and fifth eggs. The sample distribution deviated from normality far more than any other egg appearance variable, being skewed right, with a very long tail (S = 11.4, K = 29) (i.e., a small number of individuals laid eggs with many large spots). This variable consequently had the highest relative range (range/mean) of any egg trait. Part of this deviation was a result of one egg that had many large spots whereas most eggs only had a few or none of that size. Without that egg, the kurtosis is alleviated but the skewness remains. Spot size contributed only weakly to distinctiveness relative to other variables (D = 0.32–0.49), with or without the outlier egg (Table 1; raw variation shown in Figure 5, third panel).
Most eggs had higher densities of spots near the broad pole of the egg compared to the narrow pole. The mean of this ratio was 0.67, but ranged from 0.14 to 0.94 with a skew to the right (S = 2.7), and a moderate standard deviation for the mean relative to other variables (CV = 0.31). The mean of the two estimates for distinctiveness conferred by spot aggregation was the second highest of any egg appearance variable after spot density (D = 0.81–0.96) (Table 1; raw variation shown in Figure 5, fourth panel).
Spot aggregation was negatively correlated with brightness (r = −0.65) and even more strongly with density (r = −0.82). These effects result from the nature of spot aggregation—aggregated spots tend to overlap and become darker; and eggs with highly aggregated spots tend to cluster them very close to the broad pole of the egg, leaving much of the egg with a much lower spot density (e.g., Figure 1, bottom row fourth egg). Spot density was also correlated with brightness (r = 0.67) and size (r = 0.58). Lighter spots were denser than darker spots, as eggs with larger spots had denser spots, at least partly due to the means of measuring spot density, which is the proportion of eggshell area covered with spots. Spot density, brightness, and size all correlated moderately with the three measures of reddish-brown ground color (spectral PC3, proportion of reflectance from 650 to 700, and long-wavelength cone photon catch) (r = 0.48–0.69). Spot aggregation near the broad pole of the egg was also moderately negatively correlated with reddish-brown ground color (r = −0.40 to −0.49).
No egg spotting variables deviated from unimodality.
Across all egg traits, population variation was not related to distinctiveness (Pearson correlation of D and CV: r = −0.04). Within-clutch variation could not be statistically compared across traits or females, because in many cases the variance of individual clutches was too small to be reliable for comparison, or was within the known standard error of measurement (2.58 for spectral reflectance).
Rüppell’s weavers practiced egg rejection within 28 h of experimental parasitism, by ejecting eggs from their nests. No act of egg rejection was directly observed, but broken eggs marked with the appropriate identification numbers were occasionally found beneath nests. As males were never observed entering nests during or after the laying period, the female is assumed to be the egg ejector. Puncture ejection was occasionally implicated by the presence of yolk in the nest after rejection and by peck marks on eggs. The experimental egg was rejected in 11 of 22 cases (50% rejection rate), this level being deliberately targeted during the experiment by the choice of experimental eggs. In four cases, the weaver’s own egg was rejected along with the foreign egg (36% rejection cost), although in two of these cases this resulted in an empty nest and so could also have been predation. In no case did the female reject her own egg but accept the experimental egg (0% recognition error).
Three single logistic regression models were significantly better than a constant-only model in predicting egg rejection. The variables in these models were ground color brightness, spot brightness, and the degree of aggregation of spots near the broad pole of the egg (Table 2 and Figure 6). The effect of ground color brightness was the same whether measured as PC1 of spectral differences, Qavg in Avicol, or brilliance in TetraColorSpace. Qavg was used for subsequent analyses. Egg rejection was not associated with clutch size, whether the female laid another egg after experimental parasitism, egg size or shape, or any chromatic difference. The best multiple logistic regression model included the same three variables as the univariate models (Table 2 and Figure 7); the equation of the curve is:
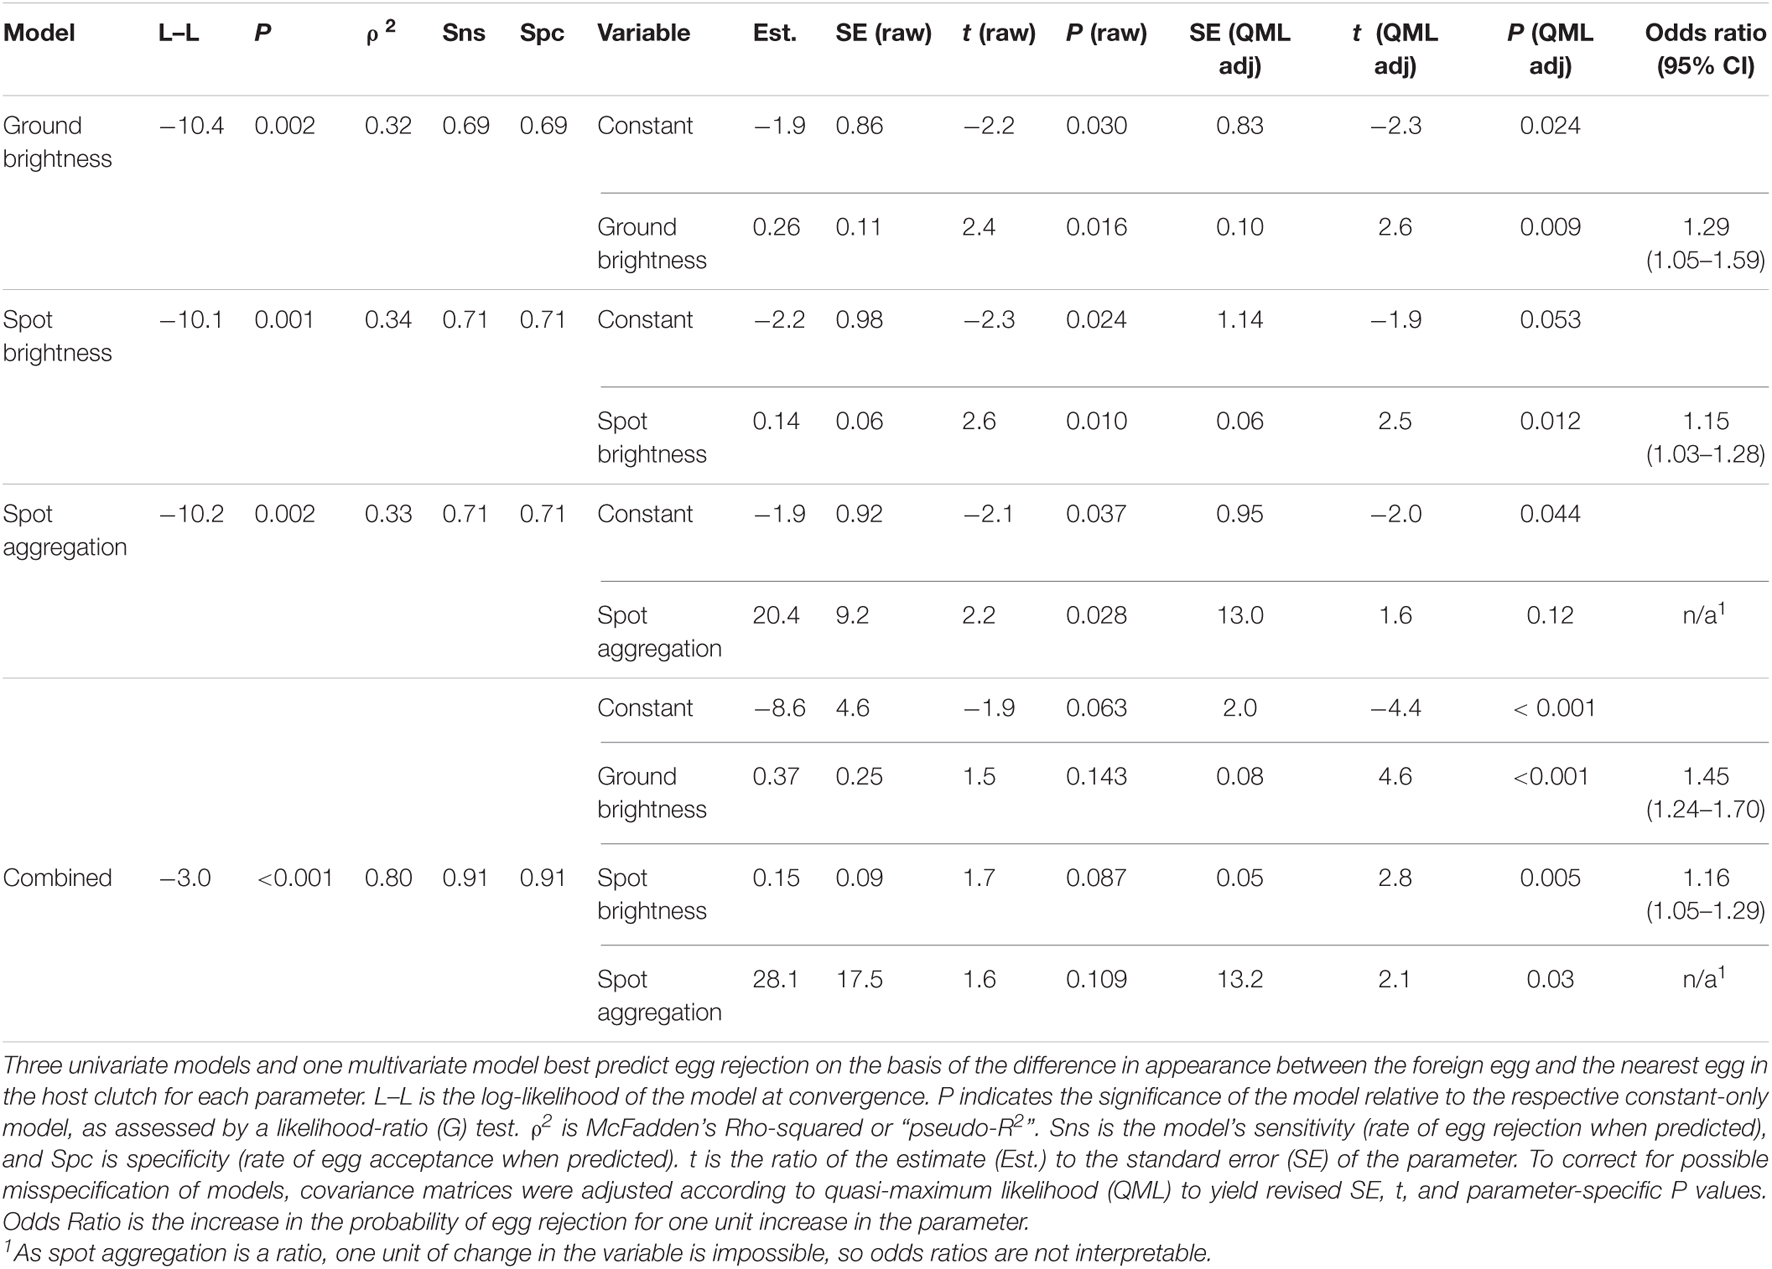
Table 2. Logistic regression models of the rejection of foreign eggs by Rüppell’s weaver.
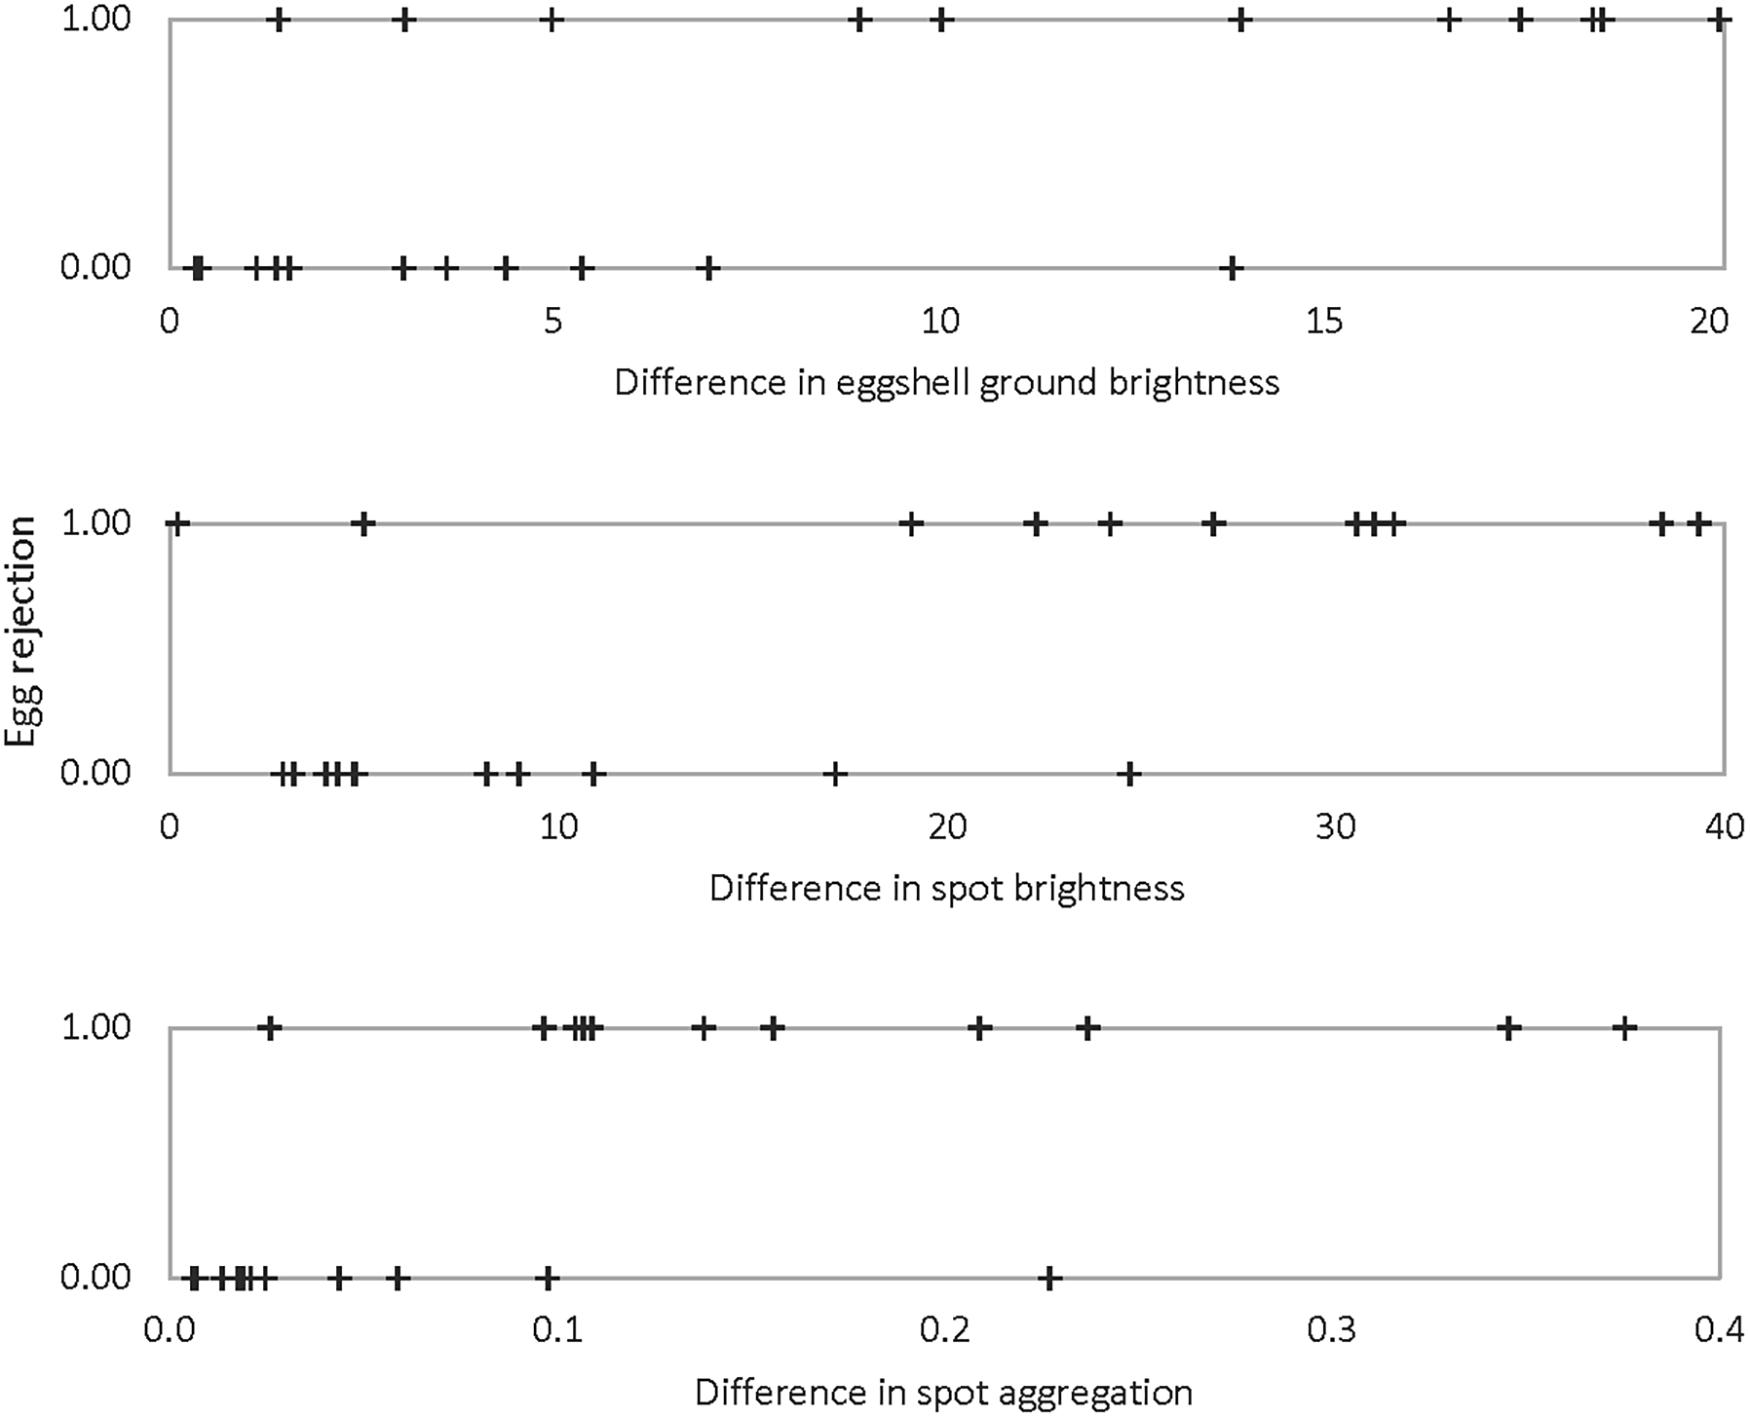
Figure 6. Egg rejection by Rüppell’s weaver in relation to the difference between own and foreign eggs in three variables: eggshell ground brightness (mean% reflectance across the UV-VIS spectrum), spot brightness (8-bit grayscale, 0–255), and degree of spot aggregation near the broad pole of the egg (0–1). Each of these three variables yielded significant single logistic regression models predicting egg rejection (ρ2 = 0.32–0.33, P = 0.001–0.002).
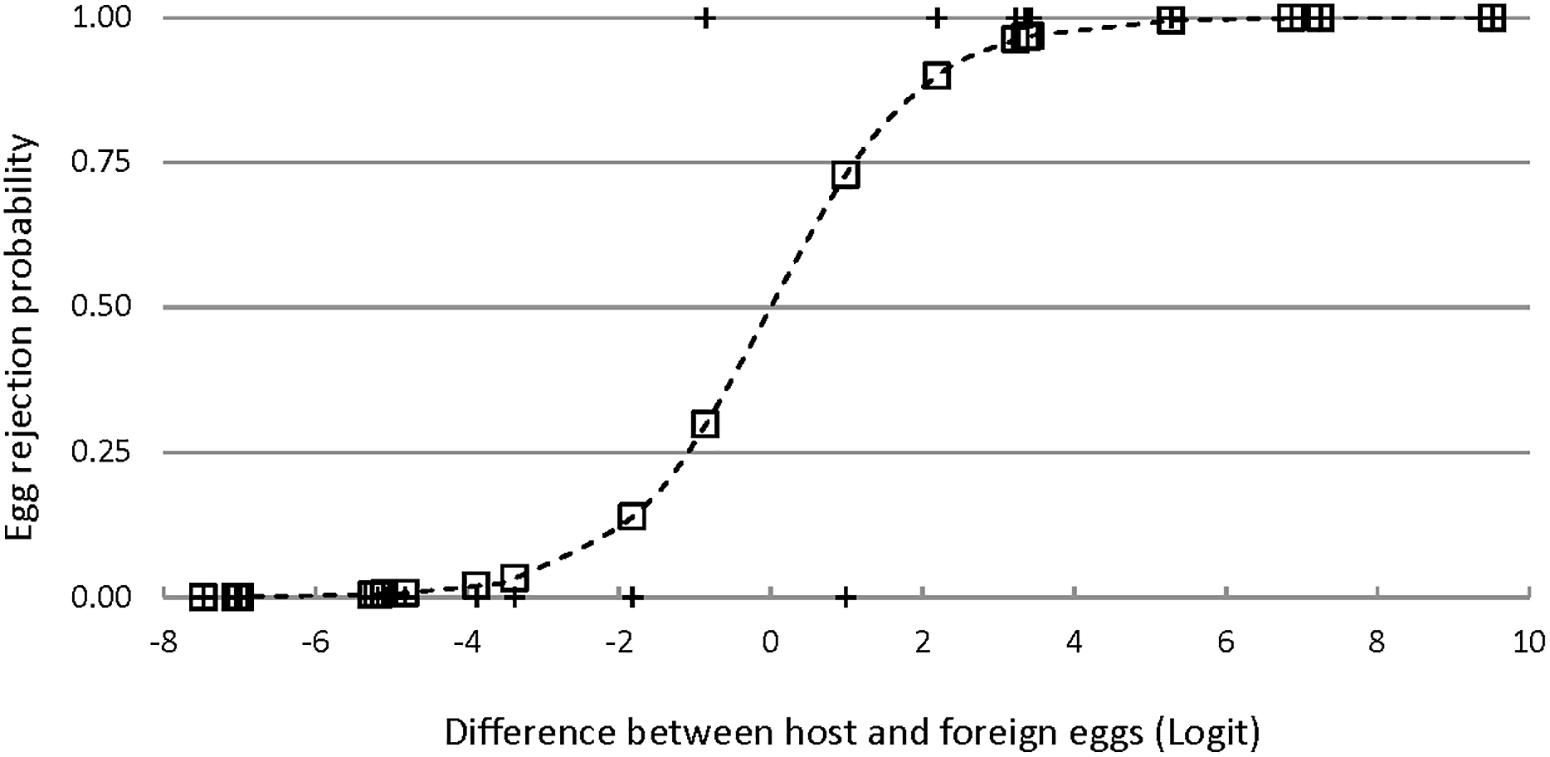
Figure 7. Egg rejection by Rüppell’s weaver in relation to the difference between own and foreign eggs in a multiple logistic regression model (ρ2 = 0.80, P < 0.001) including three variables: eggshell ground brightness (mean% reflectance across the UV-VIS spectrum), spot brightness (8-bit grayscale, 0–255), and degree of spot aggregation near the broad pole of the egg (0–1). The logit values (X axis) integrate all three of these variables; the pluses indicate the observed responses (acceptance = 0, rejection = 1); and the squares indicate the probability of egg rejection for each instance of experimental parasitism as predicted by the model.
where y is the probability of egg rejection; and QGC, QS, and AS represent the differences in ground color brightness, spot brightness, and spot aggregation, respectively. G tests of nested models demonstrated the increased explanatory power of all three variables together. For instance, comparing this model to one with the two spotting variables alone yielded a G statistic of 5.2 with 1 df, for which P = 0.02 in favor of the three-variable model; lower P-values result from comparisons with other restricted models. No interactions among variables approached significance. The three-variable model yielded a ρ2 of 0.80, a sensitivity of 0.91, and a specificity of 0.91. Odds ratios associated with this model indicated that for each difference of 1% in mean eggshell ground brightness across the spectrum between own and foreign eggs, the probability of rejection increased by 45% (95%CI: 24–70%); and for each unit of difference in spot brightness according to an 8-bit grayscale (256 levels), the probability of egg rejection increased by 16% (95%CI: 5–29%). The LD50 is the amount of difference that is predicted by the model to result in a 50% rejection rate. The LD50 is given by -c/x from a univariate logit model, where c is the constant and x is the estimate or coefficient. The single logit models yield an LD50 = 7.31 (in percent reflectance) for ground brightness, 15.7 (in 8-bit grayscale) for spot brightness, and 0.09 (a proportion) for spot aggregation. These models do not control for variation in other variables, however, and so other differences would account for some unknown proportion of egg rejection. Holding two of the variables constant at zero difference between host and foreign eggs in the three-variable multiple logit model yields an estimate of what difference in a single variable alone predicts 50% rejection: LD50 = 23.3 for ground brightness, 57.4 for spot brightness, and 0.31 for spot aggregation.
The eggs of the Rüppell’s weaver (Ploceus galbula) in the Awash Valley of Ethiopia vary from off-white to light blue-green, sometimes with a faint cast of reddish brown. In terms of spectral reflectance curves, all eggs have a small peak in the ultraviolet, whether or not they have a blue-green peak or a reddish-brown slope. Reddish-brown and blue-green coloration varies nearly independently, but blue-green chroma is negatively correlated with ultraviolet. All eggs have spots varying from light rust to dark brown, of various sizes, densities, and degrees of clustering near the broad end of the egg; two layers of such maculation are usually evident. Size and shape of the eggs vary within narrow limits, with dimensions and size decoupled. Variation in all measured traits except for one is unimodal, indicating continuous variation rather than polymorphism. The exception is blue-green chroma, which is bimodal. Variation in nearly all traits is far higher between individuals than within a clutch; but egg appearance features vary widely in their distinctiveness, in terms of the proportion of population variation that is between individuals as opposed to within a clutch. Rüppell’s weavers use some of these aspects of egg appearance to reject foreign eggs from their nests, which would function in defense against brood parasitism. Egg rejection appears to be accomplished by the female, by puncturing the egg and removing it from the nest. An individual is more likely to reject an egg the greater the difference in appearance between her own eggs and a foreign egg, specifically in three features: the brightness of the ground color, the brightness of the spots, and the extent to which the spots are aggregated at the broad end of the egg. Although all three of these features are used to reject eggs and contribute to a similar extent, the population variation is sufficient for differences in any one of these traits alone to result in the rejection of conspecific or egg-mimicking heterospecific eggs.
The clutch size reported here of 2.74 (mode 3, range 2–4) is consistent with estimates in the literature, which report three (Barnes, 1893; Archer and Godman, 1961; Gallagher and Woodcock, 1980) or two to four (Meinertzhagen, 1954; Mackworth-Praed and Grant, 1960). Al-Safadi (1996) is unusual in reporting a typical clutch size of two in Yemen, and a range from one to four.
The egg length (20.6 ± 1.1) and width (13.8 ± 0.4) reported here is likewise consistent with previous reports of 21.16 (range 19.3–23.6) × 13.96 (13.5–15.0) (Al-Safadi, 1996), and 20.0 (19.0–21.0) × 13.8 (13.5–14.5) (Archer and Godman, 1961). Al-Safadi’s (1996) report of a mean freshly laid egg mass of 21.3 g must be a typographical error, and is likely supposed to be 2.13, which is in keeping with the present report of 1.97 ± 0.24 g.
Qualitatively, the appearances of Rüppell’s weaver eggs found in this study are well described in general by Walters (2006) description of the eggs of this species as “blue or white, variably blotched or spotted brown”. However, even the whitish eggs were of low reflectance compared to white-egged weaver species (e.g., the lesser masked weaver, or white eggs of the village weaver), and most eggs were usually tinted either with blue-green or light brown. Secondly, even the darkest blue eggs were very faint compared to medium blue-green egged weaver species (e.g., the Cape weaver P. capensis, or the darker blue eggs of the village weaver). Thirdly, the colors of the spots varied tremendously to the eye, from a light rust to nearly black.
Signals of identity are predicted to be comprised of multiple highly variable traits with a limited degree of correlation with each other (Beecher, 1982; Dale et al., 2001). These features can be vital in the case of egg-mimicking brood parasitism where one organism is evolving to cause another to mistake identity, and when mistaken identity leads to the complete loss of a reproductive attempt. Low correlation among egg appearance traits have been found in the hosts of the cuckoo finch Anomalospiza imberbis and the common cuckoo Cuculus canorus, for instance (Spottiswoode and Stevens, 2010, 2011; Stoddard and Stevens, 2010). A comparative study has likewise shown that in two bird families, hosts of brood parasitism have unusually high entropy among different egg appearance traits (Caves et al., 2015). In the present study, the fact that a rotation of the principal components axes readily divided chromatic variation into three orthogonal components whose loading curves corresponded well to distinct colors (UV, blue-green, and reddish brown) indicates that these colors can vary independently of each other to a certain extent (Figure 2, bottom panel). The other methods of measuring color bore this out. Blue-green and reddish brown were weakly to moderately negatively correlated as predicted, whether measured as proportional reflectance in respective areas of the spectrum or in relative stimulation of visual cones. Although predicted here on the basis of separate pigments being responsible for the two colors, a weak to moderate negative correlation could also be a result of one color obscuring the other. This did occur: blue-green peak height above surrounding areas of the spectrum would decrease directly as a result of the reflectance slope characteristic of reddish-brown. Caution must be taken in interpreting pigment variation from color variation; although they sometimes clearly covary (Hauber et al., 2019), this is not always the case (Cassey et al., 2012).
Blue-green and ultraviolet coloration was strongly negatively correlated, as represented either by proportional reflectance or cone photon catches. This was somewhat surprising, as the same pigment (biliverdin) is responsible for both peaks (Lahti and Ardia, 2016). The relationship can also be seen in the particular shape of the color variation in tetrahedral color space. As shown in Figure 4, right panels, the eggs that are more UV are also further from the blue-green area between the short and medium wavelength vertices, whereas the eggs that are closer to that blue-green area are lower in UV. Since the long-wavelength light indicates reddish-brown, protoporphyrin might be modulating some of this negative correlation between blue-green and UV. A consideration of the spectra confirms that blue-green eggs have a rather low peak in the UV, which is overwhelmed by the broad blue-green peak in the central area of the bird-visible spectrum. More whitish eggs, on the other hand, have a peak in the UV which is small but proportionally significant without the interference of blue-green; in fact some eggs have no other chroma (no spectral slope or curvature) besides the UV peak.
Maculation variables were correlated moderately as expected given how they were measured, and also indicating three other points. First, lighter spots are denser; birds appear to be depositing similar amounts of pigment to each other, and so a higher area of coverage means less concentration in individual spots. Second, the fact that ground color and maculation variables are robust to variation in egg size and shape would increase the reliability of egg color and spotting for egg recognition across successive clutches and seasons. Third, correlations between spotting variables and reddish-brown ground color suggest an unintended influence of spots on ground color spectral measurements. Thus a slight reddish-brown tint to the ground color in this study cannot reliably be distinguished from the influence of nearby spots when maculation is highly dense (Akkaynak, 2014). The fact that spot aggregation and reddish-brown reflectance in the ground color are negatively correlated might best be explained by this artifactual effect; it means that when fewer spots are in the lateral area of the egg, the ground color is measured as less reddish-brown. Besides this effect, color and spotting variables were uncorrelated.
Eggs of variable appearance within a species are usually referred to as polymorphic, which generally implies discrete variation with rare intermediates (Hoffman and Blouin, 2000). In the study of egg appearance, however, this is rarely distinguished from continuous variation, which can be substantial even if there are no discrete morphs or types. In the study of trait variation more generally, much theoretical and empirical work has focused on this distinction, and also on the subtler distinction between departures from continuous variation and departures from unimodality (Sacchi et al., 2013; Davison et al., 2019). For identity signals in particular, a multimodal distribution over continuous space is generally predicted (Tibbetts and Dale, 2007). Takasu’s (2003) model of host egg variation under egg-mimicking brood parasitism begins with egg appearance varying continuously, but under a broad range of parameters ends consistently with discrete polymorphism. Spottiswoode and Stevens (2010) found continuous variation in the eggs of hosts of the cuckoo-finch. The two species of parrotbills or crow-tits (Paradoxornis spp.) appear to have eggs whose color is bimodal in distribution (Kim et al., 1995; Yang et al., 2010), although the variation at least in P. alphonsianus is continuous (Yang et al., 2010, Figure 1). These studies have related variation in egg appearance to brood parasitism. With respect to Ploceus weavers, Bates (1911) and Swynnerton (1916) both believed that egg appearance satisfied the condition for polymorphism, with discrete types and rare intermediates. Subsequent qualitative studies of egg color in the genus have tended to agree with or presume the existence of egg types as well (Bannerman, 1949), sometimes with indications that this might be a simplification (Victoria, 1972; Din, 1992). Collias (1984, 1993) treated egg color variation as continuous in brightness and chroma but discretely polymorphic in hue; but this may have been influenced by the fact that their particular color charts were organized in that way. Later more quantitative studies have treated all egg appearance traits as continuous in the northern masked weaver (Jackson, 1992a, 1998), village weaver (Lahti and Lahti, 2002; Lahti, 2005; 2006; 2008; Lahti and Ardia, 2016), and Rüppell’s weaver (Navarro and Lahti, 2014). Collias (1984) concluded unimodality and continuous variation in egg shape and size in the village weaver from an examination of histograms. Otherwise, none of these studies conduct specific tests or visualizations to examine distribution shape or pattern of variation. All egg appearance traits can be assessed on continuous scales of measurement, but this does not mean that the variation itself is necessarily unimodal or even continuous.
Tests in the present study show continuous and unimodal variation in nearly all egg appearance traits, with one exception: ground color on the axis of more or less blue-green. This can be seen by visual inspection of histograms (Figure 3), the result of Hartigan’s tests for departures from unimodality, and visual inspection of the scatterplot in tetrahedral color space (Figure 4, right panels). The variable that best indicates this is blue-green peak height, although it is also evident to a lesser extent in the photon catches of short and medium wavelength cones (which overlap in sensitivity at blue-green), and in the spherical coordinate θ. The tetrahedral plot indicates that this bimodality is not actually exclusively on the more or less blue-green axis, but is also evident on the more or less UV axis, as mentioned above regarding correlations. Thus the two classes of eggs are the more blue-green and less UV ones, versus the more UV and off-white ones. These cannot be called types, however, as there is substantial variation within a class. In fact, some eggs in one class are more similar in color to the eggs in the other class than they are to the most distant eggs in their own class. Whether this pattern of variation is discrete enough to be considered a dimorphism would thus depend on the precise definition chosen. Examples can be seen by comparing the top and bottom rows of eggs in Figure 1.
Other features of the distributions of egg appearance variation can be evident, and ecologically relevant, than just modality and the continuity of variation. A flatter than normal distribution, for instance, as indicated by negative kurtosis values, is a more even distribution. This minimizes the occupancy of any given place in the range, and thus can be predicted to be the ideal distribution for discriminability of recognition cues. The near-perfect distinctiveness of spot density in this study, for instance (see below), was made possible by the combination of a wide range of variation, and a significantly flatter distribution than normal (as determined by kurtosis). By contrast, spot brightness had a wide range as well, but a low CV, indicating a narrow normal distribution with two long tails; the histogram confirms this. This distribution shape, with most of the population clustering near the mean, renders this particular egg appearance variable less useful as a recognition cue. Narrow or highly skewed distributions that have most of their values clustered around a small area of the range provide an advantageous target for egg mimicry and thus can be predicted to be less adaptive than broader distributions.
The three methods used to bridge the gap between spectral reflectance data and quantitative variables for analysis were largely concordant in their results, although each provided insights that were not necessarily revealed by both of the others. The variation in their contributions can largely be predicted by the ways in which they manipulate the data and divide it into separate variables (no method can reduce color variation to a single or even two dimensions). The two main advantages of PCA of spectral data, at least for certain applications, are that they are objective (do not assume anything about visual systems or important regions of the spectrum), and that the resulting variables are statistically independent of each other. The main drawback is that all comparisons must be made within the same analysis, prohibiting quantitative comparisons between studies (Doucet et al., 2006). In addition, interpretation of the axes can be challenging, and brightness can sometimes swamp chromatic variation (Burns et al., 2018); however, as shown in the present study, alternate rotations can relieve both of these constraints to some extent. In particular, the unrotated PCA yields a prominent initial component representing brightness, and largely uninterpretable subsequent components; but a varimax rotation, which is designed to maximally associate each variable (reflectance at a given wavelength) with a single component, yielded variation that broadly aligned with typical descriptions of color. Multiple rotations can be used in the same study (although it is rarely done), with the understanding that statistical independence applies only to components within a rotation. The varimax rotation did not completely remove the swamping effect of brightness, however, but instead distributed it among all the components; this may be why PCA was worse than the other two methods at identifying distinctiveness of egg features, with the amount of variance explained actually inversely proportional to the distinctiveness of the component. Blue-green coloration was a major axis of variation in this study, for instance, but the varimax PC1 included so much brightness as well that it had among the poorest distinctiveness of any egg appearance variable, and missed some of the most distinctive aspects of this color, such as its bimodality. This study also highlights another drawback to PCA, which is that the standardization of the variables (to a mean of 0 and a variance of 1) precludes easy comparisons of population variation among components.
Spectral shape variables that target spectral peaks or wavelength regions of interest can be helpful for particular questions where interpretability is at a premium, and a priori the variation of importance is known to be related to particular sorts of curvature or wavelength-specific reflectance level. The major drawback of this method follows from this advantage, however, which is the subjectivity or analytical uncertainty involved in identifying these features. The most typical variables are absolute or relative (proportional) reflectance within a certain wavelength range. Absolute reflectance has the major drawback of conflating chroma with brightness. Proportional reflectance overcomes this drawback, but at a cost of another: values are affected by irrelevant reflectance differences in other parts of the spectrum. Both sorts of variables can sometimes have the drawback of being associated with more than one color. For instance, in the present study, if the typical 625–700 nm bin were considered to be the variable that pinpoints reddish-brown, this would have been contaminated by the broad blue-green peak; thus 650 was a more precise cutoff, but at the cost of narrowing the range of wavelengths considered. For another example, if 300–400 nm were chosen as the bin for UV in this study, as is commonly done because of researcher bias arising from human vision, the reflectance between 380 and 400 nm will already often have passed its minimum and be rising again, leading to an underestimate of the bird-relevant UV peak. In this study, despite the stated drawbacks to relative reflectance, the correlations of those three variables (proportional UV, blue-green, and red-brown) with other measures were very high. Overall, this study sometimes succeeded and sometimes failed in the attempt to represent colors by spectral shape in a way that could be validated by other methods and could reveal the distinctiveness of egg appearance features. Since eggs that were blue-green varied little in hue, a blue-green peak height with fixed min (400 and 650 nm) and max (500 nm) wavelengths was one of the most effective of all egg appearance variables, most strongly indicating bimodality and with the highest distinctiveness score. On the other hand, UV max-min incorporated absolute UV reflectance and so was confounded with brightness in that area of the spectrum, making it the least effective variable in terms of distinctiveness and uncorrelated with other measures of UV.
Avian visual modeling that transforms spectral data according to retinal cone sensitivity provided additional insights and was very successful at separating chromatic variation from brightness. Surprisingly (and only evident by this method), egg variation was largely in a plane in tetrahedral color space (Figure 4), but was so oriented that variation was precisely divided in terms of cone photon catches, such that short, medium, and long wavelength cones equally participated in perception of the egg color; and with the UV cone taking a 70% share. The negative correlation between blue-green and UV coloration was most evident by this method (r = −0.93). A drawback to this method, however, is that the variables are fixed, in a manner irrespective of the color variation of the objects (eggs); whereas the construction of the PCA and spectral shape variables are governed by the variation in the objects. This is intentional, of course, as it is the central point of avian visual modeling. Nevertheless, it can hamper interpretation in some cases. In the present study, blue-green variation was the most dramatic color feature by all methods; however, in tetrahedral color space this variation does not line up with any particular cone, but lies midway between the short and medium wavelength cones, which divvy up the variation between them. Estimates of distinctiveness, chromatic variation, and modality were compromised by this sharing of the effect between two cones. The use of the spherical coordinates could potentially solve this problem, but they were less directly interpretable in terms of coloration. An advantage to tetrahedral color space is the diversity and specificity of the ways of measuring the range of coloration in a sample. In the present sample, since colors lay nearly on a plane, estimates of volume were close to 0, which of course is the volume of a plane of any size. A single point lying off the plane would have dramatically increased the volume measurement. This situation illustrates that the minimum convex polygon method of estimating color range is very sensitive to the overall shape of the scatter; if it lies only in two dimensions, volume should probably not be used. Span in this case, which considers Euclidean distance regardless of dimension, would be more effective if this data were to be compared, for instance, with another population or species.
Despite the great usefulness of avian visual modeling in general, one cautionary note is the possibility of differences between the birds that were used to parametrize the model, and the study species. Nevertheless, within passerines this has not often become a major issue regarding cone-specific photon catches (Burns et al., 2018). In general, the more that is assumed about a bird’s perceptual and cognitive processing, the more the models should be parametrized by taxon-specific data. For instance, many studies of color discrimination in birds go one step further than cone-specific photon catches and estimate the ability of birds to detect color differences on the basis of photoreceptor noise (Vorobyev and Osorio, 1998). Thus a genus like Ploceus/Malimbus that has not been studied either for cone-specific photon catches or photoreceptor noise might compound error with each step deeper into the perceptual system. Moreover, referring to differences as “just noticeable” (JNDs) might imply a still deeper understanding of the perceptual processing than we have for any bird, which is not just a function of the photoreceptors but the brain (this contrasts with the typical uses of JNDs in psychology, which are rooted in subject responses as to what is noticeable). We still know too little about perceptual and cognitive processing and its variation between species to be too confident about the accuracy of what differences a bird can and does notice, despite the value of the photoreceptor noise models when they can be parametrized. In the meantime, some discrimination studies (like this one) might continue to use behavior alone (e.g., egg rejection) as a coarse indication of discriminability, although this strategy has its own drawbacks, such as the distinction between recognition and rejection (Ruiz-Raya and Soler, 2017).
One of the most productive predictions in the study of brood parasitism is the expectation that a bird exhibiting egg recognition in counteradaptation to egg mimicry should lay eggs that are distinctive (Davies and Brooke, 1989), hence the relevance of the concept of “signature information” (Beecher, 1982; Caves et al., 2015). Bates (1909) first noted the variation between the eggs of different female weavers combined with uniformity within a clutch, and later proposed that it functioned in egg recognition (Bates, 1911). Much like human anti-counterfeiting strategies with respect to currency for instance, forgeries are more easily identified if the genuine articles are consistent in appearance with one another, different from other such objects elsewhere, and have a degree of complexity. Complexity has been dealt with above regarding multiple uncorrelated traits. With respect to the other two points, since they involve measurements of clutches nested within population samples, a simple ratio of sums of squares can provide a single integrated metric of distinctiveness. Specifically proposed here, D = 1−WC/BI, where BI is the sum of squares for the “treatment” (between clutches), and WC is the residual sum of squares (within clutches). For a species with variable eggs, some integrated metric of this sort is to be preferred over isolated measurements of population or intraclutch variation, as it is the relationship between these two features and not either in isolation that indicates the distinctiveness of the eggs in the average clutch within a population. In the data presented here, D ranged widely across traits, indicating major differences in signature information. The worst traits for discrimination were the PC for blue-green, the two UV spectral shape variables, brightness as determined either by PC1 or by average reflectance across the spectrum, and spot size. All of these variables had estimates of D that were <0.5. The PC for blue-green loaded so broadly that it was nearly brightness itself, explaining why other more focused measures of blue-green yielded higher distinctiveness. Perfect distinctiveness is 1, as that would indicate a near-zero numerator (within-clutch variation), relative to the magnitude of the denominator (between-individual variation), in the term to be subtracted from 1. In the present study, spot density made eggs almost perfectly distinctive, with 0.96–0.98 of the variation being between clutches. The other highly distinctive variables (D ≥ 0.85) were the proportion of reddish-brown reflectance (which likewise represents spotting); blue-green peak height; the degree of spot aggregation at the broad pole of the egg; and egg shape, size, and mass. Although unreported above, the mean 8-bit grayscale value of primary spots in this sample was 75 ± 16 (range 45–107), and of secondary spots was 139 ± 13 (range 108–172), thus neatly partitioning the brightness space. Perhaps the distinctiveness that spot brightness actually confers to eggs is higher than suggested by my averaging these two layers of spots, if birds themselves can distinguish the differences in the two layers; this is not known for any bird.
With the appropriate data, D can be a useful measure, and comparable across traits measured at any scale, and across populations and studies. The sum of WC and BI, moreover, is the total sum of squares, which itself can be useful as a measure of total variation in a trait in the population. When comparing populations or species, however, one must be aware that smaller clutches will have less variation than larger clutches. More precisely, if eggs are laid in random order with respect to their appearance, there is a 0.67 probability that within-clutch variation will increase between 2 and 3 eggs, and 0.5 that it will increase again from 3 to 4 eggs, and so on with a proportion of 2/n where n is the clutch size with one additional egg. If final eggs are unusually different [as can be the case (Brant et al., 1950)], the bias is even greater. In many cases this is not a problem, because the true within-clutch variation is desired regardless of clutch size. However, if one needs to control for clutch size, for instance in comparing variation within a species across latitudes where clutch size varies, the solution is to subsample eggs randomly from the larger clutches when deriving D. This strategy can also be used if one has a small sample of known complete clutches, as in the present study. Here, the complete clutches were used for one estimate of D, and then the disparity between just two eggs from each clutch regardless of completion were used for another estimate of D (Table 1). The estimates were usually close together, as the true clutch size was not much over two. As the true clutch size increases, the inaccuracy of the subsampling strategy increases.
Among the limitations of D is that it does not indicate the magnitude of the differences. For instance, a value of 1 will be given for a trait that does not vary within a clutch no matter what the variation between clutches. Also, seemingly reasonable values can be calculated from variation that is not even perceptible by birds. These are standard limitations of any proportional variable, but are important to recognize in studies like this, for several reasons. For instance, every trait has some variation; and for egg appearance traits even in the absence of selection or function our null expectation is already that BI > WC just from random genetic variation. Two further limitations relate not to D per se but to the practice of measuring variation more generally. One is that birds’ eggs often vary very little within a clutch, and this is specifically predicted for hosts of egg-mimicking brood parasites. Within-clutch variation might therefore sometimes approach the error inherent in the equipment or the researcher. The standard error of measurement for the spectrophotometry in this study was 2.58, and remained relatively constant across wavelengths. Some clutches had a within-clutch variation in spectral reflectance at or under that value, and in many cases the difference between two eggs in a clutch in certain areas of the spectrum was less than that. For that reason, I could not run more focused analyses on differences in within-clutch variation. A second limitation of the present methods, as is typical of studies calculating within-clutch variation, is that we do not know how much variation an individual would exhibit from clutch to clutch, or from year to year. This is a “black box” of variation between the within-clutch and between-individual levels, which has important implications for interpreting distinctiveness for egg rejection (discussed below). One final, and again typical, limitation is that this study, and D in particular, presume that any parasitic egg will be within this study’s sample range for each trait. This would indeed be expected if we were talking solely about intraspecific brood parasitism. It would also be expected if all diederik cuckoos that parasitize this particular weaver species lay eggs that are within the range of this host for all egg appearance variables. The accuracy of such an assumption depends on the particular extent and sort of coevolutionary relationship between the diederik and its hosts (Friedmann, 1968), which we still do not know. To the extent that any parasitic eggs laid in Rüppell’s nests fall outside their range for any variable, D will underestimate the ability of weavers to discriminate against them.
Rüppell’s weavers rejected foreign eggs in their nest according to the difference between the foreign egg and their own eggs in the achromatic brightness of both ground color and maculation, and the degree to which spots were aggregated near the broad pole of the egg. More specifically, for each egg appearance variable the disparity was calculated between the foreign egg and every egg in the host’s clutch, whether it was present at the time of the experiment or not. The minimum disparity was considered to be the difference between host and foreign eggs, so as not to confound this difference with intraclutch variation. The use of color and spotting but not size and shape is consistent with studies of egg rejection in several other species (Baker, 1913; Honza and Cherry, 2017), including two other Ploceus weavers (Jackson, 1998; Lahti and Lahti, 2002).
On the basis of distinctiveness alone, as described above, the prediction is that individuals should reject eggs based on spot density, reddish-brown reflectance (which amounts mainly to the same thing), blue-green peak height, spot aggregation, and egg shape and size. The prediction was therefore only met with respect to spot aggregation.
Distinctiveness of egg appearance traits was not related to their population variation. Since distinctiveness does not indicate the magnitude of variation but only the relative amounts within-clutch vs between-individual, an alternative hypothesis is that hosts might require signature traits to have high variation period, and that in the Rüppell’s weaver even some of the more distinctive traits do not vary enough to be useful. The least variable traits measured, at CV < 0.1, were the four cone-specific photon catches, the proportional reflectances of blue-green and reddish-brown, and egg size and shape. The most variable traits, at CV > 0.6, were, in descending order, the spherical coordinate θ, blue-green peak height, and spot density. Thus, although there was no correlation overall, blue-green peak height and spot density were both among the most distinctive and the most variable egg appearance traits in the population; but neither they nor θ were used in rejecting eggs.
Since the eggs were whitish to pale blue-green, and the spots contrasted strikingly with this ground color in all individuals, differences in the aggregation of spots did indeed make for a ready basis for distinguishing clutches—the ratio of eggs at the broad pole to the middle ranged from 0.14 to 0.94, with a skewed distribution such that the mean was 0.67. Thus, in addition to being highly distinctive, spot aggregation was a qualitatively salient feature. The importance of this trait for egg recognition has been found in village weavers as well (Lahti and Lahti, 2002), and several other species (Polačiková and Grim, 2010; Polačiková et al., 2011).
Why, however, did birds use the brightness of ground color and spotting, instead of the more variable and distinctive chromatic variation, for egg recognition? This wording might beg the question, however, as just because a trait is more variable in terms of variation around the mean does not mean the bird sees it as more variable. Perhaps weavers rely more, in their dim enclosed nests, on achromatic contrasts via their double cones, than on the subtle differences in single cone photon catches. Although spectral shape features varied highly, the variation of all four single cone photon catches was very small (CV < 0.1 in all cases). Thus, although ground color brightness was only weak to moderate in its distinctiveness (D = 0.36–0.52), and only moderate in its standard deviation around the mean (CV = 0.19), it may have been a qualitatively salient feature in its achromaticity. Moreover, the range of ground color brightness variation was very high whether for bird or human eyes, ranging from 32 to 77% average reflectance over all wavelengths. Brightness of spots was more distinctive (D = 0.72–0.80), but had the lowest standard deviation for its mean among spotting variables (CV = 0.19). However, again, its achromatic contrast with egg ground color might have been salient, and the range of spot colors in the population on the 256-level grayscale was enormous (45–172 when both primary and secondary spots are considered, and still 88–168 if only the mean brightness across all spots on an egg is considered). These results highlight the importance not only of objective measures of variation and distinctiveness, but of salience to birds, a feature that is arguably much more difficult to assess and quantify.
Avian visual modeling might have been predicted to yield the variables that were most important in egg recognition, since the entire purpose is to approximate what the bird is seeing rather than relying on objective orthogonal variation or spectral curvature. However, birds did not use chromatic variation to reject eggs, and since nearly all of the visual modeling was in service to color rather than brightness or patterning, its failure to explain the basis for egg recognition is not surprising. The values for brightness in TetraColorSpace are equivalent to the direct measurement of average reflectance across the spectrum. One benefit of TetraColorSpace, however, as mentioned above, was the demonstration that the chromatic variation in photon catches was actually much lower than the objective variation of the spectral reflectance proportions or peak heights. In the low light of an enclosed nest (light environment was not considered in this study), the realized chromatic variation would be even lower.
Why do Rüppell’s weavers have highly variable and distinctive egg features that they do not use to reject eggs? In particular, blue-green peak height and spot density were highly variable and extremely distinctive, but were not used to reject eggs. Assuming these features evolved for a function rather than by neutral evolutionary processes, there are at least four possible explanations. (1) The features they used in this study are only those they found salient for conspecific eggs; possibly the way cuckoo eggs differ from theirs might elicit some use of other egg appearance features. Rejection costs (rate of rejection of a host egg along with a foreign egg) might interact with this factor as well, limiting the kind or extent of variation used to reject eggs. The rejection cost observed here of 36% is comparable to the 41% observed with a higher sample size in the village weaver in The Gambia, but higher than the 12% found in South African spotted-backed weavers (thought to be the same species as the village weaver) (Lahti, 2006). A high rejection cost might mean that similar eggs, or eggs that are similar in certain features, are more likely to be accepted; but eggs of a greater difference from host eggs, and thus more likely to be parasitic, might be rejected on the basis of features different from those in the current study. (2) Rejection level might have been lower at the time and place they were tested here than they sometimes are. Environmental variables indicating probability of parasitism can influence egg rejection (Davies et al., 1996; Brooke et al., 1998). (3) Perhaps the weavers are using higher-level (feature-detection) pattern features to recognize eggs rather than the basic maculation variables tested here, but those pattern features are nevertheless dependent on the variation and distinctiveness of the lower-level features. In the tawny-flanked prinia, for example, although basic spotting variables explained rejection, the addition of a feature-detection algorithm for maculation pattern increased the explanatory power of the model (Stoddard et al., 2019). Finally, (4) certain features that are variable and distinctive in one clutch might not be in another clutch of the same female; egg shape and size, for instance, were highly distinctive in this sample, but were not used in egg recognition; in fact they rarely are so used (Honza and Cherry, 2017). The reason for this might be that they are variable between breeding attempts, depending for instance on resource availability, and thus are unreliable as signatures.
Finally, why do Rüppell’s weavers reject eggs at all? The discussion here has focused mainly on the diederik cuckoo, and indeed they were singing and visible in the vicinity of the weaver nests throughout the course of this study, although no instance of brood parasitism was detected (unsurprisingly, given my restricted methods). Circumstantial evidence must currently suffice more generally. The diederik cuckoo apparently so depends on Rüppell’s weaver in Arabia that sightings of the former are always within the limited and disjunct distribution of the latter (Jennings, 2010). In Yemen and Oman, the Rüppell’s weaver is the only species that is a known host for the diederik cuckoo, and yet the cuckoo is a frequent breeding visitor in both countries (Eriksen and Porter, 2017). Some have proposed the alternative hypothesis, that intraspecific brood parasitism is the reason why the northern masked weaver (Ploceus taeniopterus) rejects eggs (Freeman, 1988; Jackson, 1992b); this hypothesis could apply to the Rüppell’s weaver as well, in the absence of evidence. The agent of selection cannot be determined by the mere existence of egg rejection, as selection from intraspecific brood parasitism can lead to rejection of heterospecific eggs (Lyon et al., 2015), and vice versa (Lahti, 2006). The evidence that intraspecific brood parasitism alone can promote the evolution of egg rejection is fairly uncontroversial (Lyon and Eadie, 2004). However, I am not aware of any species where intraspecific brood parasitism has led to the evolution of egg appearance variation, and there is reason to doubt that it would. Any given female in this case could be either a host or a parasite; to the extent she is a host, she benefits from having eggs that differ from those of conspecifics, but to the extent she is a parasite, she benefits from having eggs that match those of conspecifics. Whether these roles are typically played by different individuals or the same individual, they are in the same gene pool, which hobbles any evolutionary prediction.
Profitable next steps for research in this brood parasite – host system would be (1) to conduct tests that further investigate the features of eggs that are salient to the hosts in order to test the possibilities above as to why they had features they did not use; (2) to investigate individual differences in egg traits that are not seen within a single clutch, including environmental and developmental variation; (3) take a macroevolutionary perspective, looking into why some weavers have more advanced antiparasite defenses than others on the same trajectory, and why some even seem to have different trajectories. For instance, the lesser masked weaver nested alongside Rüppell’s weaver in the study site, is known to be parasitized by the same cuckoo, but has nearly opaque nests, white invariable eggs, and a long narrow entrance tube (pers. obs.). Finally, and perhaps most important in terms of understanding brood parasitism, would be (4) to find out what the diederik cuckoos are doing.
The raw data supporting the conclusions of this article will be made available by the authors, without undue reservation.
The animal study was reviewed and approved by IACUC Queens College CUNY.
The author confirms being the sole contributor of this work and has approved it for publication.
This work was funded with the startup package provided by Queens College, City University of New York.
The author declares that the research was conducted in the absence of any commercial or financial relationships that could be construed as a potential conflict of interest.
All claims expressed in this article are solely those of the authors and do not necessarily represent those of their affiliated organizations, or those of the publisher, the editors and the reviewers. Any product that may be evaluated in this article, or claim that may be made by its manufacturer, is not guaranteed or endorsed by the publisher.
This study is dedicated to Robert B. Payne, Emeritus Professor of Ecology and Evolutionary Biology and Curator of Birds at the University of Michigan Museum of Zoology. Special thanks to Bob, as well as Mark Hauber, Claire Spottiswoode, Cassie Stoddard, and the Lahti lab, for helpful discussions. April Lahti aided with the field work, performed the measurements of egg size and shape, and did the photography. Bobbie Niehaus made fieldwork possible by tending the little Lahtis. We are grateful to Les and Alison Groce, the Awash Falls Lodge staff, and Yirmed Demeke for hospitality; and Girum Tewelde for local guidance and natural history lore. The Ethiopian Wildlife Conservation Authority provided permission for the research. Frances Geller performed the measurements of maculation. Gabor Doka provided the interactive Excel scatterplot workbook template and VBA macros.
Akkaynak, D. (2014). Use of spectroscopy for assessment of color discrimination in animal vision. J. Opt. Soc. Am. A 31, A27–A33. doi: 10.1364/JOSAA.31.000A27
Al-Safadi, M. M. (1996). Observations on breeding Rüppell’s weaver Ploceus galbula in the Republic of Yemen. Sandgrouse 18, 14–18.
Alshamlih, M., Alzayer, M., and Hajwal, F. (2020). Ruppell’s weaver, Ploceus galbula Ruppell, 1880 invasion of the Eastern Arabian Peninsula: potential economic and social impacts. Bioinvasions Rec. 9, 158–164. doi: 10.3391/bir.2020.9.1.20
Archer, G., and Godman, E. M. (1961). The Birds of British Somaliland and the Gulf of Aden. Edinburgh: Oliver & Boyd.
Ash, J., and Atkins, J. (2009). Birds of Ethiopia and Eritrea: An Atlas of Distribution. London: Christopher Helm.
Baerends, G. P., and Drent, R. H. (1982). The herring gull and its egg. Behaviour 82, 1–411. doi: 10.1163/156853982X00599
Baker, E. C. S. (1913). The evolution of adaptation in parasitic cuckoos’ eggs. Ibis 1, 384–398. doi: 10.1111/j.1474-919X.1913.tb06559.x
Barnes, H. E. (1893). On the birds of Aden. Ibis Ser. 6, 57–84. doi: 10.1111/j.1474-919X.1893.tb01200.x
Bates, G. L. (1909). Field-notes on the birds of southern Kamerun, West Africa. Ibis 3, 1–74. doi: 10.1111/j.1474-919X.1909.tb05252.x
Bates, G. L. (1911). Further notes on the birds of southern Cameroon. Ibis 53, 479–545. doi: 10.1111/j.1474-919X.1911.tb03319.x
Beecher, M. D. (1982). Signature systems and kin recognition. Am. Zool. 22, 477–490. doi: 10.1093/icb/22.3.477
Blanco, G., and Bertellotti, M. (2002). Differential predation by mammals and birds: implications for egg-colour polymorphism in a nomadic breeding seabird. Biol. J. Linn. Soc. 75, 137–146. doi: 10.1111/j.1095-8312.2002.tb01418.x
Brant, A. W., Mcnally, E. H., and Norris, K. J. (1950). Eggshell color and its relation to clutch position in Rhode Island Reds. Poult. Sci. 29:749.
Brooke, M. L., Davies, N. B., and Noble, D. G. (1998). Rapid decline of host defences in response to reduced cuckoo parasitism: behavioural flexibility of reed warblers in a changing world. Proc. R. Soc. Lond. Ser. B 265, 1277–1282. doi: 10.1098/rspb.1998.0430
Brooker, L. C., and Brooker, M. G. (1990). Why are cuckoos host specific? Oikos 57, 301–309. doi: 10.2307/3565958
Brown, C. R., and Sherman, L. C. (1989). Variation in the appearance of swallow eggs and the detection of intraspecific brood parasitism. Condor 91, 620–627. doi: 10.2307/1368112
Burns, K. J., Mcgraw, K. J., Shultz, A. J., Stoddard, M. C., and Thomas, D. B. (2018). “Advanced methods for studying pigments and coloration using avian specimens,” in The Extended Specimen: Emerging Frontiers in Collections-based Ornithological Research, ed. M. S. Webster (Boca Raton, FL: CRC Press), 23–56.
Cassey, P., Mikšík, I., Portugal, S. J., Maurer, G., Ewen, J. G., Zarate, E., et al. (2012). Avian eggshell pigments are not consistently correlated with colour measurements or egg constituents in two Turdus thrushes. J. Avian Biol. 43, 503–512. doi: 10.1111/j.1600-048X.2012.05576.x
Caves, E. M., Stevens, M., Iversen, E. S., and Spottiswoode, C. N. (2015). Hosts of avian brood parasites have evolved egg signatures with elevated information content. Proc. R. Soc. B Biol. Sci. 282:20150598. doi: 10.1098/rspb.2015.0598
Collias, E. C. (1984). “Egg measurements and coloration throughout life in the village weaverbird, Ploceus cucullatus,” in Proceedings of the Fifth Pan-African Ornithological Congress (1980), ed. J. Ledger (Johannesburg: South African Ornithological Society), 461–475.
Collias, E. C. (1993). Inheritance of egg-color polymorphism in the village weaver (Ploceus cucullatus). Auk 110, 683–692. doi: 10.2307/4088624
Dale, J., Lank, D. B., and Reeve, H. K. (2001). Signaling individual identity versus quality: a model and case studies with ruffs, queleas, and house finches. Am. Nat. 158, 75–86. doi: 10.1086/320861
Davies, N. B. (2011). Cuckoo adaptations: trickery and tuning. J. Zool. 284, 1–14. doi: 10.1111/j.1469-7998.2011.00810.x
Davies, N. B., and Brooke, M. L. (1988). Cuckoos versus reed warblers: adaptations and counteradaptations. Anim. Behav. 36, 262–284. doi: 10.1016/S0003-3472(88)80269-0
Davies, N. B., and Brooke, M. L. (1989). An experimental study of co-evolution between the cuckoo, Cuculus canorus, and its hosts. II. Host egg markings, chick discrimination and general discussion. J. Anim. Ecol. 58, 225–236. doi: 10.2307/4996
Davies, N. B., Brooke, M. L., and Kacelnik, A. (1996). Recognition errors and probability of parasitism determine whether reed warblers should accept or reject mimetic cuckoo eggs. Proc. R. Soc. Lond. B 263, 925–931. doi: 10.1098/rspb.1996.0137
Davison, A., Jackson, H. J., Murphy, E. W., and Reader, T. (2019). Discrete or indiscrete? Redefining the colour polymorphism of the land snail Cepaea nemoralis. Heredity 123, 162–175. doi: 10.1038/s41437-019-0189-z
De Silva, T. N., Peterson, A. T., and Perktas, U. (2019). An extensive molecular phylogeny of weaverbirds (Aves: Ploceidae) unveils broad nonmonophyly of traditional genera and new relationships. Auk 136:ukz041. doi: 10.1093/auk/ukz041
Din, N. A. (1992). Hatching synchronization and polymorphism in the eggs of Ploceus cucullatus and P. nigerrimus with data on nest parasitism. Afr. J. Ecol. 30, 252–260. doi: 10.1111/j.1365-2028.1992.tb00500.x
Doucet, S. M., Shawkey, M. D., Hill, G. E., and Montgomerie, R. (2006). Iridescent plumage in satin bowerbirds: structure, mechanisms and nanostructural predictors of individual variation in colour. J. Exp. Biol. 209, 380–390. doi: 10.1242/jeb.01988
Endler, J. A., and Mielke, P. W. (2005). Comparing entire colour patterns as birds see them. Biol. J. Linn. Soc. 86, 405–431. doi: 10.1111/j.1095-8312.2005.00540.x
Erritzøe, J., Mann, C. F., Brammer, F. P., and Fuller, R. A. (2012). Cuckoos of the World. London: Christopher Helm.
Feeney, W. E., Welbergen, J. A., and Langmore, N. E. (2012). The frontline of avian brood parasite-host coevolution. Anim. Behav. 84, 3–12. doi: 10.1016/j.anbehav.2012.04.011
Freeman, S. (1988). Egg variability and conspecific nest parasitism in the Ploceus weaverbirds. Ostrich 59, 49–53. doi: 10.1080/00306525.1988.9633694
Friedmann, H. (1928). The origin of host specificity in the parasitic habit in the Cuculidae. Auk 45, 33–38. doi: 10.2307/4075354
Friedmann, H. (1968). The evolutionary history of the avian genus Chrysococcyx. U. S. Museum of Natural History Bulletin 265, 1–137. doi: 10.5479/si.03629236.265
Goldsmith, T. H. (1990). Optimization, constraint, and history in the evolution of eyes. Q. Rev. Biol. 65, 281–322. doi: 10.1086/416840
Gomez, D. (2006). ”AVICOL, A Program to Analyse Spectrometric Data”. v6 ed.: Free executable. Available online at: http://sites.google.com/site/avicolprogram/ (accessed September 28, 2021).
Hartigan, J. A., and Hartigan, P. M. (1985). The dip test of unimodality. Ann. Stat. 13, 70–84. doi: 10.1214/aos/1176346577
Hauber, M. E., Bond, A. L., Kouwenberg, A.-L., Robertson, G. J., Hansen, E. S., Holford, M., et al. (2019). The chemical basis of a signal of individual identity: shell pigment concentrations track the unique appearance of Common Murre eggs. J. R. Soc. Interface 16:20190115. doi: 10.1098/rsif.2019.0115
Hoffman, E. A., and Blouin, M. S. (2000). A review of colour and pattern polymorphisms in anurans. Biol. J. Linn. Soc. 70, 633–665. doi: 10.1111/j.1095-8312.2000.tb00221.x
Honza, M., and Cherry, M. I. (2017). “Egg characteristics affecting egg rejection,” in Avian Brood Parasitism: Behavior, Ecology, Evolution and Coevolution, ed. M. Soler (Cham: Springer), 401–420. doi: 10.1007/978-3-319-73138-4_22
Honza, M., Prochazka, P., Stokke, B. G., Moksnes, A., Røskaft, E., Capek, M., et al. (2004). Are blackcaps current winners in the evolutionary struggle against the common cuckoo? J. Ethol. 22, 175–180. doi: 10.1007/s10164-004-0119-1
Hosmer, D. W. Jr., and Lemeshow, S. (1989). Applied Logistic Regression. New York, NY: John Wiley and Sons.
Hoyt, D. F. (1979). Practical methods of estimating volume and fresh weight of bird eggs. Auk 96, 73–77.
Jackson, W. M. (1992a). Estimating conspecific nest parasitism in the northern masked weaver based on within-female variability in egg appearance. Auk 109, 435–443.
Jackson, W. M. (1992b). Relative importance of parasitism by Chrysococcyx cuckoos versus conspecific nest parasitism in the northern masked weaver Ploceus taeniopterus. Ornis Scand. 23, 203–206. doi: 10.2307/3676452
Jackson, W. M. (1998). “Egg discrimination and egg-color variability in the northern masked weaver: the importance of conspecific versus interspecific parasitism,” in Parasitic Birds and Their Hosts: Studies in Coevolution, eds S. I. Rothstein and S. K. Robinson (New York, NY: Oxford University Press), 407–418.
Jennings, M. C. (2010). Fauna of Arabia, Vol. 25: Atlas of the Breeding Birds of Arabia. Riyadh: Saudi Wildlife Commission.
Jensen, R. A. C., and Vernon, C. J. (1970). On the biology of the didric cuckoo in Southern Africa. Ostrich 41, 237–246. doi: 10.1080/00306525.1970.9634377
Kim, C.-H., Yamagishi, S., and Won, P.-O. (1995). Egg-color dimorphism and breeding success in the crow tit (Paradoxornis webbiana). Auk 112, 831–839. doi: 10.2307/4089015
Lahti, D. C. (2005). Evolution of bird eggs in the absence of cuckoo parasitism. Proc. Natl. Acad. Sci. U.S.A. 102, 18057–18062. doi: 10.1073/pnas.0508930102
Lahti, D. C. (2006). Persistence of egg recognition in the absence of cuckoo brood parasitism: pattern and mechanism. Evolution 60, 157–168. doi: 10.1111/j.0014-3820.2006.tb01090.x
Lahti, D. C. (2008). Population differentiation and rapid evolution of egg color in accordance with solar radiation. Auk 125, 796–802. doi: 10.1525/auk.2008.07033
Lahti, D. C. (2013). The sociality of nesting in Rüppell’s weaver Ploceus galbula and the lesser masked weaver Ploceus intermedius in an Ethiopian acacia woodland. Ostrich 84, 235–238. doi: 10.2989/00306525.2013.867548
Lahti, D. C., and Ardia, D. R. (2016). Shedding light on bird egg color: pigment as parasol and the dark car effect. Am. Nat. 187, 547–563. doi: 10.1086/685780
Lahti, D. C., and Lahti, A. R. (2002). How precise is egg discrimination in weaverbirds? Anim. Behav. 63, 1135–1142. doi: 10.1006/anbe.2002.3009
Landstrom, M. T., Heinsohn, R., and Langmore, N. E. (2010). Clutch variation and egg rejection in three hosts of the pallid cuckoo, Cuculus pallidus. Behaviour 147, 19–36. doi: 10.1163/000579509X12483520922043
Long, J. S. (1997). Regression Models for Categorical and Limited Dependent Variables. Thousand Oaks, CA: Sage Publications.
Lyon, B. E., and Eadie, J. M. (2004). An obligate brood parasite trapped in the intraspecific arms race of its hosts. Nature 432, 390–393. doi: 10.1038/nature03036
Lyon, B. E., Shizuka, D., and Eadie, J. M. (2015). Interspecific egg rejection as ecological collateral damage from selection driven by conspecific brood parasitism. Anim. Behav. 103, 117–124. doi: 10.1016/j.anbehav.2015.02.010
Mackworth-Praed, C. W., and Grant, C. H. B. (1960). The Birds of Eastern and North-Eastern Africa. London: Longman.
Mikšík, I., Holán, V., and Deyl, Z. (1996). Avian eggshell pigments and their variability. Comp. Biochem. Physiol. 113B, 607–612. doi: 10.1016/0305-0491(95)02073-X
Moreau, R. E. (1960). Conspectus and classification of the Ploceine weaver-birds. Ibis 102, 298–321. doi: 10.1111/j.1474-919X.1960.tb07116.x
Moskát, C., Szentpéteri, J., and Barta, Z. (2002). Adaptations by great reed warblers to brood parasitism: a comparison of populations in sympatry and allopatry with the common cuckoo. Behaviour 139, 1313–1329. doi: 10.1163/156853902321104181
Navarro, J. Y., and Lahti, D. C. (2014). Light dulls and darkens bird eggs. PLoS One 9:e116112. doi: 10.1371/journal.pone.0116112
O’Grady, T., and O’Grady, R. (1990). A description of nesting weaver birds (Ploceus galbula) in Saudia City, Jeddah. J. Saudi Arabian Nat. History Soc. 3, 60–62.
Payne, R. B. (1967). Interspecific communication signals in parasitic birds. Am. Nat. 101, 363–375. doi: 10.1086/282504
Polačiková, L., and Grim, T. (2010). Blunt egg pole holds cues for alien egg discrimination: experimental evidence. J. Avian Biol. 41, 111–116. doi: 10.1111/j.1600-048X.2010.04983.x
Polačiková, L., Hauber, M. E., Prochazka, P., Cassey, P., Honza, M., and Grim, T. (2011). A sum of its individual parts? Relative contributions of different eggshell regions to intraclutch variation in birds. J. Avian Biol. 42, 370–373. doi: 10.1111/j.1600-048X.2011.05202.x
Poole, H. K. (1965). Spectrophotometric identification of eggshell pigments and timing of superficial pigment deposition in the Japanese quail. Proc. Soc. Exp. Biol. Med. 119, 547–551. doi: 10.3181/00379727-119-30234
Poulton, E. B. (1884). Notes upon, or suggested by, the colours, markings and protective attitudes of certain lepidopterous larvae and pupae, and of a phytophagous hymenopterous larva. Trans. Entomol. Soc. Lond. 32, 27–60. doi: 10.1111/j.1365-2311.1884.tb01597.x
Rankin, K. J., Mclean, C. A., Kemp, D. J., and Stuart-Fox, D. (2016). The genetic basis of discrete and quantitative colour variation in the polymorphic lizard, Ctenophorus decresii. BMC Evol. Biol. 16:179. doi: 10.1186/s12862-016-0757-2
Ruiz-Raya, F., and Soler, M. (2017). “Phenotypic plasticity in egg rejection: evidence and evolutionary consequences,” in Avian Brood Parasitism: Behavior, Ecology, Evolution and Coevolution, ed. M. Soler (Cham: Springer), 449–471. doi: 10.1007/978-3-319-73138-4_25
Sacchi, R., Pellitteri-Rosa, D., Bellati, A., Di Paoli, A., Ghitti, M., Scali, S., et al. (2013). Colour variation in the polymorphic common wall lizard (Podarcis muralis): an analysis using the RGB colour system. Zool. Anz. 252, 431–439. doi: 10.1016/j.jcz.2013.03.001
Samaš, P., Hauber, M. E., Cassey, P., and Grim, T. (2014). Host responses to interspecific brood parasitism: a by-product of adaptations to conspecific parasitism? Front. Zool. 11:34. doi: 10.1186/1742-9994-11-34
Shirihai, H., and Svensson, L. (2018). “Rüppell’s weaver Ploceus galbula,” in Handbook of Western Palearctic Birds: Vol Ii: Passerines: Flycatchers to Buntings, (London: Helm).
Spottiswoode, C. N. (2013). A brood parasite selects for its own egg traits. Biol. Lett. 9:20130573. doi: 10.1098/rsbl.2013.0573
Spottiswoode, C. N., and Stevens, M. (2010). Visual modeling shows that avian host parents use multiple visual cues in rejecting parasitic eggs. Proc. Natl. Acad. Sci. U.S.A. 107, 8672–8676. doi: 10.1073/pnas.0910486107
Spottiswoode, C. N., and Stevens, M. (2011). How to evade a coevolving brood parasite: egg discrimination versus egg variability as host defences. Proc. R. Soc. B Biol. Sci. 278, 3566–3573. doi: 10.1098/rspb.2011.0401
Spottiswoode, C. N., and Stevens, M. (2012). Host-parasite arms races and rapid changes in bird egg appearance. Am. Nat. 179, 633–648. doi: 10.1086/665031
Stoddard, M. C., Hogan, B. G., Stevens, M., and Spottiswoode, C. N. (2019). Higher-level pattern features provide additional information to birds when recognizing and rejecting parasitic eggs. Philos. Trans. R. Soc. B Biol. Sci. 374:20180197. doi: 10.1098/rstb.2018.0197
Stoddard, M. C., and Prum, R. O. (2008). Evolution of avian plumage color in a tetrahedral color space: a phylogenetic analysis of New World buntings. Am. Nat. 171, 755–776. doi: 10.1086/587526
Stoddard, M. C., and Stevens, M. (2010). Pattern mimicry of host eggs by the common cuckoo, as seen through a bird’s eye. Proc. R. Soc. B Biol. Sci. 277, 1387–1393. doi: 10.1098/rspb.2009.2018
Swynnerton, C. F. M. (1916). On the coloration of the mouths and eggs of birds. II. On the coloration of eggs. Ibis 4, 529–606. doi: 10.1111/j.1474-919X.1916.tb07950.x
Takasu, F. (2003). Co-evolutionary dynamics of egg appearance in avian brood parasitism. Evol. Ecology Res. 5, 345–362.
Tibbetts, E. A., and Dale, J. (2007). Individual recognition: it is good to be different. Trends Ecol. Evol. 22, 529–537. doi: 10.1016/j.tree.2007.09.001
Tschanz, B. (1959). Zur Brutbiologie der Trottellumme (Uria aalge aalge Pont.). Behaviour 14, 1–100. doi: 10.1163/156853959X00018
Urban, E. K., Fry, C. H., and Keith, S. (eds) (2004). The Birds of Africa, Vol. VII. London: Christopher Helm.
Victoria, J. K. (1972). Clutch characteristics and egg discriminative ability of the African village weaverbird Ploceus cucullatus. Ibis 114, 367–376. doi: 10.1111/j.1474-919X.1972.tb00834.x
Vorobyev, M., and Osorio, D. (1998). Receptor noise as a determinant of colour thresholds. Proc. R. Soc. Lond. Ser. B Biol. Sci. 265, 351–358. doi: 10.1098/rspb.1998.0302
Walters, M. (2006). Colour in birds’ eggs: the collections of the Natural History Museum, Tring. Hist. Biol. 18, 145–208. doi: 10.1080/08912960600640887
White, H. (1982). Maximum likelihood estimation of misspecified models. Econometrica 50, 1–25. doi: 10.2307/1912526
Yang, C., Liang, W., Cai, Y., Shi, S. H., Takasu, F., Moller, A. P., et al. (2010). Coevolution in action: disruptive selection on egg colour in an avian brood parasite and its host. PLoS One 5:e10816. doi: 10.1371/journal.pone.0010816
Yang, C., Liu, Y., Zeng, L., and Liang, W. (2014). Egg color variation, but not egg rejection behavior, changes in a cuckoo host breeding in the absence of brood parasitism. Ecol. Evol. 4, 2239–2246. doi: 10.1002/ece3.1096
Keywords: brood parasitism, self-recognition, trait variation, polymorphism, egg coloration, Ploceidae
Citation: Lahti DC (2021) Analysis of Egg Variation and Foreign Egg Rejection in Rüppell’s Weaver (Ploceus galbula). Front. Ecol. Evol. 9:734126. doi: 10.3389/fevo.2021.734126
Received: 30 June 2021; Accepted: 22 September 2021;
Published: 11 October 2021.
Edited by:
Canchao Yang, Hainan Normal University, ChinaReviewed by:
Bruce Edward Lyon, University of California, Santa Cruz, United StatesCopyright © 2021 Lahti. This is an open-access article distributed under the terms of the Creative Commons Attribution License (CC BY). The use, distribution or reproduction in other forums is permitted, provided the original author(s) and the copyright owner(s) are credited and that the original publication in this journal is cited, in accordance with accepted academic practice. No use, distribution or reproduction is permitted which does not comply with these terms.
*Correspondence: David C. Lahti, ZGF2aWQubGFodGlAcWMuY3VueS5lZHU=
Disclaimer: All claims expressed in this article are solely those of the authors and do not necessarily represent those of their affiliated organizations, or those of the publisher, the editors and the reviewers. Any product that may be evaluated in this article or claim that may be made by its manufacturer is not guaranteed or endorsed by the publisher.
Research integrity at Frontiers
Learn more about the work of our research integrity team to safeguard the quality of each article we publish.