 Armin Komposch
 Andreas Ensslin1†
 Markus Fischer
 Andreas Hemp
- 1Institute of Plant Sciences, University of Bern, Bern, Switzerland
- 2Oeschger Centre for Climate Change Research, University of Bern, Bern, Switzerland
- 3Department of Plant Systematics, University of Bayreuth, Bayreuth, Germany
Deadwood is an important structural and functional component of forest ecosystems and biodiversity. As deadwood can make up large portions of the total aboveground biomass, it plays an important role in the terrestrial carbon (C) cycle. Nevertheless, in tropical ecosystems and especially in Africa, quantitative studies on this topic remain scarce. We conducted an aboveground deadwood inventory along two environmental gradients—elevation and land use— at Mt. Kilimanjaro, Tanzania. We used a huge elevation gradient (3690 m) along the southern slope of the mountain to investigate how deadwood is accumulated across different climate and vegetation zones. We also compared habitats that differed from natural forsts in land-use intensity and disturbance history to assess anthropogenic influence on deadwood accumulation. In our inventory we distinguished coarse woody debris (CWD) from fine woody debris (FWD). Furthermore, we calculated the C and nitrogen (N) content of deadwood and how the C/N ratio varied with decomposition stages and elevation. Total amounts of aboveground deadwood ranged from 0.07 ± 0.04 to 73.78 ± 36.26 Mg ha–1 (Mean ± 1 SE). Across the elevation gradient, total deadwood accumulation was highest at mid-elevations and reached a near-zero minimum at very low and very high altitudes. This unimodal pattern was mainly driven by the corresponding amount of live aboveground biomass and the combined effects of decomposer communities and climate. Land-use conversion from natural forests into traditional homegardens and commercial plantations, in addition to frequent burning, significantly reduced deadwood biomass, but not past selective logging after 30 years of recovery time. Furthermore, we found that deadwood C content increased with altitude. Our study shows that environmental gradients, especially temperature and precipitation, as well as different anthropogenic disturbances can have considerable effects on both the quantity and composition of deadwood in tropical forests.
HIGHLIGHTS
- We conducted an aboveground deadwood inventory across huge elevation and land-use gradients at Mount Kilimanjaro.
- At Kilimanjaro deadwood can account for up to 37.2 % of the total aboveground biomass.
- Deadwood accumulation strongly depends on live wood accumulation.
- Specific land-use histories differentially affect deadwood accumulation.
Introduction
Deadwood has many important key functions in forest ecosystems. It provides resources and habitats for a wide range of plant and animal groups, including amphibians, reptiles, arthropods, birds, mammals, vascular plants, bryophytes, fungi and lichens, and is therefore an important driver of biodiversity (Spetich et al., 1999). Furthermore, it has the potential to reduce erosion on steep forested slopes and promote soil development (Harmon and Hua, 1991; Bobiec et al., 2005). Through its carbon (C) storage capacity, it can be a considerable atmospheric CO2 sink (Pan et al., 2011; Iwashita et al., 2013), particularly in the tropics (Martin et al., 2021), and may therefore play an important role in mitigating global change effects. Deadwood currently stores about 8% of the global forest carbon stock (Pan et al., 2011) and 8.5% of atmospheric carbon (Friedlingstein et al., 2019). However, these sinks are offset by losses of C due to deforestation and forest degradation, particularly in tropical regions (Pan et al., 2011; Baccini et al., 2017).
Despite accounting for up to 20 % of the total aboveground biomass, deadwood has often been ignored in forest C budgets (Brown, 2002). Deadwood dynamics have been intensively studied in temperate regions for several decades (Harmon et al., 1986), with a particular focus on how deadwood accumulation is affected by management history (Sippola et al., 1998), stand age and site moisture condition (Spies et al., 1988), and successional stage (Battaglia et al., 1999).However, corresponding research in the tropics is still limited, even though these regions account for ∼33% of the terrestrial net primary production and harbor ∼25% of the global terrestrial C (Bonan, 2008).
Large pieces of standing or fallen dead wood, i.e., coarse woody debris (CWD), have been estimated to store 19–33% of the total aboveground C in tropical forests (Iwashita et al., 2013). However, the scarcity of quantitative data means that drivers of deadwood accumulation in these forests are still poorly understood. Moreover, some of the few existing case studies found contrasting results. For example, Clark et al. (2002) found that the accumulation of CWD was largely unaffected by topographic differences in tropical rain forests in Costa Rica, while Gale (2000) found that topography significantly affected CWD accumulation in Bornean and Ecuadorian lowland rainforests.
Furthermore, fine woody debris (FWD) is often ignored in deadwood inventories because of its presumed small contribution. Nevertheless, Harmon et al. (1995) measured FWD amounts reaching 24.2 Mg ha−1 in tropical forests and showed that this biomass pool can be of substantial importance, especially after disturbances like fire or hurricanes.
The speed of deadwood decomposition depends both on biotic factors like the pool of decomposing organisms and on abiotic factors like temperature and soil moisture (Harmon et al., 1986; Molinas-González et al., 2017). Since temperature and moisture schemes change with altitude, we expect that wood decomposition and chemical composition should also vary across an altitudinal gradient (Fravolini et al., 2016).
Until now, few studies have systematically investigated multiple aspects of deadwood along environmental gradients in tropical ecosystems. To improve our understanding of the role that different components of deadwood play in tropical forest ecosystems and the drivers of deadwood dynamics, we investigated deadwood biomass and composition across a large elevational (860–4550 m asl) and land-use gradient on the southern slope of Kilimanjaro, Tanzania. As the world’s highest solitary mountain, on a relatively small area (80 × 60 km), Kilimanjaro harbors a wide range of vegetation belts with different habitats and land use types. During the recent past (∼last 30 years), most of these belts have experienced some kind of disturbance – e.g., fire (Hemp, 2005a) and land-use change (Hemp, 2006a) – resulting in different disturbance histories. Both disturbance regimes and climatic conditions (at different elevations) have been identified as important drivers of live aboveground biomass accumulation (Ensslin et al., 2015), as well as vegetation structure (Rutten et al., 2015b) and species composition (Hemp, 2006a,b) and can therefore be expected to also affect deadwood stocks and composition.
We specifically asked:
i) How do aboveground deadwood biomass and composition depend on elevation at Mt. Kilimanjaro and which environmental factors influence these relationships?
ii) Do different land-use regimes and disturbance histories influence deadwood accumulation and composition?
iii) How much C is stored in the deadwood at Kilimanjaro and does this change with elevation?
iv) Does the wood C content of deadwood change with elevation?
Materials and Methods
Study Site
Mt. Kilimanjaro is located 300 km south of the equator between 2°45′ and 3°25′ South and 37°00′ and 37°43′ East. It is not only Africa’s highest peak but also the highest free-standing mountain in the world. The mountain is an ancient volcano with three peaks (Mawenzi, Shira, Kibo). It covers an elevation gradient from ∼700 m above sea level (asl) to 5895 m asl. This corresponds to a temperature gradient linearly decreasing from 23°C at the lowland savannas to 3°C at the alpine zone and −7°C at the Uhuru-peak (summit) (Hemp, 2006a).
Precipitation at Mt. Kilimanjaro is mainly determined by the biannual passage of the Intertropical Convergence Zone (ITCZ) and is modified by elevation. Due to its equatorial location Mt Kilimanjaro has two distinct annual wet periods – a long rain period from March to May and a short but intense rain period around November (Hemp, 2006a). Precipitation is lowest at the savanna foothills (∼900 mm/year at 800 m asl) and afro-alpine heathlands (∼500 mm/year at 4700 m asl) and peaks at mid-elevation (partly over 3000 mm/year at 2200 m asl; Hemp, 2006a). Mean annual precipitation and temperature data for each of the research plot were provided by Appelhans et al. (2014).
The relatively mild climate in the lower montane zone promotes small holder farming and commercial plantations and farms. This, together with ongoing population growth, has led to the establishment of a variety of natural and anthropogenically altered habitat types at lower and mid elevations (Rutten et al., 2015b; Hemp and Hemp, 2018; Figure 1).
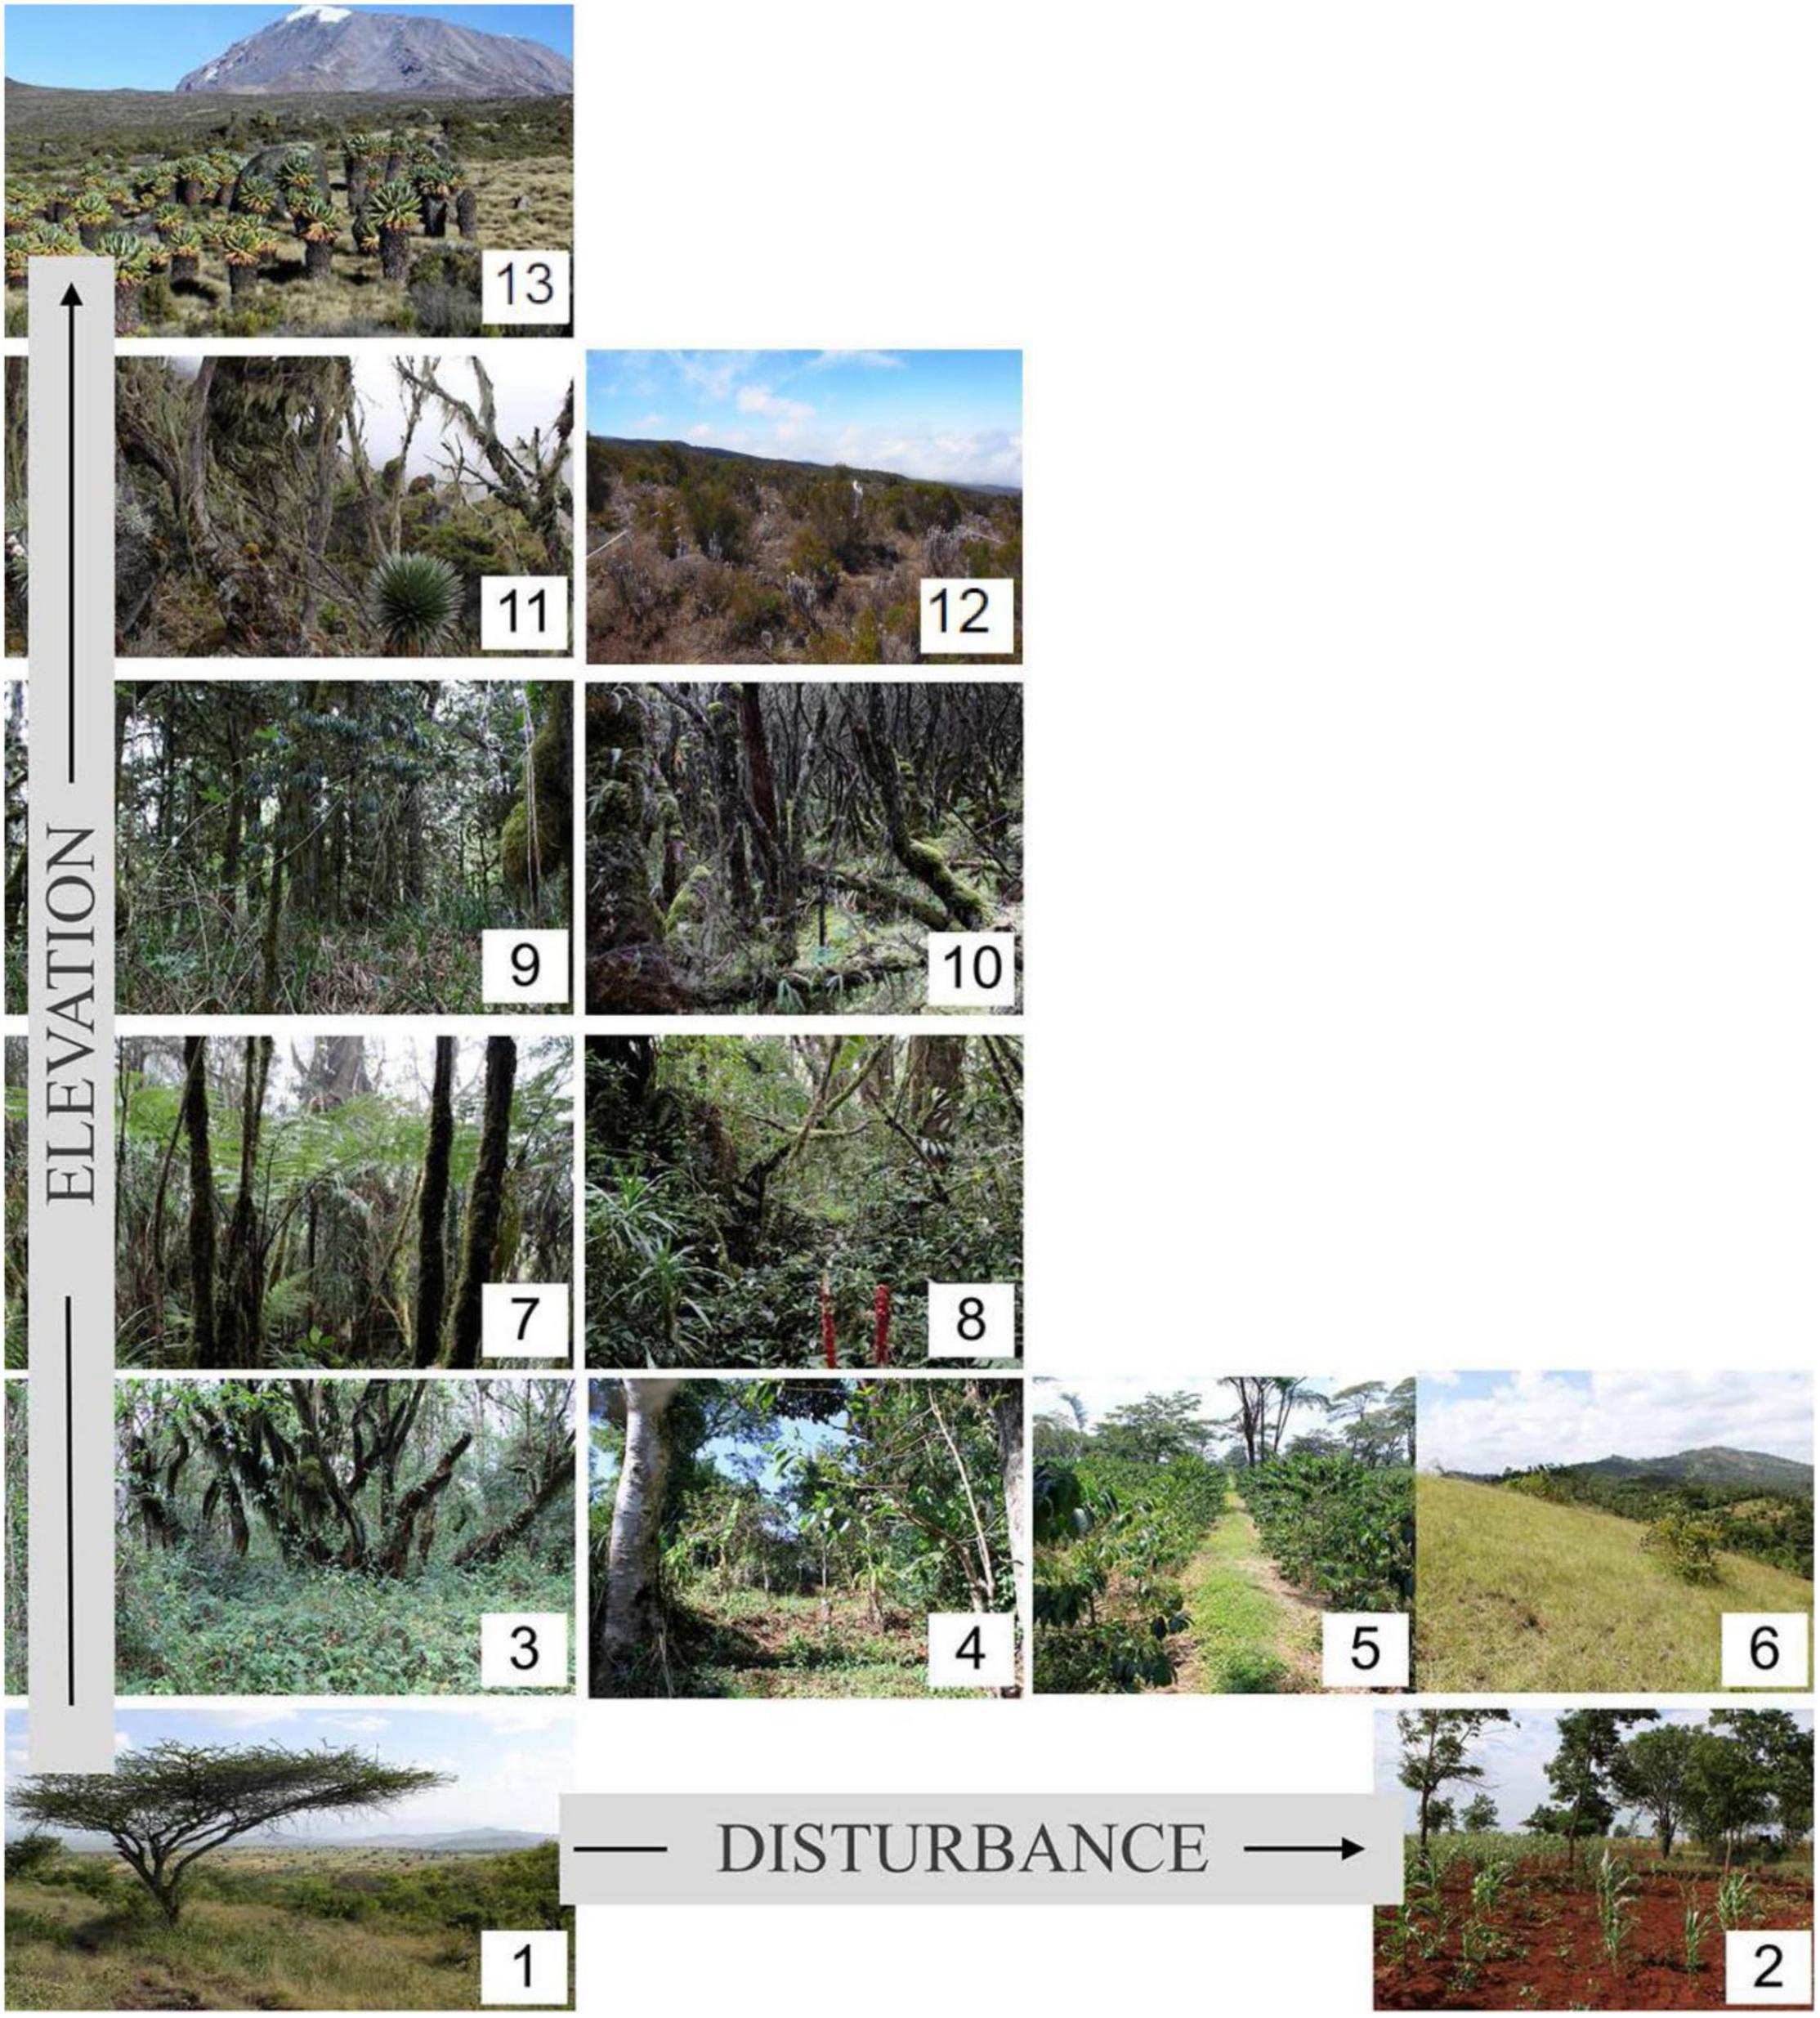
Figure 1. Location of the 13 land-use types along the elevational, and disturbance and land-use gradient. The six land-use types with no or little disturbance are savanna (1), lower montane forest (3), Ocotea forest (7), Podocarpus forest (9), Erica forest (fer), and Helichrysum (hel). The land-use types with medium anthropogenic disturbance are grassland (6), disturbed Ocotea forest (8), disturbed Podocarpus forest (10), and disturbed Erica forest (12). The habitat types with intensive human land-use are maize (2), Chagga homegardens (4), and coffee plantations (5).
Habitat Types at Mt. Kilimanjaro
We used the permanent study plots of the DFG-Research Unit ‘‘Kilimanjaro ecosystems under global change: Linking biodiversity, biotic interactions, and biogeochemical ecosystem processes (KiLi)’’ which cover all main natural and human-modified habitat types across the elevational gradient on Mt. Kilimanjaro1. The study plots of the KiLi project cover the 13 most important natural and anthropogenically influenced habitat types on Kilimanjaro (Figure 1) occurring in the six main vegetation zones on the southern and eastern slope, where vegetation zonation is stronger and the habitat range wider than on the northern and western slope due to the wetter conditions and the more pronounced climatic and elevational gradient (Hemp, 2006a).
Six of these habitats are in a natural and undisturbed stage and seven are characterized by different land-use intensities (LUI) or disturbance histories (Supplementary Table 3). The lowest habitats on the foothills in the colline savannah belt (800–1100 m asl) are dominated by crop production (maize, beans, and sunflowers) and only a few savannah areas are left (Hemp, 2006a). From 1100 to 2000 m asl, the zone characterized by the highest human population density at the mountain (Hemp, 2006a), the most widespread land use types is the traditional agroforestry system of the local Chagga people (“Chagga homegardens”). Bananas, beans and coffee are cultivated alongside some interspersed forest trees for shade provision. Furthermore, in this zone, the Chagga people have turned forests into frequently cut grasslands for fodder collection. Commercial coffee farms have also been established at this elevation belt. Relicts of natural forests are mostly restricted to steep valleys and gorges harboring the tallest trees in Africa (Hemp, 2006a; Hemp et al., 2017). Above the densely populated submontane zone begins the montane forest belt (1800 to 2800 m asl). The lower part is characterized by Ocotea usambarensis dominated forests, which were partly subjected to selective logging until 1984 (Agrawala et al., 2003; Hemp, 2006a). Several sawmills operating on the southern slopes of the mountain removed precious large timber trees, mainly Ocotea usambarens. Pit-sawyers and saw millers harvested 1,876,321 m3 of timber from various indigenous trees on the whole mountain between 1965 and 1984. Since then, only scattered illegal logging has occurred in some remote areas. These illegal activities decreased after the incorporation of the forest belt into the national park in 2006. In the upper areas of Kilimanjaro fires are frequent and mainly lit by people (honey collectors and poachers). Most of these fires occur at the end of the dry seasons and stop at the beginning of the rainy seasons. During the last decades, about 150 km2 of upper montane and subalpine forests were burnt (Hemp, 2005b). The upper montane zone (2800 to 3200 m asl) is dominated by Podocarpus latifolius forests. Large parts of these forest were destroyed by fire and then replaced by Erica excelsa forests creating a mosaic of burnt and unburnt areas (Hemp and Beck, 2001; Hemp, 2006a). In the subalpine zone (3200 to 4000 m asl) most of the former Erica trimera forests (Africa’s highest forests) have been degraded after fire in the ericaceous shrublands (Hemp, 2006a,b). The last and highest zone is characterized by alpine vegetation (4000 to 4600 m asl) and contains mainly Helichrysum cushion plants and tussock grasses (Hemp, 2006a).
In this study, each habitat type is represented by five replicate plots, with the exception of coffee plantations (6 replicates) and alpine vegetation (4 replicates), distributed along an east-west and an elevational gradient within each vegetation zone. The 65 plots, each of 0.25 ha, were distributed over five elevational transects on the southern slope of Mt. Kilimanjaro, covering an elevational gradient from 870 to 4550 m a.s.l. Minimum distance between transects was 12.2 km on the foothills and 4.6 km in the alpine zone, and minimum distance between plots was approximately 300 m. For each site, plot position (latitude, longitude and elevation) was recorded with GPS. For more details see e.g., Rutten et al. (2015b). Moreover, for each plot, mean annual temperature was obtained from in-situ measures by temperature loggers (data logger DK320, Driesen and Kern GmbH, Bad Bramstedt, Germany) and mean annual precipitation was modeled using long-term observations based on a 15-year dataset from a network of rain gauges distributed across the whole mountain (Hemp, 2006a; Appelhans et al., 2014).
Sampling
Within the center of each 50 × 50 m KiLi study plot, an area of 50 × 20 m (1000 m2) was surveyed for aboveground deadwood during spring and autumn 2015. All pieces with a diameter > 10 cm at their larger end were classified as coarse woody debris (CWD). In this class, pieces were further described as standing dead trees (snags), downed trees (logs) or stumps (standing dead trees not exceeding 1.5 m in height). For snags, diameter at breast height (DBH) and top diameter were measured using a 100 cm caliper or a measuring tape. Whenever the top diameter was not possible to reach, it was visually estimated. The height of snags was measured with an ultra-sonic hypsometer (Vertex IV Hypsometer, Haglöf, Langsale, Sweden). For logs and stumps, three diameters were measured at the big, middle and small ends using the 100 cm caliper. For all pieces that clearly deviated from a circular circumference, two different diameters perpendicular to each other were measured. The length of each piece was measured using a measure tape. Furthermore, the volume of hollow parts in CWD pieces was assessed as described below. Each CWD piece was then ascribed to one of five decomposition classes according to the following criteria after Baker et al. (2007):
(1) Solid, recently fallen wood with intact bark and fine branches attached. (2) Solid wood without fine branches, bark starting to fall off. (3) Non-solid wood, but still difficult to push a knife into. (4) Soft rotten wood, easy to push a knife into. (5) Soft rotten wood, collapsing easily when standing upon it.
Finally, wood samples of CWD pieces for subsequent C/N analysis were collected using an increment corer (Increment borer 60cm, Suunto, Vantaa, Finland), a handsaw or a machete such as to include a representative wood transect from the core to the bark. Whenever possible, at least 10 wood pieces (logs, stumps or snags) per plot were randomly chosen. When it was impossible to collect 10 samples, the maximum available number was taken.
Fine woody debris (FWD) consisted of all pieces with a diameter < 10 cm at the bigger end. To record FWD, 10 subplots, each consisting of 1m2, were established randomly within the original plot and within these subplots, all FWD was collected and weighed directly in the field using a spring balance.
We excluded banana plants in the entire inventory since the focus was only on woody plants. Even though some habitats are densely covered with bananas, they represent an ephemeral biomass pool, since the debris of these plants is normally immediately gathered by local people.
Wood Density
To estimate wood density of CWD samples, the volume of 195 wood samples from those taken for C/N analyses was measured to the nearest 0.25 ml using the volumetric water displacement method (Ravindranath and Ostwald, 2008). The samples were then oven dried to constant weight (at 80° for at least 72 h) and weighed to the nearest g. Finally, the wood density of each sample was calculated as:
Since we did not distinguish between different tree species, we averaged the density at a plot level and used this approximation for further calculations (Supplementary Table 4).
Coarse Woody Debris Volume and Biomass Calculation
To calculate CWD volume, we used equations proposed by Harmon and Sexton (1996). First, we created a round equivalent for all wood pieces that deviated strongly from a circular circumference using the equations [2 & 3]:
where, Dmax,Dmin, and Dround are the maximum (for standardization, diameter of standing deadwood was measured at breast height; DBH), minimum and round equivalent diameters [m], respectively, A[m2] is the area.
The volume of logs and stumps was calculated with Newton’s formula:
where, V = Volume [m3], A_S, A_M and A_B = Area [m2] at small end, middle and big end, respectively, (calculated with corresponding diameter measurements), and L = Length of the piece [m].
For snags lacking a Dmin measurement or estimate, we used the slope of the regression line between Dmax and Dmin of all pieces, for which both measurements could be obtained, to estimate Dmin. Then we calculated the volume using the formula for the frustum of a paraboloid:
where, V = Volume [m3], AS and AB = Area at small and big end, respectively [m2], and L = Length of the piece [m]. The same equations were used to calculate the volume of holes of hollow pieces, which then was subtracted from the total volume to get the actual wood volume per piece.
Biomass of a CWD piece was calculated as:
where, M = mass of wood piece [t], ρ = wood density [t/m3] (averaged by plot), V = volume of the wood piece [m3]. Finally, the sum of CWD was calculated at the plot level.
For one natural plot (FPO5) samples were lost. Therefore, we averaged the density of all other plots of the same habitat type and used this measure for the biomass calculation.
C/N Analysis
A total of 274 CWD samples were thoroughly ground using a mixer mill (Retsch MM400) and then concentrations of C and Nitrogen (N) were determined using a C/N analyser (vario EL cube, Elementar) at the Institute of Geography, University of Bern, Switzerland. Mean C and N content per plot were calculated as the arithmetical average of C and N content of analyzed wood samples from respective research plots.
Wood C Pools
We multiplied the average wood C content of each plot by its corresponding deadwood biomass values to estimate C pools. For plots where it was not possible to get wood C content measurements due to the absence of deadwood (see Supplementary Table 4), we used the mean C content of all plots of the same habitat type or elevation belt as an approximation.
Statistical Analysis
We applied linear regression models to find out whether wood density and C content depended on elevation. To test for differences in these two measurements between different habitat types (section “Habitat Types at Mt. Kilimanjaro”), we performed Student’s t-tests and Tukey’s HSD tests.
In order to analyse how deadwood biomass accumulation and the corresponding C pools varied with elevation and precipitation, we focused exclusively on natural, undisturbed plots (see Figure 1). We used linear regression models with total deadwood biomass (TDW), CWD or FWD and the corresponding deadwood C pools (CWD C, FWD C, and TWD C) as response variables and elevation or precipitation as explanatory variables. We fitted linear, quadratic and cubic functions to the data and chose the best model according to the Akaike Information Criterion (AIC). Whenever the normality assumption of the residuals was violated, the response variable was log-transformed prior to the analysis. In cases where log-transformation of the data did not result in normally distributed residuals, we used additional statistical techniques (generalized linear models (glm), Kruskal-Wallis rank sum test, ANOVA test with log- transformed data) to check the robustness of the results. If all tests led to similar results, we assumed that they were robust despite not meeting the normality assumption.
To analyse differences in deadwood biomass content between natural and disturbed plots (section “Habitat Types at Mt. Kilimanjaro”), we used Student’s t-tests and Tukey’s HSD tests.
All analyses were performed using RStudio Version 0.99.489 (RStudio Team, 2020).
Results
Wood Properties Across Elevation and Decomposition Stages
In total we measured the diameters and lengths of 700 CWD pieces (500 logs, 106 snags and 94 stumps) and calculated the aboveground deadwood volume based on these measurements. Mean wood density per plot, derived from 195 samples, was 0.34 ± 0.01 Mg m–3 and did not vary significantly between habitat types or different elevations (Supplementary Table 4). However, wood density decreased with increasing decomposition stage (R2 = 0.10, F4,189 = 6.43, P < 0.01: Table 1). The chemical composition (C and N content) of wood samples was measured for 274 CWD samples and varied across different decomposition classes (Table 1) as well as elevation (Figure 2). Percentage of both C and N in CWD samples increased with increasing decomposition (Table 1: R2 = 0.03, F4,269 = 3.01, P < 0.01, and R2 = 0.04, F4,269 = 4.21, P < 0.01, respectively). The C/N ratio decreased with increasing decomposition stage (R2 = 0.05, F4,269 = 4.54, P < 0.01). The percentage of C in CWD samples increased significantly with elevation (R2 = 0.26, F1,32 = 12.68, P < 0.01; Figure 2), while % N remained constant.
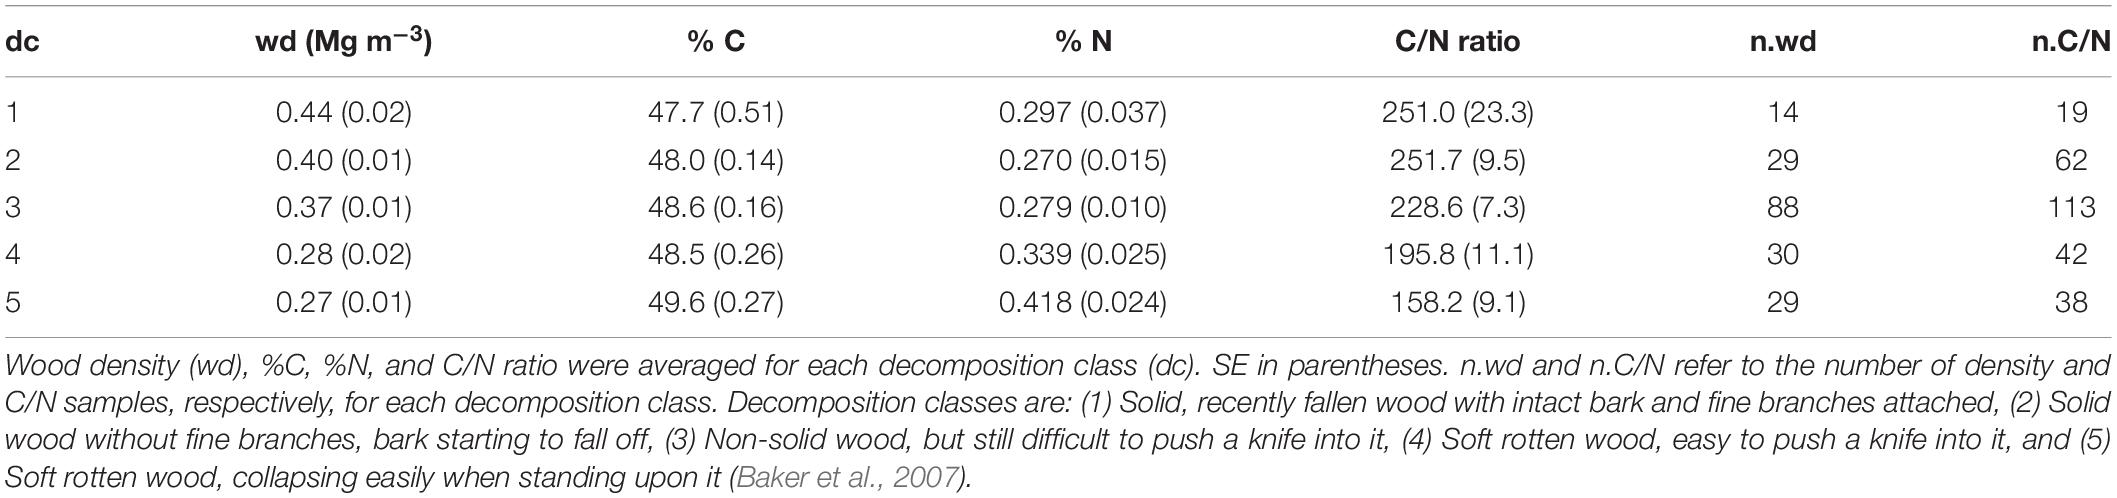
Table 1. Decomposition classes of CWD samples and corresponding wood densities.
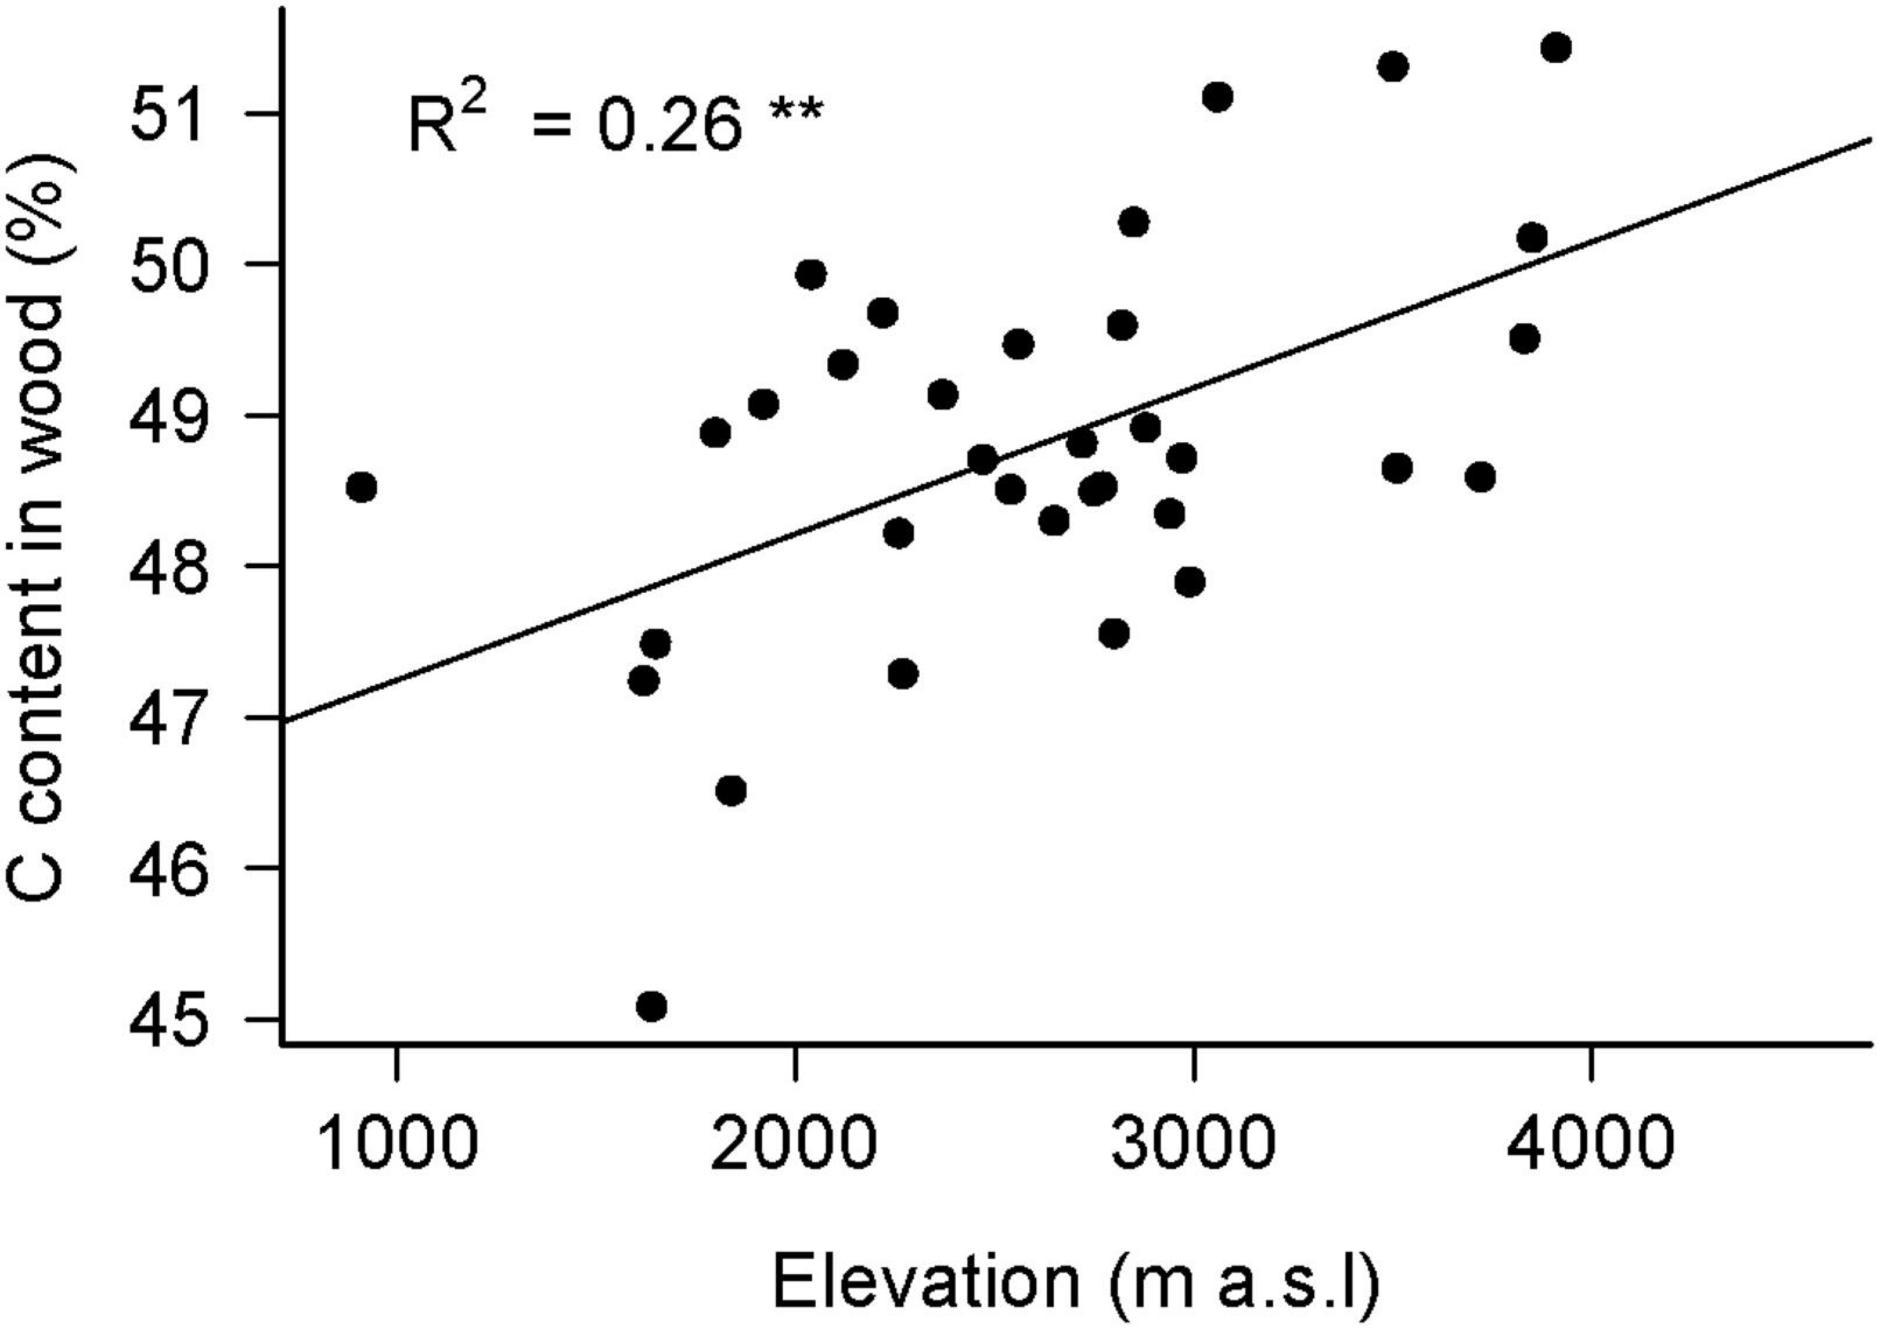
Figure 2. C content in CWD samples as a function of elevation. The percentage of C in CWD, averaged for each plot, significantly increased with increasing elevation (R2 = 0.26, F1,32 = 12.68, P < 0.01).
Deadwood Biomass and C Pools in Natural Plots Over Elevation and Precipitation
All three deadwood pools (FWD, CWD, and TDW) showed similar unimodal distributions along elevation (Figure 3). Even though we found an increase in C content of deadwood with altitude, this did not change the general relationship between deadwood biomass and deadwood C pool, because the absolute increase of C content was only 4%, while biomass difference was almost 500 times. Therefore, the distributions of CWD C and FWD C along the elevation gradient strongly followed the ones of CWD and FWD. For simplicity, we only discuss CWD and FWD and provide information on the corresponding C pools in Table 2 and Supplementary Figures 1, 2.
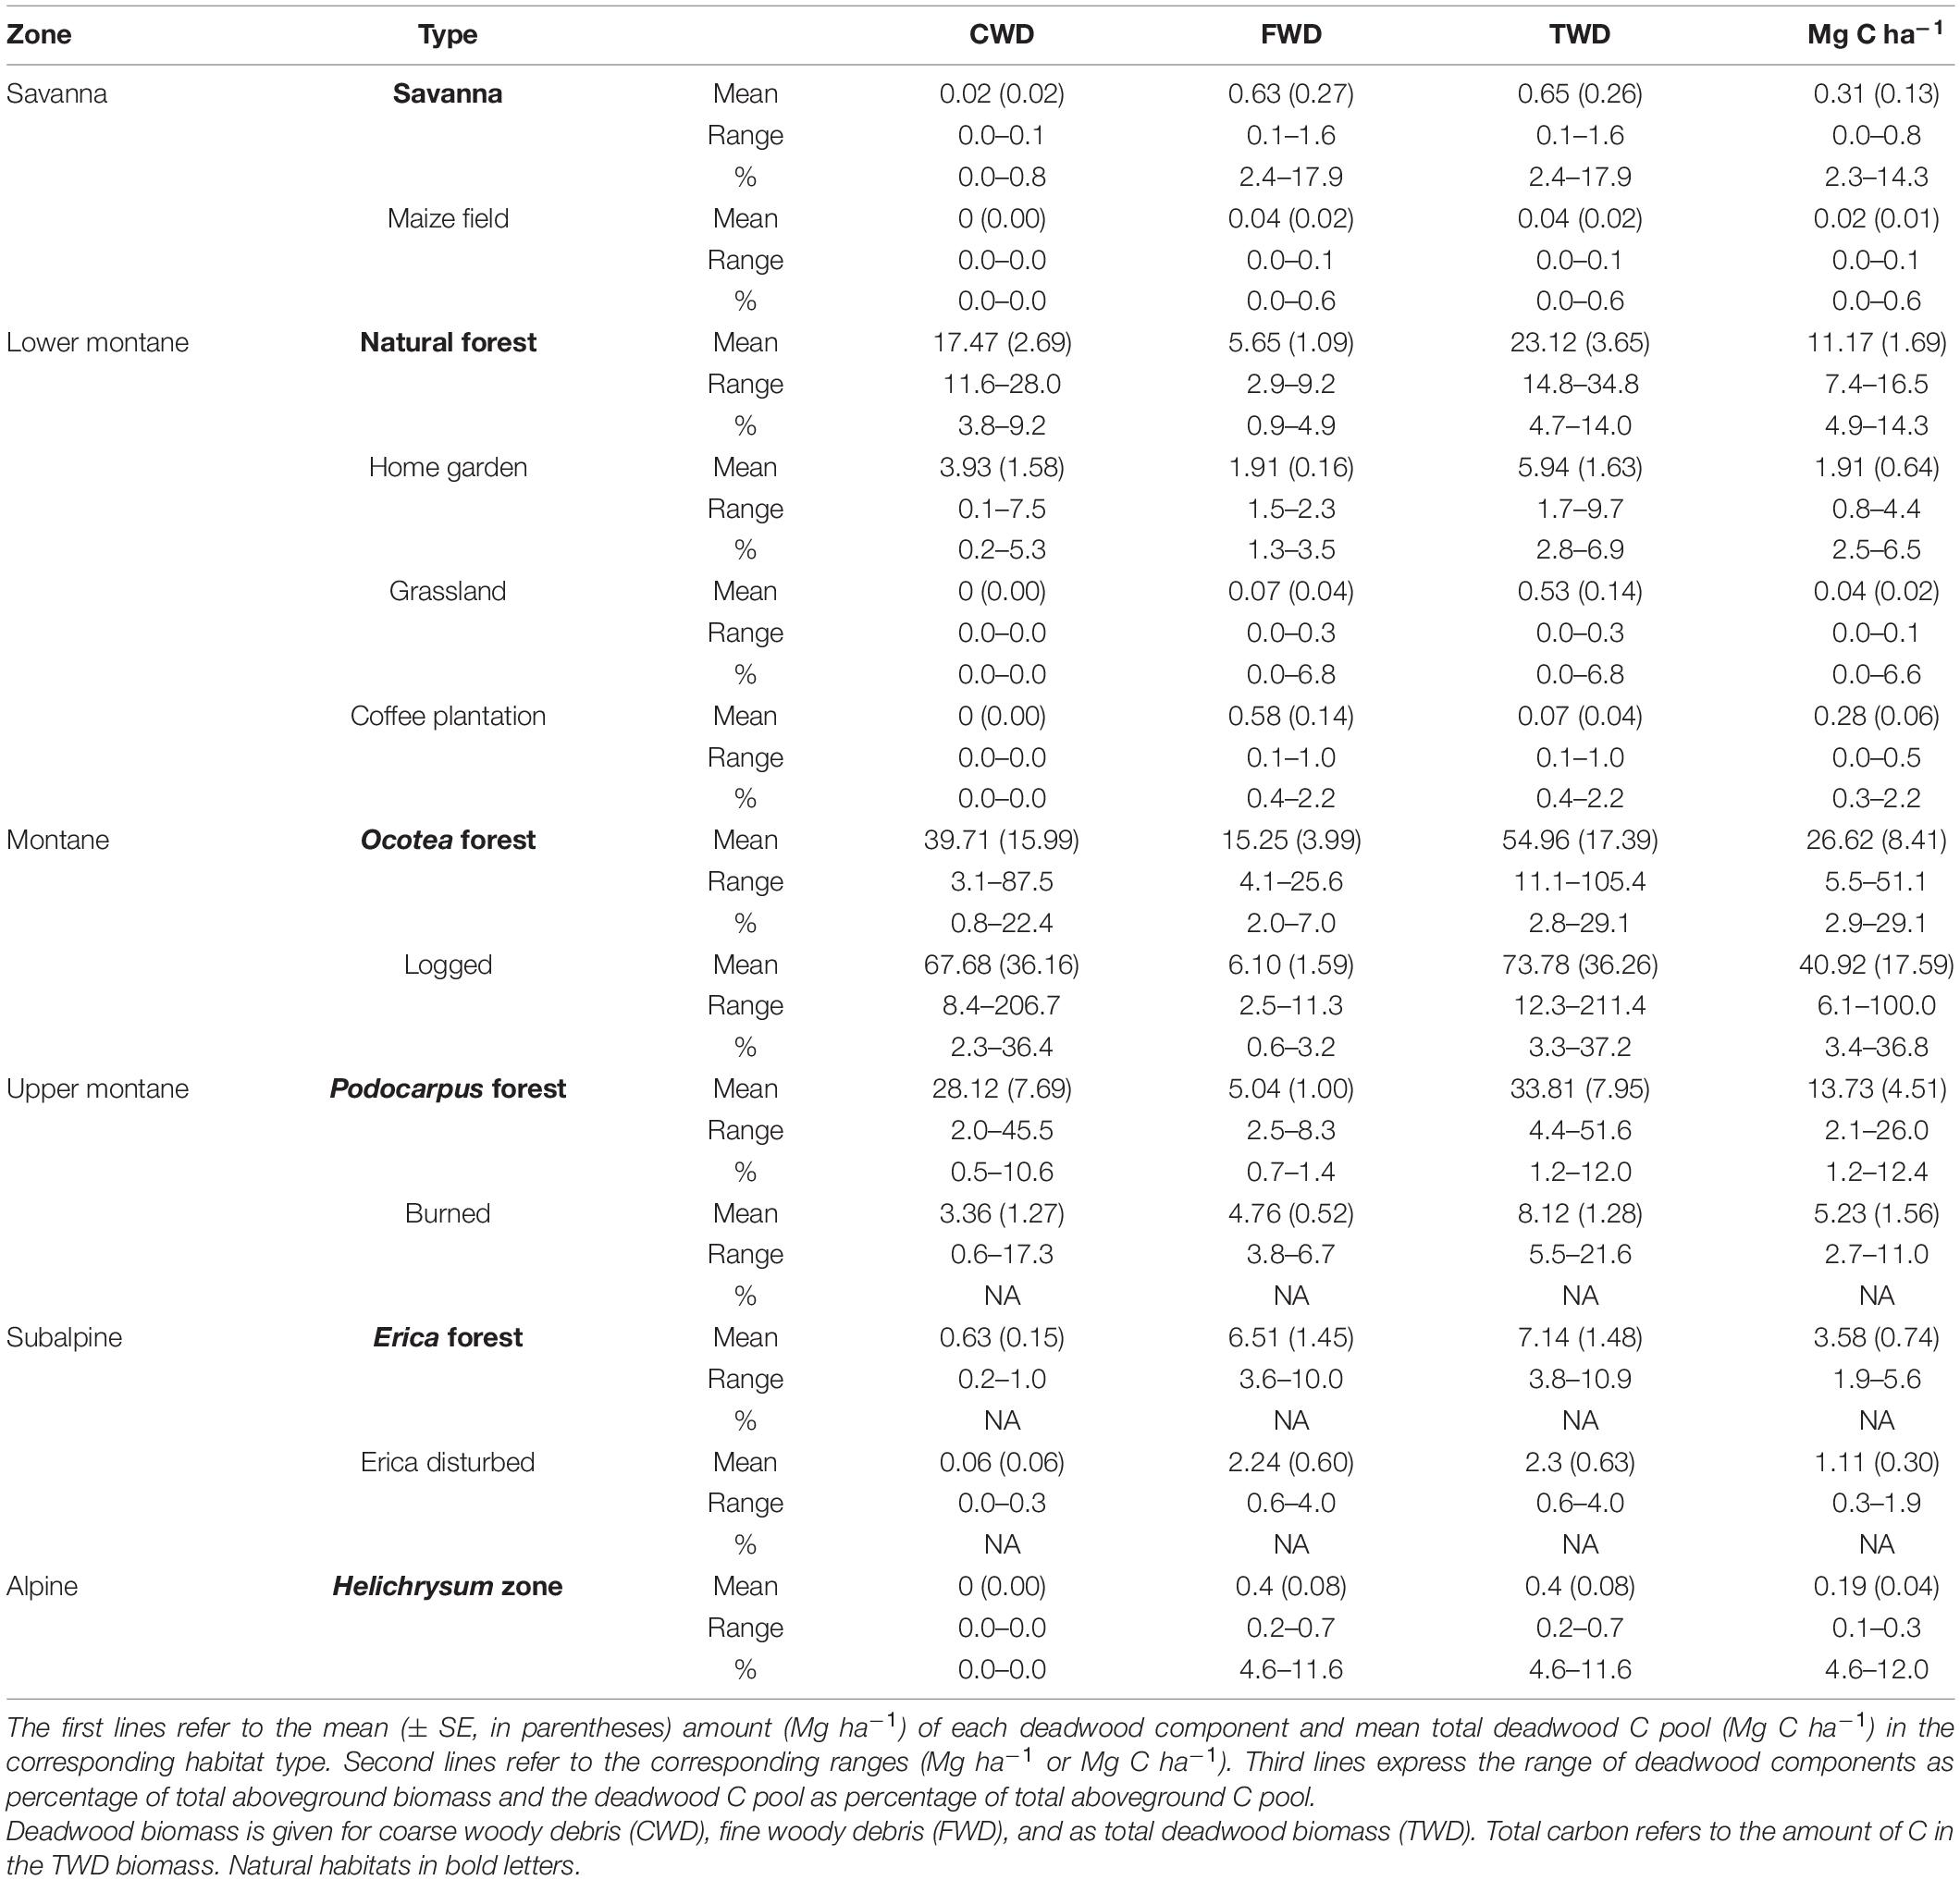
Table 2. Distribution of deadwood components and deadwood C pool in different habitat types.
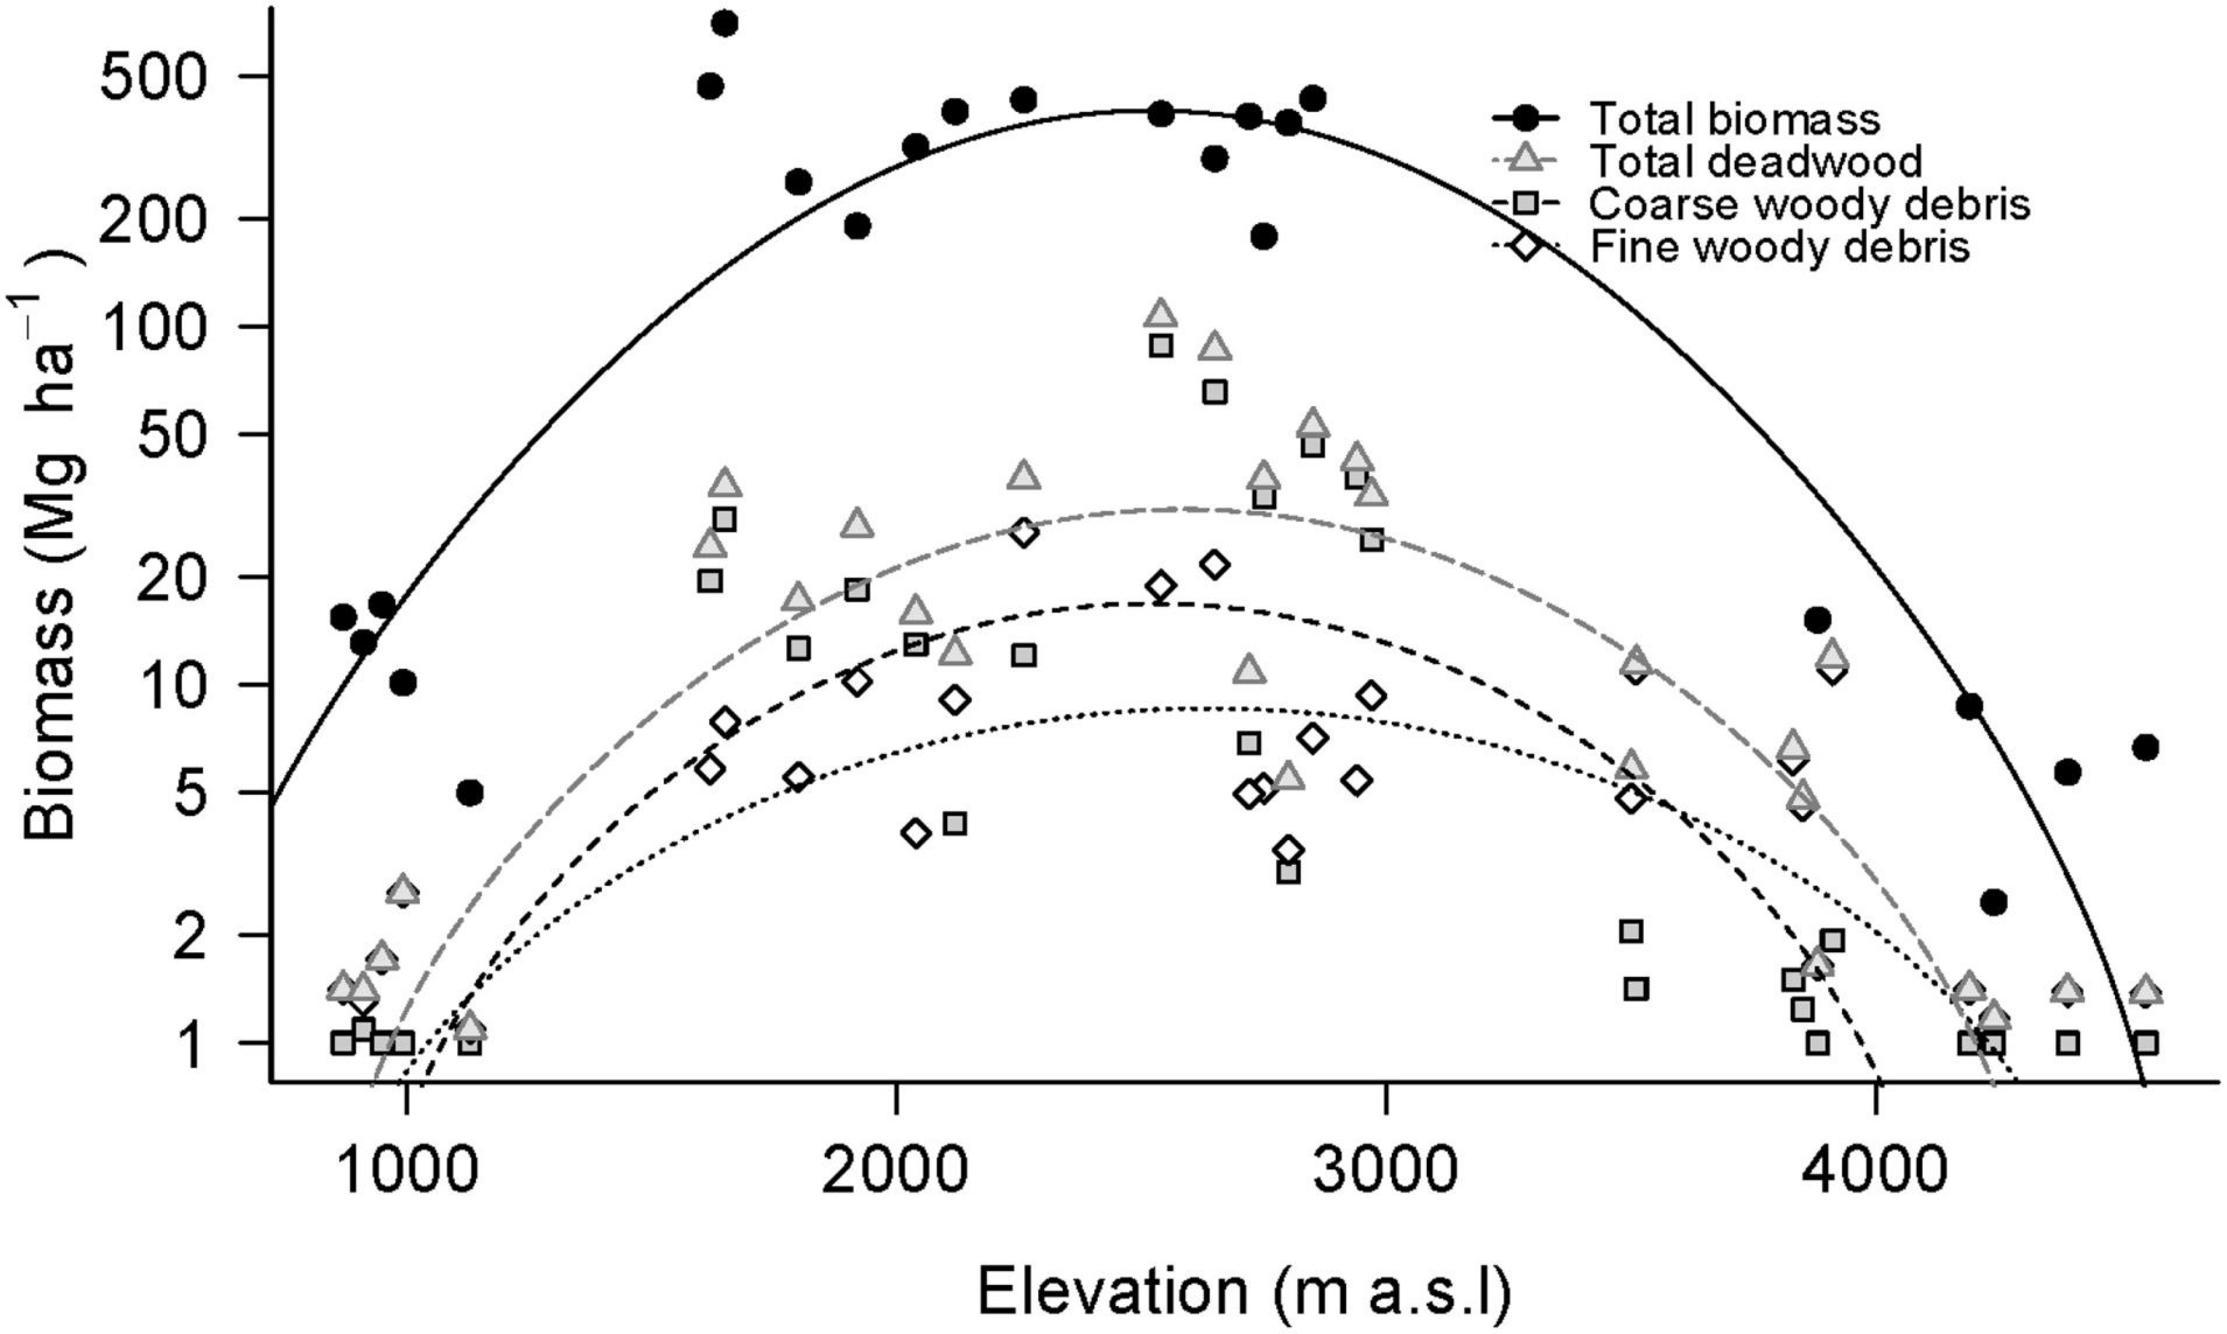
Figure 3. Aboveground biomass over the elevation gradient at Mt. Kilimanjaro. Total biomass was calculated as live aboveground woody biomass [Ensslin et al. (2015)] + TWD. Quadratic functions were fitted to total biomass (R2 = 0.83, F2,20 = 55.03, P < 0.001), TWD (R2 = 0.74, F2,27 = 41.4, P < 0.001), CWD (R2 = 0.6304, F2,27 = 25.73, P < 0.001), and FWD (R2 = 0.60, F2,27 = 22.8, P < 0.01). Please note the log-scale.
The maximum amounts of CWD and CWD C (87.46 Mg ha–1 and 42.42 Mg C ha–1) were measured in an Ocotea forest plot (2540 m asl) and decreased to zero in both the lowland savanna and the alpine Helichrysum zones (CWD; R2 = 0.6304, F2,27 = 25.73, P < 0.001, CWD C; R2 = 0.58, F2,27 = 20.9, P < 0.001). The lowest and the highest zones with more than one plot containing any CWD were the lower montane and subalpine zones, respectively.
The FWD and FWD C also peaked in an Ocotea forest (25.57 Mg ha–1 and 12.33 Mg C ha–1 at 2260 m asl) and decreased to minimal amounts in the savanna zone (0.09 Mg ha–1 and 0.05 Mg C ha–1, respectively, at 1130 m asl) and in the Helichrysum zone (0.17 Mg ha–1/0.08 Mg C ha–1, respectively, at 4240 m asl) (FWD; R2 = 0.60, F2,27 = 22.8, P < 0.001, FWD C; R2 = 0.55, F2,27 = 19.19, P < 0.001).
TWD and TWD C were highest in a montane forest plot (105.36 Mg ha–1/51.11 Mg C ha–1, respectively, at 2540 m asl) and decreased to minimal amounts in the savanna zone (0.10 Mg ha–1/0.04 Mg C ha–1, respectively, at 1130 m asl) and in the Helichrysum zone (0.17 Mg ha–1 0.08 Mg C ha–1 respectively at 4240 m asl; TWD; R2 = 0.74, F2,27 = 41.4, P < 0.001, TWD C; R2 = 0.70, F2,27 = 35.9, P < 0.001).
Consequently, total aboveground biomass and C pool (TAGB and TAGB C, respectively; calculated as the live aboveground biomass or C pool from Ensslin et al. (2015) plus TWD or TWD C, respectively) peaked in a lower montane forest plot (699.10 Mg ha–1/ 336.73 Mg C ha–1, respectively, at 1650 m asl), with the low and high elevation minima measured in a savanna plot (4.00 Mg ha–1/1.95 Mg C ha–1, respectively, at 1130 m asl) and a Helichrysum plot (1.47 Mg ha–1/0.68 Mg C ha–1, respectively at 4240 m asl) (TAGB; R2 = 0.63, F2,27 = 25.73, P < 0.001, TAGB C; R2 = 0.89, F2,20 = 92.2, P < 0.001).
The CWD, CWD C, FWD, TWD, and TWD C significantly increased with increasing mean annual precipitation (MAP) (CWD: R2 = 0.60, F1,28 = 56.5, P < 0.001; CWD C: R2 = 0.61, F1,28 = 45.93, P < 0.001 FWD: R2 = 0.59, F1,28 = 44.08, P < 0.01; and TWD: R2 = 0.71, F1,28 = 73.41, P < 0.001, TWD C: R2 = 0.78, F1,21 = 80.18, P < 0.001 Figure 4).
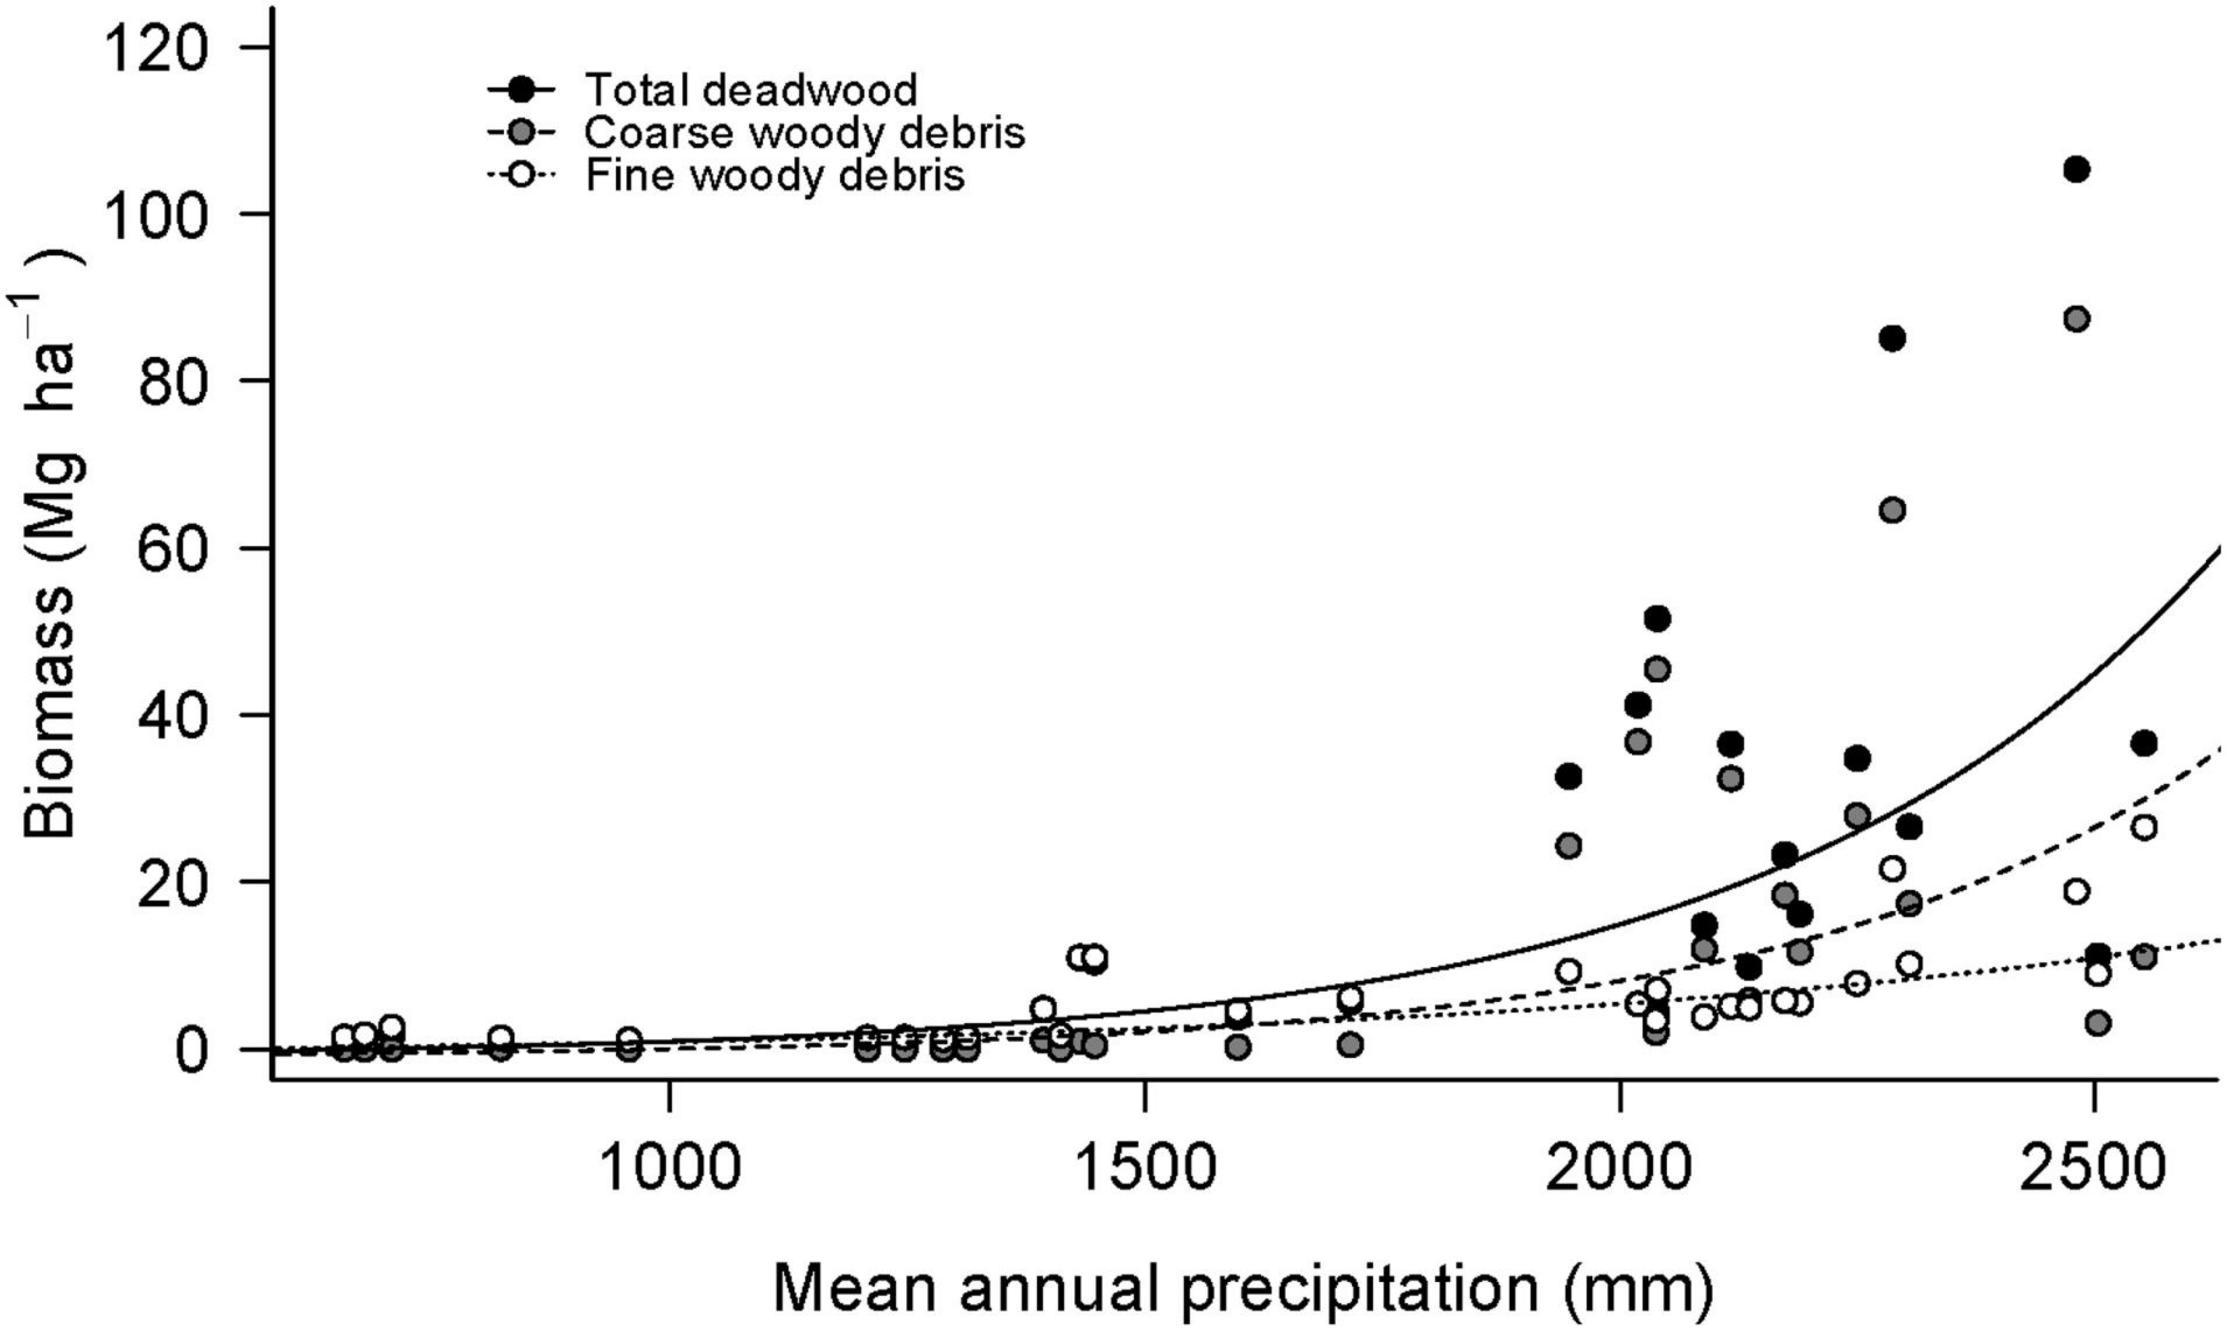
Figure 4. Aboveground biomass as a function of precipitation. Linear functions were fitted to log-transformed biomass data. TWD (R2 = 0.71, F1,28 = 73.41, P < 0.01), CWD (R2 = 0.60, F1,28 = 56.5, P < 0.01), and FWD (R2 = 0.59, F1,28 = 44.08, P < 0.01).
We did not find any significant relationship between deadwood composition (debris type and decomposition stage; Supplementary Tables 1, 2) and altitude or precipitation.
Impacts of Land Use and Disturbance History on Deadwood Biomass and C Pools
Significant differences between natural and disturbed plots with regard to deadwood biomass and C pools were found in the lower montane and the alpine zone. In the lower montane zone mean CWD and CWD C was more than 7-fold higher in natural forests (17.47 Mg ha–1/8.43 Mg C ha–1, respectively) than in homegardens (3.93 Mg ha–1/1.04 Mg C ha–1, respectively; CWD; P < 0.01, CWD C; P < 0.01), whereas grasslands and coffee plantations did not harbor any CWD and CWD C at all (Figure 5A and Supplementary Figure 2A). In the same zone, mean FWD/FWD C of natural forests (5.65 Mg ha–1/2.74 Mg C ha–1, respectively) more than doubled compared with disturbed plots (homegardens = 1.91 Mg ha–1/0.87 Mg C ha–1, grasslands = 0.07 Mg ha–1/0.04 Mg C ha–1, coffee plantations = 0.58 Mg ha–1/0.28 Mg C ha–1, respectively; Figure 5B and Supplementary Figure 2B). In the subalpine zone, though low in values, natural Erica forests harbored significantly more CWD and CWD C (0.63 Mg ha–1 /0.32 Mg C ha–1, respectively) than burned Erica forests (0.06 Mg ha–1/0.03 Mg C ha–1, respectively; CWD; P = 0.02, CWD C; P = 0.02 Figure 5A and Supplementary Figure 2A). Mean FWD and FWD C in natural Erica forests (6.51 Mg ha–1 and 3.26 Mg C ha–1, respectively) were almost three times larger than in burned plots (2.24 Mg ha–1 and 1.08 Mg C ha–1, respectively) (FWD; P = 0.04; FWD C; P = 0.04, Figure 5B and Supplementary Figure 2B).
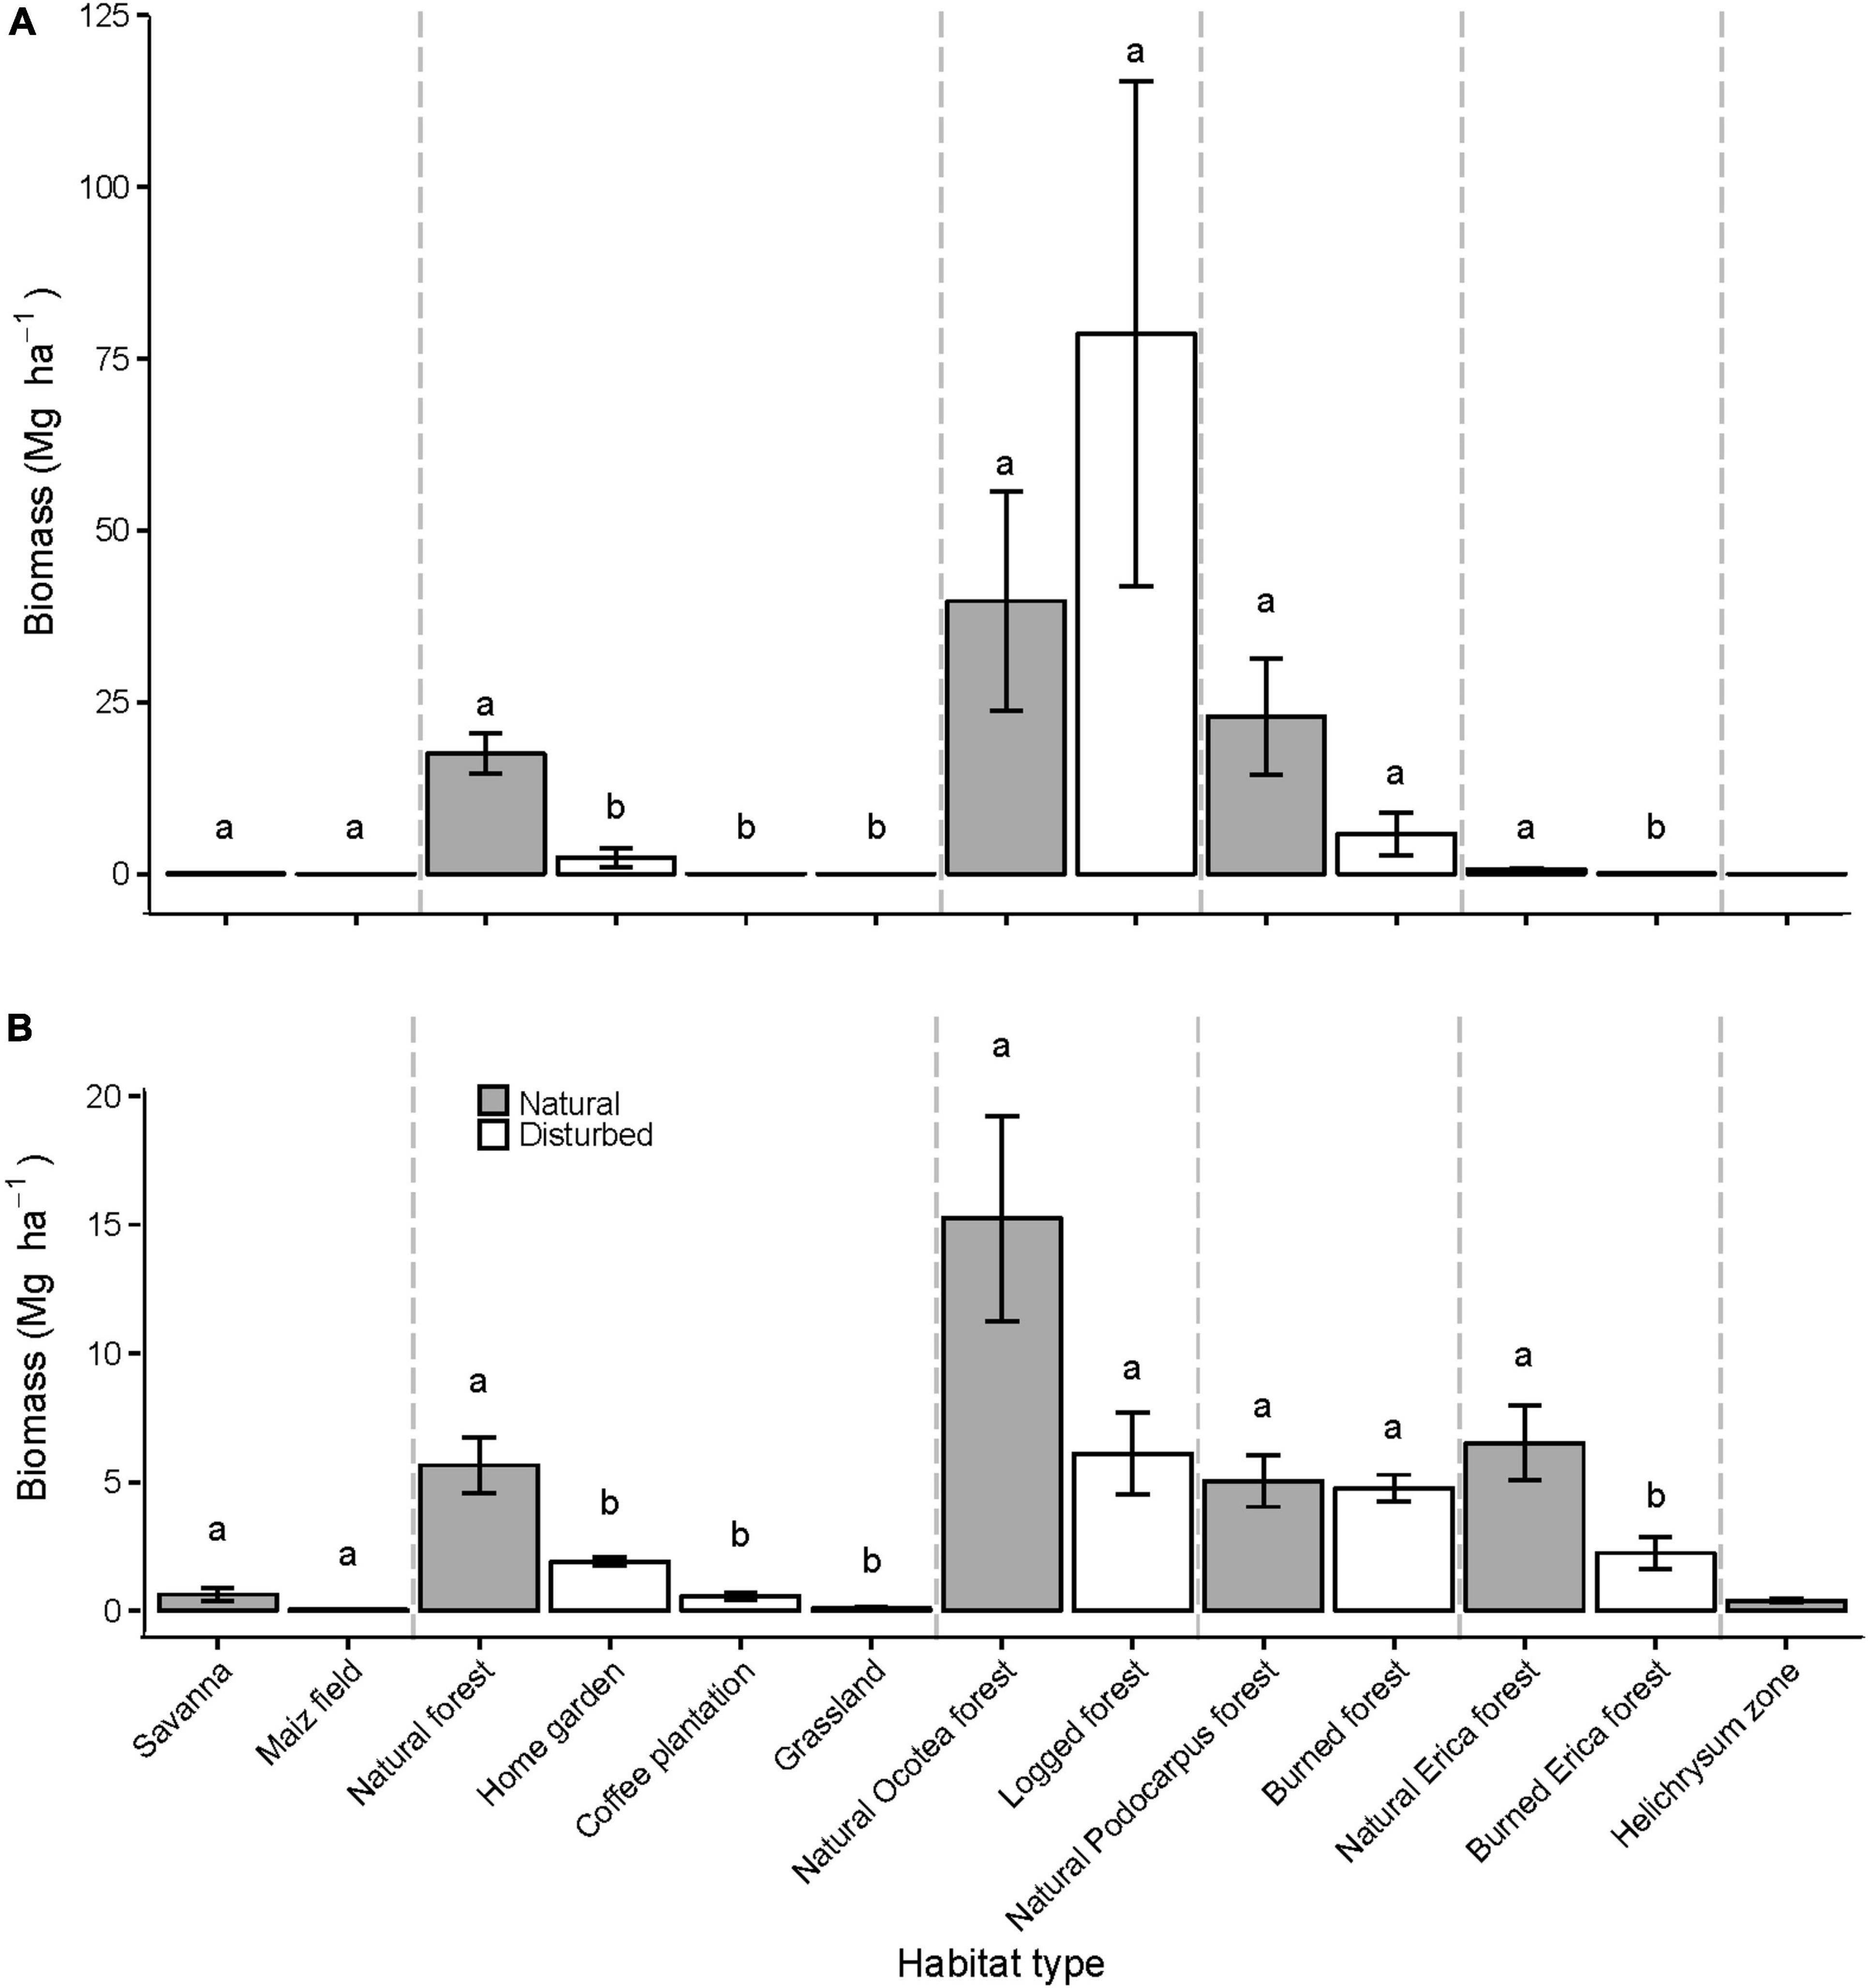
Figure 5. Aboveground deadwood biomass in 13 different habitat types. Bars indicate mean ± SE CWD (A) and FWD (B) biomass per plot type (each based on five replicate plots, except for coffee plantations which were represented with six plots). Gray bars indicate natural habitat types; white bars indicate plots that experienced some kind of disturbance. Dashed gray lines separate different elevation zones (savanna, lower montane, montane, upper montane, and subalpine alpine zones from left to right). Bars not sharing a letter are significantly different from each other at the P < 0.05 level.
Wood density, C and N content and C/N-Ratio did not differ between CWD samples from natural and disturbed plots.
Differences with regard to deadwood composition were only significant in the lower montane zone. Natural forests harbored more log biomass than homegardens (P < 0.01), coffee plantations (P < 0.01) and grasslands (P < 0.01), and more stump biomass than coffee plantations (P = 0.03) and grasslands (P = 0.04). Furthermore, natural forests also harbored more wood of decomposition class 3 than coffee plantations (P < 0.01) and grasslands (P = 0.01) and more wood of decomposition class 4 than coffee plantations (P = 0.02), grasslands (P = 0.03) and homegardens (P = 0.04) (Supplementary Table 2).
Discussion
Wood Properties Across Elevation and Decomposition Stages
Martin et al. (2021) calculated an average dead wood C content of 47.16% (ranging from 38.66 to 55.66%) for tropical trees globally. This value is lower than what we found on Kilimanjaro (48.57%, ranging from 40.67 to 51.44%). Many studies investigating the C pool of deadwood used such average generalized values for wood C content (e.g., Delaney et al., 1997; Davis et al., 2003; Sierra et al., 2007). In our study, we showed that the C content in CWD samples along the elevation gradient of Kilimanjaro significantly increased (Figure 2), although this increase in C was also affected by changes in wood densities of different decomposition classes (see also Merganičová and Merganič, 2010). Since temperature decreases linerarly with increasing altitude, tropical natural elevation gradients may be used as real-world laboratories to assess the impact of rising mean annual temperature (MAT) on the function and structure of tropical forests (Malhi et al., 2010). Our results indicate that climatic factors of the wood sample’s origin, such as temperature, may influence its C content suggesting that deadwood C content decreases with increasing MAT. Hishinuma et al. (2015) conducted a detailed analysis of the chemical composition of CWD originating from sites with different climatic conditions. They found that samples from a subalpine environment had a higher lignin content than samples from subtropical environments, while cellulose and hemicellulose contents did not differ strongly (Hishinuma et al., 2015). This may support our findings that deadwood in higher or colder environments contains a higher proportion of C than deadwood from warmer or lower environments, since C is a major compound of lignin. Slower growth and the need to build more resistant tissues (with higher lignin content) in harsh and cold environments may be a possible explanation for these findings. However, a study from the Swiss Alps did not reveal any change in deadwood C content along an elevation gradient of 800 m (corresponding to a ∼6.2°C change; Petrillo et al., 2016).
Other studies showed that species-specific wood C content can vary substantially among tropical trees (Martin and Thomas, 2011) and that taxonomic division also explained a significant proportion of the variability in deadwood C content, with gymnosperm deadwood have 2.0% higher C content on average than angiosperms (Martin et al., 2021). Since the gymnosperm Podocarpus latifolius and Erica species (E. excelsa and trimera), with their dense lignin-rich wood, start to prevail from the upper montane zone upward and become monodominant at the highest elevations (Hemp, 2006b), this could also explain part of the increase in C content with elevation.
Another possible explanation of this elevational gradient in C content could be the import of soil particles and soluble nutrients into dead wood by soil macrofauna – in particular, termites (Buxton, 1981)—which could reduce dead wood C content through the decomposition process (Martin et al., 2021), primarily in the lower elevations of Kilimanjaro, where termites are widespread.
Wood density decreased by almost 50 % across the decomposition stages (Table 1). This decrease can be explained by the increasing loss of wood structure and has been reported by other studies from both tropical and temperate regions (Iwashita et al., 2013; Petrillo et al., 2016). The strong decrease in wood density we found in this study highlights the importance of considering such changes when calculating C pools, since ignoring them could lead to substantial over- or underestimations of C pools (see also Merganičová and Merganič, 2010; Harmon et al., 2011).
Even though the percentages of both C and N in wood samples increased with decomposition stage, the corresponding C/N ratio decreased although the absolute increment of C content across decomposition was much stronger than the one of N (Table 1). Studies of several forest types also reported increases in deadwood N content with decomposition (Bütler et al., 2007; Iwashita et al., 2013; Petrillo et al., 2016). Increased biological activity could be a plausible explanation. As decay progresses, wood becomes increasingly accessible to different groups of decomposers, such as bacteria, plants and fungi. During wood decay, fungi may retain the N of the original substrate while wood mass decreases (Lambert et al., 1980). At the same time groups of bacteria may fix atmospheric N, while plants and fungi translocate N from the soil to the wood (Sollins et al., 1987; Bütler et al., 2007). In a global study, Martin et al. (2021) found a similar increase in C content with increasing decomposition. Cellulose and hemicellulose generally decompose more rapidly than lignin (Harmon et al., 2013), and lignin has a considerably higher C concentration than cellulose/hemicellulose (Pettersen, 1984); thus, the increase of C content through decomposition may be a function of increasing lignin concentrations (Martin et al., 2021).
Deadwood Biomass and Carbon in Natural Plots Over Elevation and Precipitation
The distributions of both CWD and FWD at Mt. Kilimanjaro were similar to those of live aboveground biomass (Ensslin et al., 2015; Figure 3). Even though CWD and FWD are positively related to MAP (Figure 4), the causation behind this relationship is probably to some degree indirect. Ensslin et al. (2015) showed that live aboveground biomass was strongly related to MAP (R2 = 0.85***). The correlations between CWD and MAP as well as FWD and MAP were much weaker, however, (R2 = 0.60*** and 0.71***, respectively). This indicates that higher precipitation promotes deadwood accumulation at least partly due to increased productivity. Another factor, also related to precipitation, is enhanced tree fall and breaking of branches after heavy rains, when the dense epiphyte loads in the humid montane Ocotea forests become too heavy (Hemp, 2006b).
Dead wood dynamics are governed not only by dead wood accumulation but also by decomposition. Wood decomposition rates were shown to be highly climate-sensitive (Chambers et al., 2000; Bradford et al., 2014; Lustenhouwer et al., 2020), being highest in the tropics (Seibold et al., 2021), and driven by the complex interplay between temperature and precipitation with the decomposer community (Seibold et al., 2021). The most important biotic agents of wood decomposition are microbes (i.e., fungi and bacteria) and insects such as termites and beetles (Bradford et al., 2014; Ulyshen, 2016; Lustenhouwer et al., 2020), but the role of insects varies strongly across the globe (Seibold et al., 2021) as important decomposer groups (e.g., termites) are limited in their geographical distribution (Bradford et al., 2014). At Kilimanjaro termites occur only in the foothills. At a global-scale, decomposition rates and the net effect of insects on decomposition increased with increasing temperature (Seibold et al., 2021). Similar positive relationships with temperature have been reported for the decomposition of non-woody litter (Wall et al., 2008). Using the same research plots on Kilimanjaro that we did, Shen et al. (2020) found that soil bacterial diversity had a U-shaped pattern (mainly influenced by pH) while soil fungal diversity monotonically decreased following the temperature gradient. Two plots of our study (SAV4 and FLM3) were part of the above-mentioned global study of Seibold et al. (2021). Decomposition in the savanna, where termites played an important role and mean annual temperature was 23.9°C, was higher with an annual mass loss (i.e., decomposition rate) of 21%t, whereas decomposition rate in the lower montane forest with a mean annual temperature of 16.5°C was 16%. In summary, these combined effects of climate and decomposer communities could be another reason for the observed hump-shaped pattern in deadwood stock along the elevation gradient of Kilimanjaro with maxima in mid-elevations.
In savanna woodlands, CWD was mostly absent even from natural plots. Besides the high decomposition rate, the reason for this could be that grasses and shrubs dominate this zone and trees with a diameter > 10 cm are scarce. Frequent fire occurrence and grazing by large mammals have been shown to favor the expansion of grasses at the expense of woody species in East African savannas (Gurevitch et al., 2006). Hence, the amount of live biomass is not very high and is mainly comprised of shrubs and non-woody plants, which were beyond the scope of this study. However, local people enter the plots to collect deadwood as firewood. Therefore, the deadwood quantities for natural savanna plots without any human influence could be higher than in this study.
The quantity of total deadwood we observed in the lower montane forests was only about half of the total amount observed in undisturbed tropical lower montane moist forests in Venezuela (Delaney et al., 1997), but similar to the mean amount of deadwood in tropical premontane moist primary forests in Colombia (Sierra et al., 2007). The corresponding live tree biomass quantities were similar in plots of the Venezuelan and our study sites, but considerably lower at the Colombian plots. As in the savanna, deadwood might have been underestimated in this zone, due to its accessible location near local Chagga settlements. Even though this zone belongs to the national park, local people are allowed to collect firewood for cooking. However, they are not allowed to fell live trees, which probably leads to a discrepancy between the real natural stage of live and deadwood components in this zone.
In the montane zone, natural forests harbored considerably more CWD and FWD than the lower montane zone. Here, natural forests contained the highest amount of deadwood across the elevation gradient of Mt. Kilimanjaro. Huge trees like O. usambarensis grow in this zone and provide large amounts of biomass. The largest O. usamberensis snag in a plot of the montane zone was estimated to harbor ∼17 Mg of deadwood. However, such huge individuals were sparsely scattered and not present in all plots of the montane zone, which partly explains the large variability in CWD content among the plots of this zone (SD of 82.3 Mg ha–1). Nevertheless, compared with the total amount of deadwood of undisturbed tropical montane wet forests in Venezuela (Delaney et al., 1997), deadwood (CWD and FWD) appears to be a much more important component at Mt. Kilimanjaro (1.4–5.9% vs. 2.8–29.1% of total aboveground woody biomass, respectively).
In the upper montane zone, both CWD and FWD declined again. To our knowledge there are no other studies that investigated deadwood in similar climatic zones (upper montane wet tropical forest). However, compared to the range of CWD C in other tropical moist forests [14.7–25.4 Mg C ha–1; (Clark et al., 2002; Raich et al., 2006; Iwashita et al., 2013)], the CWD C pool of this zone is rather low.
In the subalpine zone, where 10–15 m high Erica trimera individuals dominate the remaining forest patches, CWD and FWD decreased further. CWD dropped to very low levels because trees hardly produced stems with diameters > 10 cm. We are not aware of other studies that quantitatively measured deadwood in tropical subalpine forests up to 4000 m.
In the alpine zone, CWD was completely absent and FWD also reached very low levels. Only few woody shrubs, such as E. trimera agg or Euryops dacrydioides contributed to the total deadwood pool and vegetation in general is rather scarce at this elevation.
Impacts of Land Use and Disturbance History on Deadwood
In the savanna zone, deadwood pools did not differ between natural plots and maize fields. This result was unexpected, since live tree biomass was significantly higher in natural plots than in maize fields (Ensslin et al., 2015). A very likely explanation is that people have gathered deadwood in our natural plots, probably for several decades. Human populations can reach high densities in this zone and local people rely heavily on wood as the only source of fuel (Mollel et al., 2017).
Even though people enter natural forest plots in the lower montane zone to collect deadwood, these plots harbored significantly more deadwood than homegardens, coffee plantations, and grasslands. The mean amount of total deadwood in this forest type lies within the range found in other tropical moist forests [14.7–25.4 Mg C ha–1; Iwashita et al. (2013)].
Home gardens of local Chagga people contain some trees for shade, timber, and fruit provision (Hemp, 2006c), but all deadwood is immediately used as firewood. Therefore, both, CWD and FWD pools were small in homegardens. Commercial coffee plantations are managed monocultures with a tree cover of 10–30%. Few small twigs were the only source of deadwood. Most likely these plots are immediately cleaned up whenever deadwood appears, which would explain the low measured deadwood pool in this zone. Grasslands did not harbor any deadwood at all. This land-use type is maintained by frequent cutting of the herb layer for the provision of fodder (Mollel et al., 2017). Therefore, trees and shrubs are mainly absent.
In the montane zone, the CWD biomass of previously logged forests was twice as high as that of undisturbed forests. However, this difference was not statistically significant. The opposite pattern was observed for FWD; which occurred at more than double the rate in undisturbed forests than in logged forests (this was not statistically significant either). Strong increases in deadwood pools after logging were reported in many other studies (Gerwing, 2002; Keller et al., 2004; Feldpausch et al., 2005; Pfeifer et al., 2015). However, the time lags between the actual logging and the deadwood inventory in these studies did not exceed 9 years. In the montane zone of Mt. Kilimanjaro, however, logging has been prohibited since 1984 (Agrawala et al., 2003). Hence, this time span could have been long enough for regrowth to even out the differences in deadwood pools between formerly logged and unlogged forests. This is also supported by Ensslin et al. (2015), who found that live aboveground biomass did not differ significantly between logged and non-logged plots. Furthermore, Gourlet-Fleury et al. (2013) found that tropical forests in the Central African Republic fully recovered 24 years after logging. The reason for this higher amount of CWD in disturbed forests could be the growth habit of the dominant tree Ocotea usambarensis. After the cutting of large individuals, the stumps start to resprout resulting in several stems originating from one stump. Only a few of these stems survive, in particular the most erect ones, whereas most others with partly distinct inclination die after some decades. This resprouting is also reflected by a higher stem density in logged versus non- logged plots (Rutten et al., 2015a).
In the upper-montane zone, we did not find significant differences in CWD or FWD pools between undisturbed and formerly burned plots. This is at a first glance somewhat surprising, since burning has strongly changed species composition and forest structure (Hemp and Beck, 2001; Hemp, 2006b; Rutten et al., 2015b) at this altitude. Undisturbed upper montane Podocarpus forests have an upper canopy, which is 2–3 times taller than that of formerly (50 years ago) burnt E. excelsa succession stages. However, such E. excelsa forests consist of three times the number of stems, with this equalling the woody biomass of undisturbed forests (Hemp, unpublished data).
In the subalpine zone, undisturbed plots harbored significantly more CWD and FWD than plots, which have experienced burning in the past. Burning probably removed most of the woody biomass, dead or alive, and fires occurring with a high frequency degraded former Erica forests to shrublands (Hemp, 2005a). These anthropogenic activities affecting deadwood pools result also in the alteration of C and nutrient cycling by affecting microbial activities and enzymes catalytic properties in the soils of Kilimanjaro (Ndossi et al., 2020).
Conclusion
In this study, we showed that deadwood is an important structural component of different forest types at Mt. Kilimanjaro. We found that among our study sites, deadwood can account for up to 37.2 % of the total aboveground woody biomass and therefore also plays a considerable role in C sequestration. For this reason, we suggest that it should be considered in future programs for the reduction of emissions due to deforestation and degradation (REDD+; Burgess et al., 2010).
C content in wood samples increased with altitude at Mt. Kilimanjaro, suggesting that differences in climatic conditions in combination with shifts in species composition along environmental gradients influence the carbon pool of deadwood in tropical forests. Deadwood accumulation strongly followed the hump shaped relationship between elevation and live wood biomass accumulation with a peak at mid-elevations driven by the local precipitation scheme.
The combined effects of climate and decomposer communities on decomposition rates could be another reason for the observed hump-shaped pattern in deadwood stock along the elevation gradient of Mt. Kilimanjaro. We also found that anthropogenic land-use intensification at low to mid-elevations strongly reduced deadwood pools. Past selective logging in the montane zone slightly promoted the accumulation of CWD even after more than 30 years of recovery time and frequent fires in the subalpine zone removed most deadwood and degraded former forests into shrublands with only little woody biomass.
Deadwood remains a poorly understood, yet important, component of tropical forests and quantitative data sets are still rare. With this study we showed how deadwood accumulation and composition can depend on natural and man-made environmental gradients at Mt. Kilimanjaro. Further research, especially in the tropics, is needed to reach a more comprehensive understanding of the underlying drivers and role of dead woody biomass.
Data Availability Statement
The raw data supporting the conclusions of this article will be made available by the authors, without undue reservation.
Author Contributions
AK: writing, fieldwork, and analysis. AE: analysis. AH: fieldwork. MK: organization and supervision. All authors contributed to the article and approved the submitted version.
Funding
This study was supported by the Swiss National Science Foundation (SNSF), German Research Foundation (DFG), and Oeschger Center for Climate Change Research (OCCR).
Conflict of Interest
The authors declare that the research was conducted in the absence of any commercial or financial relationships that could be construed as a potential conflict of interest.
Publisher’s Note
All claims expressed in this article are solely those of the authors and do not necessarily represent those of their affiliated organizations, or those of the publisher, the editors and the reviewers. Any product that may be evaluated in this article, or claim that may be made by its manufacturer, is not guaranteed or endorsed by the publisher.
Acknowledgments
We thank M. Renner and B. Charles for their help during the field work, D. Fischer for introduction to, and assistance with, the C/N- analyses, D. Prati for statistical advice, and G. Prescott for linguistic advice.
Supplementary Material
The Supplementary Material for this article can be found online at: https://www.frontiersin.org/articles/10.3389/fevo.2021.732092/full#supplementary-material
Footnotes
References
Agrawala, S., Moehner, A., Hemp, A., van Aalst, M., Hitz, S., Smith, J., et al. (2003). Development and Climate Change in Tanzania: Focus on Mount Kilimanjaro. Paris: Organisation for Economic Co-operation and Development (OECD).
Appelhans, T., Mwangomo, E., Otte, I., Detsch, F., Nauss, T., and Hemp, A. (2014). Monthly and Annual Climate Data Averaged from 2011 to 2013 for 79 Research Plots on the Southern Slopes of Mt. Kilimanjaro - V 1.1 [Data set]. Zenodo doi: 10.5281/zenodo.12222
Baccini, A., Walker, W., Carvalho, L., Farina, M., Sulla-Menashe, D., and Houghton, R. A. (2017). Tropical forests are a net carbon source based on aboveground measurements of gain and loss. Science 358, 230–234. doi: 10.1126/science.aam5962
Baker, T. R., Coronado, E. N. H., Phillips, O. L., Martin, J., van der Heijden, G. M. F., Garcia, M., et al. (2007). Low stocks of coarse woody debris in a southwest Amazonian forest. Oecologia 152, 495–504. doi: 10.1007/s00442-007-0667-5
Battaglia, L. L., Sharitz, R. R., and Minchin, P. R. (1999). Patterns of seedling and overstory composition along a gradient of hurricane disturbance in an old-growth bottomland hardwood community. Can. J. For. Res. Rev. Can. Rech. For. 29, 144–156. doi: 10.1139/x98-187
Bobiec, A., Gutowski, J. M., Laudenslayer, W. F., Pawlaczyk, P., and Zub, K. (2005). The Afterlife of a Tree. Warsaw: WWF Poland.
Bonan, G. B. (2008). Forests and climate change: forcings, feedbacks, and the climate benefits of forests. Science 320, 1444–1449. doi: 10.1126/science.1155121
Bradford, M. A., Warren, R. J., Baldrian, P., Crowther, T. W., Maynard, D. S., Oldfield, E. E., et al. (2014). Climate fails to predict wood decomposition at regional scales. Nat. Clim. Chang. 4, 625–630. doi: 10.1038/nclimate2251
Brown, S. (2002). Measuring carbon in forests: current status and future challenges. Environ. Pollut. 116, 363–372. doi: 10.1016/s0269-7491(01)00212-3
Burgess, N. D., Bahane, B., Clairs, T., Danielsen, F., Dalsgaard, S., Funder, M., et al. (2010). Getting ready for REDD+ in Tanzania: a case study of progress and challenges. Oryx 44, 339–351. doi: 10.1017/S0030605310000554
Bütler, R., Patty, L., Le Bayon, R.-C., Guenat, C., and Schlaepfer, R. (2007). Log decay of Picea abies in the Swiss Jura Mountains of central Europe. For. Ecol. Manage. 242, 791–799. doi: 10.1016/j.foreco.2007.02.017
Buxton, R. D. (1981). Termites and the turnover of dead wood in an arid tropical environment. Oecologia 51, 379–384. doi: 10.1007/BF00540909
Chambers, J. Q., Higuchi, N., Schimel, J. P. J., Ferreira, L. V., and Melack, J. M. (2000). Decomposition and carbon cycling of dead trees in tropical forests of the central Amazon. Oecologia 122, 380–388. doi: 10.1007/s004420050044
Chave, J., Andalo, C., Brown, S., Cairns, M. A., Chambers, J. Q., Eamus, D. et al. (2005). Tree allometry and improved estimation of carbon stocks and balance in tropical forests. Oecologia 145, 87–99. doi: 10.1007/s00442-005-0100-x
Clark, D. B., Clark, D. A., Brown, S., Oberbauer, S. F., and Veldkamp, E. (2002). Stocks and flows of coarse woody debris across a tropical rain forest nutrient and topography gradient. For. Ecol. Manage. 164, 237–248. doi: 10.1016/S0378-1127(01)00597-7
Davis, M. R., Allen, R. B., and Clinton, P. W. (2003). Carbon storage along a stand development sequence in a New Zealand Nothofagus forest. For. Ecol. Manage. 177, 313–321. doi: 10.1016/S0378-1127(02)00333-X
Delaney, M., Brown, S., Lugo, A. E., TorresLezama, A., and Quintero, N. B. (1997). The distribution of organic carbon in major components of forests located in five life zones of Venezuela. J. Trop. Ecol. 13, 697–708. doi: 10.1017/S0266467400010877
Ensslin, A., Rutten, G., Pommer, U., Zimmermann, R., Hemp, A., and Fischer, M. (2015). Effects of elevation and land use on the biomass of trees, shrubs and herbs at Mount Kilimanjaro. Ecosphere 6:art45. doi: 10.1890/ES14-00492.1
Feldpausch, T. R., Jirka, S., Passos, C. A. M., Jasper, F., and Riha, S. J. (2005). When big trees fall: damage and carbon export by reduced impact logging in southern Amazonia. For. Ecol. Manage. 219, 199–215. doi: 10.1016/j.foreco.2005.09.003
Fravolini, G., Egli, M., Derungs, C., Cherubini, P., Ascher-Jenull, J., Gómez-Brandón, M., et al. (2016). Soil attributes and microclimate are important drivers of initial deadwood decay in sub-alpine Norway spruce forests. Sci. Total Environ. 569–570, 1064–1076. doi: 10.1016/j.scitotenv.2016.06.167
Friedlingstein, P., Jones, M. W., O’Sullivan, M., Andrew, R. M., Hauck, J., Peters, G. P., et al. (2019). Global carbon budget. Earth Syst. Sci. Data 11, 1783–1838. doi: 10.5194/essd-11-1783-2019
Gale, N. (2000). The aftermath of tree death: coarse woody debris and the topography in four tropical rain forests. Can. J. For. Res. Rev. Can. Rech. For. 30, 1489–1493. doi: 10.1139/x00-071
Gerwing, J. J. (2002). Degradation of forests through logging and fire in the eastern Brazilian Amazon. For. Ecol. Manage. 157, 131–141. doi: 10.1016/S0378-1127(00)00644-7
Gourlet-Fleury, S., Mortier, F., Fayolle, A., Baya, F., Ouédraogo, D., Bénédet, F., et al. (2013). Tropical forest recovery from logging: a 24 year silvicultural experiment from Central Africa. Phil. Trans. R. Soc. 368:20120302. doi: 10.1098/rstb.2012.0302
Gurevitch, J., Scheiner, S. M., and Fox, G. A. (2006). The Ecology of Plants. Sunderland, MA: Sinauer Associates, Inc.
Harmon, M. E., and Hua, C. (1991). Coarse Woody debris dynamics in two old-growth ecosystems. BioScience 41, 604–610.
Harmon, M. E., and Sexton, J. (1996). Guidelines for Measurements of Woody Detritus in Forest Ecosystems. Seattle, WA: University of Washington, 73.
Harmon, M. E., Fasth, B., Woodall, C. W., and Sexton, J. (2013). Carbon concentration of standing and downed woody detritus: effects of tree taxa, decay class, position, and tissue type. For. Ecol. Manag. 291, 259–267. doi: 10.1016/j.foreco.2012.11.046
Harmon, M. E., Franklin, J. F., Swanson, F. J., Sollins, P., Gregory, S. V., Lattin, J. D., et al. (1986). “Ecology of coarse woody debris in temperate ecosystems,” in Advances in Ecological Research, Vol. 15, eds A. MacFadyen and E. D. Ford (Cambridge, MA: Academic Press), 133–302. doi: 10.1016/S0065-2504(08)60121-X
Harmon, M. E., Krankina, O. N., and Sexton, J. (2011). Decomposition vectors: a new approach to estimating woody detritus decomposition dynamics. Can. J. For. Res. 30, 76–84. doi: 10.1139/x99-187
Harmon, M. E., Whigham, D. F., Sexton, J., and Olmsted, I. (1995). Decomposition and mass of woody detritus in the dry tropical forests of the northeastern Yucatan Peninsula, Mexico. Biotropica 27, 305–316.
Hemp, A. (2005a). The Impact of Fire on Diversity, Structure, and Composition of the Vegetation on Mt. Kilimanjaro. Boca Raton, FL: CRC Press-Taylor & Francis Group. doi: 10.2307/2388916
Hemp, A. (2005b). Climate change driven forest fires marginalizes the ice cap wasting on Mt. Kilimanjaro. Glob. Chang. Biol. 11, 1013–1023. doi: 10.1201/9781420002874-4
Hemp, A. (2006a). Continuum or zonation? Altitudinal gradients in the forest vegetation of Mt. Kilimanjaro. Plant Ecol. 184, 27–42. doi: 10.1111/j.1365-2486.2005.00968.x
Hemp, A. (2006b). Vegetation of Kilimanjaro: hidden endemics and missing bamboo. Afr. J. Ecol. 44, 305–328. doi: 10.1007/s11258-005-9049-4
Hemp, A. (2006c). The banana forests of Kilimanjaro. Biodiversity and conservation of the agroforestry system of the Chagga Homegardens. Biodivers. Conserv. 15, 1193–1217. doi: 10.1111/j.1365-2028.2006.00679.x
Hemp, A., and Beck, E. (2001). Erica excelsa as a component of Mt. Kilimanjaro’s forests. Phytocoenologia 31, 449–475. doi: 10.1007/s10531-004-8230-8
Hemp, A., and Hemp, C. (2018). Broken bridges. The isolation of Kilimanjaro’s ecosystem. Glob. Chang. Biol. 24, 3499–3507. doi: 10.1111/gcb.14078
Hemp, A., Zimmermann, R., Remmele, S., Pommer, U., Berauer, B., Hemp, C., et al. (2017). Africa’s highest mountain harbours Africa’s tallest trees. Biodivers. Conserv. 26, 103–113.
Hishinuma, T., Osono, T., Fukasawa, Y., Azuma, J. I., and Takeda, H. (2015). Application of C-13 NMR spectroscopy to characterize organic chemical components of decomposing coarse woody debris from different climatic regions. Ann. For. Res. 58, 3–13.
Iwashita, D. K., Litton, C. M., and Giardina, C. P. (2013). Coarse woody debris carbon storage across a mean annual temperature gradient in tropical montane wet forest. For. Ecol. Manage. 291, 336–343. doi: 10.1111/gcb.12636
Keller, M., Palace, M., Asner, G. P., Pereira, R., and Silva, J. N. M. (2004). Coarse woody debris in undisturbed and logged forests in the eastern Brazilian Amazon. Glob. Chang. Biol. 10, 784–795. doi: 10.15287/afr.2015.356
Lambert, R. L., Lang, G. E., and Reiners, W. A. (1980). Loss of mass and chemical change in decaying boles of a subalpine balsam fir forest. Ecology 61, 1460–1473. doi: 10.1016/j.foreco.2012.11.043
Lustenhouwer, N., Maynard, D. S., Bradford, M. A., Lindner, D. L., Oberle, B., Zanne, A. E., et al. (2020). A trait-based understanding of wood decomposition by fungi. Proc. Natl. Acad. Sci. U.S.A. 117, 11551–11558. doi: 10.1073/pnas.1909166117
Malhi, Y., Silman, M., Salinas, N., Bush, M., Meir, P., and Saatchi, S. (2010). Introduction: elevation gradients in the tropics: laboratories for ecosystem ecology and global change research. Glob. Chang. Biol. 16, 3171–3175. doi: 10.2307/1939054
Martin, A. R., Domke, G. M., Doraisami, M., and Thomas, S. C. (2021). Carbon fractions in the world’s dead wood. Nat. Commun. 12:889. doi: 10.1038/s41467-021-21149-9
Martin, A. R., and Thomas, S. C. (2011). A reassessment of carbon content in tropical trees. PloS one 6:e23533. doi: 10.1371/journal.pone.0023533
Merganičová, K., and Merganič, J. (2010). Coarse woody debris carbon stocks in natural spruce forests of Babia hora. J. For. Sci. 56, 397–405.
Molinas-González, C. R., Castro, J., and Leverkus, A. B. (2017). Deadwood decay in a burnt Mediterranean pine reforestation. Forests 8:158.
Mollel, N. P., Fischer, M., and Hemp, A. (2017). Usable wild plant species in relation to elevation and land use at Mount Kilimanjaro, Tanzania. Alp. Bot. 127, 145–154. doi: 10.17221/11/2010-JFS
Ndossi, E. M., Becker, J. N., Hemp, A., Dippold, M. A., Kuzyakov, Y., and Razavi, B. S. (2020). Effects of land use and elevation on the functional characteristics of soil enzymes at Mt. Kilimanjaro. Eur. J. Soil Biol. 97:103167. doi: 10.1016/j.ejsobi.2020.103167
Pan, Y., Birdsey, R. A., Fang, J., Houghton, R., Kauppi, P. E., Kurz, W. A., et al. (2011). A large and persistent carbon sink in the world’s forests. Science (New York, N.Y.) 333, 988–993. doi: 10.1126/science.1201609
Petrillo, M., Cherubini, P., Sartori, G., Abiven, S., Ascher, J., Bertoldi, D., et al. (2016). Decomposition of Norway spruce and European larch coarse woody debris (CWD) in relation to different elevation and exposure in an Alpine setting. IForest 9, 154–164. doi: 10.1007/s00035-017-0187-9
Pettersen, R. C. (1984). “The chemical composition of wood,” in The Chemistry of Solid Wood, ed. R. Rowell (Washington, DC: American Chemical Society), 57–126.
Pfeifer, M., Lefebvre, V., Turner, E., Cusack, J., Khoo, M., Chey, V. K., et al. (2015). Deadwood biomass: an underestimated carbon stock in degraded tropical forests? Environ. Res. Lett. 10:044019. doi: 10.3832/ifor1591-008
Raich, J. W., Russell, A. E., Kitayama, K., Parton, W. J., and Vitousek, P. M. (2006). Temperature influences carbon accumulation in moist tropical forests. Ecology 87, 76–87. doi: 10.1890/05-0023
Ravindranath, N. H., and Ostwald, M. (2008). Carbon Inventory Methods–Handbook for Grenhouse Gas Inventory, Carbon Mitigation and Roundwood Production Projects. Dordrecht: Springer.
RStudio Team (2020). RStudio: Integrated Development for R. Boston, MA: RStudio, PBC. Available online at: http://www.rstudio.com/
Rutten, G., Ensslin, A., Hemp, A., and Fischer, M. (2015b). Vertical and horizontal vegetation structure across natural and modified habitat types at Mount Kilimanjaro. PLoS One 10:e0138822. doi: 10.1371/journal.pone.0138822
Rutten, G., Ensslin, A., Hemp, A., and Fischer, M. (2015a). Forest structure and composition of previously selectively logged and non-logged montane forests at Kilimanjaro. For. Ecol. Manage. 337, 61–66.
Seibold, S., Rammer, W., Hothorn, T., Seidl, R., Ulyshen, M. D., Lorz, J., et al. (2021). The contribution of insects to global forest deadwood decomposition. Nature 597, 77–81. doi: 10.1038/s41586-021-03740-8
Shen, C., Gunina, A., Luo, Y., Wang, J., He, J.-Z., Kuzyakov, Y., et al. (2020). Contrasting patterns and drivers of soil bacterial and fungal diversity across a mountain gradient. Environ. Microbiol. 22, 3287–3301. doi: 10.1111/1462-2920.15090
Sierra, C. A., del Valle, J. I., Orrego, S. A., Moreno, F. H., Harmon, M. E., Zapata, M., et al. (2007). Total carbon stocks in a tropical forest landscape of the Porce region, Colombia. For. Ecol. Manage. 243, 299–309. doi: 10.1016/j.foreco.2014.10.036
Sippola, A. L., Siitonen, J., and Kallio, R. (1998). Amount and quality of coarse woody debris in natural and managed coniferous forests near the timberline in Finnish Lapland. Scand. J. Forest Res. 13, 204–214.
Sollins, P., Cline, S. P., Verhoeven, T., Sachs, D., and Spycher, G. (1987). Patterns of log decay in old-growth douglas-fir forests. Can. J. For. Res. Rev. Can. Rech. For. 17, 1585–1595. doi: 10.1016/j.foreco.2007.03.026
Spetich, M. A., Shifley, S. R., and Parker, G. R. (1999). Regional distribution and dynamics of coarse woody debris in midwestern old-growth forests. For. Sci. 45, 302–313. doi: 10.1080/02827589809382978
Spies, T. A., Franklin, J. F., and Thomas, T. B. (1988). Coarse woody debris in douglas-fir forests of western Oregon and Washington. Ecology 69, 1689–1702. doi: 10.1139/x87-243
Ulyshen, M. D. (2016). Wood decomposition as influenced by invertebrates. Biol. Rev. 91, 70–85. doi: 10.1111/brv.12158
Keywords: Tanzania, East African mountains, aboveground deadwood accumulation, decomposition, carbon stock, land-use change, tropical montane forest, tropical mountain
Citation: Komposch A, Ensslin A, Fischer M and Hemp A (2022) Aboveground Deadwood Biomass and Composition Along Elevation and Land-Use Gradients at Mount Kilimanjaro. Front. Ecol. Evol. 9:732092. doi: 10.3389/fevo.2021.732092
Received: 28 June 2021; Accepted: 25 November 2021;
Published: 05 January 2022.
Edited by:
Jon Fjeldså, University of Copenhagen, DenmarkReviewed by:
Katarina Merganicova, Czech University of Life Sciences Prague, Czechia; Slovak Academy of Sciences, SlovakiaFelix Nchu, Cape Peninsula University of Technology, South Africa
Copyright © 2022 Komposch, Ensslin, Fischer and Hemp. This is an open-access article distributed under the terms of the Creative Commons Attribution License (CC BY). The use, distribution or reproduction in other forums is permitted, provided the original author(s) and the copyright owner(s) are credited and that the original publication in this journal is cited, in accordance with accepted academic practice. No use, distribution or reproduction is permitted which does not comply with these terms.
*Correspondence: Armin Komposch, YXJtaW4ua29tcG9zY2hAaXBzLnVuaWJlLmNo
†Present address: Andreas Ensslin, Conservatory and Botanic Garden of the City of Gevena, Geneva, Switzerland
‡These authors share last authorship