 Martin Streinzer
 Johann Neumayer
 Johannes Spaethe
94% of researchers rate our articles as excellent or good
Learn more about the work of our research integrity team to safeguard the quality of each article we publish.
Find out more
ORIGINAL RESEARCH article
Front. Ecol. Evol. , 09 December 2021
Sec. Behavioral and Evolutionary Ecology
Volume 9 - 2021 | https://doi.org/10.3389/fevo.2021.721241
This article is part of the Research Topic Sensory Ecology of Plant-Pollinator Interactions View all 24 articles
Entomophilous plants have evolved colorful floral displays to attract flower visitors to achieve pollination. Although many insects possess innate preferences for certain colors, the underlying proximate and ultimate causes for this behavior are still not well understood. It has been hypothesized that the floral rewards, e.g., sugar content, of plants belonging to a particular color category correlate with the preference of the flower visitors. However, this hypothesis has been tested only for a subset of plant communities worldwide. Bumble bees are the most important pollinators in alpine environments and show a strong innate preference for (bee) “UV-blue” and “blue” colors. We surveyed plants visited by bumble bees in the subalpine and alpine zones (>1,400 m a.s.l.) of the Austrian Alps and measured nectar reward and spectral reflectance of the flowers. We found that the majority of the 105 plant samples visited by bumble bees fall into the color categories “blue” and “blue-green” of a bee-specific color space. Our study shows that color category is only a weak indicator for nectar reward quantity; and due to the high reward variance within and between categories, we do not consider floral color as a reliable signal for bumble bees in the surveyed habitat. Nevertheless, since mean floral reward quantity differs between categories, naïve bumble bees may benefit from visiting flowers that fall into the innately preferred color category during their first foraging flights.
Flower color is a major trait by which plants convey information about their identity and location to a potential visitor. Color is not an intrinsic property of the flower organ, but rather a psychophysical phenomenon that depends on the visual system of the observer that perceives the reflected light spectrum (Kelber and Osorio, 2010; Skorupski and Chittka, 2011). Bees, one of the major pollinator groups of angiosperms, possess three distinct photoreceptor types in their compound eyes, which are most sensitive in the ultraviolet (UV), blue and green part of the light spectrum and enable them to use trichromatic color vision. The number of different photoreceptors and their sensitivity maxima are phylogenetically conserved among most bees (Peitsch et al., 1992; Briscoe and Chittka, 2001) and their origin predates that of angiosperms (Chittka, 1996).
Color, as other floral traits like scent, shape or size, are used by flower visitors to detect and identify specific plants and thus to associate reward quantity and quality after a visit with a particular floral display. After several visits, pollinators are able to predict the reward probability of a particular flower type in subsequent foraging flights and thus may develop floral (color) preferences based on previous experience. In addition to this learned preference, bees and many other pollinator groups, show an innate preference for certain color(s) or color categories (Giurfa et al., 1995; Lunau and Maier, 1995; Goyret et al., 2008; Streinzer et al., 2019). This preference already exists before any learning took place and is usually overwritten after experience, although it has been shown that bumble bees may revert to their innate preference when confronted with novel floral features (Gumbert, 2000). However, the underlying proximate and ultimate reasons of an innate color preference are currently not well understood. Innate preferences may be adaptive, if they for example allow naïve individuals to better find rewarding food sources as compared to a random search strategy. The preferred flower type may provide a higher reward, an optimal nutritional composition or show a floral morphology that is adapted to the pollinator’s mouthparts and allows an efficient exploitation. Flower-naïve hoverflies (Eristalis tenax), for example, possess an innate preference for yellow and white flowers, and after landing on a flower they reflexively extend their proboscis when confronted with small UV-absorbing yellow spots. This behavior is assumed to help naïve flies to efficiently find and extract the pollen or nectar of a flower (Lunau and Wacht, 1997).
In bees, several species are shown to have strong preferences for “UV-blue”, “blue” and “blue-green” colors in a bee-specific color space (Giurfa et al., 1995; Gumbert, 2000; Raine and Chittka, 2007b; Dyer et al., 2016). In one of the earliest studies, aiming to link the color of flowers with its predictive value for reward, Giurfa et al. (1995) studied flowering plants in a nature reserve in northern Germany. The authors found that flowers, which fall in the above-mentioned bee-color categories, have, on average, higher reward quantities compared to flowers with unattractive colors. However, similar patterns have not been observed in other world regions, e.g., Australia, where the highest rewards were found in color categories like “green” and “UV-green” (Shrestha et al., 2020). Nevertheless, studies on flower communities, which investigated color frequencies and distribution, generally found a non-uniform distribution of flower colors among the different categories. Distributions were found to be remarkably similar across continents, with a maximum of spectral reflection patterns falling in the “blue-green” and “blue” sectors of a bee-specific color space (Chittka et al., 1994; Dyer et al., 2012; Bischoff et al., 2013; Shrestha et al., 2014; Ortiz et al., 2021).
In this study, we measured nectar reward quantity (nectar volume and sugar concentration) and spectral reflectance of the majority of bumble bee visited flowering plants in the Eastern Alps in Europe. At high altitudes, bumble bees (Hymenoptera: Apidae: Bombus Latreille) are the most important pollinators of bee-visited plant species (Bingham et al., 1998). In contrast to the abundant bumble bees, other bee species found in the same habitat (e.g., Apis mellifera, Andrena rogenhoferi, A. lapponica, and Osmia spp.) are less important due to their lower densities at high elevations with harsh weather conditions (Ebmer, 2003). Based on the finding that bumble bees possess an innate preference for particular flower colors (and thus a higher propensity to visit such flowers), we tested whether the preference is reflected in the nectar reward quantity of flowers of these colors and can thus be considered as being adaptive.
All measurements were conducted in the Hohe Tauern National Park located in the main chain of the Eastern Alps in Austria. All sampling sites were located in the subalpine to alpine range between 1,400 and 2,600 m a.s.l. The sites were scattered roughly along the Großglockner panoramic road in the National Park. Experiments were carried out in the years 1994–2020 (nectar measurements: 1994–2020; spectral reflectance measurements: 2006–2020). Research and sampling permits for sites within the National Park core region were issued by the “Land Salzburg” (permit no. 21 301-RI/547/161-2010, to JN).
Plants were either identified in the field or taken to the lab for species-level identification using adequate identification keys. For consistency, all identifications followed the nomenclature by Fischer et al. (2008). Some species could only be identified to the level of a species-group of closely related species, which is indicated by the suffix “agg.” (for aggregate; e.g., Saxifraga oppositifolia agg., Thymus praecox agg.). All sampled species are listed in Supplementary Table 1.
To include only those plant species that are actually used by bumble bees as a nectar source, we used a database containing museum specimens, observations and literature records pertaining to the majority of field observations made on bumble bees in Austria involving over 42,000 flower visitation records collected between 1848 and 2021. A minimum criterion of five databased observations of bumble bee visits for a certain plant species was set, to include the species in the analysis. For high altitude alpine plants for which the observation density is generally lower (e.g., Phyteuma globulariifolium, Saxifraga spp., alpine Salix spp.), we accepted a threshold of three databased records (in N = 5 plant species). All plant species that failed to meet these criteria were removed from the analysis.
Nectar measurements were performed as a series of five measurements during consecutive 2-h intervals, covering the entire day between 7 am and 5 pm CET (7–9 am, 9–11 am, 11 am–1 pm, 1–3 pm, and 3–5 pm). Measurements were only performed on days without precipitation, and with a mean relative humidity below 80% during the day (11 am–4 pm). Since weather conditions are fairly unpredictable in the alpine area, some measurement series were aborted and missing time intervals were completed on the next appropriate day.
For each series, the nectar volume and concentration were measured in at least 10 flowers (5 in rare species), with a maximum of three different flowers measured per individual plant and time interval. Flowers were randomly selected from the plants/inflorescences. In each measurement series, individuals were investigated from the same population. We then calculated the mean reward quantity for each species and time interval. Two different values were used in the analysis. First, we selected the maximum value across the time series. This value relates to the maximum nectar standing crop of flowers that were shielded from visitors for up to 24 h (in the bagged condition), and thus represents a value that is comparable to previous studies (Shrestha et al., 2020). Secondly, we selected the mean value across the time series, which serves as a more realistic standing crop that would, on average, be available for visitors throughout the day.
Open flowers are usually depleted by nectar-seeking visitors. To estimate both the intrinsic nectar production of a flower and the nectar standing crop that is actually available for visitors, we recorded series of measurements from flowers, which were covered to exclude visitors, and from unprotected (“open”) flowers. For the intrinsic nectar production, a white plastic mesh was placed around the flowers and inflorescences in the early morning, before the first flower visitors were active (referred to as “bagged” in the text). A mesh width of 0.8–1.5 mm allowed sufficient airflow to minimize the microclimatic influence of solar radiation, extreme temperatures and humidity, which are known to affect nectar amount and concentration, but excluded all potential visitors (Corbet et al., 1979; Kearns and Inouye, 1993). Nectar measurement series on bagged flowers were carried out in parallel to series on open flowers at the same site and day.
Nectar was extracted from flowers following the protocol of Corbet (2003), with microcapillaries of 5.0 μl (Assistant, Germany), 1.0 μl, 0.5 μl, or 0.2 μl (Drummond, Great Britain) volume. For flowers with several separated nectaries, the nectar from all nectaries was extracted. The length of the liquid column was measured to the nearest 0.5 mm and converted to μl volume. The contained liquid was then expelled onto a hand refractometer suitable for small volumes, and calibrated for concentrations between 0 and 50% sucrose equivalent (Bellingham and Stanley, Great Britain). When a higher nectar concentration was anticipated, the nectar was diluted by dipping the microcapillary into distilled water (Aqua dest.) before the measurement (Corbet, 2003). The nectar volume was then determined before and after dilution, and the ratio was used to calculate the original sugar concentration. For flowers containing very small nectar volumes (<0.05 μl), the nectar was generally diluted with Aqua dest. to allow measurement with the refractometer. Conversion of the volumes was performed as described above. In the first years of the study (1994–2000), measurements on flowers with very small volumes (<0.1 μl) were conducted by pooling the nectar from several flowers. The total volume was then divided by the number of flowers used to reach the threshold volume for measurement with the refractometer. For extremely small nectar volumes (<0.02 μl) concentration measurements failed in a few cases. We then used the average concentration from the other flowers in the same 2 h interval to determine the sugar content of the flower. In open flowers, nectar can concentrate during hot and dry weather conditions. When concentrations exceeded 80%, measurements were excluded from the analysis, since bees do not visit flowers with highly concentrated nectar (own unpublished observations; see also Harder, 1986).
Since both nectar volume and nectar concentration are strongly influenced by ambient conditions, we calculated the amount of sugar in the nectar (Bertsch, 1983). To calculate the total amount of reward per flower, our measurements were converted to mg sucrose equivalent/flower using standard procedures (Cruden and Hermann, 1983; Kearns and Inouye, 1993; Corbet, 2003). In brief, the measured nectar volume was multiplied by the measured sugar concentration. The sugar concentration measured with the refractometer (calibrated for weight:weight concentration) was corrected to the appropriate unit (weight:volume concentration) using a correction factor according to Cruden and Hermann (1983).
Since flowers often form units, e.g., inflorescences, flower baskets or synflorescences consisting of individual inflorescences/baskets (Fischer et al., 2008), we also aimed to quantify the nectar reward of the entire flowering units. We first defined a “flowering unit” from a visual perspective. Each entity that constitutes a separate visual cue during approach was treated as a single unit. Parts of inflorescences which stand far apart, form no continuous unit and which force visitors to fly between, were treated as separate units (e.g., Aconitum degenii and Adenostyles alliariae). For each plant species in our dataset, we counted the number of individual flowers per unit in at least 10 plant individuals and calculated the mean.
Flowers and inflorescences were collected and brought to the lab for spectral measurements. Spectral measurements were performed by measuring a small (c. 5 mm2) area of a given plant organ that was mounted on black insulation tape. All measurements were performed with either a USB2000 spectrometer equipped with a DH2000 BAL light source, or a JAZ spectrometer unit equipped with a pulsed Xenon light source (Ocean Optics, Dunedin, FL, United States). The spectrometers were calibrated against a white standard (WS-1-SL, Ocean Optics). Measurements were performed with a bifurcated fiber optics probe, with the incident and measuring angle set at 45° with respect to the surface normal, following standard protocols (Chittka and Kevan, 2005). A single measurement was performed on each plant individual. For single flowers or unicolored compound inflorescences (e.g., in Knautia, Scabiosa, and Valeriana) we measured the region of the most prominent flower organ, facing the viewing direction of the visitor (usually the upper surface of a petal). For plants with multicolored flowers or inflorescences, e.g., many Asteraceae, we only measured the part of the inflorescence that occupied the majority (>50%) of the surface (usually the upper surface of the petal lips). Since the flowers of dioecious species (Salix sp.) differ in their reward and appearance and are found on different plant individuals, they were treated as independent data points in our analysis. In Trifolium pratense, two distinct color morphs with a general form appearing pink for a human observer, and an alpine form appearing white, were measured and treated as independent data points. In both cases, nectar and color measurements were also performed separately. Several specimens (between 1 and 127, median 3) were measured per species, depending on availability of the flowers.
To estimate how bee visitors perceive the flower color, we used the color hexagon (Chittka, 1992), a bee-specific color space that is widely employed in pollinator studies and has been repeatedly tested in laboratory settings (Chittka et al., 1992; Giurfa et al., 1995; Raine and Chittka, 2005; Théry et al., 2005; Dyer et al., 2008, 2012; Leonard et al., 2011). Color loci were calculated according to standard procedures (Chittka and Kevan, 2005) using standard illumination (D65; Wyszecki and Stiles, 1982) and photoreceptor spectral sensitivity functions specific for Bombus terrestris (Skorupski et al., 2007). Hymenopteran photoreceptor sensitivities are phylogenetically conserved and similar among bee species (Briscoe and Chittka, 2001) and were confirmed to be similar across bumble bee species in particular (Peitsch et al., 1992; Briscoe and Chittka, 2001; Skorupski et al., 2007; Skorupski and Chittka, 2010). We used an average reflection spectrum of green foliage as adaptation background (Chittka and Kevan, 2005). For each measurement, we determined the (absolute) green receptor contrast, the position of the locus in the color space, and the color contrast as the Euclidean distance between the hexagon center and the color locus (Spaethe et al., 2001; Chittka and Kevan, 2005). Brightness, considered as the summed response of all three photoreceptors, is used by bees only during phototactic response (Menzel and Greggers, 1985) and is not regarded as an important spectral feature during foraging (Ng et al., 2018).
Color hue refers to the direction of a locus in the color space and was calculated as the angle between the lines connecting the hexagon center with the blue corner (set as 0°) and the color locus, respectively. Color locus angles are reported as positive values in the clockwise direction with respect to the reference line (see Figure 1A). However, it must be noted that although several studies used angles as a measure for hue, there are no universally accepted standards on how to report it. Different studies used different reference lines and rotation directions (Chittka et al., 1994; Dyer et al., 2012; Shrestha et al., 2014 vs. Tai et al., 2020). For further analysis, the hues (angles) were binned to six categories, which correspond to distinct classes of reflectance functions (Chittka et al., 1994). The categories are referred to as “blue” (B; 330°–30° in the hexagon space), “blue-green” (BG; 30°–90°), “green” (G; 90°–150°), “green-UV” (GU; 150°–210°), “ultraviolet” (UV; 210°–270°), and “UV-blue” (UB; 270°–330°). In addition, we also plotted the hues to a finer scale of 10° bins to make the data comparable to other studies, which used this bin size (e.g., Chittka et al., 1994; Dyer et al., 2012; Shrestha et al., 2014). Flower species with color contrasts < 0.1 hexagon units were assigned as “achromatic” and excluded from further analysis (N = 3 species, see below).
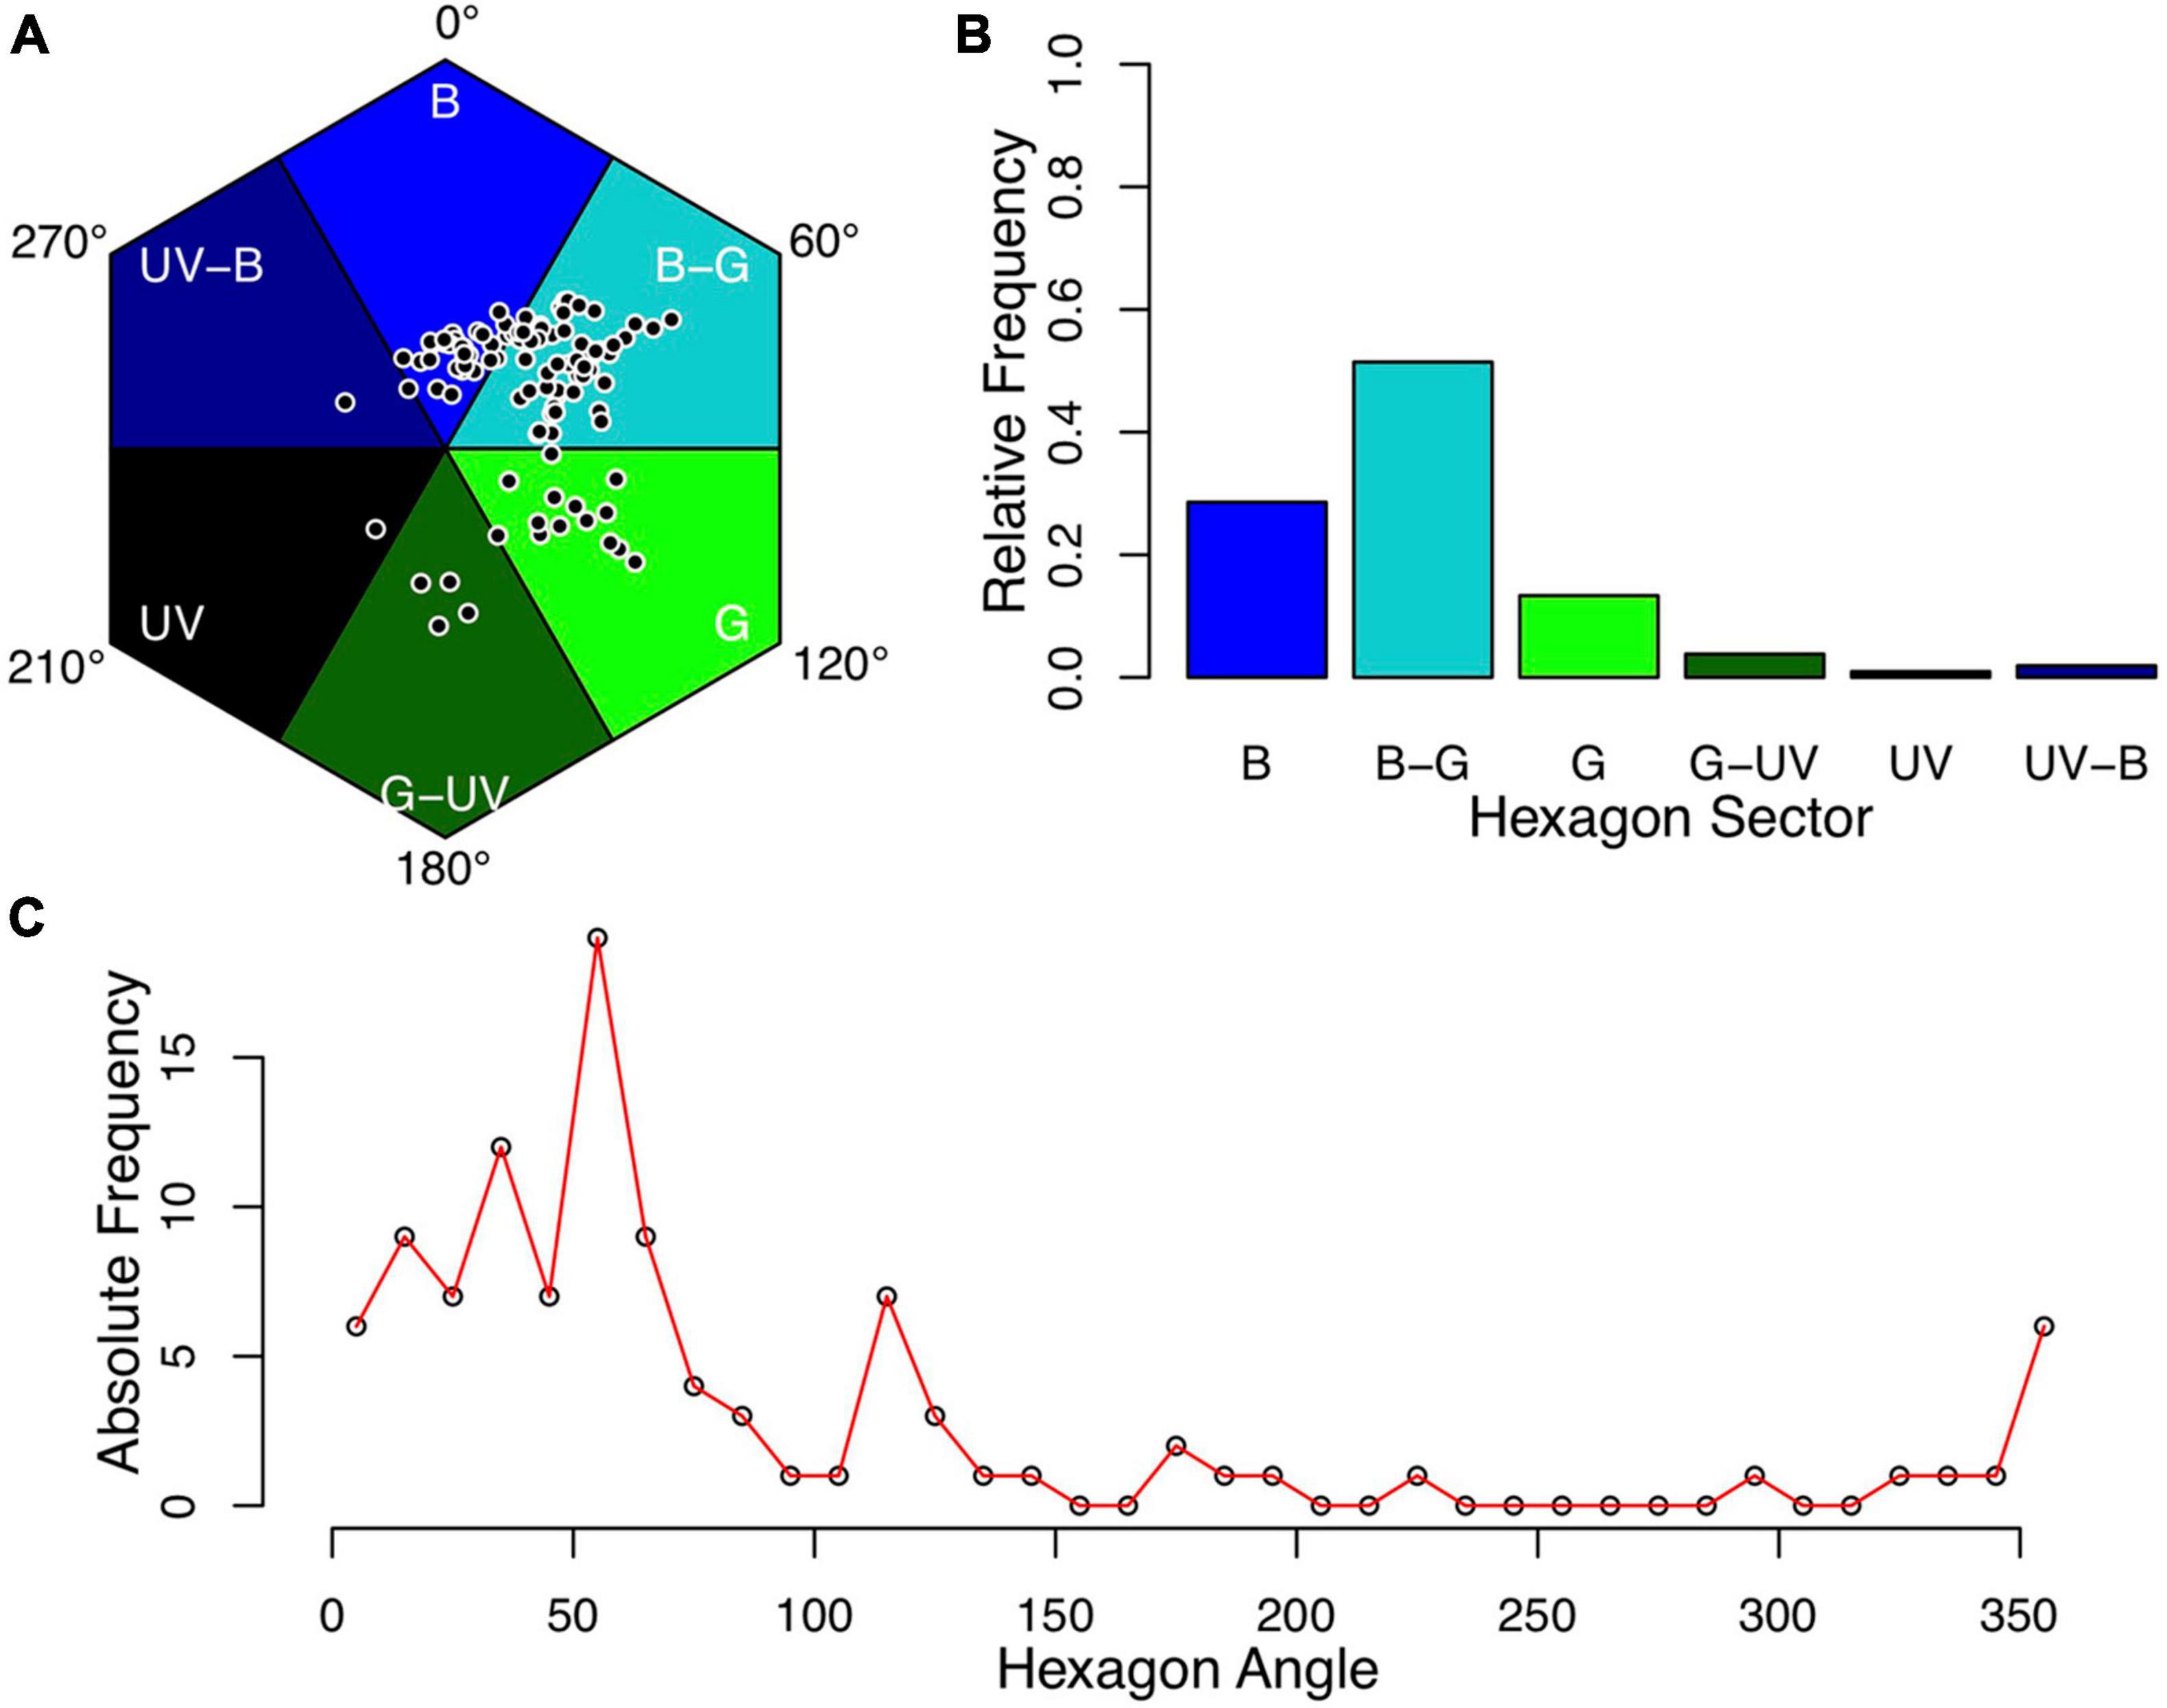
Figure 1. Flower colors of alpine flowering plants. Mean color loci of bumble bee visited plant species for which full nectar data and spectral measurements were available (N = 105). (A) Color loci plotted in the hexagon color space. (B,C) Frequency of samples in color categories at a rough (B) and fine (C) scale (B, blue; B-G, blue-green; G, green; G–U, green-UV; UV, UV; UV-B, UV-blue). Colors assigned to the categories are for illustrative purposes and are not intended to reflect human or bee-specific perception. The convention for hexagon angle measurement is indicated in panel (A).
To test for phylogenetic signal in the color and nectar reward data, we constructed a species-level phylogenetic tree, including all of our studied taxa. We initially used the phylogenetic tree (“ALLOTB” tree) published by Smith and Brown (2018). Tree manipulation was performed in R (version 4.1.1; R Development Core Team, 2021) using the packages “phytools” for R (Version 0.7-80; Revell, 2012), “ape” for R (Version 5.5; Paradis and Schliep, 2019), and “picante” for R (Version 1.8.2; Kembel et al., 2010). The tree was pruned to include only those taxa contained in our dataset. For two taxa which include distinct color morphs (Trifolium pratense) or different sexes (Salix waldsteiniana) of a single species, we introduced a dichotomy with branch length zero. Multitomies in the tree were resolved using the function “multi2di” in the “ape” package. The final tree used in our analysis can be found in the Supplementary Material.
To test whether color traits, number of flowers/inflorescence or nectar reward of the study species show phylogenetic signal, we calculated Pagel’s λ (Pagel, 1999). For continuous traits, λ calculation and significance tests were performed in the “phytools” package. Since the distribution of nectar reward quantities (i.e., sucrose equivalents) was significantly different from a normal distribution (p < 0.05; Shapiro-Wilks test), all values were log10-transformed for the analysis. For color category, λ was calculated using the “fitDiscrete” function in the “geiger” package. Significant difference between the fitted model and the null model (λ = 0.00; no phylogenetic signal) was tested using a log-likelihood ratio test.
To test whether plant species are uniformly distributed among the color categories, we used a Chi-square test, followed by an analysis of the standardized residuals (Sharpe, 2015). To test whether nectar reward quantity differed significantly between color categories, we performed phylogenetic ANOVA using the package “geiger” for R (Version 2.0.7; Pennell et al., 2014), using log10-transformed nectar values as dependent and hexagon color category as independent variable. Our dataset contained a single species in the “UV”-category (Crepis aurea), which was removed prior to the ANOVA. Independent analyses were performed for the maximum and mean nectar reward and for the “open” and “bagged” treatments. Significant results in the omnibus test were followed by a post-hoc test, comparing all possible combinations and adjusting the p-level using the Bonferroni method.
Whether nectar reward quantity differed significantly between “open” and “bagged” flowers was tested using a paired t-test. To test the relationship between nectar reward quantity and visual and other traits we used phylogenetic generalized linear mixed models (PGLMM) with a Gaussian distribution. The model included log10-transformed nectar reward data as response variable, species (both as phylogenetic and non-phylogenetic covariate) as random factor, and color contrast, green contrast, brightness and the number of flowers per inflorescence as continuous covariates. All continuous variables were scaled prior to model preparation to facilitate interpretation of the effect sizes (Schielzeth, 2010). Separate models were calculated for each combination of nectar data (maximum & mean) and treatment (open and bagged). Model calculation was performed using the “pglmm” function in the “phyr” package for R (Version 1.1.0.; Li et al., 2020). All analyses were performed using the base version of R (Version 4.1.1; R Development Core Team, 2021) and the cited packages.
We obtained full nectar (both open and bagged flowers) data and spectral measurements from 108 samples. Three species with color contrasts < 0.1 hexagon units were excluded from further analysis (Pedicularis recutita, Salix hastata female, and Vaccinium myrtillus). The remaining 105 samples constituted 103 unique species with two additional samples from a second color morph (Trifolium pratense) and a second sex of a dioecious species (Salix waldsteiniana).
Of the 112 flowering plant species for which bumble bee visits have been recorded in the study region (local communities of Rauris, Fusch and Heiligenblut above 1,400 m a.s.l.), the analyzed sample comprises 103 species, which accounted for the vast majority (98 %) of all recorded bumble bee visits (N = 4,070) in that region.
The mean color loci of the samples were not distributed uniformly in the color space (Figure 1A), and the distribution of plant colors among the color categories differed significantly from a uniform distribution (N = 105, Chi2 = 125.46, p < 0.05). The majority of samples were found in the “blue-green” category (N = 54), followed by the “blue” category (N = 30; Figure 1B). Analysis of the standardized residuals indicated that the observed frequencies in these two categories are significantly higher than expected by chance, while the categories “UV”, “UV-blue,” and “green-UV” had significantly less observations than expected. Color frequency distribution, when analyzed at a finer scale, showed a pronounced peak at 60°, which corresponds to the central part of the “blue-green” sector in the hexagon (Figure 1). Phylogenetic signal for flower color, calculated as Pagel’s λ was estimated to be λ = 0.87, a value significantly different from λ = 0.00 (p < 0.05; Table 1 and Figure 2).
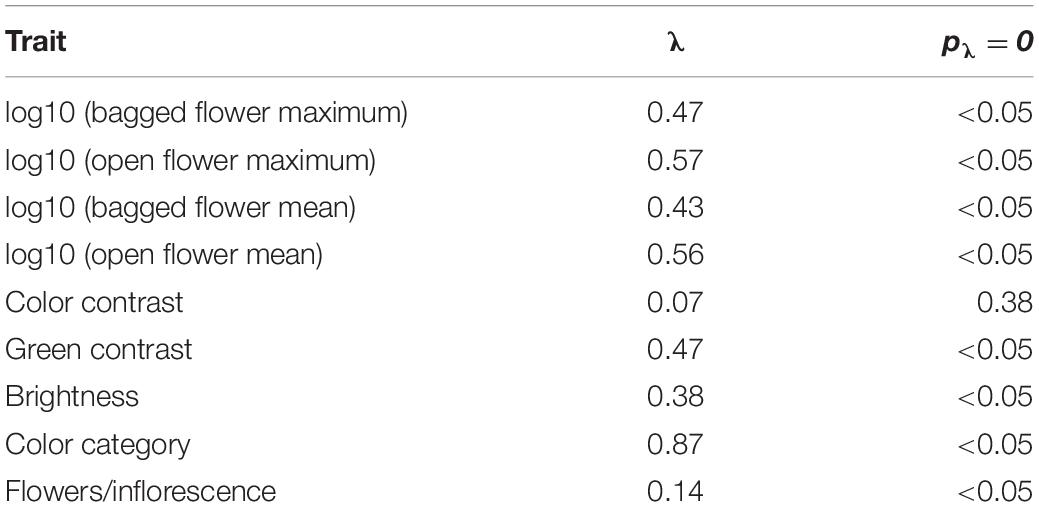
Table 1. Phylogenetic signal for measured traits and rewards in bumble bee visited plant species from the Eastern Alps.
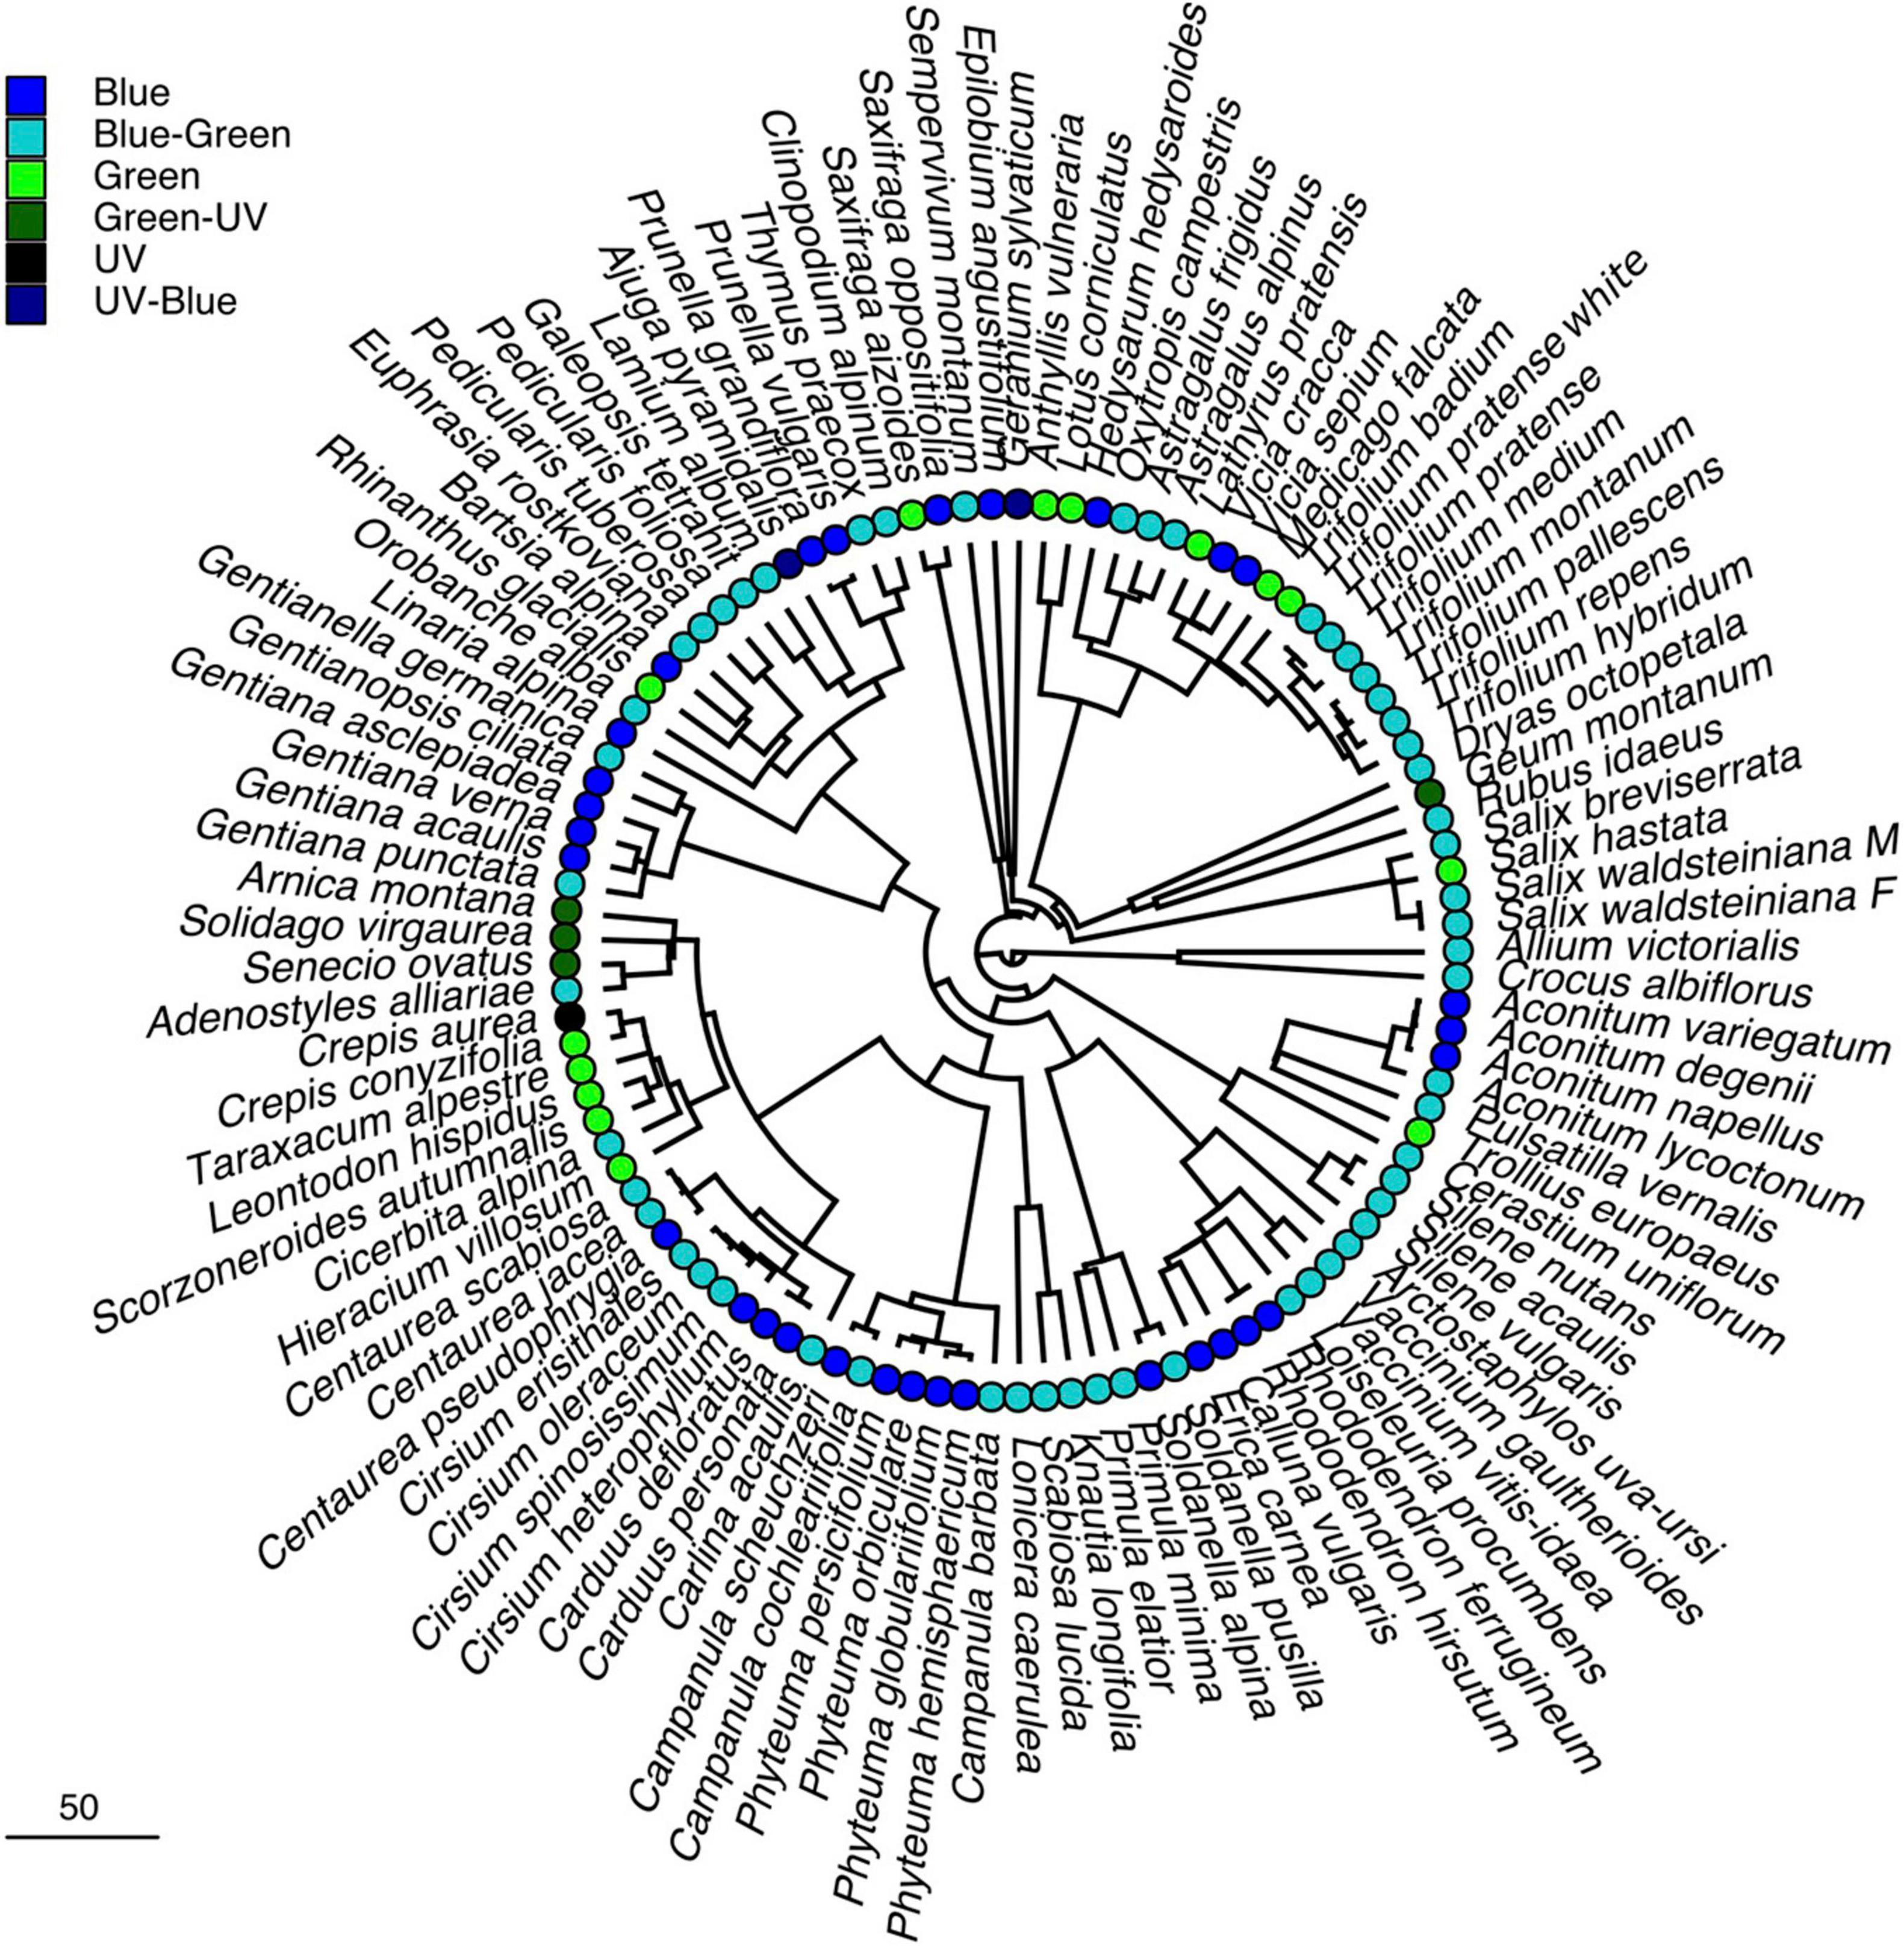
Figure 2. Phylogenetic reconstruction of the studied plant species. Phylogenetic tree of the study species, based on the phylogenetic “ALLOTB” tree by Smith and Brown (2018). Colored circles refer to hexagon color category. Scale bar for branch length indicates divergence time in million years.
Nectar reward quantity (expressed in mg sucrose per flower) varied among species and treatment (Supplementary Table 1). Bagging had a significant effect on the measured reward quantity; flowers shielded from visitors had a significantly higher reward quantity than flowers which could be depleted by visitors (maximum nectar reward: t(104) = 5.57, p < 0.05; mean nectar reward: t(104) = 6.88, p < 0.05). Pagel’s λ for the reward per flowers showed significant phylogenetic signal both in the mean and maximum value and in the “bagged” and “open” treatments (Table 1).
Reward quantity of bagged flowers differed significantly between the color categories for the maximum nectar reward values [Phylogenetic ANOVA: F(4,99) = 3.51, p < 0.05; Figure 3A], but just failed significance for the mean nectar reward values [F(4,99) = 2.94, p = 0.07; Supplementary Figure 1A]. While the individual flowers in the “blue” category had, on average, higher reward quantities than in the other categories, pair-wise post hoc comparison did not identify significant differences between any of the combinations after Bonferroni correction.
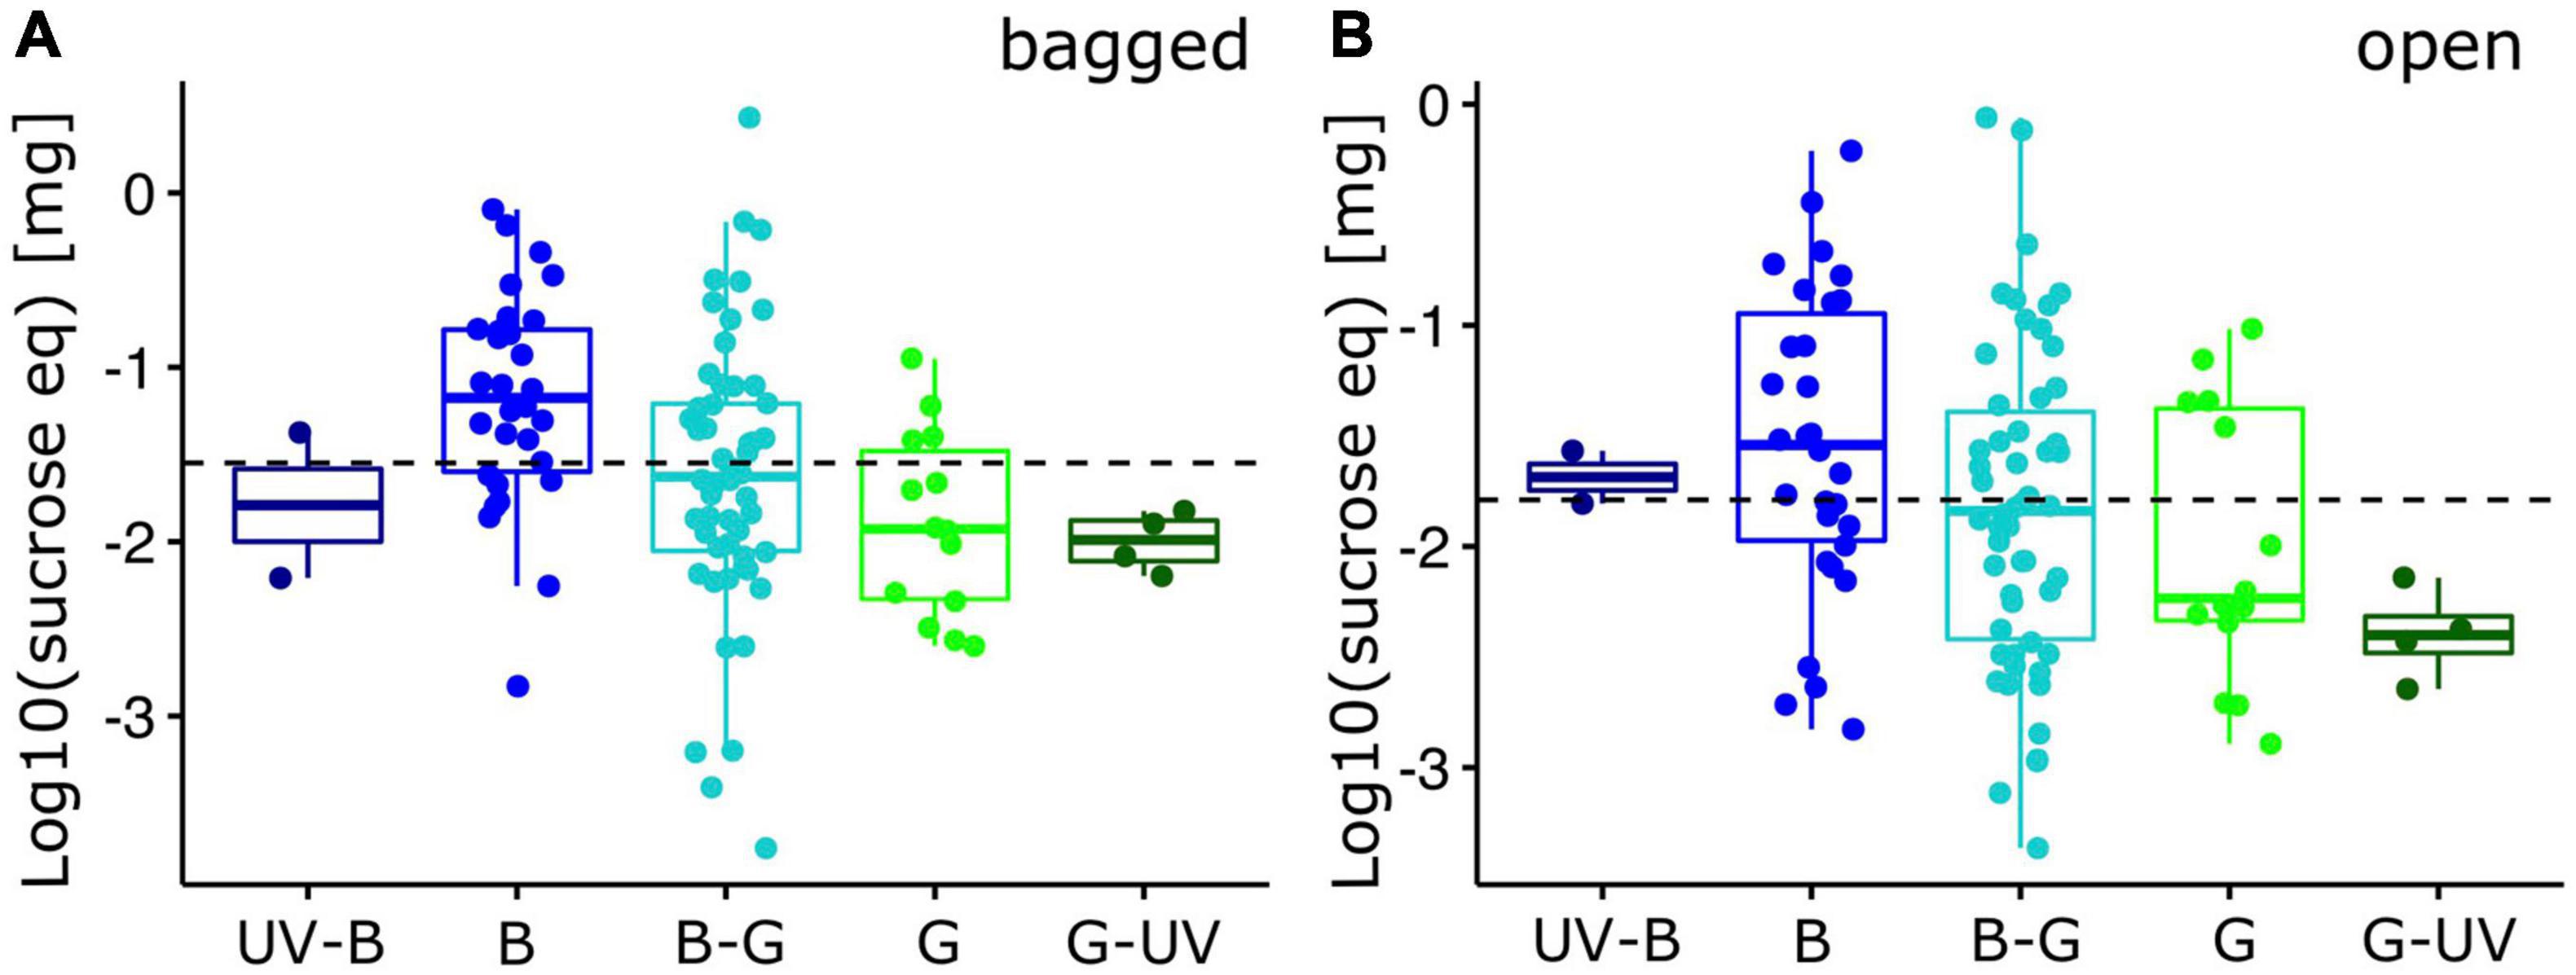
Figure 3. Nectar standing crop of alpine flowering plants (individual flowers). Log10-transformed maximum reward quantity, expressed as mg sucrose equivalent per flower for bumble bee visited plant species (N = 105). Reward quantity was measured for (A) bagged flowers and (B) open flowers. Box-plots indicate the median (line) and interquartile range (IQR, i.e., Q25-Q75; box). Lower and upper whiskers indicate Q25-1.5*IQR and Q75+1.5*IQR, respectively. The horizontal dashed line indicates the overall mean. Individual data points have been added with random X-axis jitter. X-axis categories are the five hexagon categories used in the analysis (see Figure 1; UV-B, UV-blue; B, blue; B-G, blue-green; G, green; G-UV, green-UV). For statistics, see text.
Reward quantities were generally smaller in open flowers. Their distribution across color categories did not differ significantly among categories for the maximum nectar reward values [F(4,99) = 2.18, p = 0.20; Figure 3B] and for the mean nectar reward values [F(4,99) = 2.26, p = 0.18; Supplementary Figure 1B]. When we extrapolated the nectar reward quantity to the entire functional unit (inflorescence), quantities did not differ significantly for both maximum [bagged: F(4,99) = 3.37, p = 0.32; open: F(4,99) = 1.84, p = 0.56; Figure 4] and mean [bagged: F(4,99) = 2.81, p = 0.49; open: F(4,99) = 1.97, p = 0.59; Supplementary Figure 2] quantity measures.
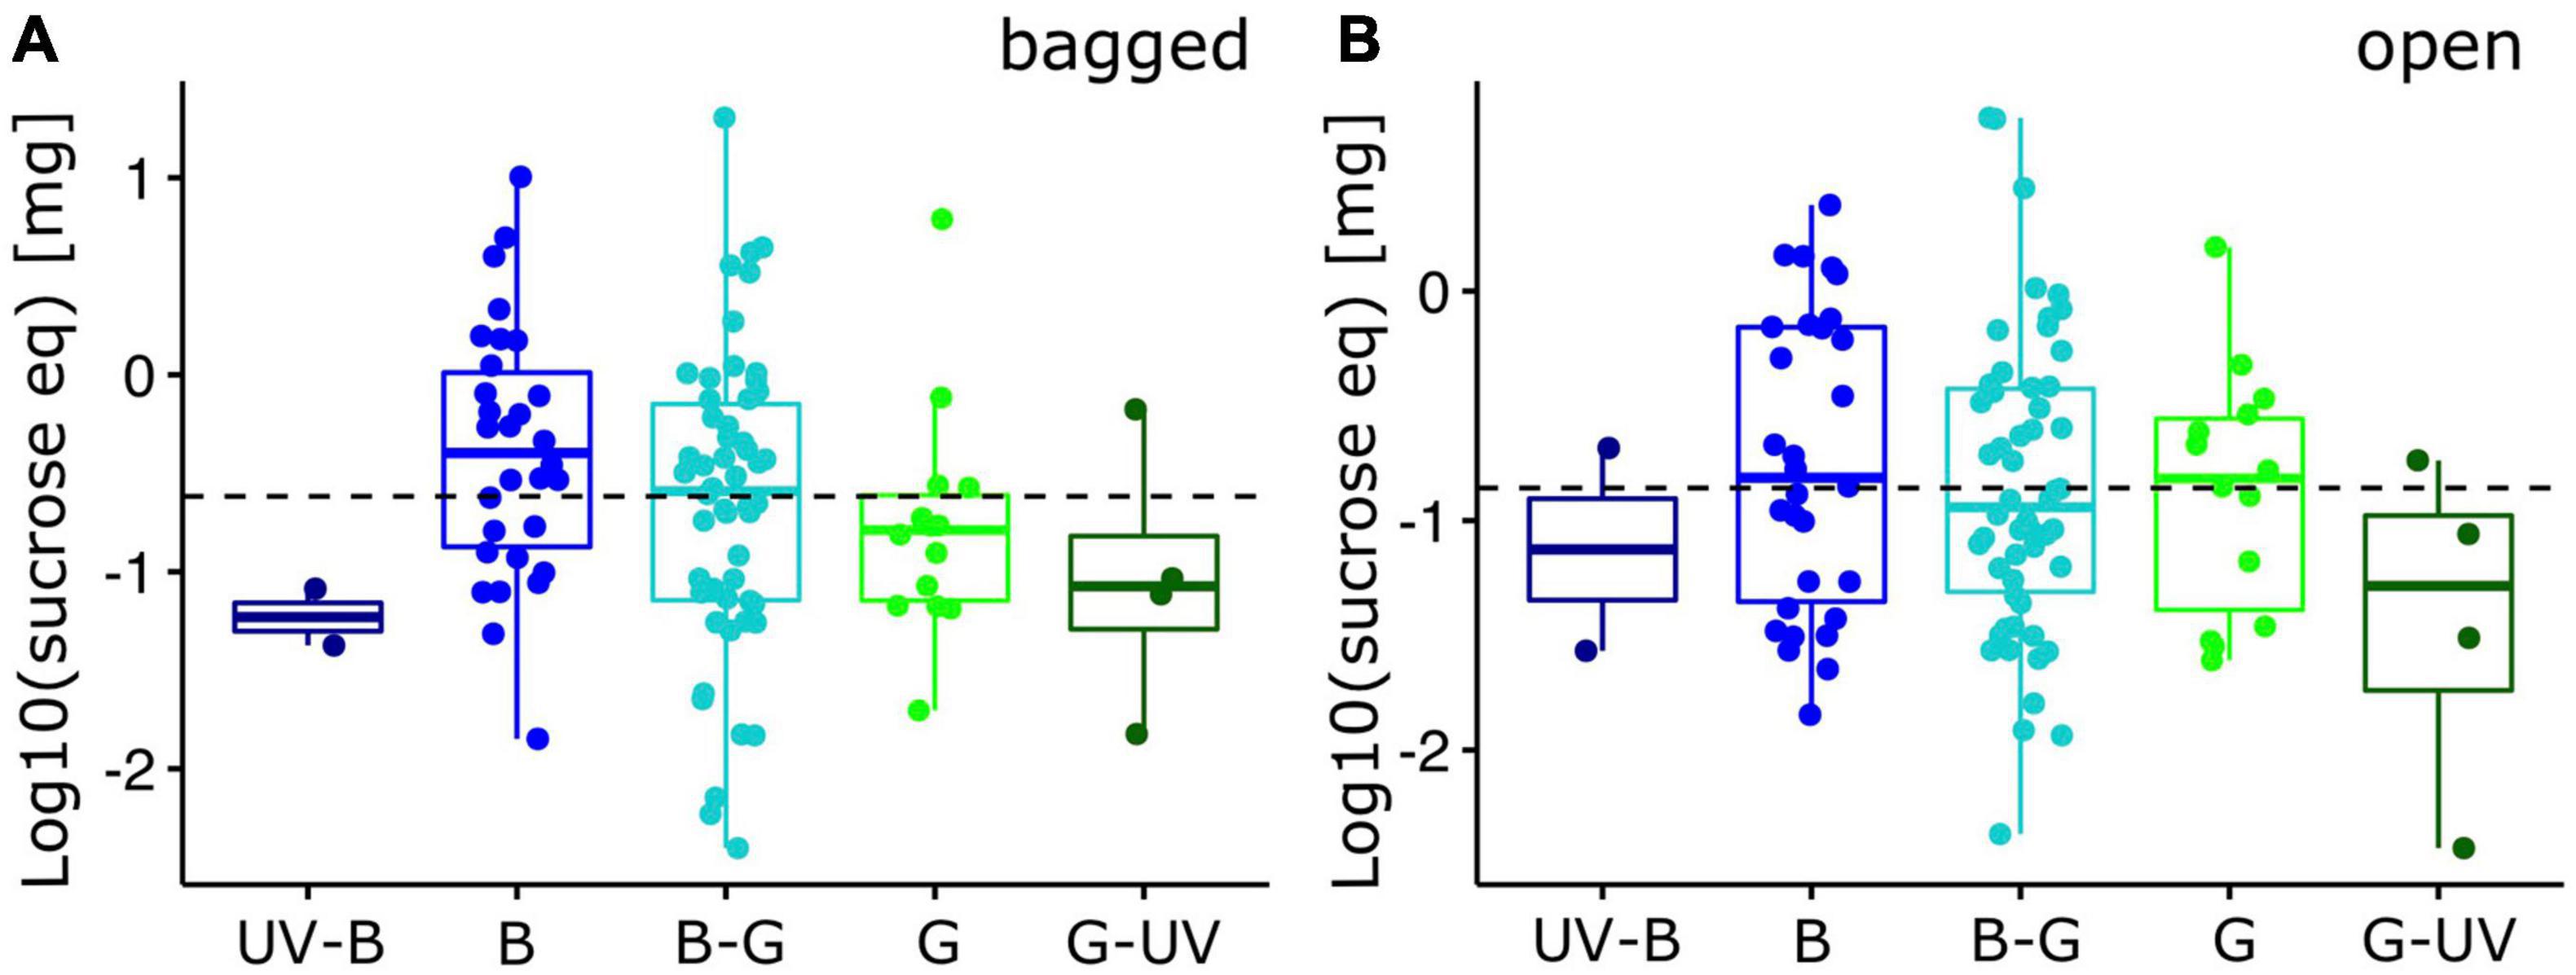
Figure 4. Nectar standing crop of alpine flowering plants (inflorescences). Log10-transformed maximum reward quantity, expressed as mg sucrose equivalent per inflorescence for bumble bee visited plant species (N = 105). Reward quantity was measured for (A) bagged inflorescences and (B) and open inflorescences. Box-plots indicate the median (line) and interquartile range (IQR, i.e., Q25-Q75; box). Lower and upper whiskers indicate Q25-1.5*IQR and Q75+1.5*IQR, respectively. The horizontal dashed line indicates the overall mean. Individual data points have been added with random X-axis jitter. X-axis categories are the five hexagon categories used in the analysis (see Figure 1; UV-B, UV-blue; B, blue; B-G, blue-green; G, green; G-UV, green-UV). For statistics, see text.
Phylogenetic generalized linear mixed models for maximum (Tables 2, 3) and mean (Supplementary Tables 2, 3) nectar reward quantities identified a strong influence of species, followed by a smaller effect of the phylogeny-corrected species term. In the fixed effects, we identified equally strong negative effects of color contrast and the number of flowers per inflorescence, as well as small, non-significant effects of all other tested variables (Tables 2, 3 and Supplementary Tables 2, 3). In other words, nectar reward quantity correlated negatively with color contrast (i.e., flowers with higher color contrast contained less nectar) and flower number (i.e., inflorescences with fewer flowers had more nectar per flower).
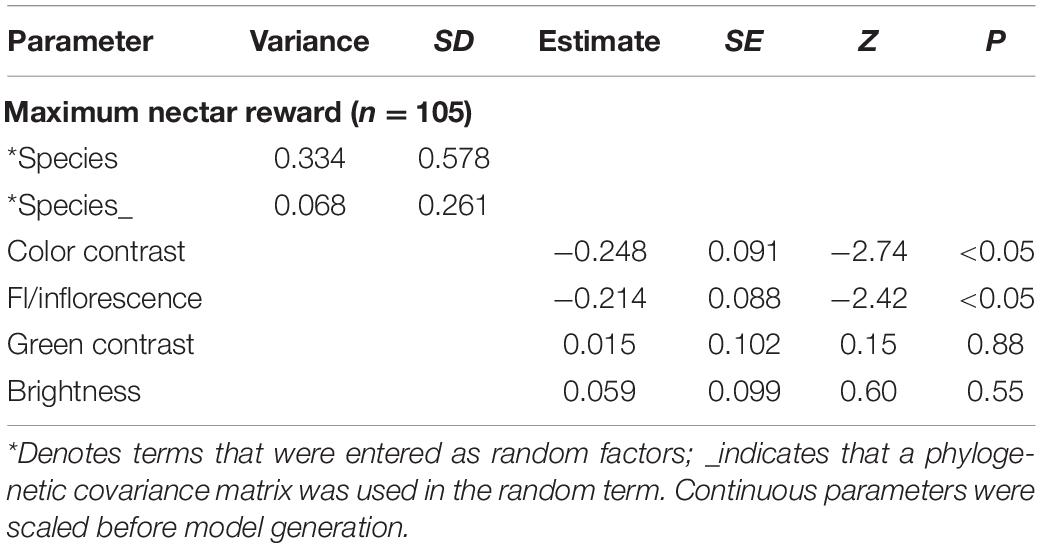
Table 2. PGLMM for maximum nectar reward of single bagged flowers.
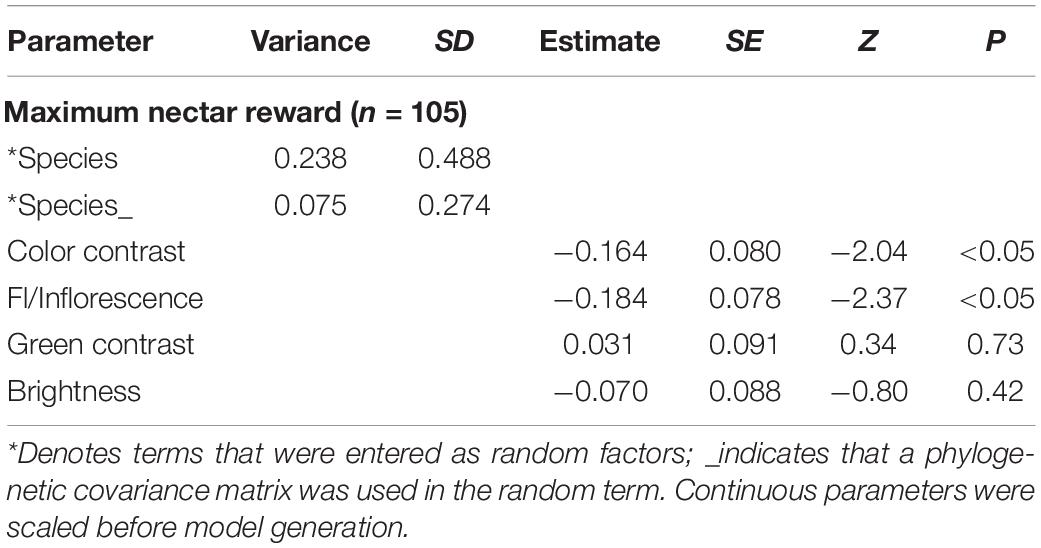
Table 3. PGLMM for maximum nectar reward data of single open flowers.
In our study, we investigated the visual properties and the reward quantity of bumble bee visited flowering plants in an alpine environment. We found significant structure in the color signals, i.e., plant colors were not uniformly distributed across the color categories in a bee-specific color space. The reward quantity differed between the categories in bagged and open single flowers (although the latter was not significant) with higher average rewards in the “blue” and “blue-green” category. For entire flowering units this difference vanished. We hypothesize that naïve bumble bees, when visiting flowers of innately preferred colors, will find on average more reward per flower, although this effect was weak and almost disappeared when flowers were unbagged.
Our analysis showed that the color loci of bumble bee visited flowers were scattered throughout the color hexagon, resulting in a variety of hues (angles) and chromatic contrasts to the background (distance to hexagon center). Interestingly, only three species appeared achromatic to bees. Achromatic cues are difficult to detect under natural conditions, and bees may not utilize them for flower detection and identification (Ng et al., 2018). The number of flowers found in each of the major bee-color categories (sensu Chittka et al., 1994) differed significantly from a uniform distribution, with the majority falling into the “blue-green” sector. This pattern, as well as that obtained when analyzed at a finer resolution (Figure 1C), showed remarkable similarity with data from other habitats and locations, e.g., Germany (Giurfa et al., 1995), Australia (Dyer et al., 2012), Nepal (Shrestha et al., 2014), New Zealand (Bischoff et al., 2013), and Taiwan (Tai et al., 2020). Interpretation and comparison of the distribution is problematic as it may depend on sampling strategy, habitat type, pollinator species and the choice of visual system selected for the color modeling (for a discussion, see Shrestha et al., 2019). For instance, most of the above-mentioned studies either combined samples from large regions rather than local communities and/or did not consider the pollinator composition.
Both abiotic factors and biotic factors are assumed to influence the flower color distribution. Previous studies demonstrated influences of e.g., day length and precipitation (Arista et al., 2013), soil composition (Horovitz, 1976), and vacuole pH (Grotewold, 2006). For the alpine environment, selection pressures for adaptations to cope with temperature extremes and high irradiance are likely to influence the observed color frequencies (van der Kooi et al., 2019; Dalrymple et al., 2020).
For biotic selection pressures, color frequency differences have been hypothesized as resulting from selection by different pollinator assemblages, but (experimental) proof for this hypothesis is rare. Recently, data from regions that lack bees (Maquarie Island; Shrestha et al., 2016) or social bees (New Zealand; Ishii et al., 2019), show different plant color distributions and thus provide support for this hypothesis. For regions with highly overlapping visitor spectra, like the Alps, comparing color frequencies as function of pollinator group is more complex. Plant-visitor networks showed considerable overlap of visitor groups for most investigated plant species in this ecosystem (Lefebvre et al., 2018). While it can be assumed that many of the flower visitors also serve as pollinators, experimental proof of the actual pollinator identity and its share in the overall pollination of most generalist plant species is largely lacking. These bits of information are, however, crucial in understanding pollinator-mediated selection on traits like e.g., color, since the strength of selection can be assumed to critically depend on the pollination efficiency of the different pollinators of a plant species (Trunschke et al., 2021). To better understand the origin of the color frequency distribution that we observed in our study, we need further detailed information about the base line in the entire community (i.e., spectral reflectance data from all of the c. 400 flowering plant species that occur in the region) and quality information about the predominant pollinator(s) for each of them, which will be a challenge for future generations of pollination ecologists.
Previous studies, which attempted to link flower color with reward quantity, either used literature data only (Giurfa et al., 1995), extrapolated nectar production rates from short measurement sequences to the entire day (Chittka et al., 2004; Raine and Chittka, 2007a), or measured sugar content of the nectar standing crop of bagged flowers only (Shrestha et al., 2020). In our study, we measured the nectar production capacity of the species (bagged flowers) as well as the nectar standing crop of open flowers, as a more direct measure of what is actually available during a typical day. As expected, the nectar standing crop was lower than the production capacity, due to depletion by visitors. Nectar reward quantities were more similar between color categories in open flowers, suggesting that those flowers that produce more nectar are preferentially depleted in the field under normal conditions. It is unclear whether these higher visitation rates originate initially from random or targeted visits of flower visitors, which have learned that certain flowers are more rewarding than others (Goulson et al., 2007).
Visual signals are used by flowering plants to convey information about their species identity and allow for easier detection in the usually cluttered visual environment. They can hold information about the reward or promote learning of the association between floral traits and the reward. Flower spectral reflectance is a complex mixture of different qualities that can be employed by the bee visual system separately or in combination. These qualities involve color contrast (contrast between the background and the flower color), achromatic contrast (modulation of the green receptor channel), brightness (the sum of the three photoreceptor excitations) and color hue. Aside from brightness, which is sometimes used in bee vision studies but has not been shown to be of importance for bees (Spaethe et al., 2001; Ng et al., 2018) all other signals and cues have been found to be relevant in bee foraging. Color contrast correlates with detection speed (Spaethe et al., 2001; Streinzer et al., 2009) and bees are known to prefer flowers of higher contrast when given a choice (Rohde et al., 2013). Achromatic contrast is used in object detection (Giurfa et al., 1996; Dyer et al., 2008), but is probably not or only rarely used as a sole cue in flower detection (Martínez-Harms et al., 2010; Lunau et al., 2011; Ng et al., 2018). Finally, hue is employed by bees to identify different reflectance spectra independent of lighting conditions and other visual traits (Reser et al., 2012). Bumble bees can learn to discriminate very small differences in hue when trained appropriately (Dyer and Chittka, 2004), but in the real world, such fine discrimination ability is probably of little value, given the existing variation of flower color within species, which sometimes overlaps with color of other species (Jersáková et al., 2016; Garcia et al., 2020).
Flower visiting insect have been shown to have (species-specific) innate preferences for certain colors (Lunau and Maier, 1995) which have been interpreted to help them find rewarding flowers more quickly during their first foraging flights. In a field study with Bombus terrestris, Raine and Chittka (2007b) first determined the strength of the innate preference for “UV-blue” and then let them forage in the surrounding, where UV-blue flowers were also the most rewarding ones. They found a significantly higher colony-level success of colonies that showed a strong innate color preference, indicating that these preferences may be adaptive if color correlates with reward quantity. Due to the large variation of rewards in our study, color cannot be considered as a reliable signal for nectar reward quantity. After sampling the vast majority of plant species visited by bumble bees in our study region, we, however, found that flowers with colors from the preferred color categories do have, on average, higher reward production at the single flower level (Figure 3A). Smaller differences have also been found for open flowers (Figure 3B) and when comparing entire inflorescences (Figure 4), though the differences were statistically not significant. We thus conclude that color may be a weak (but honest) indicator for reward quantity, and that this overall (small) advantage may indeed allow the bees to increase foraging success, compared with an entirely random search. Similar correlations between the innately preferred color categories of bees and the reward quantity were also found in Central Europe (Giurfa et al., 1995; Raine and Chittka, 2005), but not e.g., in Australia (Shrestha et al., 2020). While in the European region, social bees are assumed to have a large share in the overall pollination of entomophilous plants, in the Australian communities, (social) bees are not the major pollinator guild. Furthermore, pollinator/visitor identity was not investigated in that study, which limits the comparison with our results.
For a complete understanding of how strongly innate color preferences affect flower color in the Alps, we must know the relative contribution of all flower visitors of a plant species to its pollination success, and to analyze in detail whether different nectar traits (like volume, concentration, sugar content, and sugar composition) differ between major visitor groups and color categories. Our study surprisingly showed a negative correlation between the color contrast and nectar reward, which seems to stand in contrast to the observation that bumble bees prefer flowers of high color contrast (Rohde et al., 2013). However, some previous studies found contrasting results regarding the relationship between color contrast and reward quantity (Kantsa et al., 2017; Shrestha et al., 2020). Color contrast is a highly variable trait in flower communities (Garcia et al., 2021) and it is currently not known how bees use this visual feature while foraging in natural environments.
Interestingly, we found no statistical difference of nectar rewards among color categories when we calculated the nectar reward of the entire inflorescence (Figure 4 and Supplementary Figure 2). Flower and floral display size have been shown to correlate with nectar reward quantity and may constitute an honest signal of reward quantity for potential visitors (Ortiz et al., 2021). In our study, we found a significant negative relationship between nectar reward quantity of individual flowers and flower number of an inflorescence. From a plant’s perspective, grouping several flowers with smaller reward quantity to larger units would constitute a strategy to attract more potential pollinators due to a larger display size (Spaethe et al., 2001; Wertlen et al., 2008) and thus promote learning through higher reward quantities that can be gathered during a single visit. While larger inflorescences may provide a larger total amount of reward, the energy and time needed to collect these rewards must also be considered in foraging economics (Harder et al., 2001). In future studies, one will need to investigate in more detail how the interplay between nectar reward of individual flowers, variation of inflorescence size (e.g., number of flowers) and spatial distribution of plant individuals within a population affect the foraging economics and color preferences of bumble bees (Geslin et al., 2014).
In an alpine community, investigating the majority of flowering plants that are confirmed to be visited by bumble bees, we found evidence that flower color may serve as a weak predictor for reward quantity. Since flowers of innately preferred colors produce either higher, or at least not smaller, reward quantities compared to less favored colors, naïve bumble bees may increase their foraging success by visiting flowers of such categories. Also, experienced foragers may also profit by visiting these flowers, e.g., when previously rewarding flowers become depleted or flowering season has ended. Although our study contributes to a better understanding of the origin and adaptiveness of color preferences of flower visitors, future studies are necessary to gather more quality data on pollination efficiency of the different flower visitors and thus their respective selection force on flower color.
The original contributions presented in the study are included in the article/Supplementary Material, further inquiries can be directed to the corresponding author.
JS, JN, and MS designed the study and collected the data. MS analyzed the data and drafted the manuscript. All authors contributed to manuscript writing and editing.
Nectar data were collected in part during projects supported by Austrian National Park fund (1994) and Glockner Öko-Fonds (2012).
The authors declare that the research was conducted in the absence of any commercial or financial relationships that could be construed as a potential conflict of interest.
All claims expressed in this article are solely those of the authors and do not necessarily represent those of their affiliated organizations, or those of the publisher, the editors and the reviewers. Any product that may be evaluated in this article, or claim that may be made by its manufacturer, is not guaranteed or endorsed by the publisher.
We would like to thank S. Dötterl for spectral measurements of some flowers, S. Streinzer for help with data preparation, and J. Plant for linguistic improvements. We further wish to express our thanks to the Großglockner-Hochalpenstraßen AG for the gratuitous use of the Großglocker high alpine road and the museum “Haus der Natur” (Salzburg) for the opportunity to use the Eberhard-Stüber alpine research station. Parts of the data were collected during field courses of the University of Vienna. We would also like to thank all participating students. P. Pilsl provided estimates of flowering plant number in the region.
The Supplementary Material for this article can be found online at: https://www.frontiersin.org/articles/10.3389/fevo.2021.721241/full#supplementary-material
Arista, M., Talavera, M., Berjano, R., and Ortiz, P. L. (2013). Abiotic factors may explain the geographical distribution of flower colour morphs and the maintenance of colour polymorphism in the scarlet pimpernel. J. Ecol. 101, 1613–1622. doi: 10.1111/1365-2745.12151
Bertsch, A. (1983). Nectar production of Epilobium angustifolium L. at different air humidities; nectar sugar in individual flowers and the optimal foraging theory. Oecologia 59, 40–48. doi: 10.1007/BF00388069
Bingham, R. A., Orthner, A. R., and Takita, T. (1998). Efficient pollination of alpine plants. Nature 391, 238–239. doi: 10.1111/j.1365-2990.2004.00503.x
Bischoff, M., Lord, J. M., Robertson, A. W., and Dyer, A. G. (2013). Hymenopteran pollinators as agents of selection on flower colour in the New Zealand mountains: salient chromatic signals enhance flower discrimination. N. Z. J. Bot. 51, 181–193. doi: 10.1080/0028825X.2013.806933
Briscoe, A. D., and Chittka, L. (2001). The evolution of color vision in insects. Annu. Rev. Entomol. 46, 471–510. doi: 10.1146/annurev.ento.46.1.471
Chittka, L. (1992). The colour hexagon: a chromaticity diagram based on photoreceptor excitations as a generalized representation of colour opponency. J. Comp. Physiol. A 170, 533–543. doi: 10.1007/BF00199331
Chittka, L. (1996). Does bee color vision predate the evolution of flower color? Naturwissenschaften 83, 136–138. doi: 10.1007/s001140050263
Chittka, L., and Kevan, P. G. (2005). “Flower colour as advertisement,” in Practical Pollination Biology, eds A. Dafni, P. G. Kevan, and B. C. Husband (Cambridge, ONT: Enviroquest Ltd), 157–230.
Chittka, L., Beier, W., Hertel, H., Steinmann, E., and Menzel, R. (1992). Opponent color coding is a universal strategy to evaluate the photoreceptor inputs in Hymenoptera. J. Comp. Physiol. A 170, 545–563.
Chittka, L., Ings, T. C., and Raine, N. E. (2004). Chance and adaptation in the evolution of island bumblebee behaviour. Popul. Ecol. 46, 243–251. doi: 10.1007/s10144-004-0180-1
Chittka, L., Shmida, A., Troje, N., and Menzel, R. (1994). Ultraviolet as a component of flower reflections, and the colour perception of Hymenoptera. Vis. Res. 34, 1489–1508. doi: 10.1016/0042-6989(94)90151-1
Corbet, S. A. (2003). Nectar sugar content: estimating standing crop and secretion rate in the field. Apidologie 34, 1–10. doi: 10.1051/apido:2002049
Corbet, S. A., Unwin, D. M., and Prŷs-Jones, O. E. (1979). Humidity, nectar and insect visits to flowers, with special reference to Crataegus, Tilia and Echium. Ecol. Entomol 4, 9–22. doi: 10.1111/j.1365-2311.1979.tb00557.x
Cruden, R. W., and Hermann, S. M. (1983). “Studying nectar? Some observations on the art,” in The Biology Of Nectaries, eds B. L. Bentley and T. S. Elias (New York, NY: Columbia University Press), 223–242.
Dalrymple, R. L., Kemp, D. J., Flores-Moreno, H., Laffan, S. W., White, T. E., Hemmings, F. A., et al. (2020). Macroecological patterns in flower colour are shaped by both biotic and abiotic factors. New Phytol. 228, 1972–1985. doi: 10.1111/nph.16737
Dyer, A. G., and Chittka, L. (2004). Fine colour discrimination requires differential conditioning in bumblebees. Naturwissenschaften 91, 224–227. doi: 10.1007/s00114-004-0508-x
Dyer, A. G., Boyd-Gerny, S., McLoughlin, S., Rosa, M. G. P., Simonov, V., and Wong, B. B. M. (2012). Parallel evolution of angiosperm colour signals: common evolutionary pressures linked to hymenopteran vision. Proc. R. Soc. B Biol. Sci. 279, 3606–3615. doi: 10.1098/rspb.2012.0827
Dyer, A. G., Boyd-Gerny, S., Shrestha, M., Lunau, K., Garcia, J. E., Koethe, S., et al. (2016). Innate colour preferences of the Australian native stingless bee Tetragonula carbonaria Sm. J. Comp. Physiol. A 202, 603–613. doi: 10.1007/s00359-016-1101-4
Dyer, A. G., Spaethe, J., and Prack, S. (2008). Comparative psychophysics of bumblebee and honeybee colour discrimination and object detection. J. Comp. Physiol. A 194, 617–627. doi: 10.1007/s00359-008-0335-1
Ebmer, P. A. W. (2003). Die Höhenverbreitung der Bienen, ausgenommen Hummeln, im Nationalpark Hohe Tauern, Kärnten. Beitr. Entomofaunistik 4, 160–164.
Fischer, M. A., Oswald, K., and Adler, W. (2008). Exkursionsflora für Österreich, Liechtenstein, Südtirol, 3rd Edn. Linz: Biologiezentrum der Oberösterreichischen Landesmuseen.
Garcia, J. E., Dyer, A. G., Burd, M., and Shrestha, M. (2021). Flower colour and size signals differ depending on geographical location and altitude region. Plant Biol. 23, 905–914. doi: 10.1111/plb.13326
Garcia, J. E., Phillips, R. D., Peter, C. I., and Dyer, A. G. (2020). Changing how biologists view flowers—color as a perception not a trait. Front. Plant Sci. 11:601700. doi: 10.3389/fpls.2020.601700
Geslin, B., Baude, M., and Dajoz, I. (2014). Effect of local spatial plant distribution and conspecific density on bumble bee foraging behaviour. Ecol. Entomol. 39, 334–342. doi: 10.1111/een.12106
Giurfa, M., Núñez, J., Chittka, L., and Menzel, R. (1995). Color preferences of flower-naive honeybees. J. Comp. Physiol. A 177, 247–259.
Giurfa, M., Vorobyev, M., Kevan, P., and Menzel, R. (1996). Detection of coloured stimuli by honeybees: minimum visual angles and receptor specific contrasts. J. Comp. Physiol. A 178, 699–709. doi: 10.1007/BF00227381
Goulson, D., Cruise, J. L., Sparrow, K. R., Harris, A. J., Park, K. J., Tinsley, M. C., et al. (2007). Choosing rewarding flowers; perceptual limitations and innate preferences influence decision making in bumblebees and honeybees. Behav. Ecol. Sociobiol. 61, 1523–1529. doi: 10.1007/s00265-007-0384-4
Goyret, J., Pfaff, M., Raguso, R. A., and Kelber, A. (2008). Why do Manduca sexta feed from white flowers? Innate and learnt colour preferences in a hawkmoth. Naturwissenschaften 95, 569–576. doi: 10.1007/s00114-008-0350-7
Grotewold, E. (2006). The genetics and biochemistry of floral pigments. Annu. Rev. Plant Biol. 57, 761–780. doi: 10.1146/annurev.arplant.57.032905.105248
Gumbert, A. (2000). Color choices by bumble bees (Bombus terrestris): innate preferences and generalization after learning. Behav. Ecol. Sociobiol. 48, 36–43. doi: 10.1007/s002650000213
Harder, L. D. (1986). Effects of nectar concentration and flower depth on flower handling efficiency of bumble bees. Oecologia 69, 309–315. doi: 10.1007/BF00377639
Harder, L. D., Williams, N. M., Jordan, C. Y., and Nelson, W. A. (2001). “The effects of floral design and display on pollinator economics and pollen dispersal,” in Cognitive Ecology of Pollination: Animal Behaviour and Floral Evolution, eds J. D. Thomson and L. Chittka (Cambridge: Cambridge University Press), 297–317. doi: 10.1017/CBO9780511542268.016
Horovitz, A. (1976). Edaphic factors and flower colour distribution in the Anemoneae (Ranunculaceae). Plant Syst. Evol. 126, 239–242. doi: 10.1007/BF00983363
Ishii, H. S., Kubota, M. X., Tsujimoto, S. G., and Kudo, G. (2019). Association between community assemblage of flower colours and pollinator fauna: a comparison between Japanese and New Zealand alpine plant communities. Ann. Bot. 123, 533–541. doi: 10.1093/aob/mcy188
Jersáková, J., Spaethe, J., Streinzer, M., Neumayer, J., Paulus, H., Dötterl, S., et al. (2016). Does Traunsteinera globosa (the globe orchid) dupe its pollinators through generalized food deception or mimicry? Bot. J. Linn. Soc. 180, 269–294. doi: 10.1111/boj.12364
Kantsa, A., Raguso, R. A., Dyer, A. G., Sgardelis, S. P., Olesen, J. M., and Petanidou, T. (2017). Community-wide integration of floral colour and scent in a Mediterranean scrubland. Nat. Ecol. Evol. 1, 1502–1510. doi: 10.1038/s41559-017-0298-0
Kearns, C. A., and Inouye, D. W. (1993). Techniques For Pollination Biologists. Boulder, CO: University Press of Colorado.
Kelber, A., and Osorio, D. (2010). From spectral information to animal colour vision: experiments and concepts. Proc. R. Soc. B Biol. Sci. 277, 1617–1625. doi: 10.1098/rspb.2009.2118
Kembel, S. W., Cowan, P. D., Helmus, M. R., Cornwell, W. K., Morlon, H., Ackerly, D. D., et al. (2010). Picante: R tools for integrating phylogenies and ecology. Bioinformatics 26, 1463–1464. doi: 10.1093/bioinformatics/btq166
Lefebvre, V., Villemant, C., Fontaine, C., and Daugeron, C. (2018). Altitudinal, temporal and trophic partitioning of flower-visitors in Alpine communities. Sci. Rep. 8:4706. doi: 10.1038/s41598-018-23210-y
Leonard, A. S., Dornhaus, A., and Papaj, D. R. (2011). Flowers help bees cope with uncertainty: signal detection and the function of floral complexity. J. Exp. Biol. 214, 113–121. doi: 10.1242/jeb.047407
Li, D., Dinnage, R., Nell, L. A., Helmus, M. R., and Ives, A. R. (2020). phyr: an R package for phylogenetic species-distribution modelling in ecological communities. Methods Ecol. Evol. 11, 1455–1463. doi: 10.1111/2041-210X.13471
Lunau, K., and Maier, E. J. (1995). Innate colour preferences of flower visitors. J. Comp. Physiol. A 177, 1–19. doi: 10.1007/BF00243394
Lunau, K., and Wacht, S. (1997). Innate flower recognition in the hoverfly Eristalis tenax L. Mitt. Dtsch. Ges. Allg. Angew. Entomol. 11, 481–484.
Lunau, K., Papiorek, S., Eltz, T., and Sazima, M. (2011). Avoidance of achromatic colours by bees provides a private niche for hummingbirds. J. Exp. Biol. 214, 1607–1612. doi: 10.1242/jeb.052688
Martínez-Harms, J., Palacios, A. G., Márquez, N., Estay, P., Arroyo, M. T. K. K., Mpodozis, J., et al. (2010). Can red flowers be conspicuous to bees? Bombus dahlbomii and South American temperate forest flowers as a case in point. J. Exp. Biol. 213, 564–571. doi: 10.1242/jeb.037622
Menzel, R., and Greggers, U. (1985). Natural phototaxis and its relationship to colour vision in honeybees. J. Comp. Physiol. A 157, 311–321. doi: 10.1007/BF00618121
Ng, L., Garcia, J. E., and Dyer, A. G. (2018). Why colour is complex: evidence that bees perceive neither brightness nor green contrast in colour signal processing. Facets 3, 800–817. doi: 10.1139/facets-2017-0116
Ortiz, P. L., Fernández-Díaz, P., Pareja, D., Escudero, M., and Arista, M. (2021). Do visual traits honestly signal floral rewards at community level? Funct. Ecol 35, 369–383. doi: 10.1111/1365-2435.13709
Paradis, E., and Schliep, K. (2019). ape 5.0: an environment for modern phylogenetics and evolutionary analyses in R. Bioinformatics 35, 526–528.
Peitsch, D., Fietz, A., Hertel, H., de Souza, J., Ventura, D. F., and Menzel, R. (1992). The spectral input systems of hymenopteran insects and their receptor-based colour vision. J. Comp. Physiol. A 170, 23–40. doi: 10.1007/BF00190398
Pennell, M., Eastman, J., Slater, G., Brown, J., Uyeda, J., Fitzjohn, R., et al. (2014). geiger v2.0: an expanded suite of methods for fitting macroevolutionary models to phylogenetic trees. Bioinformatics 30, 2216–2218.
R Development Core Team (2021). R: A Language And Environment For Statistical Computing. Vienna: R Foundation statistical Computing.
Raine, N. E., and Chittka, L. (2005). Colour preferences in relation to the foraging performance and fitness of the bumblebee Bombus terrestris. Uludag Bee J. 5, 145–150.
Raine, N. E., and Chittka, L. (2007b). The adaptive significance of sensory bias in a foraging context: floral colour preferences in the bumblebee Bombus terrestris. PLoS One 2:e556. doi: 10.1371/journal.pone.0000556
Raine, N. E., and Chittka, L. (2007a). Mengen der Nektarerzeugung bei 75 von Hummeln besuchten Blumenarten in einem deutschen Pflanzenbestand (Hymenoptera: Apidae: Bombus terrestris). Entomol. Gen. 30, 191–192. doi: 10.1127/entom.gen/30/2007/191
Reser, D. H., Wijesekara Witharanage, R., Rosa, M. G., and Dyer, A. G. (2012). Honeybees (Apis mellifera) learn color discriminations via differential conditioning independent of long wavelength (green) photoreceptor modulation. PLoS One 7:e48577. doi: 10.1371/journal.pone.0048577
Revell, L. J. (2012). phytools: an R package for phylogenetic comparative biology (and other things). Methods Ecol. Evol. 3, 217–223.
Rohde, K., Papiorek, S., and Lunau, K. (2013). Bumblebees (Bombus terrestris) and honeybees (Apis mellifera) prefer similar colours of higher spectral purity over trained colours. J. Comp. Physiol. A 199, 197–210. doi: 10.1007/s00359-012-0783-5
Schielzeth, H. (2010). Simple means to improve the interpretability of regression coefficients. Methods Ecol. Evol. 1, 103–113. doi: 10.1111/j.2041-210X.2010.00012.x
Sharpe, D. (2015). Your chi-square test is statistically significant: now what? Pract. Assess. Res. Eval. 20, 1–10. doi: 10.7275/tbfa-x148
Shrestha, M., Dyer, A. G., Bhattarai, P., and Burd, M. (2014). Flower colour and phylogeny along an altitudinal gradient in the Himalayas of Nepal. J. Ecol. 102, 126–135. doi: 10.1111/1365-2745.12185
Shrestha, M., Dyer, A. G., Garcia, J. E., and Burd, M. (2019). Floral colour structure in two Australian herbaceous communities: it depends on who is looking. Ann. Bot. 124, 221–232. doi: 10.1093/aob/mcz043
Shrestha, M., Garcia, J. E., Burd, M., and Dyer, A. G. (2020). Australian native flower colours: does nectar reward drive bee pollinator flower preferences? PLoS One 15:e0226469. doi: 10.1371/journal.pone.0226469
Shrestha, M., Lunau, K., Dorin, A., Schulze, B., Bischoff, M., Burd, M., et al. (2016). Floral colours in a world without birds and bees: the plants of Macquarie Island. Plant Biol. 18, 842–850. doi: 10.1111/plb.12456
Skorupski, P., and Chittka, L. (2010). Photoreceptor spectral sensitivity in the bumblebee, Bombus impatiens (Hymenoptera: Apidae). PLoS One 5:e12049. doi: 10.1371/journal.pone.0012049
Skorupski, P., and Chittka, L. (2011). Is colour cognitive? Opt. Laser Technol. 43, 251–260. doi: 10.1016/j.optlastec.2008.12.015
Skorupski, P., Döring, T. F., and Chittka, L. (2007). Photoreceptor spectral sensitivity in island and mainland populations of the bumblebee, Bombus terrestris. J. Comp. Physiol. A 193, 485–494. doi: 10.1007/s00359-006-0206-6
Smith, S. A., and Brown, J. W. (2018). Constructing a broadly inclusive seed plant phylogeny. Am. J. Bot. 105, 302–314. doi: 10.1002/ajb2.1019
Spaethe, J., Tautz, J., and Chittka, L. (2001). Visual constraints in foraging bumblebees: flower size and color affect search time and flight behavior. Proc. Natl. Acad. Sci. U.S.A. 98, 3898–3903. doi: 10.1073/pnas.071053098
Streinzer, M., Paulus, H. F., and Spaethe, J. (2009). Floral colour signal increases short-range detectability of a sexually deceptive orchid to its bee pollinator. J. Exp. Biol. 212, 1365–1370. doi: 10.1242/jeb.027482
Streinzer, M., Roth, N., Paulus, H. F., and Spaethe, J. (2019). Color preference and spatial distribution of glaphyrid beetles suggest a key role in the maintenance of the color polymorphism in the peacock anemone (Anemone pavonina, Ranunculaceae) in Northern Greece. J. Comp. Physiol. A 205, 735–743. doi: 10.1007/s00359-019-01360-2
Tai, K.-C., Shrestha, M., Dyer, A. G., Yang, E.-C., and Wang, C.-N. (2020). Floral color diversity: how are signals shaped by elevational gradient on the tropical-subtropical mountainous island of Taiwan? Front. Plant Sci. 11:582784. doi: 10.3389/fpls.2020.582784
Théry, M., Debut, M., Gomez, D., and Casas, J. (2005). Specific color sensitivities of prey and predator explain camouflage in different visual systems. Behav. Ecol. 16, 25–29. doi: 10.1093/beheco/arh130
Trunschke, J., Lunau, K., Pyke, G. H., Ren, Z.-X., and Wang, H. (2021). Flower color evolution and the evidence of pollinator-mediated selection. Front. Plant Sci. 12:617851. doi: 10.3389/fpls.2021.617851
van der Kooi, C. J., Kevan, P. G., and Koski, M. H. (2019). The thermal ecology of flowers. Ann. Bot. 124, 343–353. doi: 10.1093/aob/mcz073
Wertlen, A. M., Niggebrugge, C., Vorobyev, M., and Hempel de Ibarra, N. (2008). Detection of patches of coloured discs by bees. J. Exp. Biol. 211, 2101–2104. doi: 10.1242/jeb.014571
Keywords: flower color, color preference, nectar reward, alpine, Bombus
Citation: Streinzer M, Neumayer J and Spaethe J (2021) Flower Color as Predictor for Nectar Reward Quantity in an Alpine Flower Community. Front. Ecol. Evol. 9:721241. doi: 10.3389/fevo.2021.721241
Received: 06 June 2021; Accepted: 17 November 2021;
Published: 09 December 2021.
Edited by:
Isabel Marques, University of Lisbon, PortugalReviewed by:
Jair E. Garcia, RMIT University, AustraliaCopyright © 2021 Streinzer, Neumayer and Spaethe. This is an open-access article distributed under the terms of the Creative Commons Attribution License (CC BY). The use, distribution or reproduction in other forums is permitted, provided the original author(s) and the copyright owner(s) are credited and that the original publication in this journal is cited, in accordance with accepted academic practice. No use, distribution or reproduction is permitted which does not comply with these terms.
*Correspondence: Martin Streinzer, bWFydGluLnN0cmVpbnplckB1bml2aWUuYWMuYXQ=
†These authors have contributed equally to this work
Disclaimer: All claims expressed in this article are solely those of the authors and do not necessarily represent those of their affiliated organizations, or those of the publisher, the editors and the reviewers. Any product that may be evaluated in this article or claim that may be made by its manufacturer is not guaranteed or endorsed by the publisher.
Research integrity at Frontiers
Learn more about the work of our research integrity team to safeguard the quality of each article we publish.