 Katherine Lee
 Jenny Apriesnig
 Hongyan Zhang
- 1Department of Agricultural Economics and Rural Sociology, University of Idaho, Moscow, ID, United States
- 2College of Business, Michigan Technological University, Houghton, MI, United States
- 3Eureka Aquatic Research LLC, Ann Arbor, MI, United States
This manuscript uses seminal models in fisheries economics to assess the ecosystem effects of policy focused on sustainable management of a single fish stock. Economic models representing fishing decisions under open access and two fisheries management schemes are parameterized using data from the four management units in the Lake Erie Yellow Perch (Persus flavenscens) fishery and linked with an end-to-end ecosystem model representative of the lake food web and spatial species interactions. We find that the sustainable harvest rules from single species economic models result in significant changes to biomass of species in planktivorous, omnivorous, and piscivorous groups in the ecosystem model. These impacts can be traced through the food web back to harvest rules implemented in the management units. Most notably, the biomass of several non-target but also commercially harvested fish species are reduced through Yellow Perch fishing. In some cases, the economic losses to coexisting fisheries exceeds benefits gained from implementing the Yellow Perch management scheme. Our results imply that while an ecosystem-based approach to fisheries management requires weighing trade-offs between multiple fisheries, an ex ante understanding of the whole-system consequences of harvest rules can be critical for developing policy that overall enhances ecological and social wellbeing.
Introduction
There is increasing awareness that a single-species focus of fisheries management can lead to undesired impacts on food webs including habitat and overfishing of non-target species (Jennings and Kaiser, 1998; Murawski, 2000; Lotze, 2004; Pikitch et al., 2004). Ecosystem-based fishery management (EBFM) is a management approach that intends to sustain the ecosystems in which fisheries operate, meaning that food web linkages within an ecosystem are recognized and that overall ecological condition becomes a management priority (Brodziak and Link, 2002). There is growing consensus that an EBFM approach is necessary to achieve sustainable fisheries management, especially since in most systems multiple fisheries exist simultaneously (Fulton et al., 2014). As fishing pressure combined with environmental stressors can result in unintentional ecological outcomes and perhaps even fishery collapse, understanding the consequences of harvest and management decisions on food webs is becoming more imperative (Kaplan et al., 2010; Holsman et al., 2016). For managers, the ability to understand the food web effects of regulatory decisions before implementing a policy eliminates some of the need for trial-and-error adjustments based on ecological or economic pressures (Latour et al., 2003).
While many marine fisheries are moving toward implementing EBFM [see Pitcher and Cochrane (2002) for examples of various existing EBFMs], actual adoption is complicated due to the data and information required to understand the food web effects of species harvest. End-to-end ecosystem models such as Ecopath with Ecosim (Christensen and Walters, 2004) and Atlantis (Fulton et al., 2004) can be used to predict ecological responses to policy by coupling environmental processes and energy flows within the natural system with fishery models. Published work using end-to-end models has shown that not only is there “no one size fits all” management strategy for fisheries but that modeling target species with ecosystems models leads to different policy recommendations (Fulton et al., 2014, 2019; Smith et al., 2015; Howell et al., 2021). End-to-end models have the capability of providing insight into the whole-system ecological consequences in designing EBFM (Dichmont et al., 2010; Punt et al., 2010).
In addition to the ecology, understanding how humans respond to and are economically impacted by regulatory decisions is critical to assessing whether EBFM achieves the desired outcomes from a social standpoint. Bioeconomic models evaluate the relationship between species stocks and fishing activities to evaluate the economic and biological outcomes of management decisions. These models vary in complexity, from non-spatial single species population models represented by logistic growth functions to spatial models representing multiple fisheries. While these models are informative, selecting which species within the food web to represent in the model can result in unforeseen ecological impacts from fisheries not captured in the bioeconomic framework. Pairing bioeconomic models with a more complete representation of the ecosystem allows for more complete understanding of the ecological impacts of fishing decisions and mechanisms driving the changes in policy development.
Integrated ecological-economic fisheries models (IEEFMs) [see Nielsen et al. (2018) for a list of IEEFMs] evaluate the ecosystem implications of management scenarios or changes to environmental conditions. Although an abundance of IEEFMs exist with varying applications, to date, most existing bioeconomic fishery models lack robust representation of human decision-making (i.e., just the harvest rule is modeled) or has a limited representation of system ecology. Finnoff and Tschirhart (2003) develop a bioenergetic multi-species model that pairs with a computable general equilibrium economic model to determine ecosystem and regional economic impacts of fisheries in Alaska, but use a limited food web. Jin et al. (2003) develop linear economic and ecological models that link to evaluate feedbacks between the economic and ecological systems, but the linkages are limited by the assumed functional relationships. Kaplan and Leonard (2012) combine an economic input-output model with an Atlantis end-to-end ecosystem model to assess the ecological and economic outcomes of gear restrictions and area closures. In a model representing a multi-stock prawn fishery, Dichmont et al. (2008) evaluates the economic and ecological impacts of maximum sustainable yield and maximum economic yield as management objectives in the Australian Northern Prawn Fishery but do not consider the implications of how the harvest rule is allocated among fishers (e.g., tradeable quotas). Subsequent work in the same study system evaluated fleet responses to a tradeable quota system (Pascoe et al., 2011) and gear restrictions (Kompas et al., 2010). These assessments evaluate the stock effects to the target species, but do not link the bioeconomic frameworks to a complete ecosystem model.
This manuscript addresses the question: what are the impacts of single species fishery management approaches on the whole ecosystem? We answer this question by developing a bioeconomic model that represents the tradeoffs faced by an individual vessel when deciding how much to effort to invest in fishing as a function of prices, costs, and the stock of the species. We pair the bioeconomic fishery model with a food web model that represents the ecosystem of Lake Erie. Using this linked economic-ecological modeling framework, we can evaluate the corresponding economic returns, system-wide harvest levels, and resulting target and non-target species biomasses under different fisheries management. We compare the results from an open access (no management) with two entry-limiting management schemes: individual vessel quotas (IVQs) and individual transferrable quotas (ITQs). The results of our behavioral model can then be used as inputs into a system-wide food web simulation to determine the ecosystem effects of harvest and management decisions.
We apply our model to the Lake Erie commercial Yellow Perch (Persus flavenscens) fishery, which is jointly managed by the United States and Canada. Both countries receive a proportion of the determined total allowable catch (TAC) and use different regulatory frameworks (IVQs and ITQs, respectively) to distribute the TAC to fishers in the commercial fishery. We compare the stock levels and net revenues generated from each management scenario and then feed our behavioral model results into the ecological model to simulate the impacts of harvest decisions on the whole ecosystem. Our contribution to the literature is two-fold. First, we develop an economic models to assess behavioral responses to fisheries management frameworks in Lake Erie. Second, we assess how the Lake Erie food web, including the populations of simultaneously harvested species, is influenced by the single-species harvest decisions. This work furthers understanding of ecological and socio-economic dimensions of managing ecosystems and provides a framework for assessing policies that utilize an EBFM approach.
Materials and Methods
Our model has three fundamental components. First, we develop economic models that represents the decisions made by individual vessels that participate in a commercial fishing industry under the relevant regulatory frameworks. This allows us to assess how vessels choose their fishing capacity in each harvest season based on market conditions, regulatory constraints, their individual vessel characteristics, and current species biomass levels. Then we introduce a regulatory agency that sets a fishing quota for the target species based on the current state of the target species stock and distributes the right to fish to vessels. Finally, we feed the results of the bioeconomic model into an ecological model of Lake Erie developed by Zhang et al. (2016) to simulate the ecological response of the fishing pressure on a target species as well as food web linkages to non-target species.
To evaluate the ecological and economic outcomes of regulating a commercial fishery, we derive behavioral models of decisions made by the individual vessel that is flexible enough to represent different fisheries management scenarios that can be compared with models of an unregulated open access fishery and a model of a centrally managed fishery to illustrate the inefficiencies of open access. Then we derive effort decisions using modified models that represent two regulatory structures-IVQs and ITQs to illustrate changes in fishing effort, harvest, and the resulting species biomass from open access.
The Bioeconomic Model
Behavioral Model of an Open Access Fishery
Following the seminal work of Schaefer (1957) and the related work of Bjørndal and Conrad (1987) and Conrad (2010) we begin by developing a model of an unregulated open access fishery. Suppose a fishery within one body of water is divided into multiple spatial fishing zones or management units (MUs), and each unit operates as its own managed fishery, meaning participants can only fish in one of the units per decision period. The behavioral models developed below represent decisions made individual vessels, which can be summed to understand actions of the entire commercial fishing fleet in a single management unit. In our study system there are four management units. Under open access, vessels that participate in the fishery are free enter and exit the fishery based on economic outcomes. Vessels operating within the management unit harvest a quantity of species biomass Hi in each decision period t. Harvest follows a linear Schaefer production function (Schaefer, 1954) and is a function of the chosen level of fishing effort Ei(t) by vessel i, the current fish stock biomass X(t) and a management unit-specific catchability coefficient q1 :
Summing the individual vessel harvest decisions produces the total annual harvest for the management unit:
The fish stock is modeled as a renewable resource, which is denoted by its biomass at time t, X(t). The fish stock grows according to the function f(X(t)), which is. In each decision period, the commercial fishery collectively removes biomass H(t) through harvest. The evolution of the species stock therefore follows:
in which harvest is constrained by the current biomass of the resource stock 0 ≤ H(t) ≤ X(t). From here on we eliminate time notation for brevity.
Assuming no constraints on entry vessels participating in the commercial fishery are price takers and receive an ex-vessel price p per unit of biomass harvested. The profit function for vessel i can be represented as:
The variable cost of fishing is represented by ci(Ei). Under open access, from the vessels’ first-order necessary condition, vessels will choose to operate at a level of effort that equates average revenue per unit of fishing effort with marginal cost per unit of fishing effort:
This condition produces two pieces of information. First, it provides insight whether each vessel will participate in the fishery in the decision period. Following economic production theory, each vessel will choose to fish if their average cost per unit of effort is greater than the minimum point of the average cost per unit effort curve and will choose not to fish (Ei = 0) otherwise. The second piece of information is the level of effort chosen. Assuming an explicit functional form for ci(Ei), each vessel will solve Eq. 5 for their optimal choice of fishing effort . These effort decisions are updated in each period as the stock size changes in response to harvest decisions.
This open access outcome is not economically or biologically efficient. When a renewable resource is managed under open access, there is no payment for fish stock- an important input to production- in the harvest decision. This ignored value of the fish stock is referred to as natural resource rent. In the case of many natural resources that have a rental value, the value stems from the fact that the has a clearly defined property right. The magnitude of resource rent in a fishery is a function of time, current stocks of the resource, and exploitation levels; the larger the stock size, the larger the potential for positive profits and therefore resource rent. In an open access fishery, the chosen level of effort, and therefore harvest, by individual vessels is too high because there is no payment for use of the fish stock as an input to production and reducing the fish stock biomass and eventually dissipating the fishery’s resource rent. Often this results in overfishing. Lower species biomass implies less stock growth and in subsequent fishing seasons it may be more effort intensive to catch fish.
A Model of an Optimally Managed Fishery
Before developing models of behavioral response to fishing regulations we present a model of an optimally managed fishery, which is solved from the perspective of a central fishery manager. The two fishery management models below aim to replicate the outcome of the central manager but are not equivalent to the optimally managed fishery because managers lack the full information such as vessels’ cost and value functions required to solve the optimal management problem. As a result, the regulatory policies are intended to mimic the outcome of the optimally managed fishery model derived here by implementing policies that alter the incentives faced by participants in the fishery but will not match them exactly.
Following Clark (1980), suppose a manager can choose the number of vessels that operate in a fishery N and effort expended by each vessel Ei to maximize the net revenues earned in the fishery. Their optimization problem follows:
subject to the equilibrium condition that in steady state (found by setting Eq. 3 to zero), harvest will equal the growth rate of the biological stock:
The associated Lagrangian is:
The new variable μ is a Lagrangian multiplier that is interpreted as the marginal (shadow) value of an additional unit of the resource stock. Taking the derivative of the Lagrangian with respect to the two choice variables Ei and N produces the necessary conditions for optimality:
Equation 9 implies that the manager will choose a level of effort for vessel i that equates the marginal revenue of an additional unit of fishing effort with the marginal cost of effort to that vessel. This is different than the result of the open access model, in which effort is chosen by equating average value product (total revenue divided by effort) with marginal cost (Eq. 5). Notably, the optimally managed system includes an additional term on the left-hand side of Eq. 9, μ, which is the shadow value of an additional unit of the fish stock. This value is not associated with an additional unit harvested, rather an additional unit in the stock that remains in the natural system. This additional unit of stock has value because, if not harvested, it contributes to stock growth (through the biological growth rate, F(X)) and is also available for harvest in subsequent fishing periods. Another way to interpret this variable is an opportunity cost; by harvesting the marginal unit of stock today, the individual is gaining benefits in the current fishing period (in the form of revenue from harvest) but at the expense of potential revenue earned in future fishing periods.
In the open access fishery, vessels do not consider this shadow value in their decision because there is no management of fishing effort, guaranteeing that the fish stock will exist in perpetuity. Vessels choose to expend more effort in the current decision period because there is no regulation of behavior of vessels in the fishery and therefore uncertainty in the future of the stock. This is the so-called tragedy of the unregulated commons (Hardin, 1968). It is the shadow value that fishery regulators are attempting to introduce when developing policy so that while vessels will still not solve the optimal management problem, additional costs or constraints will enter their decision models and alter the incentives, steering vessels toward the socially optimal outcome.
Rearranging Eq. 10 and substituting the equality from 9 into the left-hand side produces the condition that determines how many vessels the manager will allow to operate in the fishery. This condition states that the marginal entrant to the fishery will operate where their marginal cost is equal to average cost, implying a zero-profit condition for this marginal entrant but others who are more efficient will receive positive profit (in the case of fisheries, this is the resource rent)
Regulation of Fishing Effort
To steer a fishery toward the optimal outcome, fisheries managers in our study system use a fishing quota to limit harvest in each management unit, which is determined based on stock size. The quota Q(t) is determined annually by conducting a stock assessment and a target proportion of the population that can be removed via harvest:
where θ is a parameter that represents the proportion of the total biomass the manager chooses to harvest in the commercial fishery. In this analysis, we consider two fishing quota allocation systems implemented by the commercial fisheries in our study system. Individual vessel quotas (IVQs) allocate the total fishing quota equally across each fisher that chooses to participate in the fishery. The second allocation system is similar- each vessel is allocated an equal share of the fishing quota but can transfer (buy or sell) of any portion of their allocated quota. This system is referred to as individual transferable quota (ITQ) system. In an ITQ system fishers can benefit from choosing not to fish, by selling their quotas and saving their operation costs. Though total harvest is constrained the two regulatory scenarios allow individuals to determine their fishing effort in a setting that is not open access.
Fishing Behavior Under Individual Vessel Quotas
Following a modeling framework similar to Clark (1980) and Asche et al. (2009), we begin by modeling an IVQ system. Under an IVQ system, the fishing quota is split equally across vessels that participate in the fishery so that each vessel can harvest and the fishery manager specifies the number of vessels that can enter the fishery. Since vessels can no longer operate at the level they chose under open access, and now must solve a constrained optimization to determine their optimal choice of effort. Vessel i chooses a level of effort that maximizes profit:
subject to their harvest constraint. We allow the constraint to be non-binding, so vessels can harvest less than their quota, but not more:
The associated Lagrangian is:
By solving the problem using a Lagrangian we have introduced a new variable, λi that has the interpretation of the marginal value to vessel i of obtaining an additional unit of quota. Substituting (1) into (15), the first-order necessary condition for optimality is
and the complementary slackness condition:
The inequality in Eq. 14 implies there are two possible scenarios: the vessel chooses an effort level such that their harvest is less than their quota allocation, or an effort level that equates harvest with the quota allocation. If the vessel chooses an effort level such that qXEi < Qi, then mathematically for (17) to hold, it must follow that λ = 0. This condition has an interesting interpretation, which is that an additional unit of allowable harvest allocated to vessel i has no value to the vessel, meaning if they were to expend further effort on fishing, the costs would exceed the benefits. Returning to the interpretation of λi, it makes sense then that the vessel would choose not to harvest their entire quota- they would be losing money if they did so, and they certainly do not have a beneficial use for more harvest quota! Alternatively, if harvest equals the allocated quota, then the term in the square bracket of (16) is zero implying that λi≥0. If it is the case that λi > 0, this implies that an additional unit of the quota would be economically beneficial to the vessel; the marginal benefit of an additional unit of harvest exceeds the additional costs. However, given that quotas are not tradeable, so there is no way for this vessel to earn that potential additional marginal benefit.
Because the IVQs are distributed evenly, some vessels may choose not to meet their quota and others who wish to exceed it but are constrained, we cannot assume that λi in Eq. 16 with μ in Eq. 9 from the optimally managed fishery are equivalent. The variables measuring two different values, one the marginal value of the stock, another a marginal value of harvest. This regulatory framework meets ecological objectives by constraining harvest and managing the stock to a specific target, does not guarantee economic efficiency.
Fishing Behavior Under Individual Tradeable Quotas
Again following the work of Clark (1980); Arnason (1990) and the more recent work of Péreau et al. (2012), we develop the second management possibility: the ITQ scenario where vessels are allocated an initial quantity of quota . Quotas can be traded in a lease market year to year for a market price m and Qi represents the amount of quota held by vessel i after trade. The market price for quotas is determined by the aggregate demand function for quota units by all vessels in the fishery, which is derived from vessel choices. When a vessel purchases quota in addition to their initial allocation, their revenues are reduced by , or the price of the quota multiplied by the quantity of additional quota purchased. When units of the quota are sold, the same term determines revenue from selling quotas. If quotas are sold the term in parentheses is negative and the overall term is positive (negative multiplied by a negative), adding to revenue. Assuming individual harvest is equal to the final quota allocation for each vessel, Hi = Qi, under an ITQ system the vessel chooses optimal choice of effort by solving:
with first-order condition:
driving each vessels’ choice of fishing effort. When deciding to harvest each vessel is weighing the net revenue gained from fishing their quota limit and the potential benefit of additional unit of the quota with the gains they could have earned by selling quota units for the market-defined price, m.
To understand how individuals make the decision to purchase or sell quotas, it is informative to rewrite the vessels’ profit equation as a function of number of quotas the vessel chooses in order to derive the vessels’ quota demand function:
The decision to buy or sell quotas is dependent on the marginal benefit (revenue gained) from purchasing more of the quota relative to the price of the quota. If the revenue gained from harvesting additional biomass is greater than the price of a unit of quota, the vessel will purchase more quota and increase harvest, or if . If the revenue gained from additional harvest is less than the price of a quota, , the vessel will sell units of their initial quota allocation, . A vessel’s demand for quotas can be found where:
or the point at which the market price of the quota equals the marginal benefit from acquisition of an additional unit of quota. In other words, purchasing one more unit of quota would result in a reduction in overall profit, as the marginal costs of fishing exceed the revenue earned. The market price for quotas is determined where quota supply ∑Qi is equal to total demand for quotas, which follows , summing each vessels’ marginal benefit function. Assuming heterogeneous fishing costs across vessels participating in the fishery, the aggregate demand function will be a decreasing function of quota price. The equilibrium quota price occurs where supply (total amount of quotas available) is equal to aggregate demand. In the case that the quota price has the exact value of μ in (9), then the ITQ-regulated fishery achieves the socially optimal outcome although this is highly unrealistic in an actual management scenario.
Application to Commercial Yellow Perch Fishery in Lake Erie
To explore how management outcomes shape incentives for participants in a fishery and quantify the resulting ecosystem impacts, we pair the model with an end-to-end ecosystem model developed to assess food web linkages in Lake Erie. Lake Erie is the shallowest among the five Laurentian Great Lakes and the most productive as it warms rapidly during the spring and summer. Lake Erie is naturally divided into three distinct lake basins: the western, central, and eastern basin. The western basin is the most shallow, warm, and nutrient-rich, making it most suitable for spawning and nursery habitat for juvenile fishes. The central basin has the largest volume, and the eastern basin is the deepest of the three and is oligotrophic. Because of the distinct differences between the basins, each is significant to different species or for different parts of a species’ life cycle. Further, the basins have different amounts of habitat suitable for fish species with different water temperature preferences (i.e., warm-water, cool-water, and cold-water species).
Yellow Perch, the focus of our modeling efforts, is ecologically important fish species in Lake Erie. Larval Yellow Perch are pelagic and feed on zooplankton, then become demersal when they grow to 20–25 mm in total length and feed on both zooplankton and benthic invertebrates (Gopalan et al., 1998; MacDougall, 2001; Roswell et al., 2013). Throughout all age classes, the largest proportion of diet composition for Yellow Perch are invertebrates, though the species has a wide diet spectrum including zooplankton, benthos and prey fish (Roberts et al., 2009). Yellow Perch have many natural predators such as Walleye (Sander vitreus), Smallmouth Bass (Micropterus dolomieu), Panfish species, Northern Pike (Esox lucius), and birds (Rose et al., 1999; Johnson et al., 2001). In addition, recent invasion of White Perch (Morone amercana) and Dreissena mussels have negatively affected Yellow Perch populations (Gopalan et al., 1998; Rutherford et al., 1999), while other invasive species- Round Goby (Neogobius melanostomus) and Alewife (Alosa pseudoharengus) both compete with juvenile Yellow Perch but are prey for adult Yellow Perch (Truemper et al., 2006).
The United States and Canada jointly manage the Yellow Perch fishery in Lake Erie through the Great Lakes Fishery Commission (GLFC) which estimates a recommended annual Yellow Perch harvest for each of the four Yellow Perch four fishery management units (Figure 1) based on historic fishery performance and current biomass estimates. The recommended harvest within each management unit is then split between United States and Canada based on jurisdictional surface area. Each country allocates a proportion of the recommended harvest to the commercial fishery and the rest to recreational fishing. In this assessment we only consider harvest decisions made by the commercial fishery based on available data. In the commercial fishery, the United States issues non-tradeable licenses to individuals to harvest a specified quantity of Yellow Perch (an individual vessel quota system, IVQ) while Canada has implemented a similar system but fishers can trade their licenses (an individual tradeable quota system, ITQ).
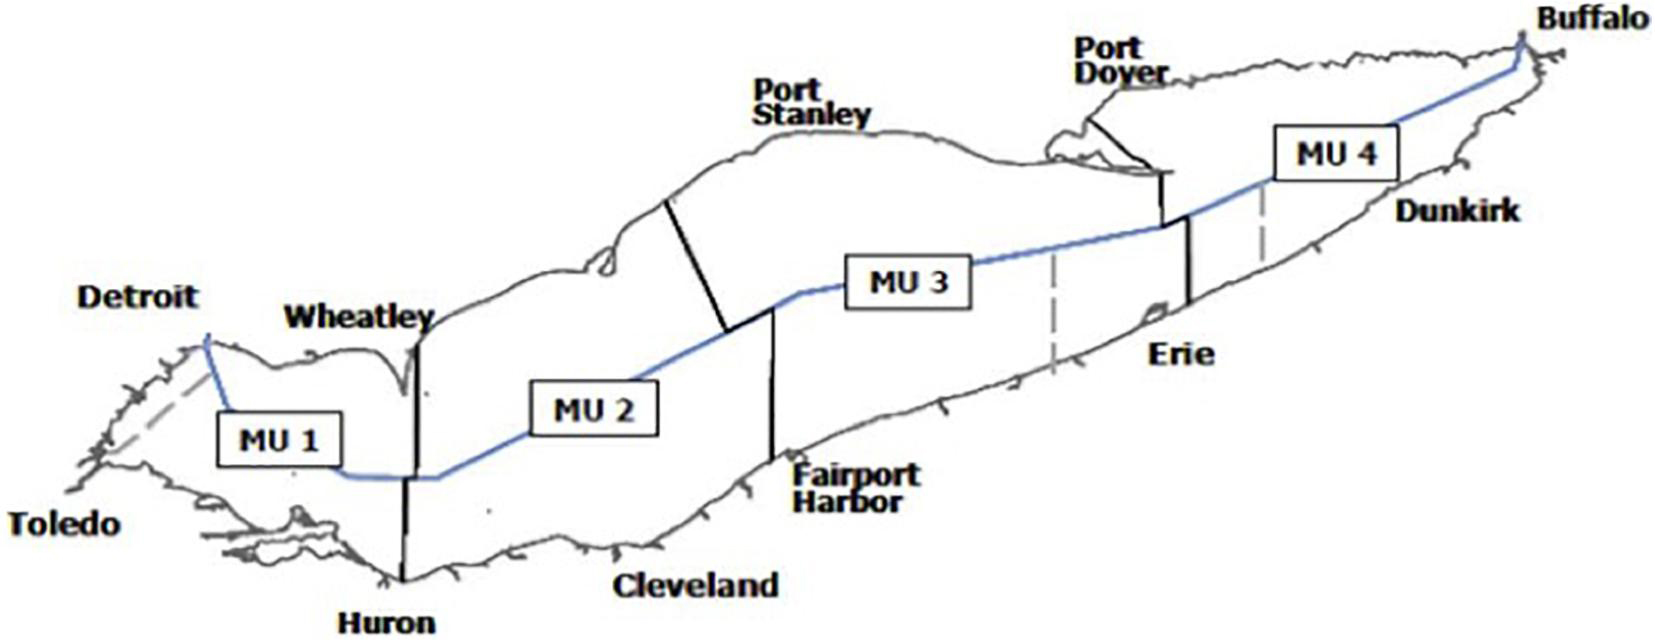
Figure 1. Yellow Perch management units (MUs) in Lake Erie. Figure from Lake Erie Yellow Perch Task force annual report.
Lake Erie Yellow Perch Fishery and Economic Model Parameterization
The economic model and harvest rules are parameterized using data from the GLFC Annual Yellow Perch Task Group reports2 and personal communication with GLFC Yellow Perch Task Group members. Historical data (1975–2020) on harvest, biomass, and fishing effort were used to estimate catchability coefficients for each management unit. We also use provided data to estimate target harvest rules for each management unit. The Canadian fishery uses gill nets and trawls, while the US fishery uses trap nets, which are fishing efforts measured in different units. Here, we abstract from reality and use the same catchability coefficient for both the IVQ and ITQ scenarios; this is done so that the results of the three management scenarios can be compared. The calculated catchability coefficients from the United States estimates are used in the simulations (Table 1).
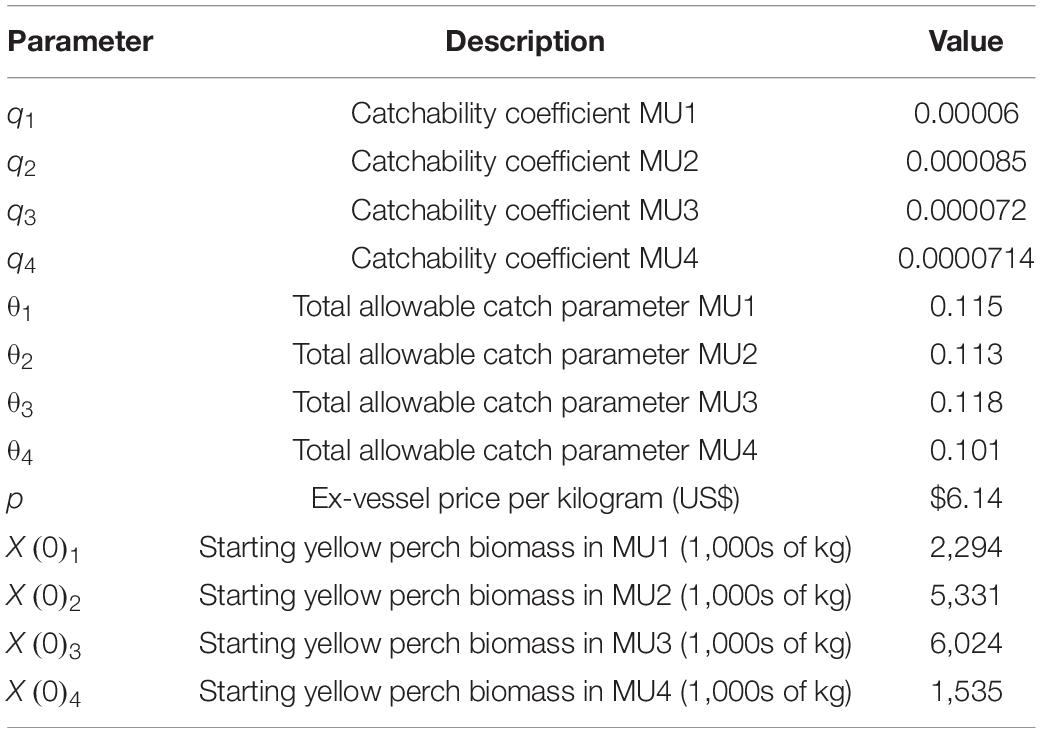
Table 1. Parameter values used in the bioeconomic model simulations.
The limited availability of economic data for the fishery required us to make some assumptions about some parameter values, specifically the cost function. We use quadratic functional form following Clark (2007) and use cost function parameters similar to Péreau et al. (2012).
Cost heterogeneity between vessels is introduced through c1, which is a uniform random variable over the interval [360 × (1 − 0.4), 360 × (1 + 0.4)] to simulate 10 unique cost structures to represent 10 different vessels in the fishery with heterogeneous operating costs. This heterogeneity creates differences in decisions for participation and chosen level of effort and allows us to create a demand for fishing quotas and the market price for quotas. Data shared by the Lake Erie Yellow Perch Task Group indicated that across all management units the US fishery distributes 18 commercial licenses (M. DuFour, Ohio Department of Natural Resources, personal communication) and the Canadian fishery distributed 188 licenses with 65 vessels reporting catch (M. Belore, Ontario Ministry of Natural Resources and Forestry, personal communication). From the same data source, the license fee for participation in the US fishery (IVQ) was $800 per year. To initiate the simulations, the biomass of the fish stock in each MU was set to the 1990–2020 average biomass in each management unit from data provided by the Lake Erie Yellow Perch Task Group. Other parameters used in the model are presented in Table 1.
Ecological Model
We use an Ecopath with Ecosim (EwE) model to represent the ecosystem of Lake Erie and simulate the responses to Yellow Perch fishing pressure. The EwE software includes two submodules: Ecopath and Ecosim. Ecopath is a static model that constructs mass-balance trophic models of ecosystem at a given time. The Ecosim model dynamically simulates trophic interactions and biomass accumulation that is initiated in Ecopath (Christensen and Walters, 2004). There are two key equations in the Ecopath model. The first describes biomass production being the difference between population growth and loss through fishing mortality, predation, net migration, and other mortality such as starvation, disease, or aging. The second equation balances energy flows among consumption, production, and respiration. Ecopath requires inputs of diet composition, consumption and production to biomass ratios and fishing mortality to estimate production rates. For a detailed description of the model equations and parameterization used in this work, as well as a sensitivity analysis for the model, see Zhang et al. (2016) Supplements A and B.
The EwE model of Lake Erie consists of 47 model groups (a species or a group of species with similar functions) including birds, fish, zooplankton, benthos, phytoplankton, and detritus. For each model group biomass, production to biomass ratio per year, consumption to biomass ratio per year, and diet composition are estimated. The Ecopath model was constructed using data from 1999 to 2001, while the Ecosim model was driven by time series of nutrient loads, fish stocking, and fishery catches from 1999 to 2010 and calibrated using observed time series of population biomass for 14 model groups. The model timestep is a month and outputs annual biomass of each model group.
Four fish species including Walleye and Yellow Perch are modeled with more than one life stage in EwE because they undergo ontogenetic diet shifts, and young of the species are prey for other species at different life stages. Multiple life stages for Walleye and Yellow Perch allows the model to accurately account for fishing pressure the adult populations (Age 3+ for Walleye and Age 2+ for Yellow Perch). Other species such as Lake Trout (Salvelinus namaycush) and Steelhead Trout (Oncorhynchus mykiss) are just represented as adult populations because they are stocked into the system.
While the EwE model is not spatially explicit, the spatial aspects of the lake’s ecosystem are incorporated in the food web model through the diet matrix in Ecopath and predation vulnerability parameters in Ecosim. The diet matrix uses observations of diet composition from the three basins that defines spatial and temporal overlap between predators and prey across the lake basins. Plankton biomass, production, and consumption are derived from sampling at different stations in each lake basins or habitats. Further, the diet composition and predator vulnerability of species in the models reflect their spatial distributions. Cold-water pelagic species that primarily exist in management unit 4 do not interact with or consume warm-water nearshore species found predominantly in management unit 1, and vice versa. Table 2 illustrates a sample of predator/prey interactions in the model for two important species in the model- Walleye and Yellow Perch, where the predators can be found in the columns and their prey in the rows. As illustrated in the table, prey availability that varies by species age class, which is a function of location. For example, a large proportion of Age 1 and 2+ Yellow Perch diet includes benthic invertebrates. These age classes will inhabit the littoral zones of all MUs but as the west basin is shallow and eutrophic, has more habitat and foraging area. The biomass of Age 1 and 2+ Yellow Perch is largest in MUs 1 and 2.
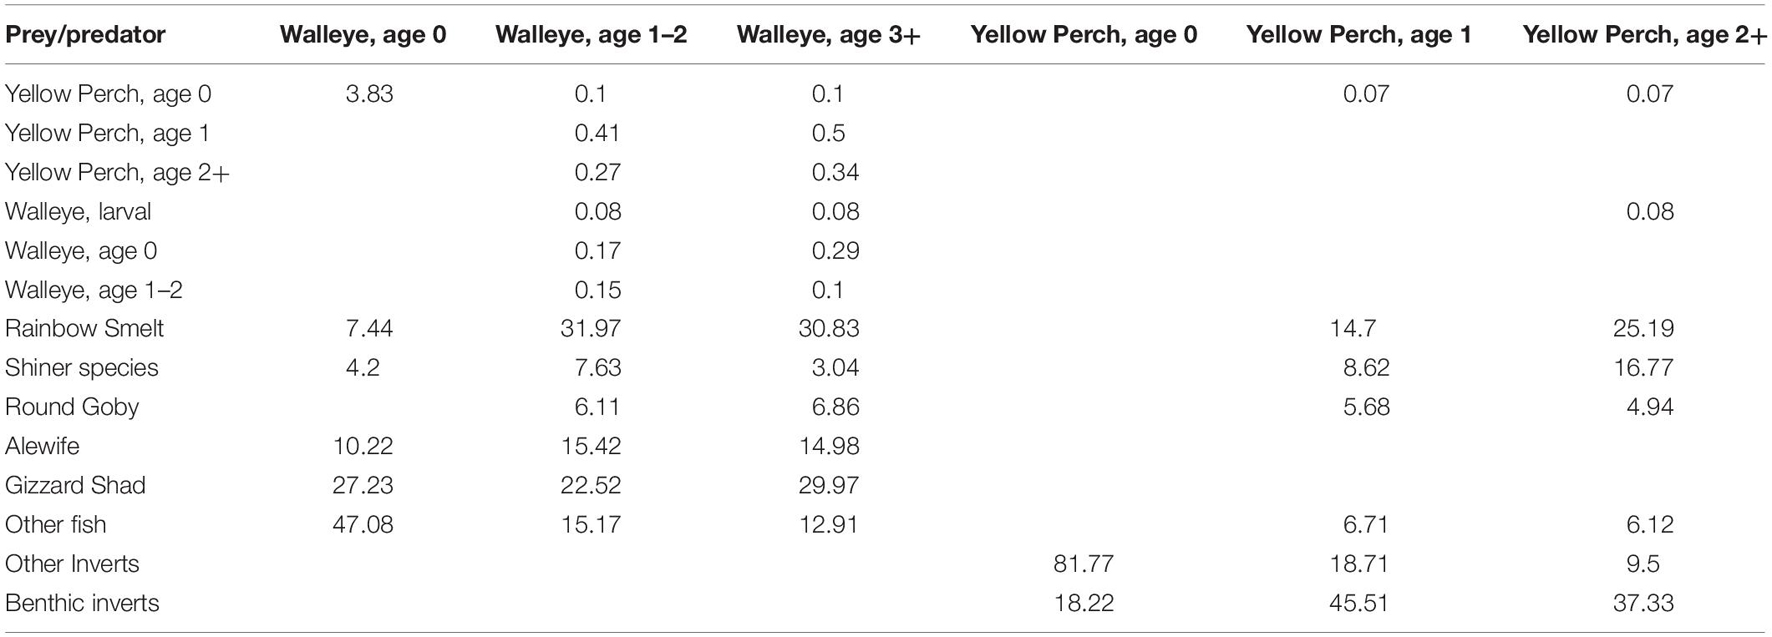
Table 2. Percent of total diet for Yellow Perch and Walleye in the balanced Ecopath model.
Linking the Ecopath With Ecosim and the Fishery Model
A plug-in developed for the EwE software links the food web model with the outcomes (chosen level of effort and therefore harvest) solved by the economic model. The link is programed in General Algebraic Modeling System (GAMS). In each time period the fishing mortality rate in each management unit (harvest divided by stock biomass, derived from effort solved for each vessel in the bioeconomic models detailed above) for Yellow Perch is reported to the EwE and the model removes biomass from the Age 2+ Yellow Perch class. This is consistent with reports from the Yellow Perch Task Group, which indicate that harvestable biomass for Yellow Perch is Age 2+. In the two regulated fishery scenarios, the fishing quota is determined using the current stock biomass (Eq. 12) and the aggregate of effort levels chosen by individual vessels from the economic model informs fishing mortality (total harvest divided by stock). The food web then updates biomass levels for each model group based on the fishing mortality. In the current model, we assume that there is no value to bycatch. EwE is initialized using data from 1999 and calibrated using observed forcing through 2021. The simulation is run for 120 years under each management scenario The 120 year duration is chosen to allow for the ecosystem model to settle to a new steady state.
Results
Our results are twofold. We first present the results of the economic models and then the steady state changes to the ecosystem that result from differences in fishing behavior in the three management scenarios.
Economic Impacts of Fishery Management
We simulated the fishing decisions under open access, IVQ, and ITQ fishing rules which allows us to compare the time paths of variables of interest- fishing effort, harvest, stock biomass, and fishery profit- for each of the management units and their steady state values (Figure 2). Overall our results align with theoretical predictions and the existing literature. Effort expended in the open access model exceeds both the IVQ and ITQ levels of effort for each management unit and decision period (Figure 2, Panel A) which aligns with the existing literature. Effort oscillates in some MUs as vessels choose to fish each year. Since all vessels are deciding simultaneously whether to fish, the industry overshoots and undershoots the equilibrium but settles to steady state stock size, number of vessels participating in the fishery, harvest, and profit (Table 3).
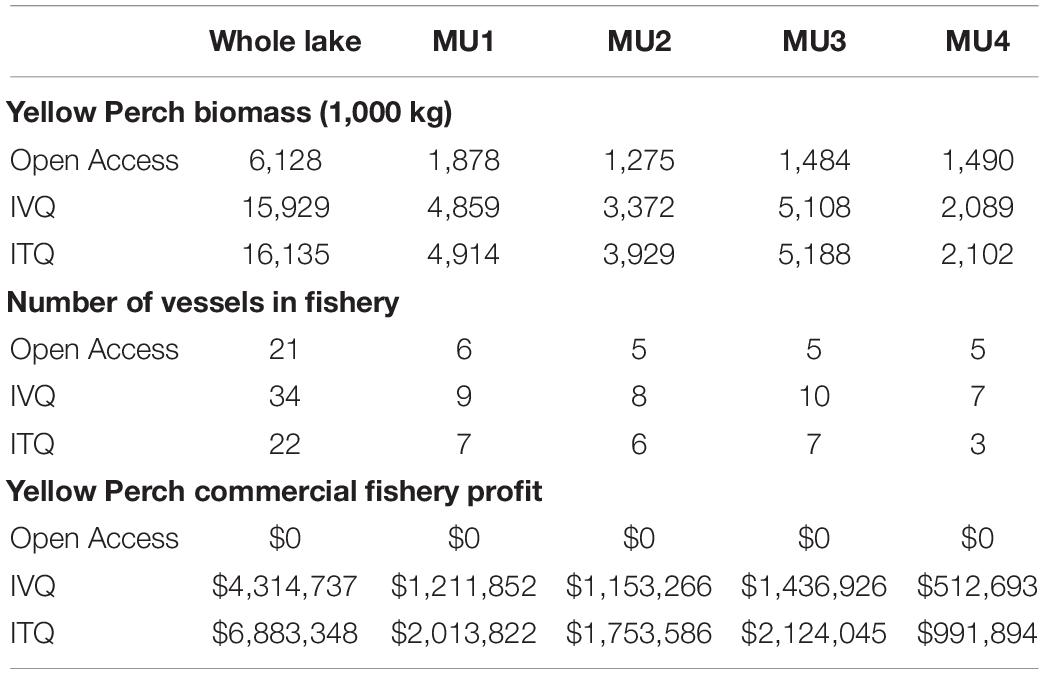
Table 3. Whole lake and management unit (MU) values for steady state stock size (biomass), size of fishing fleet, and fishery profits for fisheries models.
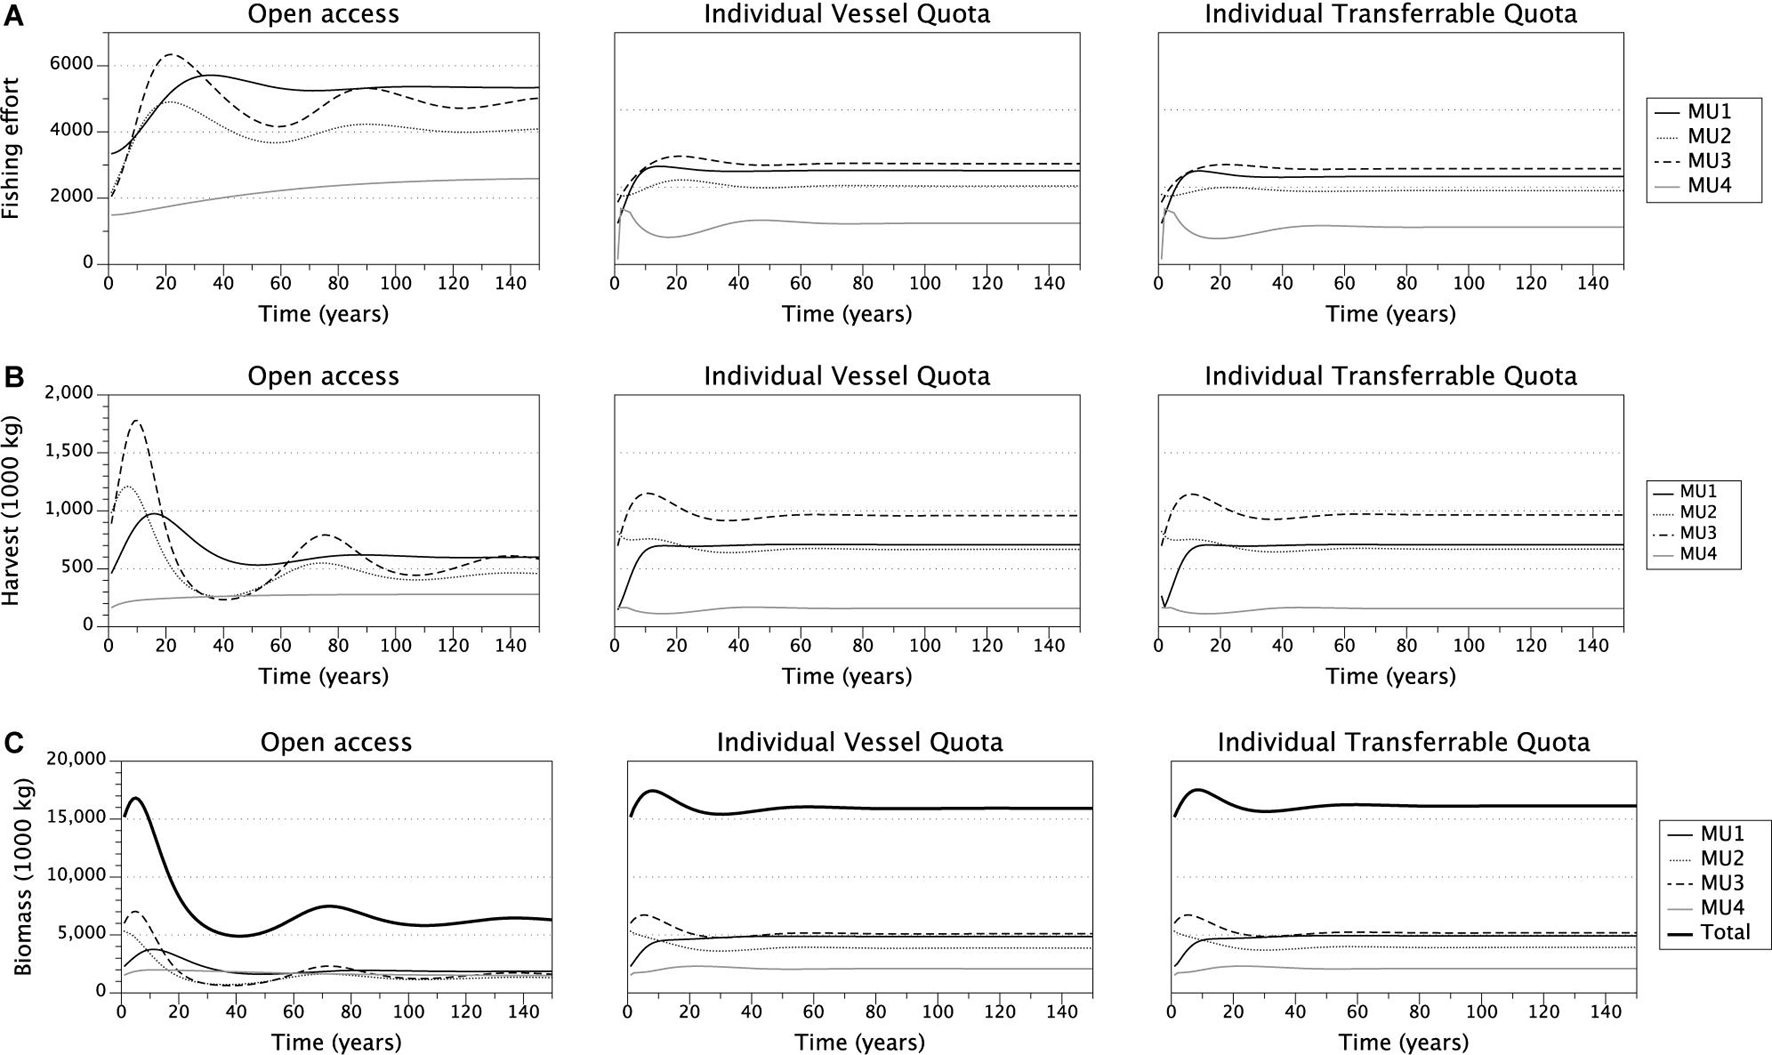
Figure 2. Time paths of effort (panel A), Yellow Perch harvested biomass (panel B), Yellow Perch stock size (panel C) under open access, IVQ and ITQ management scenarios.
Under the IVQ and ITQ fishing rules, steady state fishing effort is significantly lower levels higher compared to the open access results (Figure 2, Panel A). We find that given our parameterization, the fishing quota in the ITQ system does not bind causing differences in harvest levels and stock size between IVA and ITQ even though the models are initialized with the identical fishing quotas. Comparing the harvest levels between the IVQ and ITQ simulations (Figure 2, Panel B), in steady state under ITQ harvest biomass is slightly larger (1,000 kg greater in management unit 1, 2,000 kg greater in management unit 2, 6,000 kg greater in management unit 3, and 2,000 kg greater in management unit 4 than IVQ scenario) because the Yellow Perch stock biomasses are larger under ITQ (Table 3). This difference comes from less vessels participating in the fishery under ITQ and therefore less fishing effort (Table 3). Even if some of the more efficient vessels purchase quotas from the less efficient vessels, the efficient vessels are labor or capital constrained, so do not purchase all the available quota. In the long run, not meeting the fishing quota results in slightly higher biomass levels in each management unit under the ITQ system- for example in management unit 1 the stock biomass is 4.91 million kg in ITQ scenario, and 4.86 million kg in IVQ scenario).
Ecological Impacts of Fishery Management
To assess the ecosystem impacts of Yellow Perch harvest and management, we first simulated the EwE model without fishing (no fishing mortality) and then simulated the three fishery scenarios: open access, IVQ, and ITQ, each having a different Yellow Perch fishing mortality rate determined by the economic model. The ecological impacts are measured by calculating the percent change in steady state biomass between the “no fishing” simulation and each of the three fishery management scenarios. The results are presented in Figure 3, where species are organized into general trophic groups- invertebrates, planktivorous fishes, omnivorous fishes, and piscivorous fishes. The impact to each of these groups can be linked through food web interactions to fishing of Yellow Perch through competition and predation. Some impacts can be linked to fishing decisions within specific management units as a function of species interactions through space. Throughout our results we highlight these species interactions and spatial linkages when possible. Our description of the results starts with the invertebrate group. The biomass of amphipods increases by ∼5% under open access, IVQ, and ITQ. Benthic invertebrate, edible zooplankton, and other invertebrate biomasses, all three of which are major diet items for Yellow Perch, do not significantly change across the three scenarios. Predatory zooplankton, which includes the invasive spiny water flea (Bythotrephes longimanus), biomass decreases by ∼10% in all simulations.
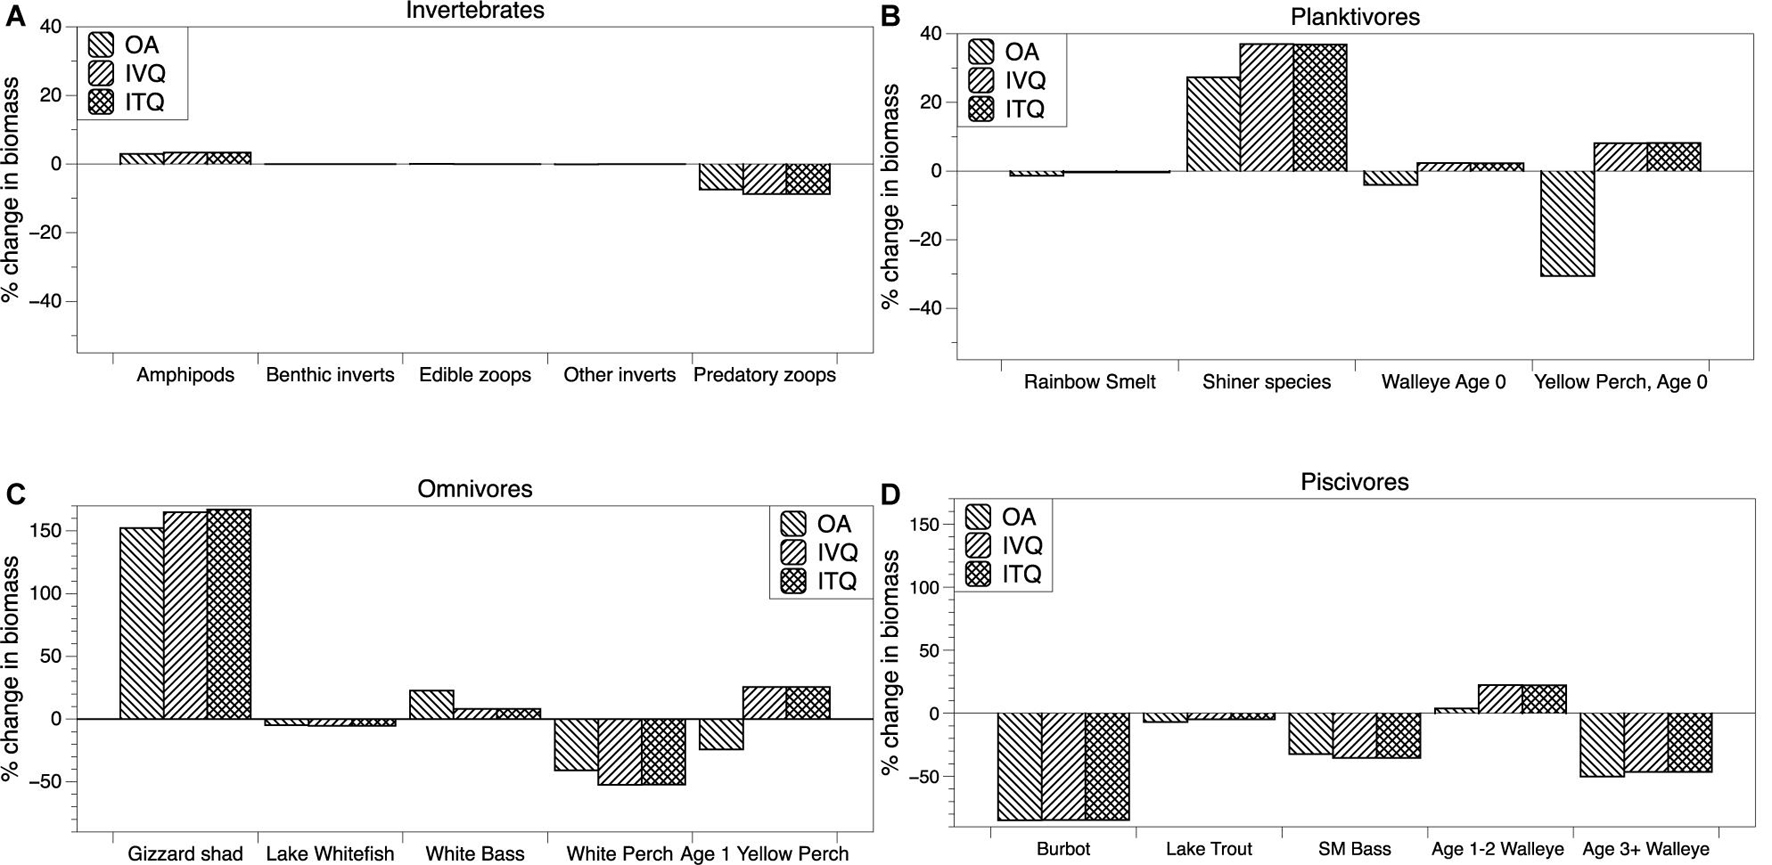
Figure 3. Percent changes in steady state biomass from a simulation with no fishing for selected species within trophic groups-invertebrates (A), planktivores (B), omnivores (C) and piscivores (D) under open access, IVQ, and ITQ management scenarios.
Moving to the results of the planktivorous fishes we find that the biomass results for the IVQ and ITQ scenarios are similar in magnitude and direction across all species because the harvest rule in these models are similar (though not identical). In the three simulations Rainbow Smelt (Osmerus mordax) biomass is reduced by about 2% in all simulations. Juvenile and adult Rainbow Smelt primarily inhabit pelagic zones of Lake Erie (management units 3 and 4). The high Yellow Perch harvest level in management unit 3 slightly reduces predation on Rainbow Smelt, but the effect is small because adult Rainbow Smelt have limited interactions with Yellow Perch which reside in littoral habitats. Yellow Perch predominantly consume Rainbow Smelt larvae in the littoral zones of all management units. Shiner species biomass increases under open access and have greater increases under IVQ and ITQ scenarios. The change in biomass can be linked to changes higher up the food web. Species that consume shiners including White Perch, Smallmouth Bass, and Age 1–2 and 3+ Walleye biomass are all reduced, resulting in less predation pressure in the littoral zones of all management units that Shiners inhabit and therefore a larger overall biomass. Under IVQ and ITQ management Age 0 Yellow Perch biomass increases by ∼10% and decreases by ∼30% under open access. The driver of the decrease in biomass is due to fishing mortality and therefore a smaller spawning stock of Age 2+ Yellow Perch. This impact is larger under open access. As the three results are compared to a “no fishing” scenario, why then the positive change in Age 0 Yellow Perch under IVQ and ITQ? This is also a food web effect, likely from a reduction in predator biomass (Smallmouth Bass and Age 3+ Walleye) in combination with the ability to outcompete other species in the model for diet items.
Within the omnivorous fish trophic level, we observe that the food web interaction between Yellow Perch and Gizzard Shad (Dorosoma cepedianum) is particularly strong. Yellow Perch harvest increases Gizzard Shad biomass by over 150% in the open access and IVQ and ITQ scenarios. The change in Gizzard Shad biomass can be explained through a reduction in predation pressure and a reduction in competition for resources. Biomass reductions in the piscivorous group reduce predation pressure on Gizzard Shad in all management units, but specifically 1 and 2 which contain the most habitat for the species. Piscivorous fishes that consume Gizzard Shad (Burbot, Smallmouth Bass, and Age 3+ Walleye) biomasses are reduced regardless of harvest level, contributing to this effect. Gizzard Shad is also highly adaptable in its diet. When facing high levels of competition for zooplankton they can forage on detritus. Lower biomasses of juvenile Yellow Perch and Walleye reduce competition for food so that the species can forage on zooplankton. White Perch are another species that have a significant food web linkage to Yellow Perch and their harvest. White Perch biomass decreases with Yellow Perch harvest, with a larger reduction of White Perch in the IVQ and ITQ scenarios. This reduction and its magnitude are linked to changes in the biomass of Age 1 Yellow Perch. Age 1 Yellow Perch compete with White Perch for prey- planktivorous fishes and plankton- and the greater biomass of Age 1 Yellow Perch under IVQ and ITQ creates more competition with White Parch for resources in these scenarios. White Bass populations increase in all three simulations, with the largest biomass increase occurring under open access (∼22%). This is a competition effect with Age 1 Yellow Perch in the food web model. Biomass of Age 1 Yellow Perch decreases in the open access scenario, following the same rationale as the decrease for Age 0 Yellow Perch- fishing mortality reduces the biomass of Age 2+ Yellow Perch, the spawning stock biomass. Age 1 Yellow Perch biomass increases in the IVQ and ITQ simulations, due to the combination of two food web effects- one top-down, the other bottom-up. An increase in Shiner species biomass provides more prey for Age 1 Yellow Perch and a reduction in White Perch biomass reduces competition for prey (bottom-up). In addition, Age 1 Yellow Perch are diet items for piscivorous species Smallmouth Bass and Age 3+ Walleye, both of which have reduced biomasses in all simulations (top-down).
The largest ecosystem impacts of the Yellow Perch fishery are found in the piscivore group, which includes several commercially and recreationally valuable species. Biomass of Burbot (Lota lota), Lake Trout, Smallmouth Bass, and Age 3+ Walleye are reduced when Yellow Perch are harvested. Burbot biomass is reduced significantly in each scenario (∼-80%). Burbot primarily consume Rainbow Smelt in the colder, deeper pelagic zones of Lake Erie. White Bass also consume Rainbow Smelt, creating a food web interaction. White Bass biomass increases in all results because they can out-compete Burbot for invertebrates. Age 3+ Walleye prey on Age 0 and Age 1 Yellow Perch, which have reduced biomasses due to the Yellow Perch Fishery. In the open access scenario, a larger reduction in biomass of Age 0 and Age 1 Yellow Perch translates to a larger reduction in biomass for Age 3+ Walleye (Walleye Age 3+ biomass is reduced by ∼50% in the open access and by ∼45% in the IVQ and ITQ simulations). There is also a competition mechanism for these impacts. Shiner and Gizzard Shad biomass increases. These species compete with (and can outcompete) the larva and juvenile age classes of Burbot, Lake Trout, and Walleye- Shiner and Gizzard Shad. Age 1–2 Walleye biomass increase in all simulations, though the increase is larger under the IVQ and ITQ scenarios (4% increase under open access, ∼22% increase under IVQ and ITQ). Linking this outcome to the food web, Age 1–2 Walleye consume Age 0 and Age 1 Yellow Perch and Shiner species. Under IVQ and ITQ scenarios, these three groups have increased biomasses, resulting in more resource availability for Age 1–2 Walleye. The biomass of Age 1–2 Walleye increases by a smaller magnitude in the open access scenario because Age 0 and Age 1 Yellow Perch biomass decreases, so the small change can just be attributed to the increase in Shiner species biomass.
While the food web effects are interesting and provide insight into the ecological consequences of a single species fisheries management approach, there are also potential coinciding economic impacts to simultaneous fisheries. We find the effects of changes to species biomass resulting from the Yellow Perch fishing has implications for the sixteen other commercial and recreational fisheries that coexist in Lake Erie. Table 4 presents the steady-state harvest biomasses for each of the coexisting fisheries under the three simulations. Most fisheries do not experience major differences in harvested biomass between the IVQ and ITQ scenarios (because their harvest rules are similar), but for some species major differences are observed between open access and the regulated fishery scenarios (IVQ and ITQ). Most fisheries have a reduced harvest when the Yellow Perch fishery operates as open access, relative to the IVQ and ITQ results. However, not all fisheries benefit from management of the Yellow Perch fishery. Harvested biomass of Lake Whitefish, Smallmouth Bass, Sucker, White Bass, and White Perch increase when the Yellow Perch fishery operates as open access. These results track with the differences in overall percent change in biomass resulting from the three fisheries management scenarios summarized in Figure 3. The EwE model does not differentiate between fishing mortality from commercial and recreational fisheries, so inferring the economic impacts of changes to harvest is difficult as information about the allocation of total fishing mortality between the commercial and recreational fisheries and their values, specifically the smaller fisheries, are not readily available. What these results do emphasize, however, is that almost every fishery in Lake Erie are impacted positively or negatively by fishing decisions made by the single species management decisions made by the Yellow Perch fishery.
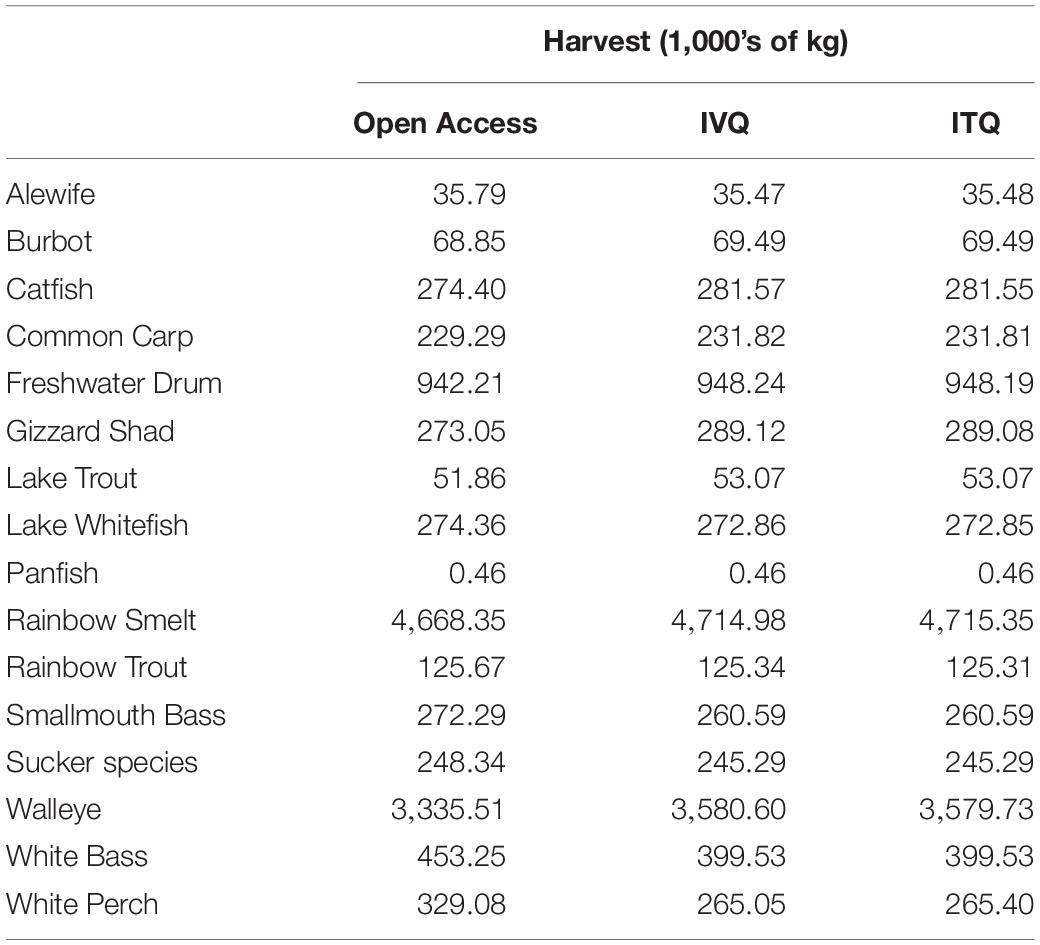
Table 4. Steady state harvest biomasses for all fisheries in Lake Erie.
To illustrate the potential for negative effects of single-species fishery management, we estimate the economic losses to the Walleye fishery from changes to Walleye biomass. The Walleye fishery is one of the other major commercial fisheries in Lake Erie. The act of removing Yellow Perch from the system reduces the biomass of Age 3+ Walleye. In the hypothetical case that there is no Yellow Perch fishery, our model estimates that Age 3+ Walleye steady state stock biomass is 41.79 million kg. Assuming no Yellow Perch fishing and a harvest rule of 0.16 for Walleye (from the Great Lakes Fishery Commission reports), the steady state lake-wide harvested biomass of Walleye would be 6.7 million kg per year. When the Yellow Perch fishery is added to the model, the steady state harvested biomass for Age 3+ Walleye is reduced to 3.34 million kg (open access), 3.58 million kg (IVQ), and 3.57 million kg (ITQ). Assuming a price of $3.50 per kg for Walleye, the change in revenue in the Walleye fishery between “no Yellow Perch fishery” scenario and the three Yellow Perch fishing management scenarios are −$11.7 million (open access), −$10.9 million (IVQ) and −$10.8 million (ITQ) per year. These losses to the Walleye fishery because of the Yellow Perch fishery are larger in magnitude than the economic gains from moving from open access to IVQ or ITQ in the Yellow Perch fishery (Though comparing a scenario where no fisheries exist is unrealistic, we want to highlight that because co-existing fisheries can impact the biomass of other commercially important species and therefore commercial fisheries, failure to consider the food web interactions of harvesting a single species can be economically (and ecologically) more costly to simultaneously operated fisheries than not managing the system at all. Further, there may be no “optimal strategy” when designing EBFMs, but by considering the trade-offs of management decisions can result in overall benefits to the ecosystem and movement toward efficient economic outcomes.
Discussion and Conclusion
There are many arguments for the implementation of EBFM and fisheries managers have already committed to their adoption. However, EBFM can be difficult as ecosystems are complex and to fully assess the ecosystem impacts of management decisions requires complex models which are time and data intensive to develop. A critical step in assessing if EBFM would benefit a system is determining the ecological and economic consequences of policy for single species fisheries, which focus on steering fishing behavior toward sustainable harvest of that species. The problem is that single species management focuses on that species’ population dynamics but ignores food web interactions. In a spatially heterogeneous aquatic system with distinct MUs that have different species stocks, predicting how the fishing intensity within MUs translates to ecological and economic impacts on the whole system is critical in evaluating the effectiveness of proposed EBFM.
Following the fisheries bioeconomics literature to understand incentives faced by fishing vessels and general framework for management for many fisheries, we assessed the value of single-species management in the Lake Erie Yellow Perch fishery and find that both the IVQ and ITQ systems create positive and significant but heterogeneous changes to profit across the four management units. By pairing the steady state results of behavioral fisheries models to a food web model of Lake Erie, we simulated the ecological impacts of the fishing pressure in each of the models to major trophic groups. This analysis does not inform whether Yellow Perch harvest results in “sustainable” levels of species but does inform positive and negative impacts to biomass of all species in the system based on spatial species interactions and food web effects. While we find that the Yellow Perch fishery, even when not managed (open access), does not have catastrophic impacts on any species in the system, but fishing for the single species does alter the biomass of almost all species in the food web, including other valuable fish species. We found these impacts to be consistent across open access, IVQ, and ITQ models while the results (positive or negative biomass change) were mixed depending on the model. These findings indicate the importance of not only quantifying the changes in biomass to non-target but understanding the linkages between where harvest occurs and how spatial interactions influence changes to the food web. These results can also target management actions (i.e., stocking or habitat provisions) that may mitigate the negative effects of fish harvest.
Overall, we find that harvest of Yellow Perch creates significant impacts to fish species at different levels of the food web. The most negatively impacted group is piscivorous fishes. These species have their own valuable fisheries (commercial or recreational) in Lake Erie, implying that even an “optimally managed” (IVQ or ITQ model) Yellow Perch fishery does have the potential to negatively impact other fisheries. Most notably, the economic losses to the Walleye fishery from the Yellow Perch fishery- even in the ITQ and IVQ scenarios- exceeds the losses from allowing the Yellow Perch fishery to operate as open access. This illustrates the potential benefits of using an EBFM in the design of fisheries management. While a framework like the one developed here can be used to assist policy makers in determining how to meet defined objectives and observe potential impacts of those objectives before implementing them in the system. An ad hoc assessment of ecosystem and paired economic impacts can prevent unforeseen ecological consequences and potential losses. For example, we find that any harvest of Yellow Perch results in this negative effect on multiple piscivorous fish species. We have not assessed the impact of a Walleye fishery on Yellow Perch biomass, but presumably there would be some effect in this direction that should be explored. For managers, this result implies there will always be trade-offs that need to be evaluated in managing coexisting fisheries. Using a framework like the one developed here allows for assessment of the potential outcomes of different Yellow Perch harvest rules and the related economic impacts to determine whether ecological and management objectives are met for all managed fisheries.
One criticism of this work may be that we do not develop a bioeconomic multi-species fishery model that produces a dynamically optimal harvest rule. This type of bioeconomic framework is not used here because it has practical and computational shortcomings which limits their applicability to real fisheries management. For example, fisheries are not managed by a social planner with perfect foresight, harvest rules are reevaluated and can be adjusted on an annual basis after a stock assessment. While some of dynamic bioeconomic models are spatial, the way that space is represented models may not be appropriate for all systems such as Lake Erie which has spatial heterogeneity across MUs, affecting species stocks. The spatial realities of a system like Lake Erie can be more accurately represented and tracked in an end-to-end ecosystem model. Environmental and ecological factors are variable and sometimes stochastic, and socio-economic aspects of a fishery also change over time- constant and limiting assumptions about economic factors in an infinite time horizon is a bit unrealistic- which results in limits the usefulness of results to policymakers who make decisions under variable year to year conditions. These factors also require managers to constantly be evaluating and updating policy in response to changes to the system. While dynamic bioeconomic models can and have included multiple species, food webs interactions are spatial and often more complex than logistic functional forms allow. Brockmann et al. (2021) show that using logistic functions and ignoring space and spatial food web interactions result in incorrect predictions about the ecological consequences of an invasive species introduction and related impacts to recreational fisheries. Simplifying complex ecosystems to interactions between just species of interest in the model runs the risk of overlooking and understanding ecosystem linkages that could result in undesired outcomes.
Our work is limited and can be extended in several ways. The economic parameters for individual fishers in the mathematical models are calibrated based on available data from the Great Lakes Fishery Commission and do not vary across the MUs. Individual cost information for participants in this relatively small fishery are not available to empirically estimate cost functions. In future work, collaboration with Lake Erie managers and stakeholders could facilitate more detailed spatial parameterization of the model. We performed one simulation of the Lake Erie ecosystem, assuming a balanced ecological model. Lake Erie constantly experiences a suite of simultaneous natural and anthropogenic stresses, such as nutrient loading, environmental contamination, and invasive species introductions which may collectively influence food web dynamics. Further, Lake Erie has multiple commercial and sport fisheries operating simultaneously. We call for additional research pairing economic and ecological models to assess feedbacks between these impacts while incorporating spatial food web linkages and as much reality about the fishery as possible. Finally, a natural extension of this work is to include a more sophisticated representation of decisions made by the fisheries manager across the MUs, in which they consider the future impacts of harvest decisions within each unit on the entire food web or the spatial effects of management rules in each unit.
What are the implications of this work for fishery managers and policymakers? First and perhaps most importantly, managing multiple fisheries in a single system will require evaluating species biomass trade-offs from food web interactions. If these impacts are known before EBFM is implemented, managers could target species stocking efforts to mitigate negative impacts or design fishing zones that lessen the negative food web effects of harvest. Second, since aquatic ecosystems are closed systems, decisions made within one management unit have the potential to affect the entire system. When developing harvest rules, managers can assess food web connections to develop strategies within MUs that mitigate the impacts in other MUs. Finally, failure to consider food web effects of a single species harvest rule can have more profound economic impacts than if the single species were not managed at all. Ignoring the food web effects of harvesting Yellow Perch on Walleye resulted in a larger economic loss than just to allow open access fishing in the Yellow Perch fishery. This is important result; here our results are limited to impacts on other commercial fisheries but more broadly small changes to the food web may affect ecosystem service production beyond fisheries, resulting in net welfare losses rather than gains. Frameworks such as the one developed here allow managers to simultaneously test the paired ecological and economic effects of policy in the development of EBFM while considering the spatial socio-economic and ecological realities of the system. When there are multiple fisheries and other demands for ecosystem services in a system evaluating proposed changes to management of any fishery should weigh the (positive or negative) external impacts on other aspects of the system to understand the implications for ecological and social wellbeing.
Data Availability Statement
The raw data supporting the conclusions of this article will be made available by the authors, without undue reservation.
Author Contributions
KL conceptualized the manuscript, developed the economic models, performed the analysis, and wrote the manuscript. JA assisted with economic model development, parameterization, and performed linked model simulations. HZ developed the ecological model. All authors contributed to the article and approved the submitted version.
Conflict of Interest
HZ was employed by the company Eureka Aquatic Research LLC.
The remaining authors declare that the research was conducted in the absence of any commercial or financial relationships that could be construed as a potential conflict of interest.
Publisher’s Note
All claims expressed in this article are solely those of the authors and do not necessarily represent those of their affiliated organizations, or those of the publisher, the editors and the reviewers. Any product that may be evaluated in this article, or claim that may be made by its manufacturer, is not guaranteed or endorsed by the publisher.
Footnotes
- ^ It may be more realistic to assume that each fisher has a unique catchability coefficient, but we lack the data to estimate individual coefficients so assume an average catchability coefficient for each vessel that operates in the management unit.
- ^ Datasets were provided by the GLFC Yellow Perch Task Group but are also available in the form of annual reports via http://www.glfc.org/lake-erie-committee.php
References
Arnason, R. (1990). Minimum information management in fisheries. Can. J. Econ. 23:630. doi: 10.2307/135652
Asche, F., Bjorndal, T., and Gordon, D. V. (2009). Resource rent in individual quota fisheries. Land Econ. 85, 279–291. doi: 10.3368/le.85.2.279
Bjørndal, T., and Conrad, J. M. (1987). The dynamics of an open access fishery. Can. J. Econ. 20, 74–85. doi: 10.2307/135232
Brockmann, S., Zhang, H., Mason, D. M., and Rutherford, E. S. (2021). Space and species interactions in welfare estimates for invasive species policy. Front. Ecol. Evol. 9:703935. doi: 10.3389/fevo.2021.703935
Brodziak, J., and Link, J. (2002). Ecosystem-based fishery management: what is it and how can we do it? Bull. Mar. Sci. 70, 589–611.
Christensen, V., and Walters, C. J. (2004). Ecopath with Ecosim: methods, capabilities and limitations. Ecol. Model. 172, 109–139. doi: 10.1016/j.ecolmodel.2003.09.003
Clark, C. W. (1980). Towards a predictive model for the economic regulation of commercial fisheries. Can. J. Fish. Aquat. Sci. 37, 1111–1129. doi: 10.1139/f80-144
Clark, C. W. (2007). The Worldwide Crisis in Fisheries: Economic Models and Human Behavior. Cambridge: Cambridge University Press.
Dichmont, C. M., Deng, A., Punt, A. E., Ellis, N., Venables, W. N., Kompas, T., et al. (2008). Beyond biological performance measures in management strategy evaluation: bringing in economics and the effects of trawling on the benthos. Fish. Res. 94, 238–250. doi: 10.1016/j.fishres.2008.05.007
Dichmont, C. M., Pascoe, S., Kompas, T., Punt, A. E., and Deng, R. (2010). On implementing maximum economic yield in commercial fisheries. Proc. Natl. Acad. Sci. 107, 16–21. doi: 10.1073/pnas.0912091107
Finnoff, D., and Tschirhart, J. (2003). Harvesting in an eight-species ecosystem. J. Environ. Econ. Manage. 45, 589–611. doi: 10.11646/zootaxa.3936.3.6
Fulton, E. A., Fuller, M., Smith, A. D. M., and Punt, A. (2004). Ecological Indicators of the Ecosystem Effects of Fishing: Final Report.” No. RR/1546, Australian Fisheries Management Authority. Available online at: https://doi.org/10.4225/08/585c169120a95 (accessed August 17, 2021).
Fulton, E. A., Punt, A. E., Dichmont, C. M., Harvey, C. J., and Gorton, R. (2019). Ecosystems say good management pays off. Fish Fish. 20, 66–96. doi: 10.1111/faf.12324
Fulton, E. A., Smith, A. D. M., Smith, D. C., and Johnson, P. (2014). An integrated approach is needed for ecosystem Based fisheries management: insights from ecosystem-level management strategy evaluation. PLoS One 9:e84242. doi: 10.1371/journal.pone.0084242
Gopalan, G., Culver, D. A., Wu, L., and Trauben, B. K. (1998). Effects of recent ecosystem changes on the recruitment of young-of-the-year fish in western Lake Erie. Can. J. Fish. Aquat. Sci. 55, 2572–2579. doi: 10.1139/f98-130
Holsman, K. K., Ianelli, J., Aydin, K., Punt, A. E., and Moffitt, E. A. (2016). A comparison of fisheries biological reference points estimated from temperature-specific multi-species and single-species climate-enhanced stock assessment models. Deep Sea Res. Part II Top. Stud. Oceanogr. 134, 360–378. doi: 10.1016/j.dsr2.2015.08.001
Howell, D., Schueller, A. M., Bentley, J. W., Buchheister, A., Chagaris, D., Cieri, M., et al. (2021). Combining ecosystem and single-species modeling to provide ecosystem-based fisheries management advice within current management systems. Front. Mar. Sci. 7:1163. doi: 10.3389/fmars.2020.607831
Jennings, S., and Kaiser, M. J. (1998). The effects of fishing on marine ecosystems. Adv. Mar. Biol. 34, 201–352. doi: 10.1016/s0065-2881(08)60212-6
Jin, D., Hoagland, P., and Dalton, T. M. (2003). Linking economic and ecological models for a marine ecosystem. Ecol. Econ. 46, 367–385. doi: 10.1016/j.ecolecon.2003.06.001
Johnson, J. H., Ross, R. M., McCullough, R. D., and Edmonds, B. (2001). Diet composition and fish consumption of Doublecrested Cormorants from the Little Galloo Island colony of eastern Lake Ontario in 2000. NYSDEC Special Report, Section, 3, 1–7.
Kaplan, I. C., and Leonard, J. (2012). From krill to convenience stores: forecasting the economic and ecological effects of fisheries management on the US West Coast. Mar. Policy 36, 947–954. doi: 10.1016/j.marpol.2012.02.005
Kaplan, I. C., Levin, P. S., Burden, M., and Fulton, E. A. (2010). Fishing catch shares in the face of global change: a framework for integrating cumulative impacts and single species management. Can. J. Fish. Aquat. Sci. 67, 1968–1982. doi: 10.1139/f10-118
Kompas, T., Dichmont, C. M., Punt, A. E., Deng, A., Che, T. N., Bishop, J., et al. (2010). Maximizing profits and conserving stocks in the Australian Northern Prawn fishery: maximizing profits and conserving stocks. Austr. J. Agric. Resour. Econ. 54, 281–299. doi: 10.1111/j.1467-8489.2010.00493.x
Latour, R. J., Brush, M. J., and Bonzek, C. F. (2003). Toward ecosystem-based fisheries management: strategies for multispecies modeling and associated data requirements. Fisheries 28, 10–22. doi: 10.1577/1548-8446(2003)28[10:tefm]2.0.co;2
Lotze, H. K. (2004). Repetitive history of resource depletion and mismanagement. Mar. Ecol. Prog. Ser. 274, 282–285.
MacDougall, T. (2001). Lake Erie 1998, Assessment of Abundance, Biomass and Production of the Lower Trophic Levels, Diets of Juvenile Yellow Perch and Trends in the Fishery. Burlington, ON: Bayfield Institute.
Murawski, S. A. (2000). Definitions of overfishing from an ecosystem perspective. ICES J. Mar. Sci. 57, 649–658. doi: 10.1006/jmsc.2000.0738
Nielsen, J. R., Thunberg, E., Holland, D. S., Schmidt, J. O., Fulton, E. A., Bastardie, F., et al. (2018). Integrated ecological–economic fisheries models—evaluation, review and challenges for implementation. Fish Fish. 19, 1–29. doi: 10.1007/978-90-481-2655-2_1
Pascoe, S., Vieira, S., Dichmont, C. M., and Punt, A. E. (2011). Optimal vessel size and output in the Australian northern prawn fishery: a restricted profit function approach∗: optimal vessel size and output in the Australian northern prawn fishery. Austr. J. Agric. Resour. Econ. 55, 107–125. doi: 10.1111/j.1467-8489.2010.00526.x
Péreau, J.-C., Doyen, L., Little, L. R., and Thébaud, O. (2012). The triple bottom line: meeting ecological, economic and social goals with individual transferable quotas. J. Environ. Econ. Manage. 63, 419–434. doi: 10.1016/j.jeem.2012.01.001
Pikitch, E., Santora, C., Babcock, E., Bakun, A., Bonfil, R., Conover, D., et al. (2004). Ecosystem-based fishery management. Science 305, 346–348.
Pitcher, T., and Cochrane, K. (2002). The Use of Ecosystem Models to Investigate Multispecies Management Strategies for Capture Fisheries.” Fisheries Centre Research Reports No. 10–2. Available online at: http://agris.fao.org/agris-search/search.do?recordID=XF2015024379 (accessed June 7, 2016)
Punt, A. E., Deng, R. A., Dichmont, C. M., Kompas, T., Venables, W. N., Zhou, S., et al. (2010). Integrating size-structured assessment and bioeconomic management advice in Australia’s northern prawn fishery. ICES J. Mar. Sci. 67, 1785–1801. doi: 10.1093/icesjms/fsq037
Roberts, J. J., Höök, T. O., Ludsin, S. A., Pothoven, S. A., Vanderploeg, H. A., and Brandt, S. B. (2009). Effects of hypolimnetic hypoxia on foraging and distributions of Lake Erie yellow perch. J. Exp. Mar. Biol. Ecol. 381, S132–S142.
Rose, K. A., Rutherford, E. S., McDermot, D. S., Forney, J. L., and Mills, E. L. (1999). Individual-based model of yellow perch and walleye populations in Oneida Lake. Ecol. Monogr. 69, 127–154. doi: 10.2307/2657234
Roswell, C. R., Pothoven, S. A., and Höök, T. O. (2013). Spatio-temporal, ontogenetic and interindividual variation of age-0 diets in a population of yellow perch. Ecol. Freshw. Fish 22, 479–493. doi: 10.1111/eff.12041
Rutherford, E. S., Rose, K. A., Mills, E. L., Forney, J. L., Mayer, C. M., and Rudstam, L. G. (1999). Individual-based model simulations of a zebra mussel (Dreissena polymorpha) induced energy shunt on walleye (Stizostedion vitreum) and yellow perch (Perca flavescens) populations in Oneida Lake, New York. Can. J. Fish. Aquat. Sci. 56, 2148–2160. doi: 10.1139/f99-133
Schaefer, M. B. (1954). Some aspects of the dynamics of populations important to the management of the commercial marine fisheries. Inter Am. Trop. Tuna Comm. Bull. 1, 23–56.
Schaefer, M. B. (1957). Some considerations of population dynamics and economics in relation to the management of the commercial marine fisheries. J. Fish. Res. Board Can. 14, 669–681. doi: 10.1139/f57-025
Smith, M. D., Fulton, E. A., and Day, R. W. (2015). An investigation into fisheries interaction effects using Atlantis. ICES J. Mar. Sci. 72, 275–283. doi: 10.1093/icesjms/fsu114
Truemper, H. A., Lauer, T. E., McComish, T. S., and Edgell, R. A. (2006). Response of yellow perch diet to a changing forage base in southern Lake Michigan, 1984- 2002. J. Great Lakes Res. 32, 806–816. doi: 10.3394/0380-1330(2006)32[806:roypdt]2.0.co;2
Keywords: fisheries management, bioeconomics, socio-economic feedbacks, food web modeling, natural resource economics
Citation: Lee K, Apriesnig J and Zhang H (2021) Socio-Ecological Outcomes of Single-Species Fisheries Management: The Case of Yellow Perch in Lake Erie. Front. Ecol. Evol. 9:703813. doi: 10.3389/fevo.2021.703813
Received: 30 April 2021; Accepted: 20 October 2021;
Published: 25 November 2021.
Edited by:
Martin Drechsler, Helmholtz Centre for Environmental Research (UFZ), GermanyReviewed by:
Andre Eric Punt, University of Washington, United StatesHeidi J. Albers, University of Wyoming, United States
Copyright © 2021 Lee, Apriesnig and Zhang. This is an open-access article distributed under the terms of the Creative Commons Attribution License (CC BY). The use, distribution or reproduction in other forums is permitted, provided the original author(s) and the copyright owner(s) are credited and that the original publication in this journal is cited, in accordance with accepted academic practice. No use, distribution or reproduction is permitted which does not comply with these terms.
*Correspondence: Katherine Lee, a2F0aGVyaW5lbGVlQHVpZGFoby5lZHU=