 Julio Mercader1,2,3*
 Siobhán Clarke1Makarius Itambu4
 Abdallah Mohamed4Musa Mwitondi4Gunnar Siljedal1
 María Soto5,6Pastory Bushozi3
- 1Department of Anthropology and Archaeology, University of Calgary, Calgary, AB, Canada
- 2Institut Català de Paleoecologia Humana i Evolució Social, Tarragona, Spain
- 3Max Planck Institute for the Science of Human History, Jena, Germany
- 4Department of Archaeology and Heritage, University of Dar es Salaam, Dar es Salaam, Tanzania
- 5Madrid Institute for Advanced Studies (MIAS), Madrid, Spain
- 6Department of Prehistory and Archaeology, Universidad Autónoma de Madrid, Madrid, Spain
The rock shelter site of Mumba in northern Tanzania plays a pivotal role in the overall study of the late Pleistocene archaeology of East Africa with an emphasis on the Middle to Later Stone Age transition. We used phytolith analysis to reconstruct general plant habitat physiognomy around the site from the onset of the late Pleistocene to recent times, tallying 4246 individual phytoliths from 19 archaeological samples. Statistical analysis explored phytolith richness, diversity, dominance, and evenness, along with principal components to compare phytolith distributions over the site’s sequence with known plant habitats today. Generally, the phytolith record of Mumba signifies paleoenvironments with analogs in the Somalia – Masai bushland and grassland, as well as Zambezian woodlands.
Introduction
The prehistoric industries from the Tanzanian rock shelter of Mumba have been foundational to model the transition from the Middle Stone Age (MSA) to the Later Stone Age (LSA) in sub-Saharan Africa, with the Mumba stratigraphy playing a pivotal role in the overall study of the late Pleistocene archaeology of East Africa (Mehlman, 1989; McBrearty and Brooks, 2000; Prendergast et al., 2007; Diez-Martín et al., 2009; Gliganic et al., 2012; Tryon and Faith, 2013; Bushozi et al., 2017, 2020; Tryon, 2018; Blinkhorn and Eren, 2020). It is currently unknown if there was environmental causality behind the MSA/LSA shift, but different models place variable emphasis on climatic deterioration (McBrearty and Brooks, 2000), the existence of biogeographic havens (Bushozi et al., 2020), and moisture increase/cycling (Blome et al., 2012; Eren et al., 2013). Yet, the linking of climate change with specific cultural transformations at Mumba has been challenging for many reasons (Gliganic et al., 2012), such as the extreme variability in East African climate since the last interglacial (Cohen et al., 2007; Vincens et al., 2007; Tierney et al., 2008; Blome et al., 2012; Beverly et al., 2017), the asynchronous nature of environmental change (Trauth et al., 2001; Garcin et al., 2006; Brown et al., 2007; Mumbi et al., 2008; Blome et al., 2012), and the existence of uneven regional habitats (Beuning et al., 2011; Mercader et al., 2013; Wright et al., 2016; Nightingale et al., 2019).
Although archaeologists and geneticists assume that environmental change since the last interglacial structured demography, human ecology, and cultural complexity (see review of climate drivers in Timmermann and Friedrich, 2016), no paleoenvironmental data directly associated with the archaeological materials from Mumba is available to prove these assumptions. This problem is far from restricted to this particular archaeological site. Key East African stratigraphic sequences encompassing the late Pleistocene lack vegetation data to identify the environmental context of human occupation in its corresponding biogeographical zone, floristic domain, and in reference to the changing ecological niche that any occupation focal point would have had for its occupants over more than 100,000 years (Tryon and Faith, 2013); with exceptions (Shipton et al., 2018).
This paper provides new palaeoenvironmental data from the long stratified sequence of Mumba. We study phytogenic silica particles, known as phytoliths, extracted from throughout Mumba’s stratigraphy, spanning the late Pleistocene and Holocene; being the first time that this kind of data is associated with this site’s archaeology and therefore an important addition to the research of the MSA/LSA in East Africa. Although a concurrent analysis of several ecological proxies would be ideal, at this time we focus on one proxy only, and do not have information on the associated fauna or other environmental indicators such as pollen, which will be published separately by other teams.
Geography
The study area is located in northern Tanzania (Figure 1B), along the East African Rift System, specifically the Eyasi — Wembere rift. It lies 200 km southeast of Lake Victoria and 600 km northwest of Lake Tanganyika and Lake Malawi (Figure 1A). Mumba is NE of Lake Eyasi, 4 km away from its current shoreline (Figures 1B,C). The lake is shallow, subsaline (2.39‰), and alkaline (pH 9.5) (Schagerl and Renault, 2016). When completely dry, the lakebed suffers deflation (Scoon, 2018). Topography is structured by the Neogene rift valley and escarpment (Ebinger et al., 1997), which in turn regulates moisture regime and biogeography. Relief gradients, climatic fluctuations, and local ecology have driven vegetation physiognomy and composition, enduring extremely variable conditions since the Pleistocene (Schagerl and Burian, 2016). Rainfall is 500–760 mm per year, supporting diverse plant formations such as woodland, grassland, and swamp adapted herbs and palms (Greenway and Vesey-Fitzgerald, 1969), along with halophytic plants (Kindt et al., 2011). Two main eco-physiognomies interdigitate in the study area (Figure 2A): (i) Somalia – Masai, Acacia – Commiphora woodland and (ii) wooded grassland (White, 1983).
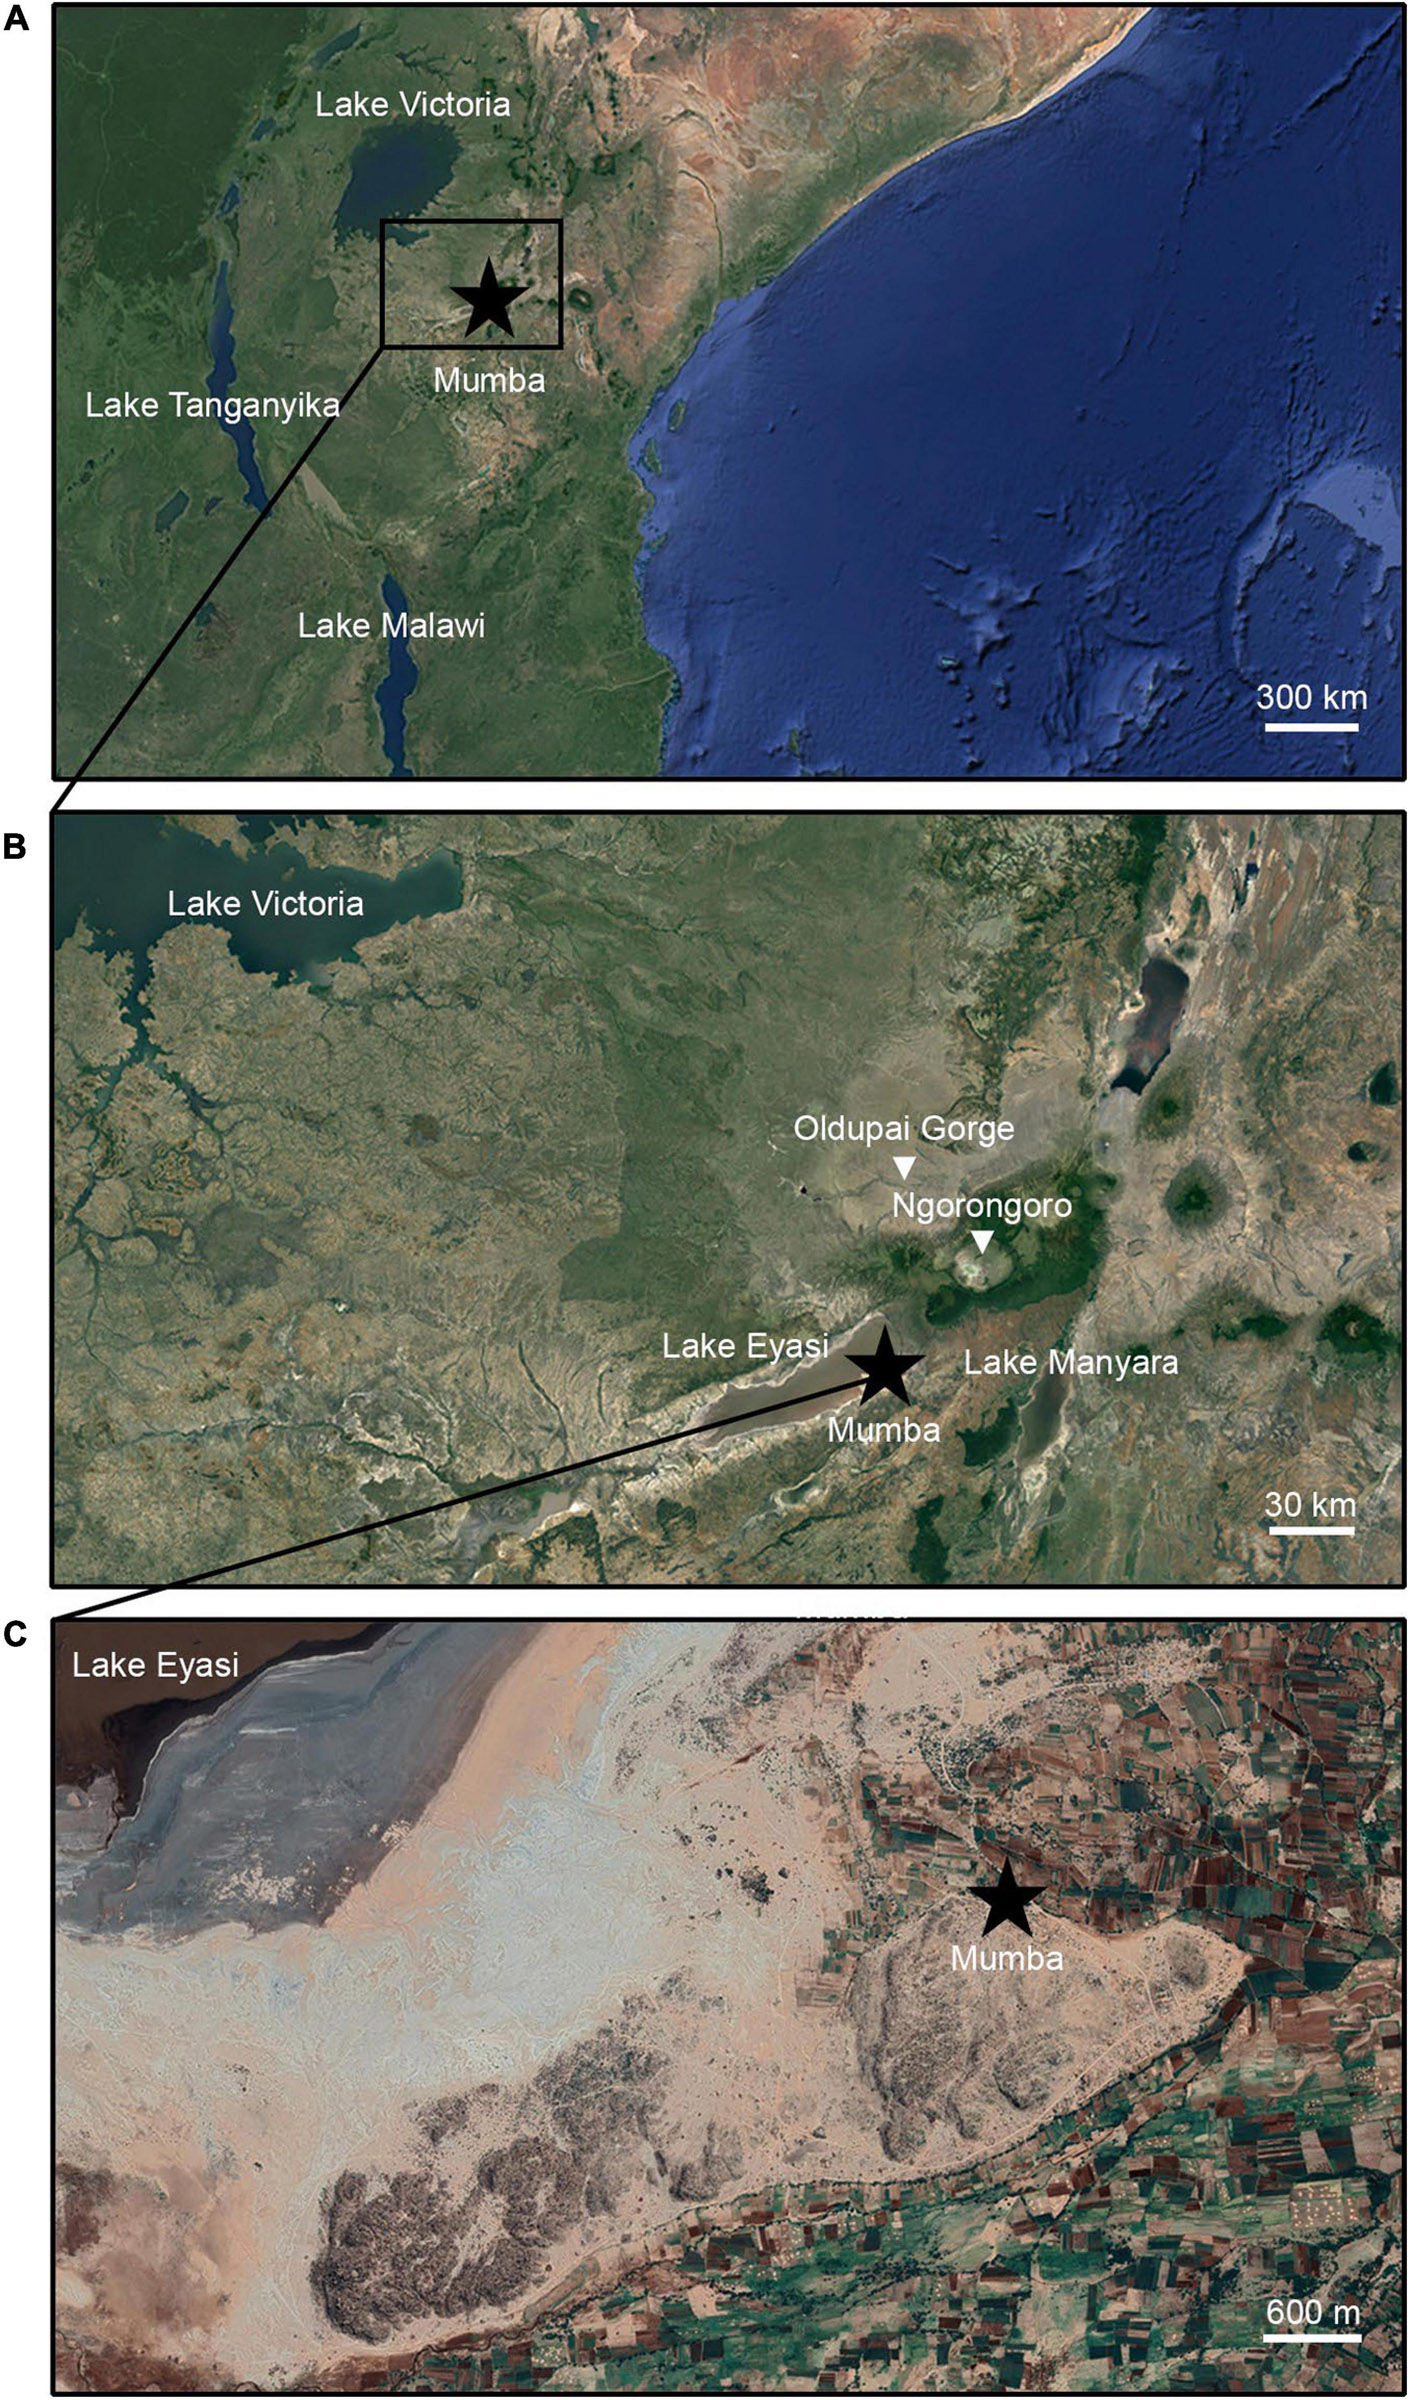
Figure 1. Location of Mumba. (A) Position of the site relative to the East African Rift System and major lakes mentioned in the text. (B) The site of Mumba near Lake Eyasi in regional context. (C) Geological outcrop where Mumba is found.
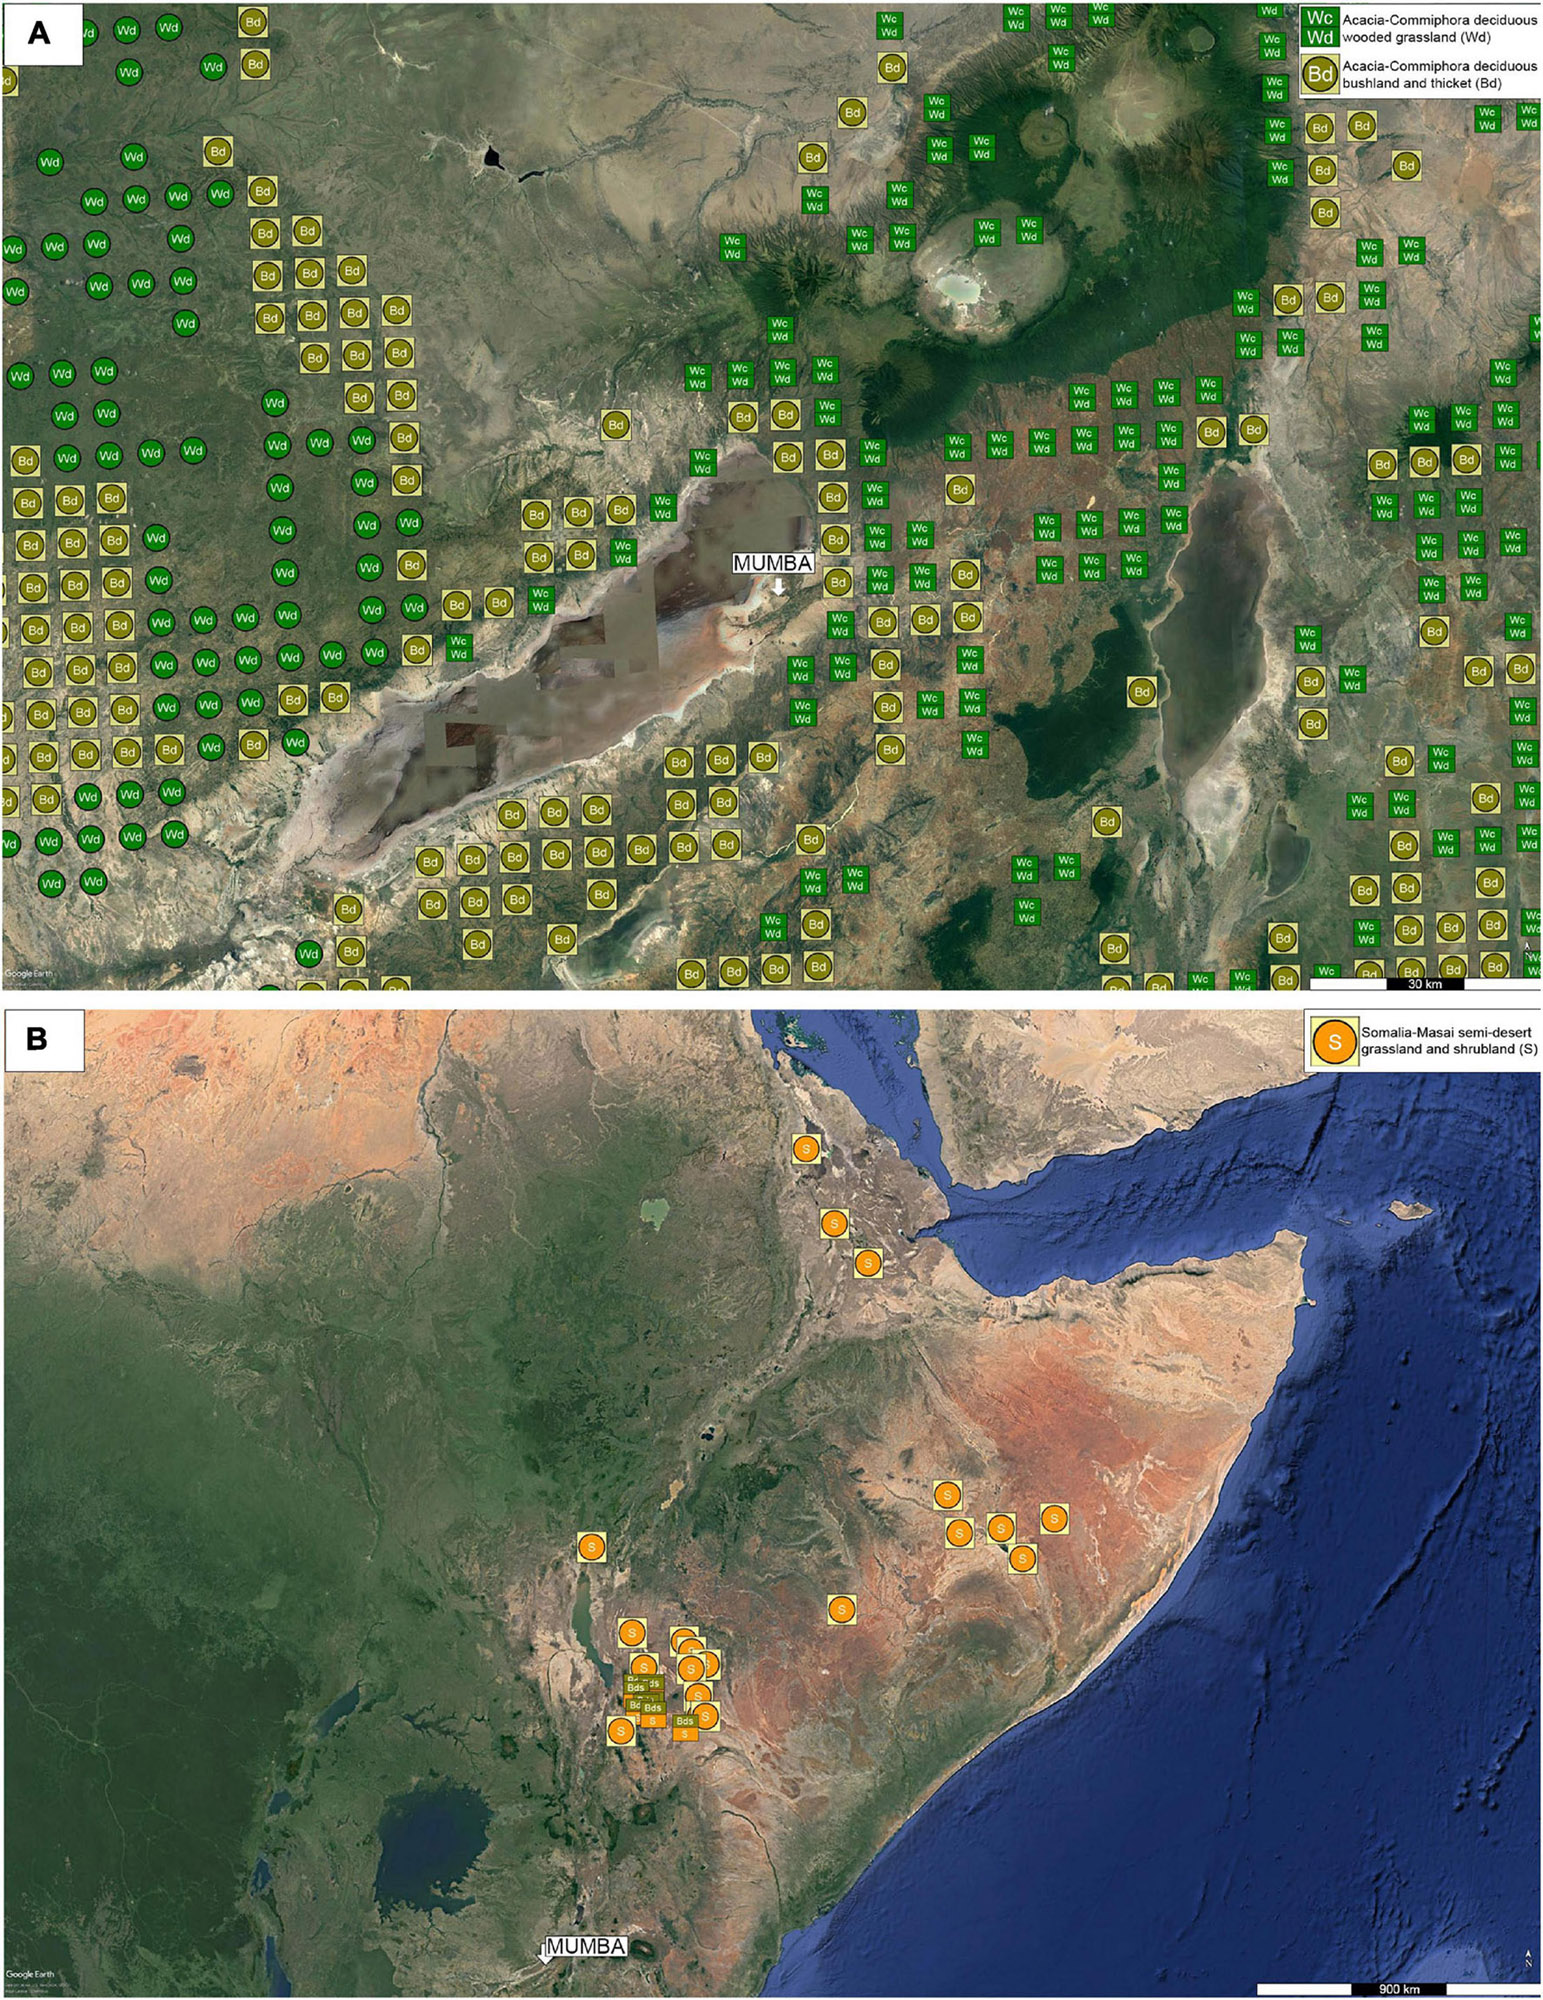
Figure 2. Natural vegetation in the study area according to Kindt et al. (2011). (A) Mosaic distribution of Somalia-Masai Acacia-Commiphora woodland along with wooded grassland engulfing Lake Eyasi and adjacent areas. (B) Location of Somalia-Masai semi-desert shrubland (Google Earth, earth.google.com/web/).
Site and Stratigraphy
Mumba is in a diorite/gneiss outcrop located at ∼1050 m above sea level (35° 17′ 48″ E/3° 32′ 18″ S) (Figures 1, 3). The rock shelter has an open layout and no dark areas. The absence of moisture in the innermost part of the cavity prevents plants from growing in this sector. However, like it occurs in other granitoid shelters from adjacent biomes (Mercader et al., 2003), vegetation coats the rock outcrop all around it, up to the dripline, and over onto the talus (Figure 3): Lithophytes are present. Trees and shrubs grow in the soil that developed in crevices along the outcrop’s ridge. Commelinaceae herbs grow by the water pools formed in small dissolution basins. Commiphora trees colonize the top of the rock outcrop itself, while several other members from the Acacia – Commiphora biome flourish around the rock shelter, with Sporobolus grasses and Adansonia digitata established along the dripline. Past work shows that, in equatorial Africa, late Pleistocene igneous rock shelters harbor phytolith records that accumulate after plant matter from natural growth and human activity fall inside the shelter by slope gravity and rainwash (e.g., Mercader et al., 2000); therefore denoting localized autochthonous deposition combining natural and anthropogenic agency.
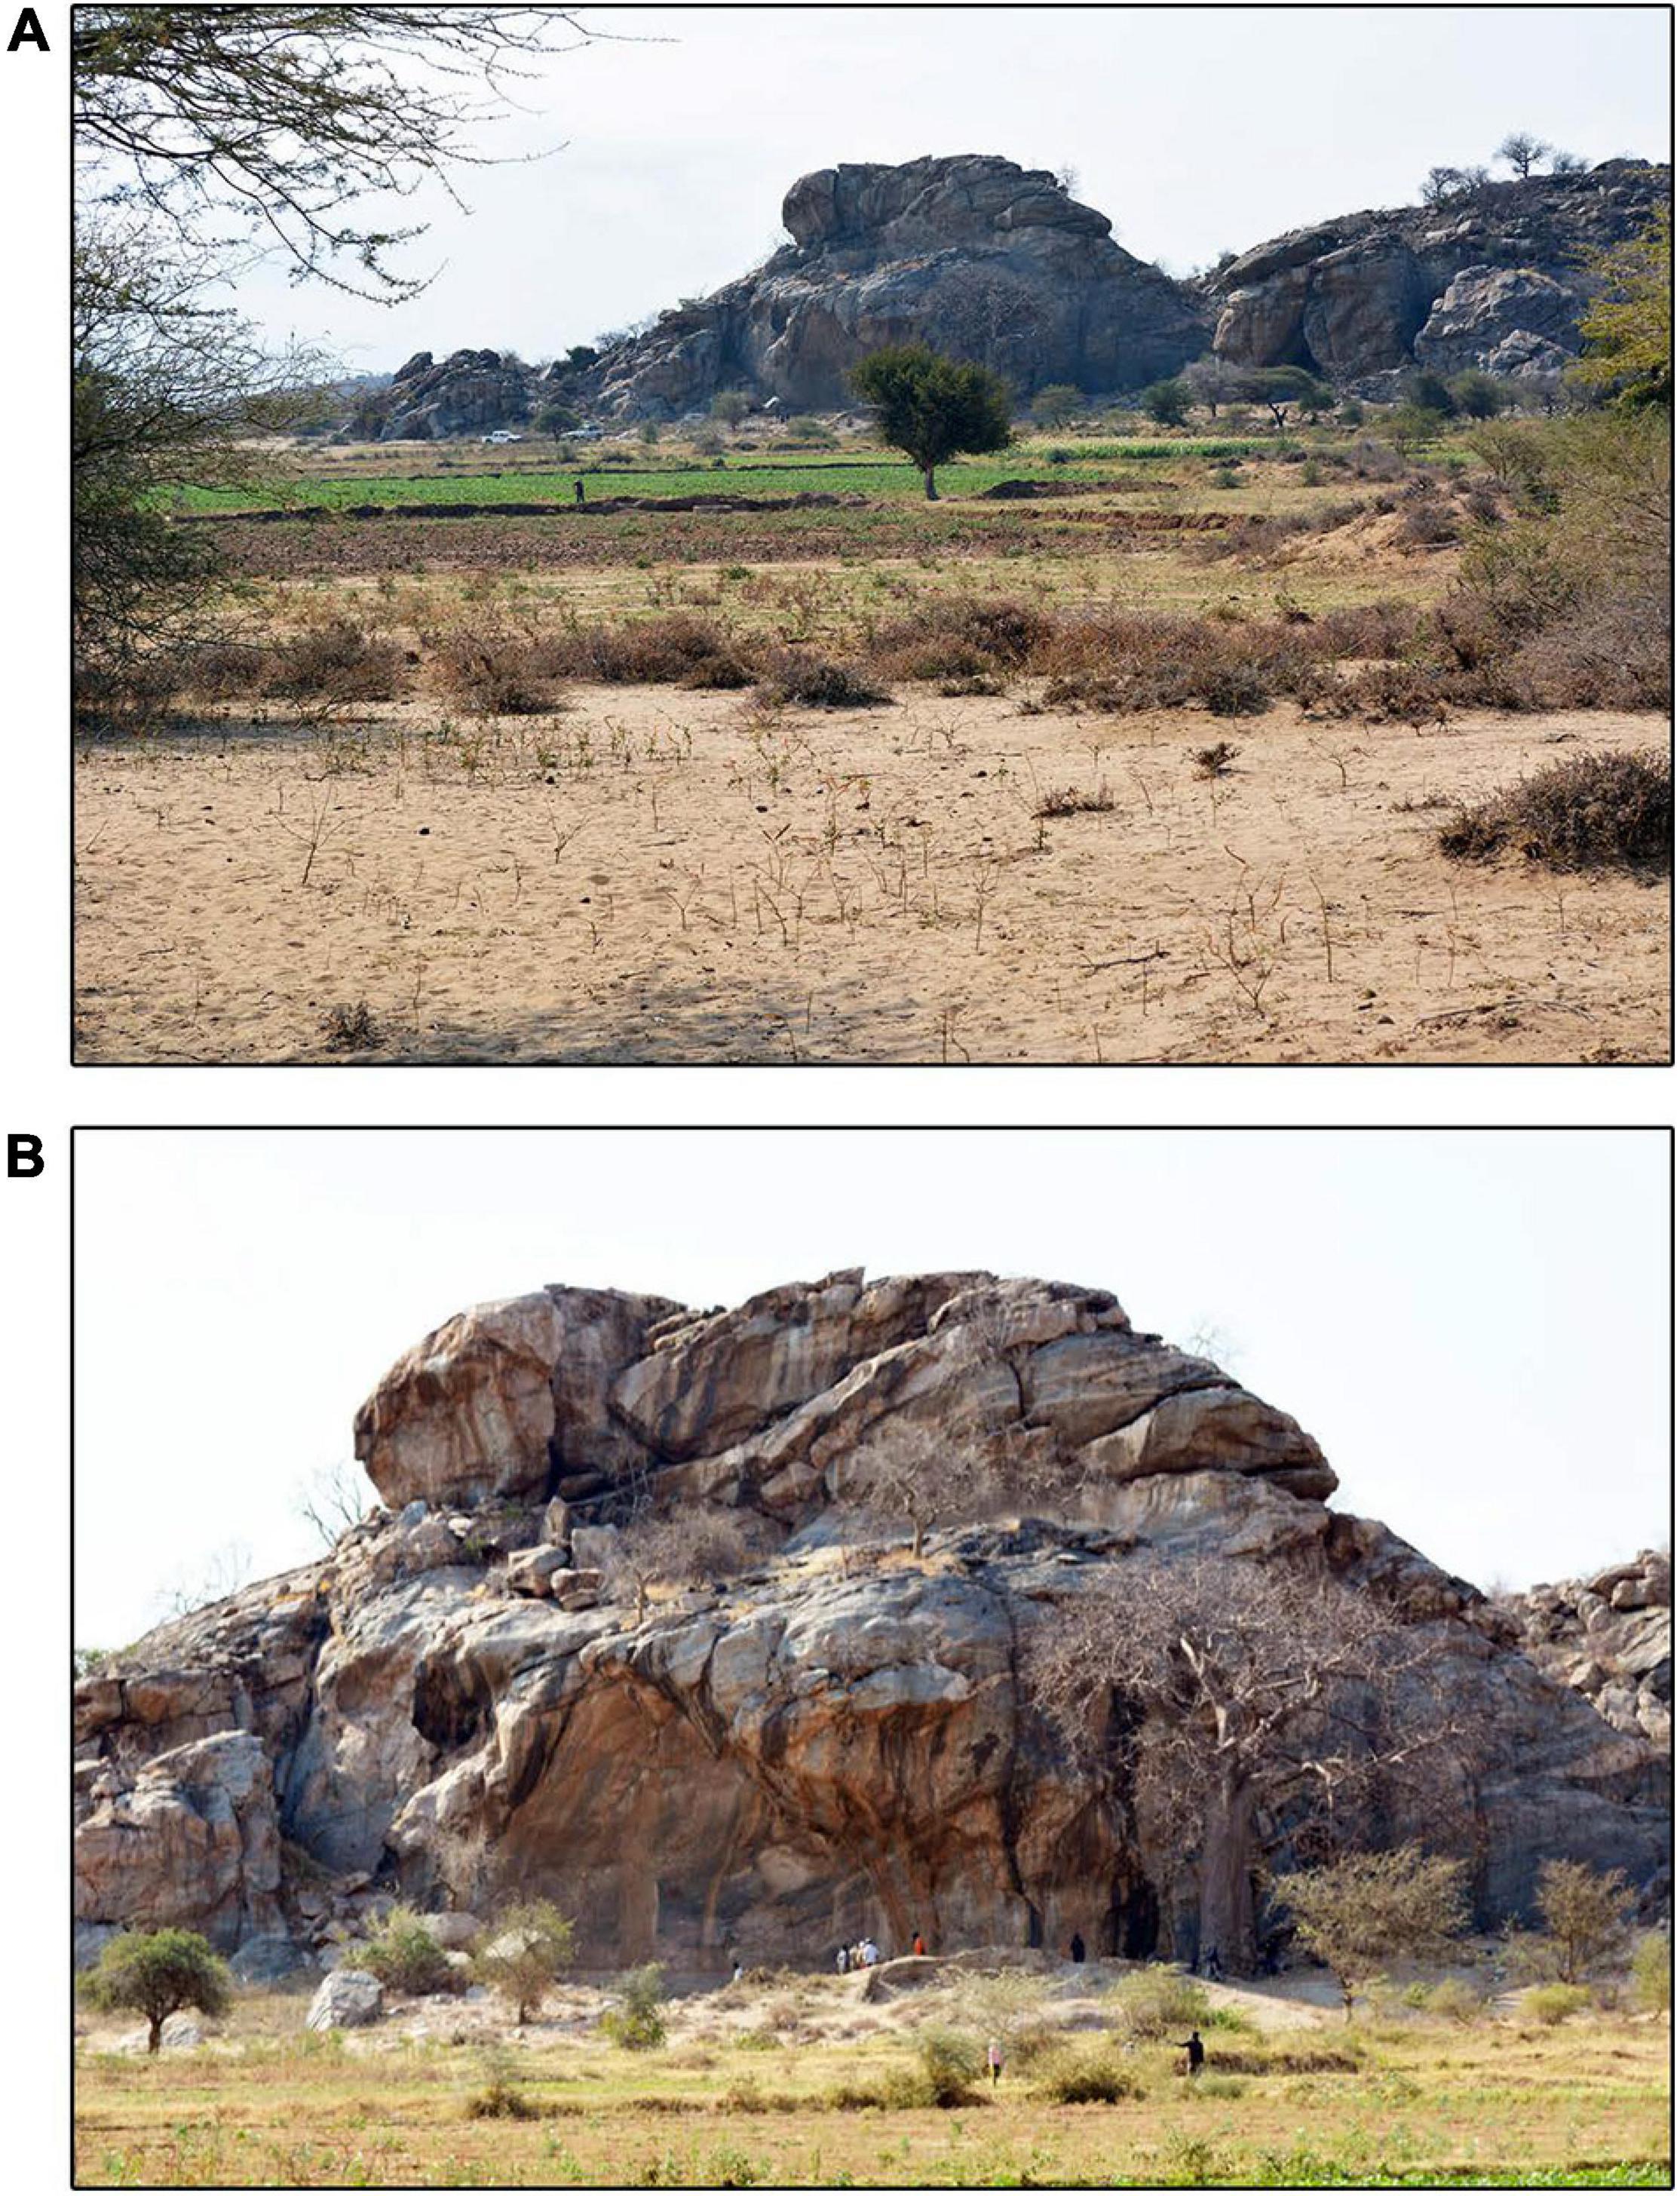
Figure 3. Ground views of the geological outcrop and rock shelter where the site of Mumba is located. (A) From the north, the view reveals the palaeofan from the Barai river. (B) Vegetation today grows all around the rock shelter, up to the dripline.
Kohl-Larsen (1943) excavated the archaeological site in the 1930s, removing the majority of its deposits. Since then, the site has been subject to numerous research expeditions, and we refer the reader to the original sources for detailed stratigraphic, archaeological, and chronometric information (Mehlman, 1979; Prendergast et al., 2007; Gliganic et al., 2012; Bushozi et al., 2017, 2020; Mwitondi, 2021). A Tanzanian team led by one of us (PB) excavated the sedimentary column studied here in 2014 (Figure 4); designated as Trench 9, situated in the western rock shelter (Bushozi et al., 2017: Figure 2), placed between the excavation pits from Prendergast et al. (2007), and sampled for phytolith analysis during 2018.
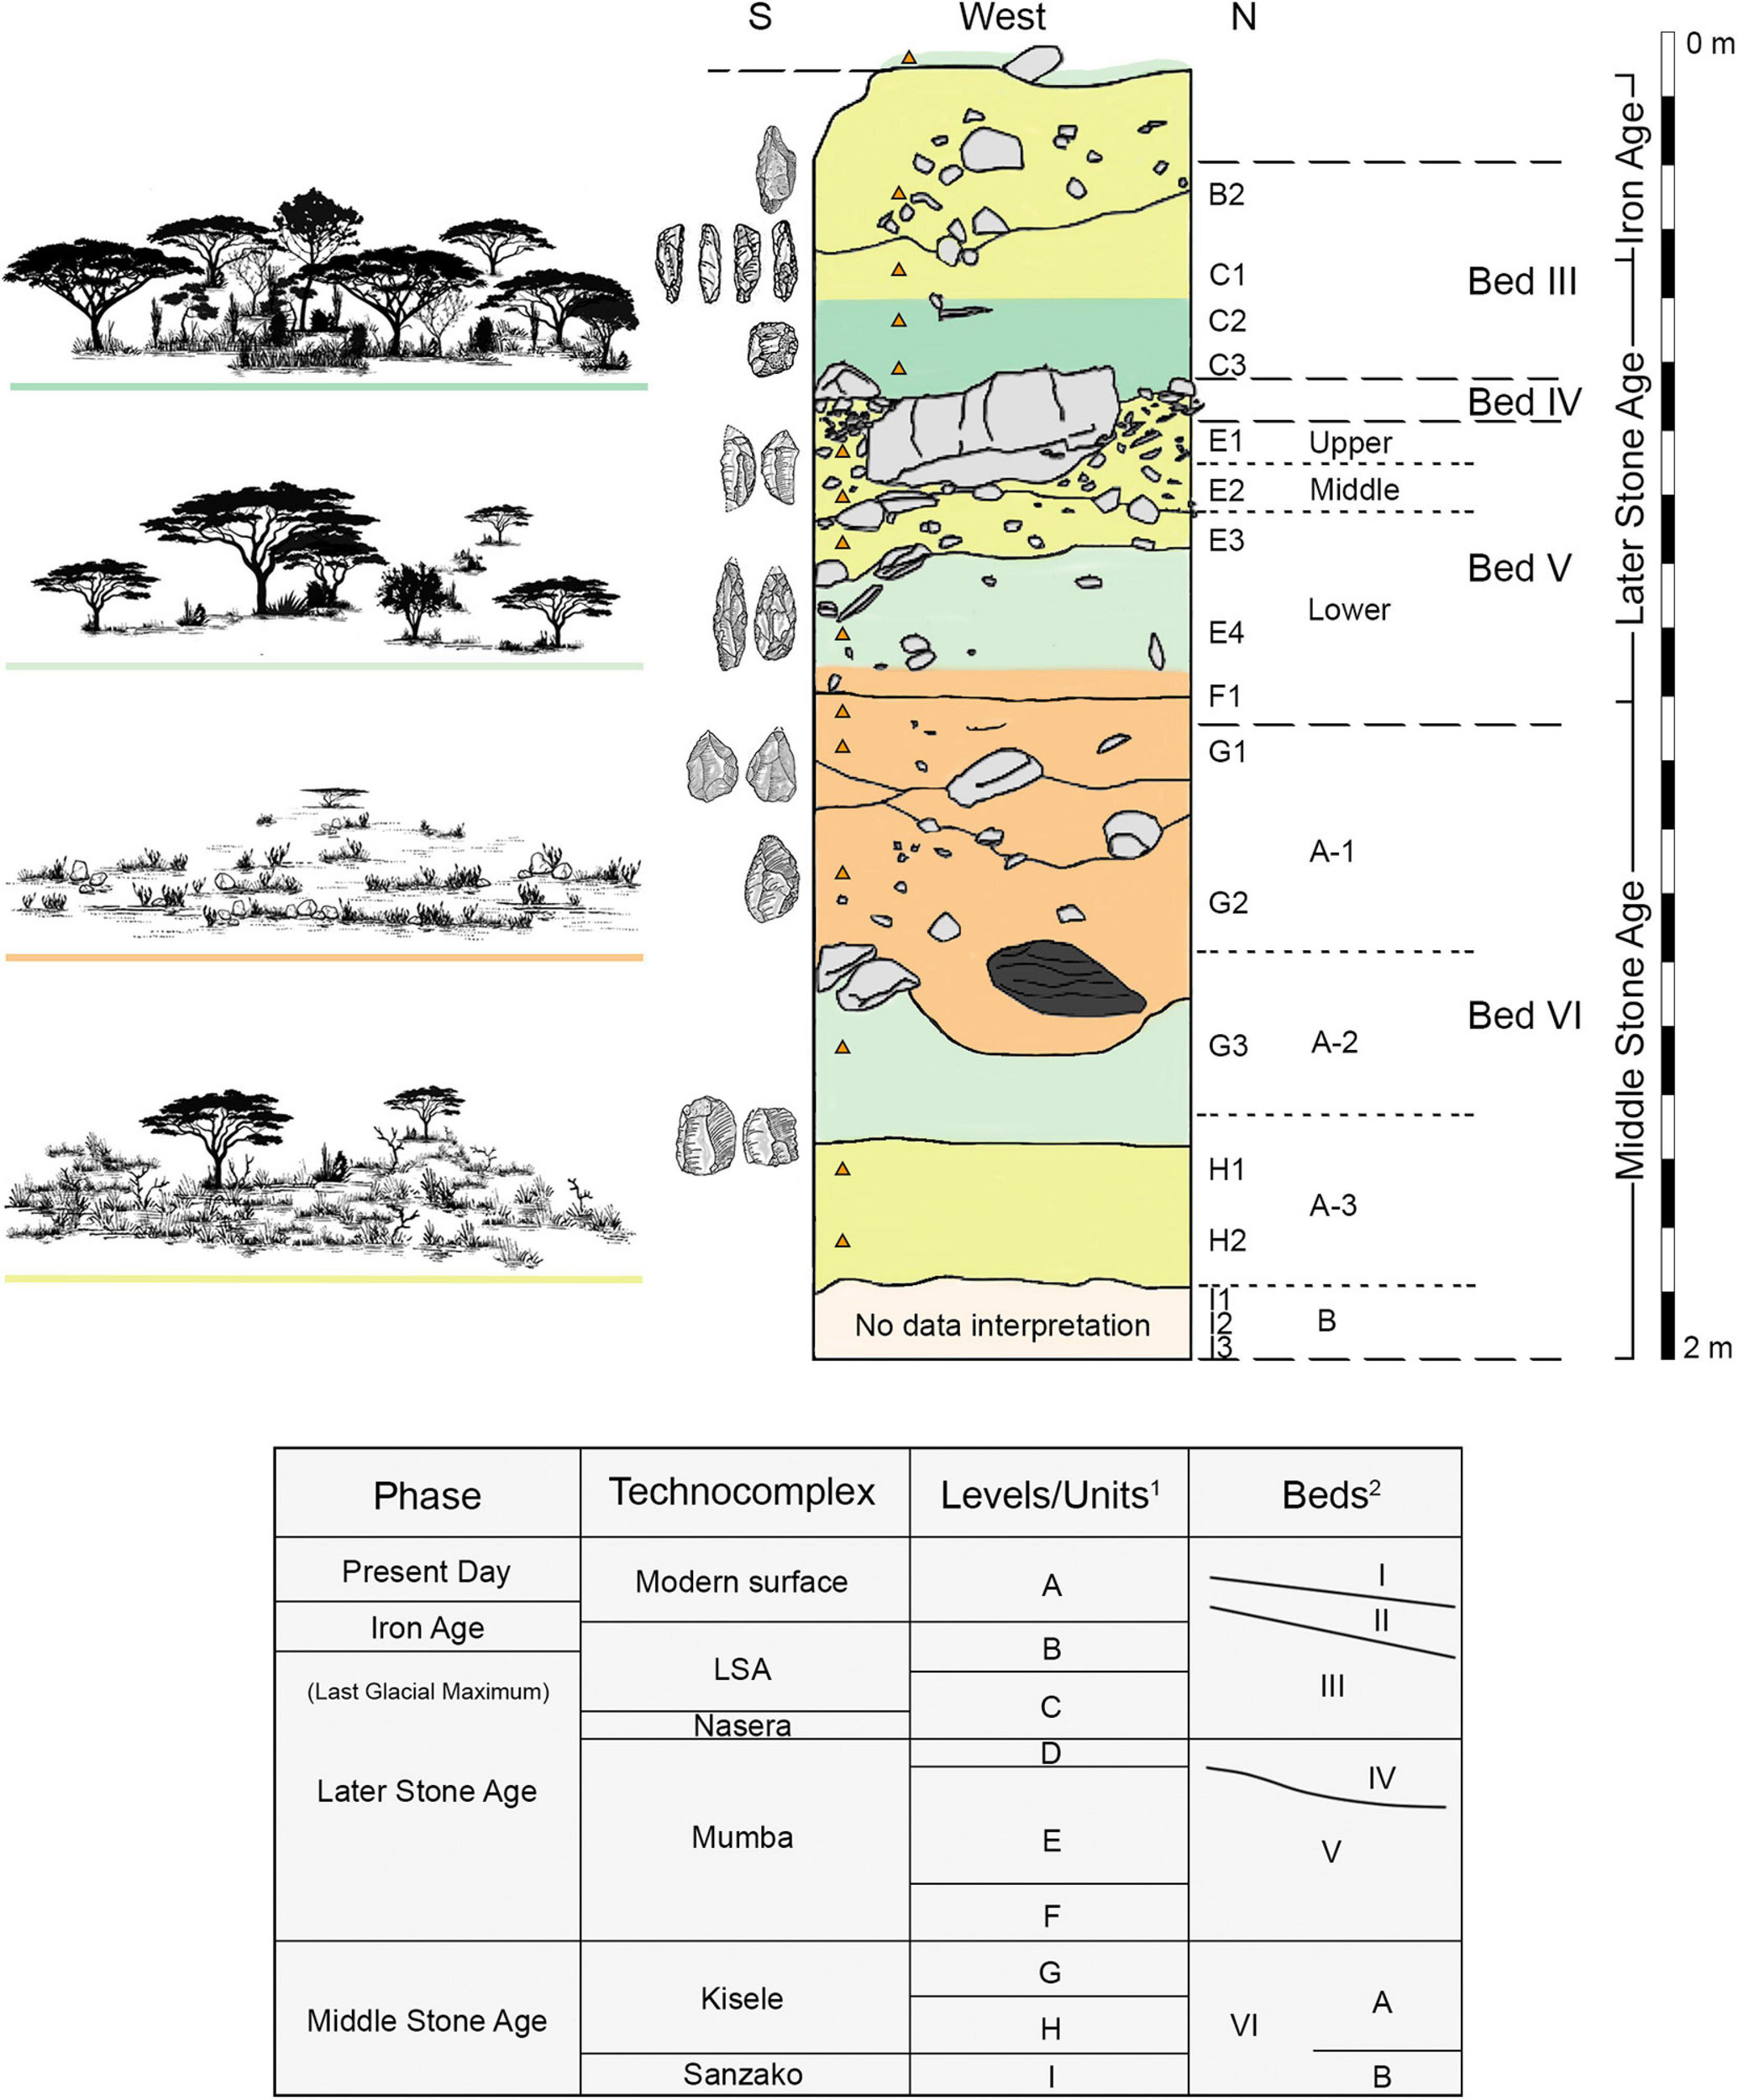
Figure 4. (Upper Box) Center: Trench 9 showing sample location (orange triangle). Letters designate geological units, while numerals refer to sample number within the unit. Mehlman’s 1989 nomenclature for Mumba’s sedimentary beds (right) are listed as well as the culture history affiliation throughout the stratigraphy with selected examples of excavated stone tools per phase. Left: Artist rendering of general vegetation physiognomy informed by phytolith analysis. (Lower Box) Nomenclature equivalents modified from 1 Prendergast et al. (2007) and Luque (2014); 2 Mehlman (1989).
Sampling followed the sedimentological and lithological criteria detailed by the project’s geoscientist (Luque, 2014). The sediments utilized in this paper were collected after cleaning the column’s face from top to bottom, then sampling from bottom to top. Each sample was extracted out of an area measuring approximately 10 cm (length) × 10 cm (depth into the wall) × 3 cm (height). We ensured that each sample consisted of undisturbed sediment and avoided boundaries and bioturbations such as burrows. (A list of the samples analyzed, their stratigraphic provenance, correlative beds and industries, age, dominant lithology, and sedimentary environments are in Table 1). We use interchangeably Mumba’s stratigraphic nomenclature (Figure 4) of Prendergast et al. (2007), in which, from top to bottom, units B through I represent Mehlman’s Beds III through VI-B (1989).
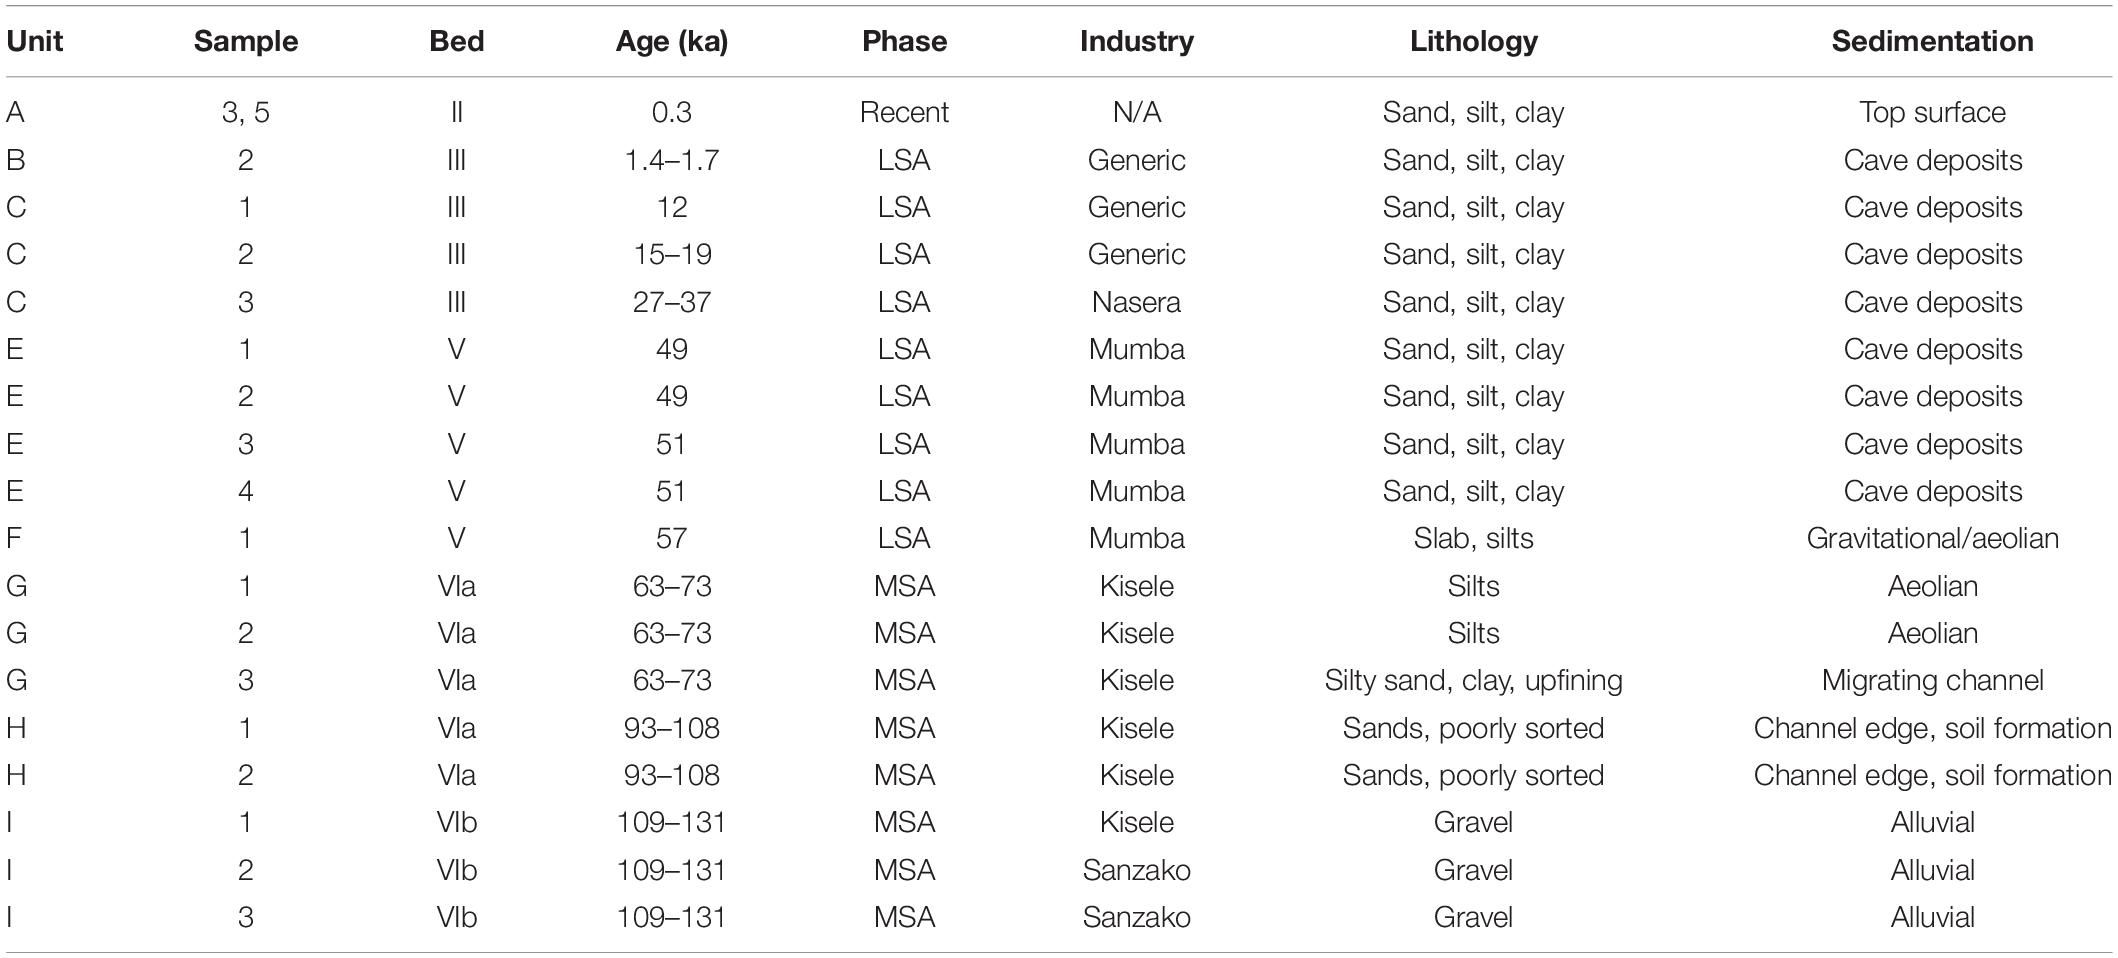
Table 1. Samples studied in this article: stratigraphic provenance, age, cultural affiliation, and sedimentary characteristics.
Paraphrasing the available sedimentological analyses (Luque, 2014; Bushozi et al., 2017, 2020), unit C consists of very fine sands and silts that accumulated 37 ka–12 ka containing LSA industries. Level E includes sandy, silty, and loamy beds housing part of the Mumba industry, with an age of 49–51 ka. Level F’s cultural materials are attributed to the Mumba industry as well (57 ka). Levels G and H contain industrial remains from the MSA industry known as ‘Kisele.’ Level G (63–73 ka) supports two facies, with an uppermost expression in Bed VI-A1 (sandy silt), and a lower one in a clayey horizon that constitutes Bed VI-A2. Level H (Bed VI-A3) is composed of poorly sorted sands and silts that deposited from 93 to 108 ka. Lastly, level VI-B was laid down between 131 and 109 ka and it is made up of gravel intermixed with lithics from the MSA complex called Sanzako. The sedimentary environments to note for phytolith interpretation, in culture history perspective, are from top to bottom (Luque, 2014; Bushozi et al., 2017, 2020):
(i) Granitoid wall collapse and gravity sedimentation:
• Recent deposits (unit A)
• Iron Age (unit B)
• LSA (early Holocene, C1)
• LSA (last glacial maximum, C2; Nasera, C3)
(ii) Intra-shelter gravity sedimentation and periods of intra-basin aeolian deposition:
• Mumba industry (units E – F)
• Kisele (G-1/2)
(iii) Floodplain deposits (lacustrine/meandering belt):
• Kisele (G3, H)
(iv) Fluvial channel from adjacent palaeodelta:
• Middle Pleistocene MSA: Sanzako (I).
The column sediments processed for phytolith analysis came from a trench whose lithic contents from the MSA and LSA have been published by Bushozi et al. (2017, 2020), while the materials from the final Pleistocene to Holocene phases, as well as the Iron Age artifacts, are part of an upcoming doctoral dissertation by one of us (MS). Concerning the LSA’s Mumba Industry, Bushozi et al. (2020) noted that core reduction features radial, simple platform, bipolar, and amorphous cores. Implements included modified blades, points, various scrapers, backed pieces for composite tools, together with beads and ochre. The MSA’s Kisele repertoire (Bushozi et al., 2020) shows core reduction led by radial types, followed by single platform, bipolar, and amorphous cores. Formal tools consist of scrapers, points, and backed pieces. Therefore, Kisele and early Mumba industries used similar lithic reduction and tool types, without solution of continuity from the late MSA into the initial LSA.
Materials and Methods
Phytolith Extraction and Classification
Phytolith extraction was completed at the University of Calgary’s Clean Room Laboratory (Earth Sciences Building, 811). Detailed protocols are available through the Federated Research Data Repository1. In summation, a 3.0 g aliquot of sediment was mixed with 10 mL of 0.1% sodium hexametaphosphate (NaPO3)6, followed by 15-min sonication and overnight orbital shaking at 200 rpm for clay dispersion. Samples were rinsed with reverse osmosis deionized (RODI) water and dried over 2 days at >70°C. Samples then received 10 mL equal parts 3N hydrochloric (HCl) and nitric acid (HNO3), were rinsed, centrifuged at 3,000 rpm, and dried over 2 days at >70°C to remove inorganics. Removal of organics was completed by adding 10 mL of 30% hydrogen peroxide over a hot plate (70°C), with rinsing, drying, and weighing using a precision balance. Separation of phytoliths occurred through the addition of 5 mL sodium polytungstate at specific gravity 2.4 (3Na2WO4⋅ 9WO3⋅ H2O). Samples were vortexed and centrifuged at 3,000 rpm for 5 min. The resulting supernatant was transferred to new centrifuge tubes, and a gradual decrease in specific gravity over three sub-sets concentrated phytoliths into the third extract. Samples were rinsed with boiled RODI before two rounds of centrifugation at 4,500 rpm and the final drying (>70°C). Of this final fraction, an aliquot of 0.001 g was transferred using a glass pipette to a microscope slide, mounted with Entellan New, and inspected fresh to allow for rotation of phytoliths for 3D classification. Microscopy was performed at 40× using a Motic BA310E (Moticam 5.0, Motic Images Plus 3.0). Phytoliths from each sample were counted over three separate slides, each with an area of 600 mm2.
Phytolith nomenclature followed Madella et al. (2005), with exceptions. Supporting keys from pertinent African regions were consulted (e.g., Runge, 1999; Fahmy, 2008; Albert et al., 2009, 2015a; Barboni and Bremond, 2009; Neumann et al., 2009, 2017; Eichhorn et al., 2010; Novello et al., 2012; Collura and Neumann, 2017). It is generally accepted that phytolith-based environmental reconstruction resolves vegetation type, community, and habitat change over time (Strömberg et al., 2018). It is also agreed that multiplicity of phytolith production within the same plant, along with redundancy in shapes across unrelated taxa (e.g., Rovner, 1971; Mulholland, 1989; Fredlund and Tieszen, 1994), sometimes renders discrete taxonomic identification of some samples very challenging. In East Africa, woody dicots can rarely be identified beyond functional type (e.g., Mercader et al., 2009), while the grasses allow for subfamily identification (e.g., Barboni et al., 1999; Mercader et al., 2010; Albert et al., 2015a, b), with limitations (Barboni and Bremond, 2009). Regional analysis is especially effective at detecting shifts in the woodland/grassland interface (e.g., Barboni et al., 2007; Mercader et al., 2011), and although forests, woodlands, and grasslands all support trees, shrubs, herbs, and grasses, their respective phytolith assemblages vary greatly (Barboni et al., 2007). It is important to note that the African vegetation types used in phytolith analysis today are based on general physiognomy (White, 1983), not on species composition. Thus, we ground our interpretation in assemblages, not on the identification of any diagnostic phytolith shape in isolation.
For methodological consistency and feasibility, we restrict our quantitative comparative research to datasets boasting a high number of modern plant materials and soils. We excluded baselines that are restricted to a few samples, or report information whose data structure or ecological relatedness cannot be directly compared to Mumba’s phytolith spectrum. Calibration is from two geographical areas supporting analogs. These are the xeric Somalia – Masai woodland mosaics (29 plant species, 35 soils – Mercader et al., 2019, cf. Albert et al., 2015a) and the mesic Zambezian woodlands (116 plant species, 25 soils – Mercader et al., 2009, 2010, 2011). The parameters for comparison from these two regional spectra are as follows:
Mesic woodlands (Mercader et al., 2011) are characterized by dicot globular phytoliths (>50%) in cohort with Poaceae short cells, mostly in the Panicoid subfamily and led by short bilobates with convex ends. In contrast, the dry woodland/grassland mosaics of the Somalia – Masai ecozone (Mercader et al., 2019) are characterized by tabular and blocky phytoliths (>50%) with much scarcer globulars and lobates. Short cell assemblages are co-dominated by rondels, short saddles, and small bilobates with concave ends; with a total grass percent oscillating from about 25% in the Acacia – Commiphora woodland (Mercader et al., 2019) to about 65% in the wooded Serengeti grassland (Albert et al., 2015a).
Quantitative Analysis
We utilized several exploratory tests to analyze phytolith count distribution across samples, such as total abundance, morphotype richness, along with phytolith diversity index, dominance (1-Simpson index), and evenness (Simpson index 1-D). In addition, we checked for normality, and for phytolith distribution patterns across stratigraphic units through Kruskal–Wallis and Dunn’s post hoc tests.
To compare archaeological distributions with analogous baselines, we grouped all phytolith morphotypes per class. Two of the modern soil phytolith distributions came from large referential collections, and thus were bootstrapped (n = 1000) to retrieve a mean value for the 35 samples representing Acacia – Commiphora mosaics (Mercader et al., 2019) and the 25 samples indicative of Zambezian woodlands (Mercader et al., 2011).
Phytolith distributions were standardized by a Z-score, making archaeological and ecological samples comparable. Principal component analysis (PCA) determined variance across stratigraphic units. All quantitative analyses were conducted using the software ‘Past 3.24’ (Hammer et al., 2001).
Results
Overview
The total number of phytoliths tallied for this article is 4246, extracted from 19 archaeological samples (diatoms n = 2; sponge spicules n = 0) (Table 2 and Figure 5). The median number of phytoliths classified per sample is 274, with three samples (I1, I2, I3; Bed VI – B) yielding extremely low counts (<24 phytoliths) and excluded from our interpretation of palaeoenvironments. Four samples have counts <200 (range = 103–159), but we decided to use them as they still contain the same dominant morphotypes as samples with counts >200. Phytolith weathering in the form of random dissolution marks on recognizable phytolith shapes (Appendix Figure A1) is present in all samples, although the rate of partial dissolution is very low at 3%. Fragile silica morphologies, including composite/articulated bodies such as epidermal tissue masses (Figures 5e,h), mesophyll, sclereids, tracheids, and hairs are present throughout the sequence, totaling n = 70.
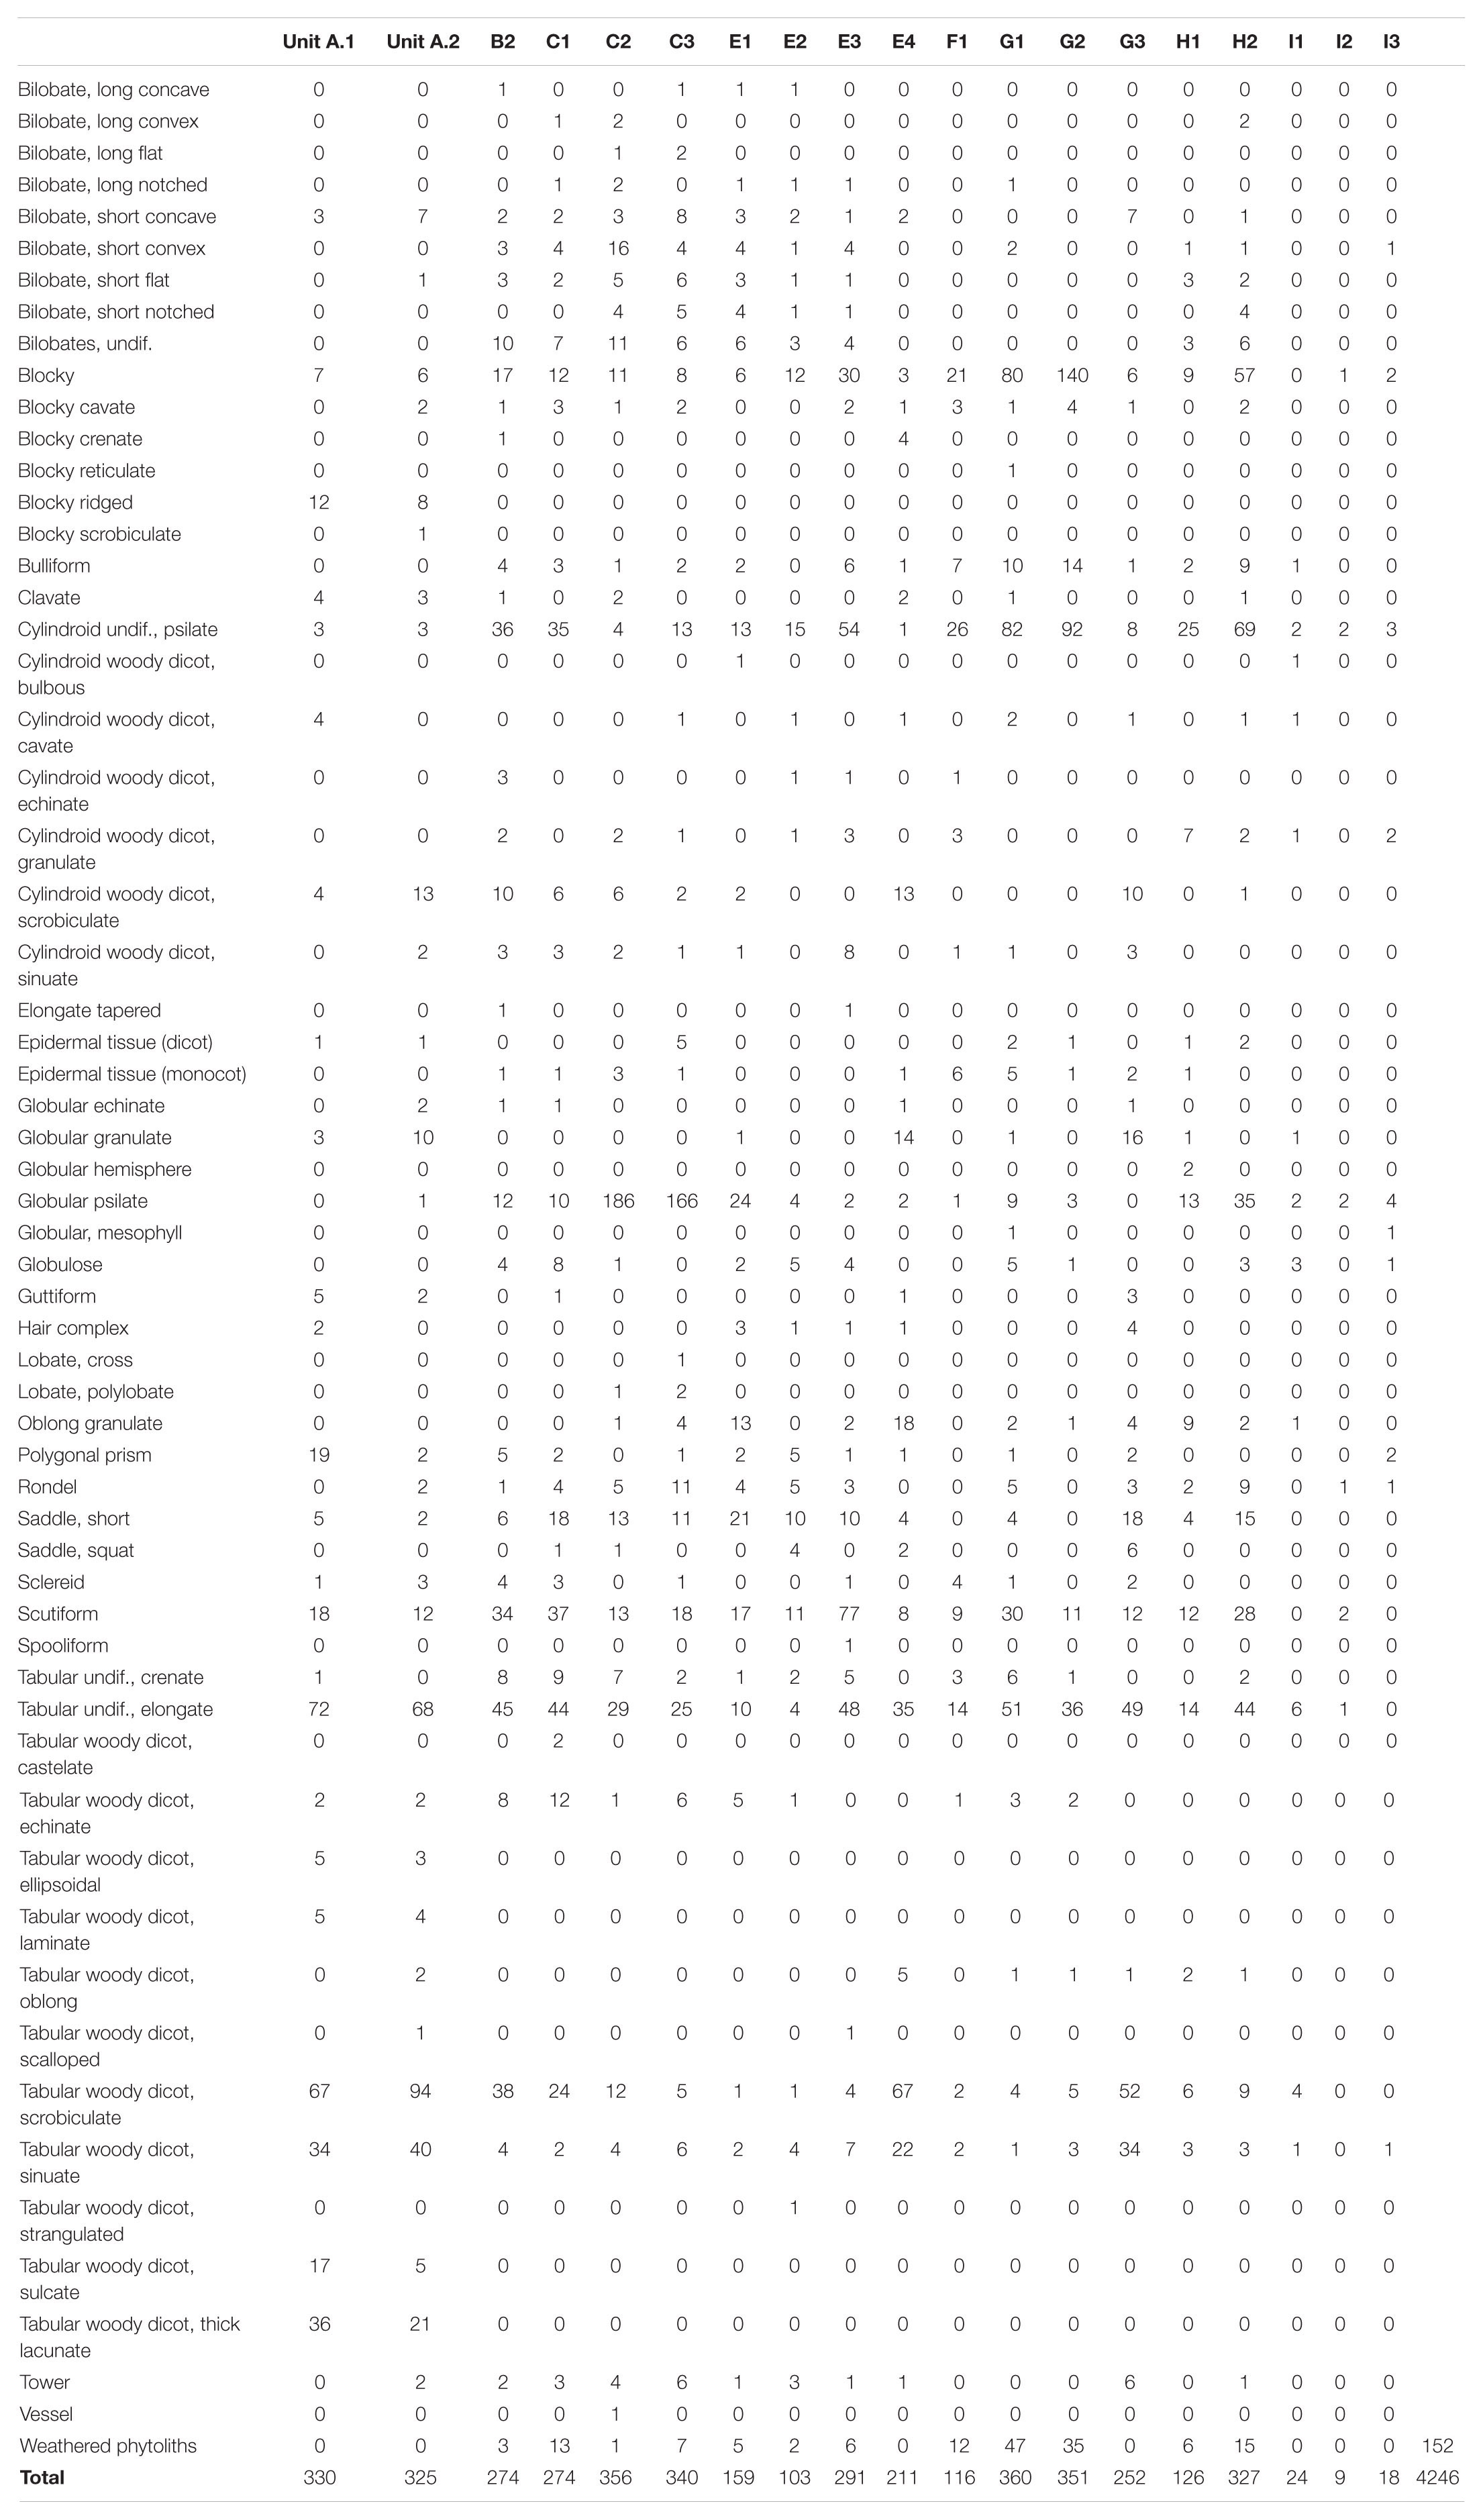
Table 2. Phytolith counts per sample and morphotype identified at Mumba.
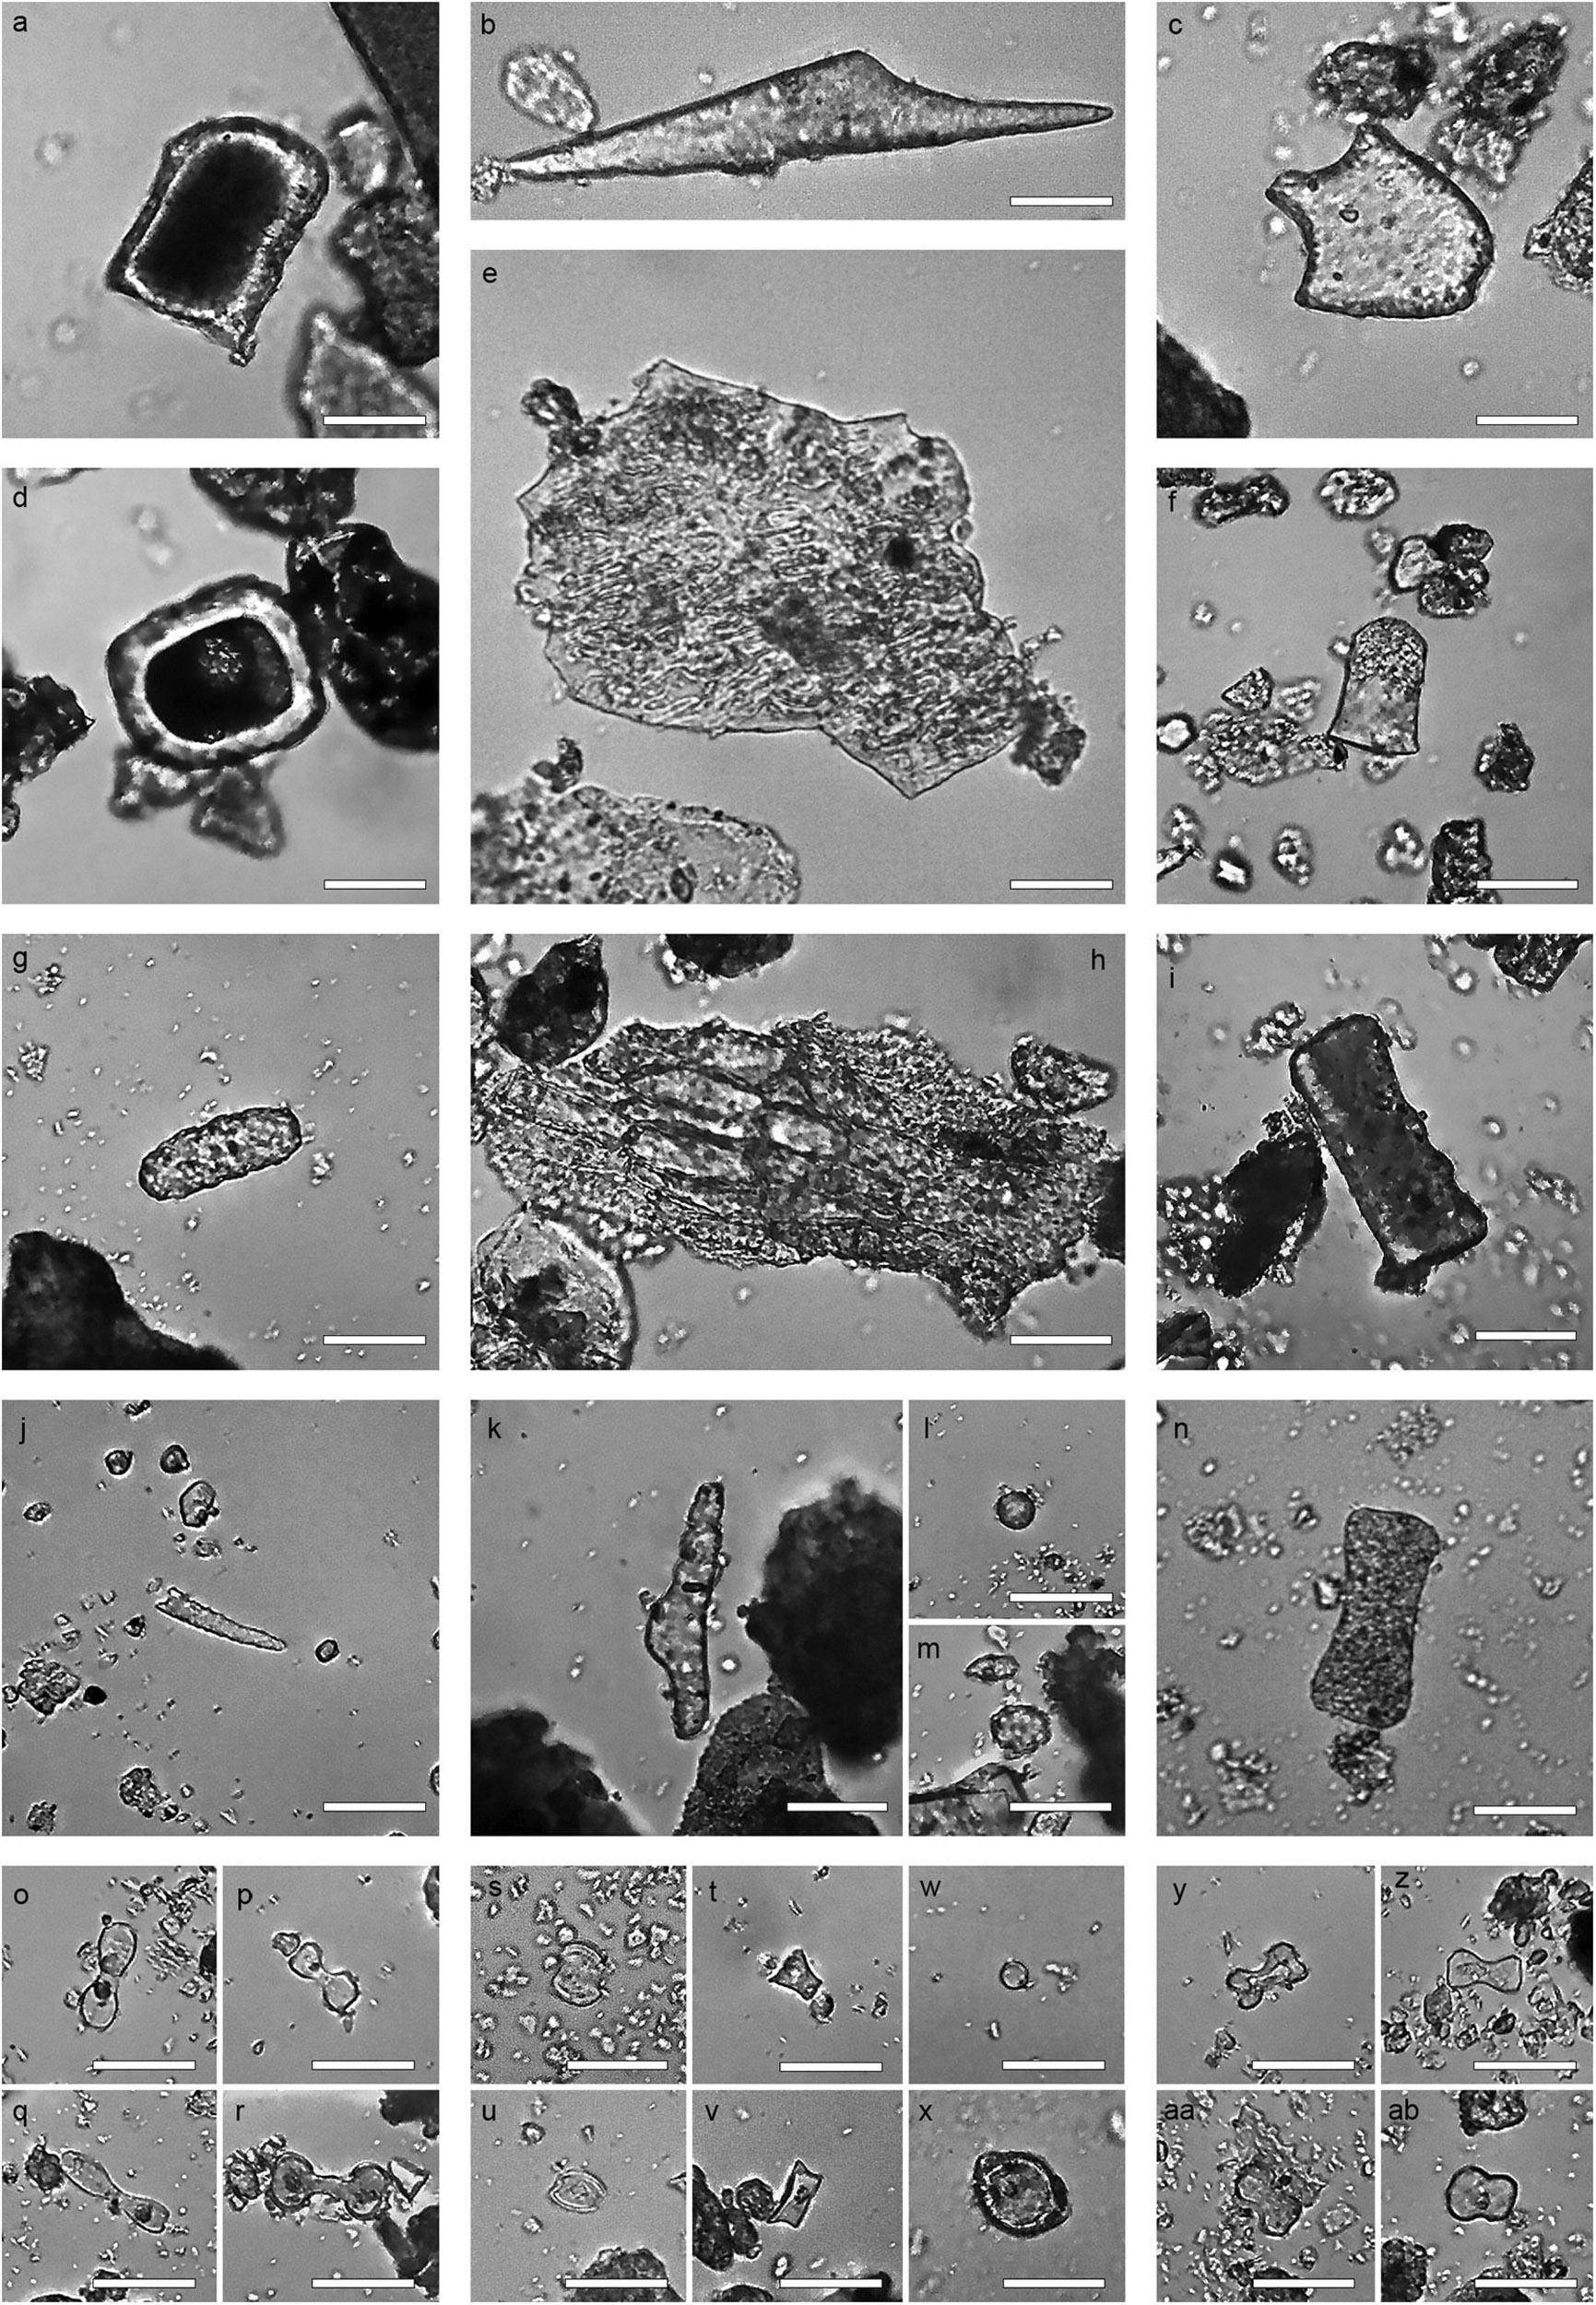
Figure 5. Selected phytoliths from Mumba, morphotype and sample provenance: (a) Blocky, G2, (b) Scutiform, G2, (c) Bulliform, G2, (d) Blocky, G2, (e) Composite epidermal possibly Poaceae inflorescence, E4, (f) Polygonal prism Commelinaceae, E1, (g) Cylindroid granulate, F1, (h) Epidermal composite likely Cyperaceae, H1, (i) Tabular sinuate, C2, (j) Oblong granulate, E1, (k) Sclereid, C1, (l,m) Globular granulate, B2, (n) Tabular scrobiculate, E2, (o) Large bilobate convex ends, H2, (p) Large bilobate flat ends, C2, (q) Large bilobate notched ends, B2, (r) Large bilobate concave ends, C2, (s) Short saddle, H2, (t) Tower, C1, (u) Squat saddle, E2, (v) Rondel, C1, (w) globular psilate, E4, (x) globular hemisphere, G1, (y) Small bilobate notched ends, C1, (z) Small bilobate flat ends, C1, (aa) Small bilobate concave ends, C2, (ab) Small bilobate covex ends, E1.
Maximum phytolith length distribution per sample shows concurrence of the whole phytolith range, from small short cells and globular psilates (5–10 μm) to extremely large blocky and tabular types >100 μm. Well-preserved phytoliths shapes yielded a high number of discrete morphotypes (n = 60) (Table 2). The mean frequency in which a morphotype appears is 16 times (range = 1–595). Twenty-nine morphotypes appear in numbers below the mean, while ten types are at the mean or slightly above, with the remaining phytolith types (n = 21) being the most prominent contributors, as their frequency more than doubles that of the rest. Of these 21 phytolith shapes, eight morphotypes are extremely common, being represented by >100 phytoliths per sample, which include: (i) tabular undifferentiated (14.01%, total), (ii) cylindroid undifferentiated (11.44%, total), (iii) globular psilate (11.21%, total) (Figure 5w), (iv) blocky (10.08%, total) (Figures 5a,d), (v) tabular scrobiculate (9.30%, total) (Figure 5n), (vi) scutiform (8.21%, total) (Figure 5b), (vii) tabular sinuate (4.07%, total) (Figure 5i), and (viii) short saddle (3.32%, total) (Figures 5s,u). Other key contributors, albeit in proportions 1%–3%, include cylindroid scrobiculate, bulliform (Figure 5c), tabular strangulated, and rondel (Figure 5v); with all other morphotypes being <1% from the total.
Seven phytolith classes dominate assemblages (Tables 3, 4 and Figure 6), and consistently account for more than half (mean 52% ± 16%) from this subtotal. In order of abundance, the mean for the tabular class from woody dicot (cf. Mercader et al., 2009, 2019) is 8.48% (range = 2.5%–52.92%). Mean percent for blocky phytoliths is 7.81% (range: 2.78%–41.02%). The mean for globulars (Figures 5l,m,w,x) is 6.99% (range: 0.86%–52.52%). For the grass short cells (Figures 5o–v,y–ab), the lobate mean is 4.63% (range = 0.83%–13.83%), followed by saddles (mean, 3.77%, range = 0.61%–13.59%). Cylindroids from woody dicots (cf. Mercader et al., 2009, 2019) have a mean of 3.43% (range = 1.11%–7.58%). The least abundant class is the rondel, with mean of 2.11% (range = 0.47%–7.76%).
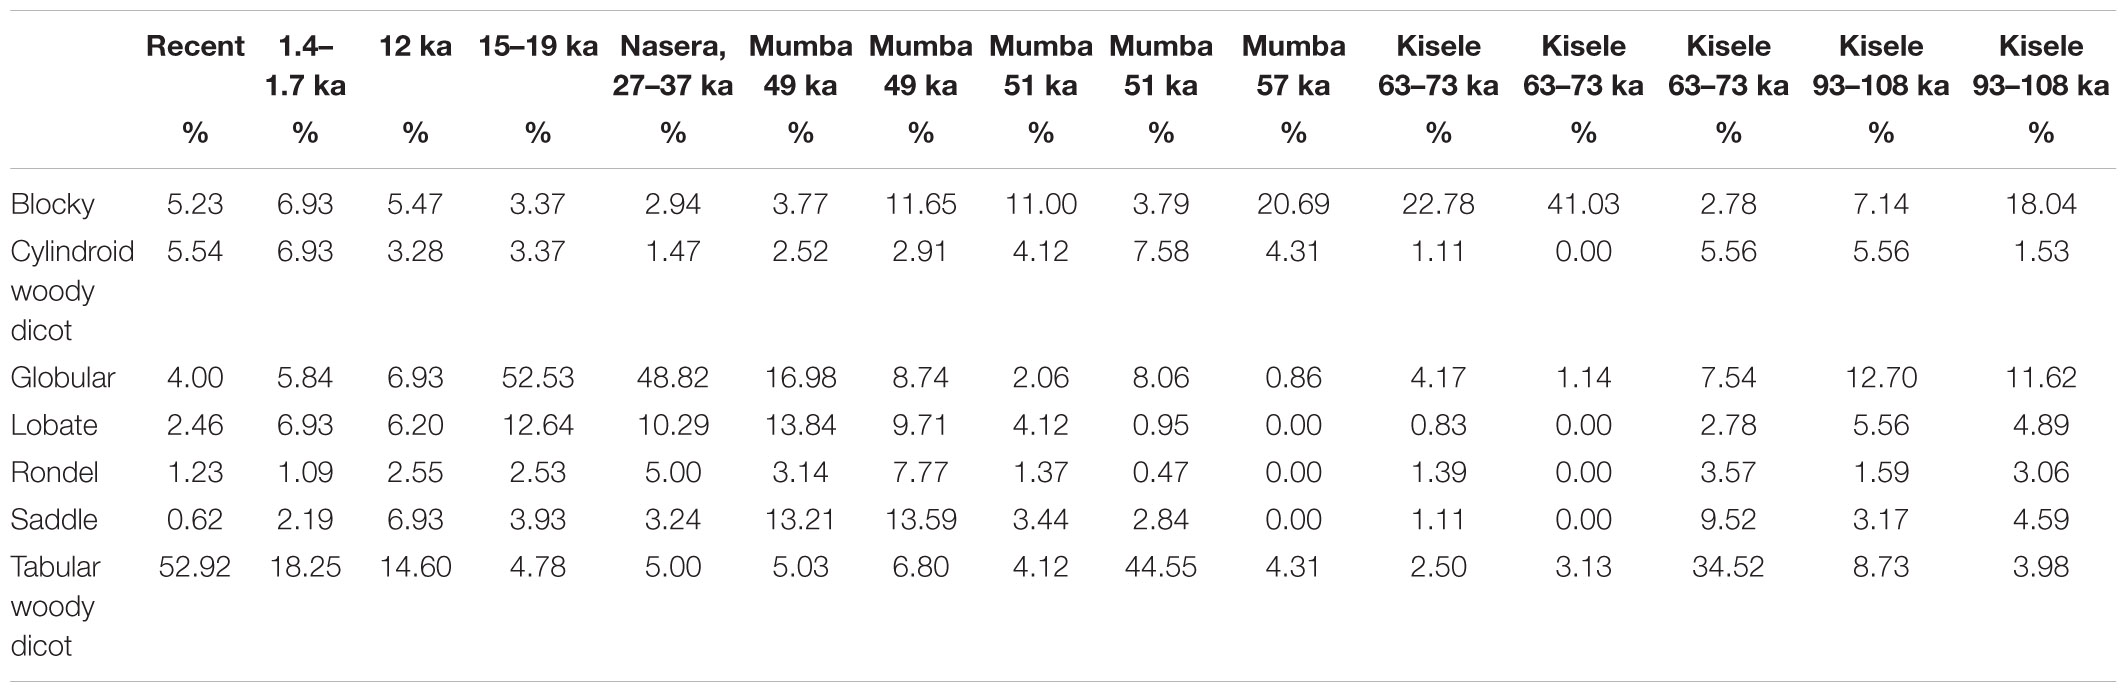
Table 3. Main phytolith classes per archaeological phase.
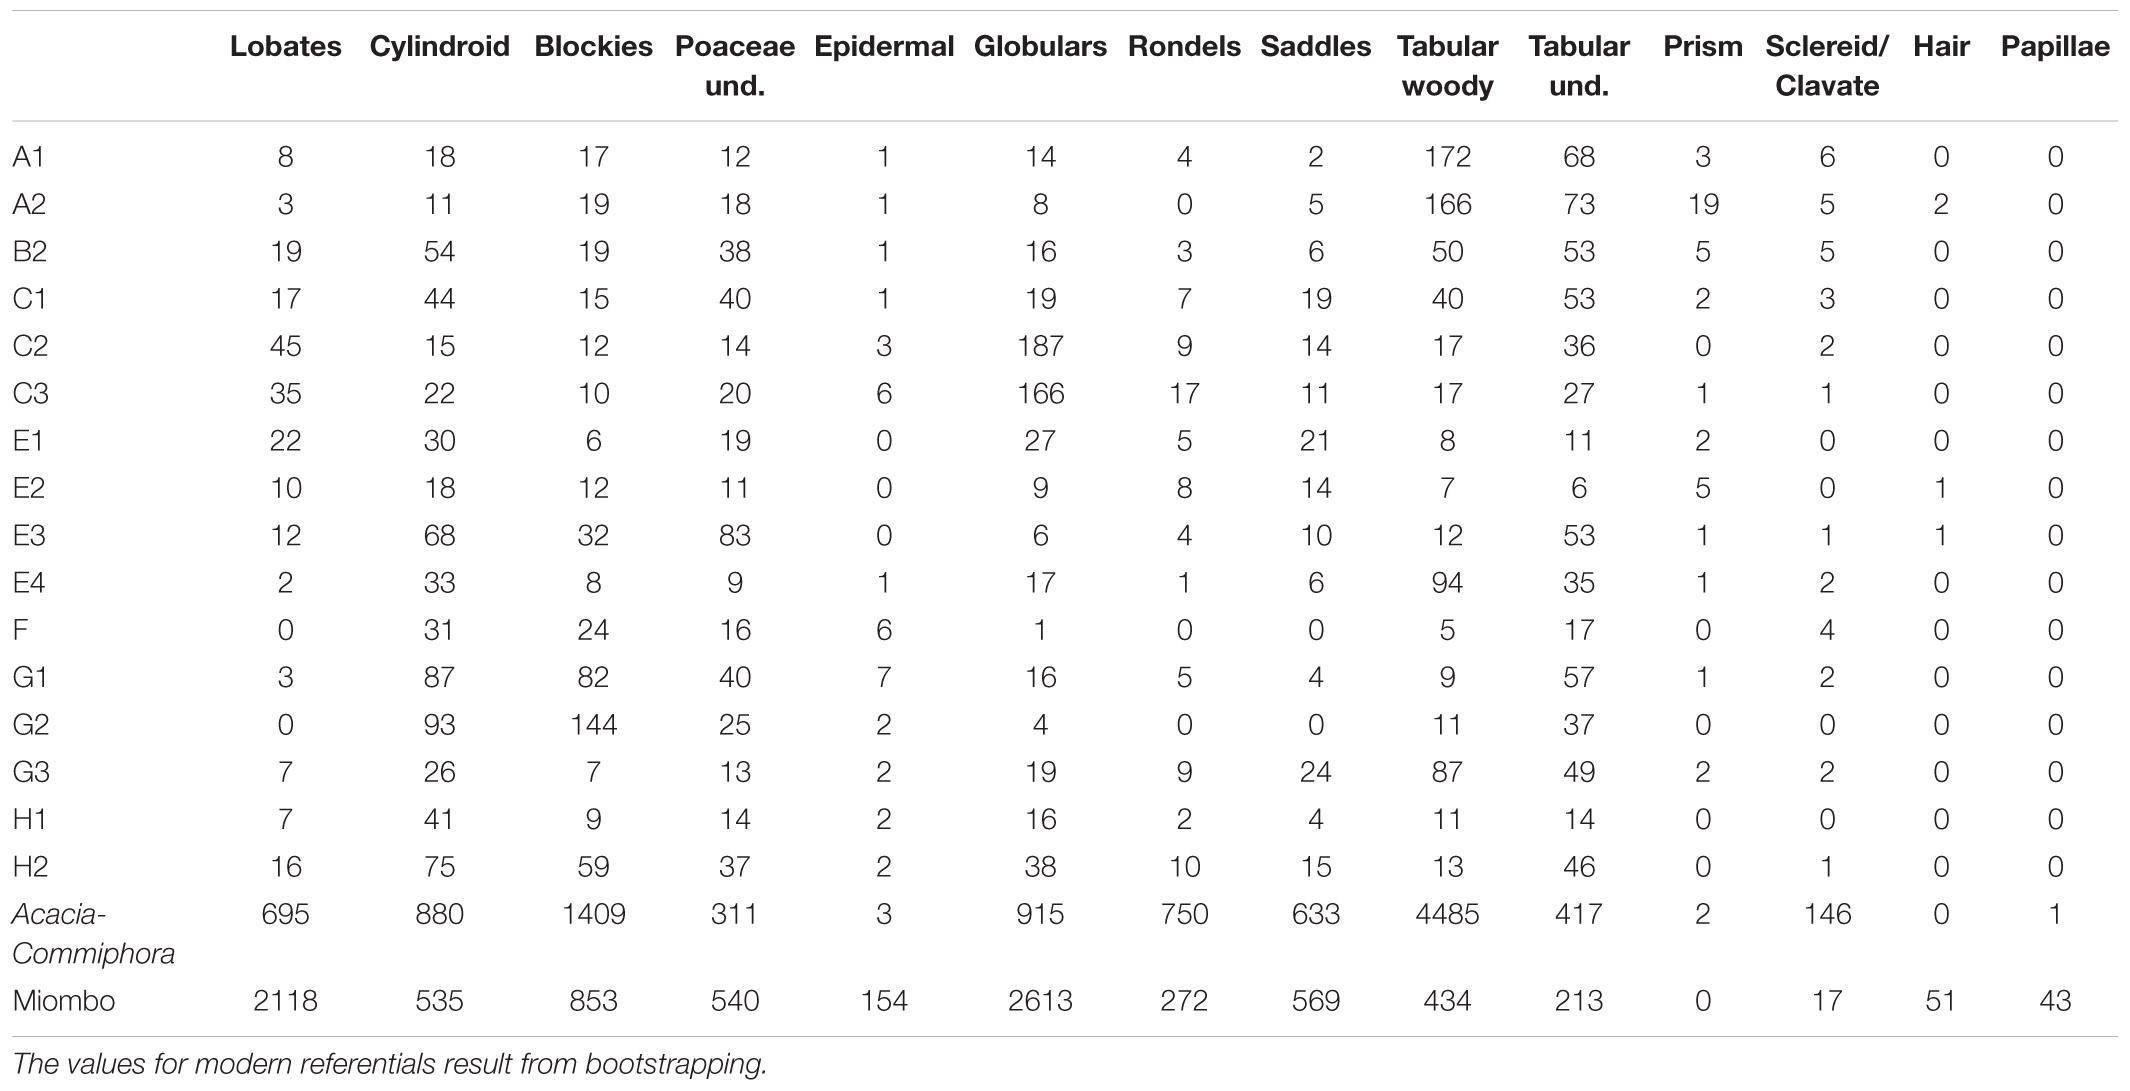
Table 4. Distribution of phytolith classes.
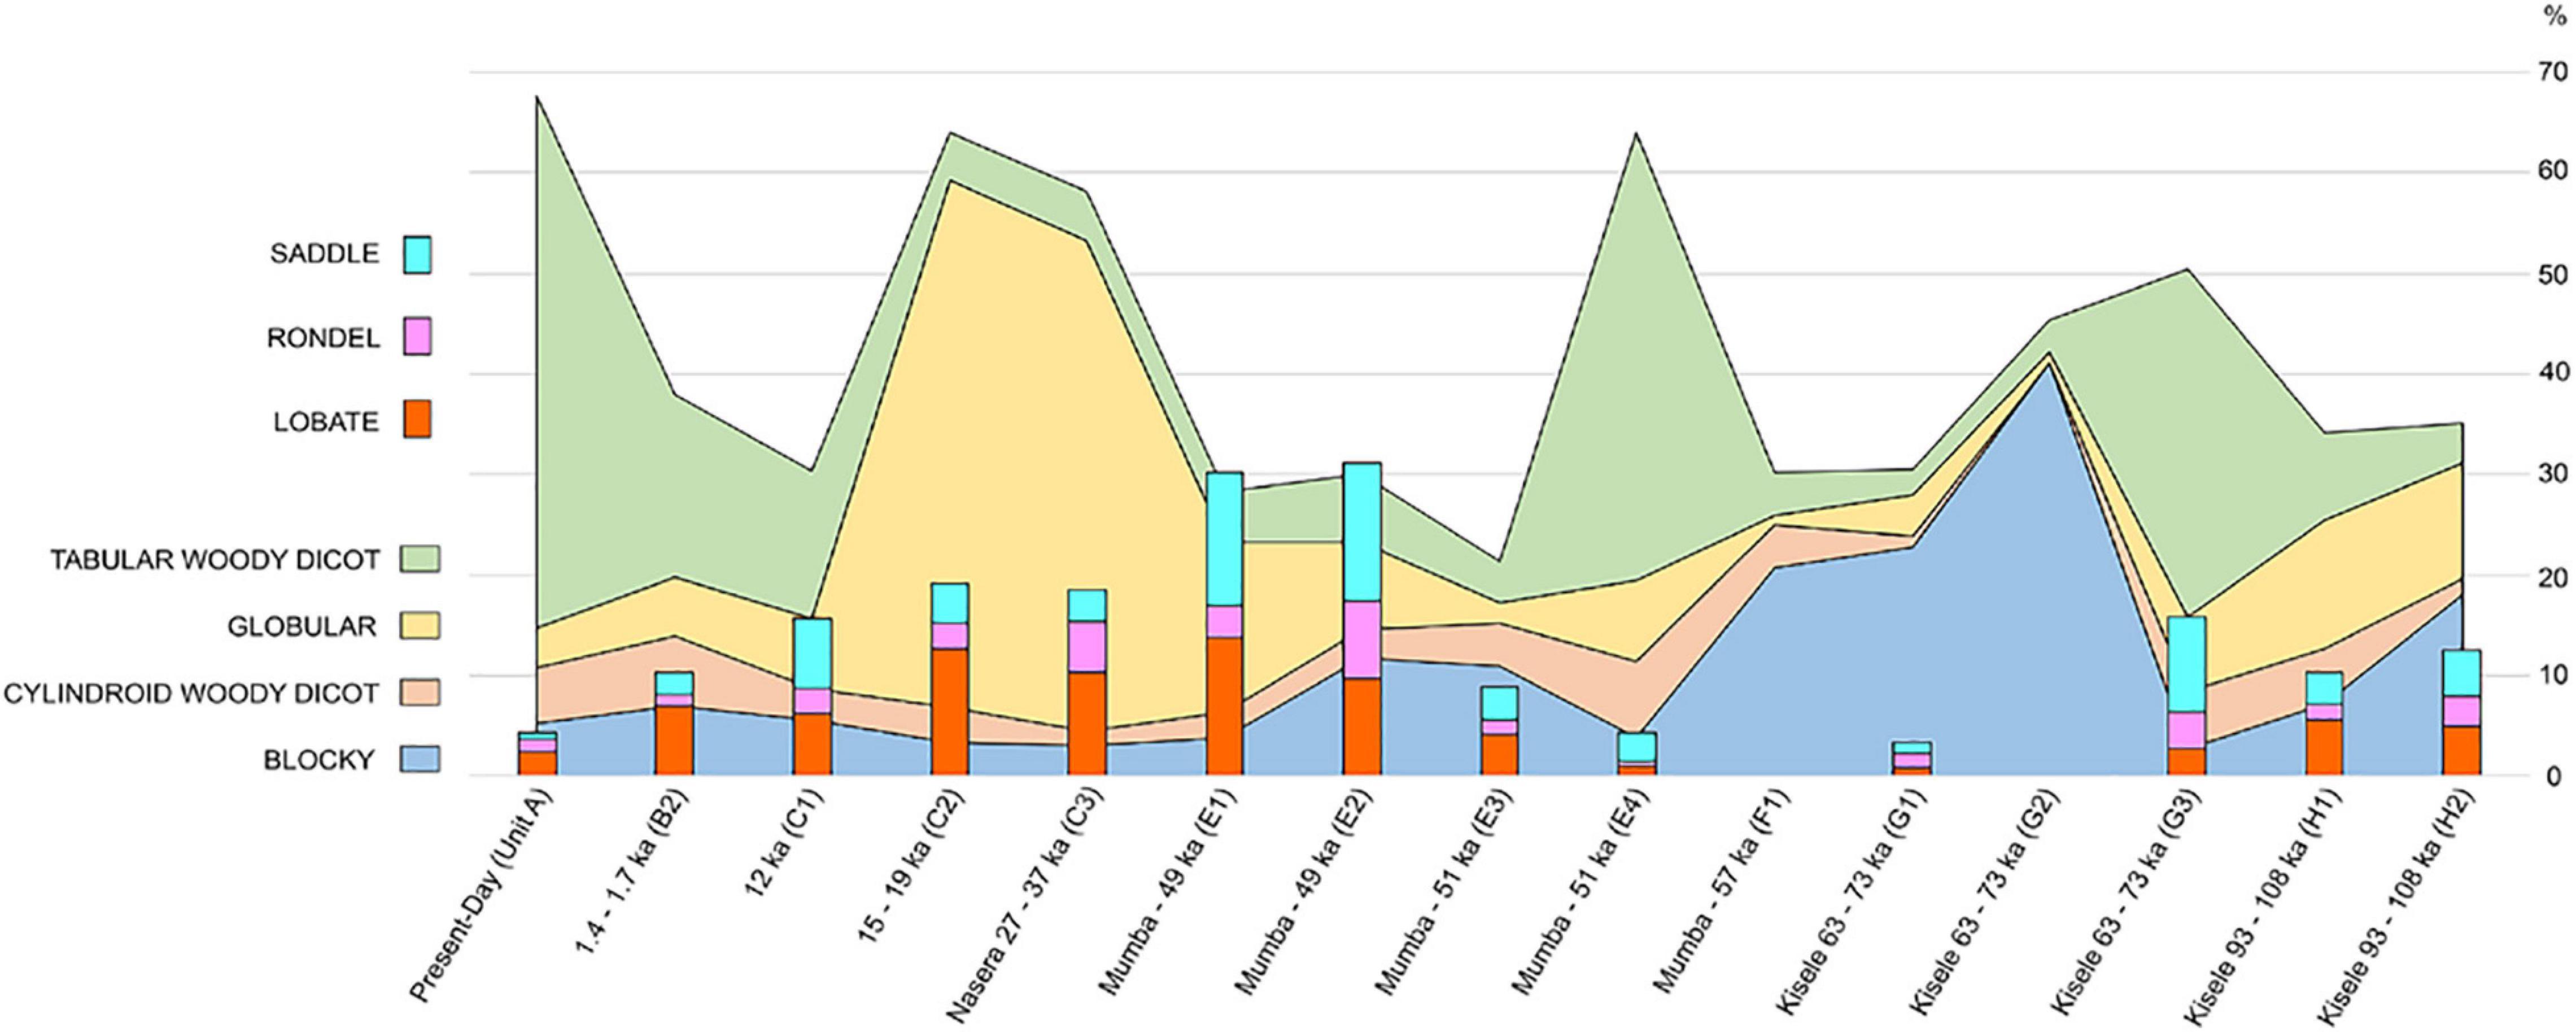
Figure 6. Percent of prominent phytolith classes over time.
Phytolith Classes per Phase: Descriptive Statistics
In chronological order, from the youngest topsoil at the site today through the Holocene and late Pleistocene layers, we note these trends (Figure 6):
The topmost sample (0.3 ka) comes from stratigraphic Unit A (Table 2) and represents Mumba’s present-day environmental baseline, exhibiting an overwhelming dominance by tabulars (52.92% from sample). Other woody tissue indicators are cylindroids, blockies, and globulars, which are at ∼5%. Poaceae short cells rank at 1–2% led by lobates, rondels, and saddles.
During the early Iron Age (1.4–1.7 ka) (B2) (Table 2) tabular (18.24%), blockies (6.93%) and cylindroids (6.93%) lead. Lobates doubled compared to the preceding phase, reaching 6.93%. The globular class remains at ∼5%, while saddles quadrupled (2.18%) and rondels decreased slightly, now at 1.09%.
The early Holocene LSA (Bed III: 12 ka) is contemporaneous with sample C1 (Table 2), where tabular phytoliths decreased (14.59%); blockies, globular, cylindroids, and lobates appear in proportions similar to those seen in younger phases, between 3 and 7%, but the saddle and rondel classes are now at ∼7% and ∼3%, respectively.
During the last glacial maximum (15–19 ka), the LSA phytoliths recorded in sample C2 (Table 2) show marked changes whereby tabulars drop to 4.7% while globulars (52.52%) and lobates 12.64% peak. Other woody dicot classes are <4%, and percents of saddles and rondels remain as abundant as in phases above. The habitat for the Nasera industry (LSA: 27–37 ka) is reflected in sample C3, with a phytolith spectrum and class breakdown very similar to that of sample C2, with globulars (48.82%) and lobates (10.29%) leading, while all other classes are <5%.
Upper Bed V (Unit E1, E2) (Table 2) corresponds with the Mumba industry (∼49 ka). Phytoliths exhibit a decrease in globulars (13.59%–16.98%) compared to counterparts in Bed III. Lobates remain at the same level as they are in the Nasera horizon (9.70%–13.83%), while the saddle class peaks at ∼13% and rondels increase slightly: up to 7.76%. Tabulars and cylindroids are <6%.
Middle Bed V (Unit E3, Mumba industry) dates to 51 ka and corresponds with the earlier stages of the LSA. Phytolith classes (Table 2) resemble proportions seen in the late Holocene (e.g., sample B2), albeit at lower percentages of tabulars (4.12%) and abundant blockies (10.99%) as well as cylindroids (4.12%). Saddles, globulars, and rondels are <3%.
Lower Bed V (Unit E4, Mumba industry, 51 ka) (Table 2) delivers a tenfold increase in tabulars (44.54%), compared to Middle Bed V, with globulars and cylindroids ∼8%. Blockies and grass short cells are <4%.
The bottom of Bed V (Unit F) (Table 2) is dated to 57 ka and is characterized by a marked surge in blockies (20.68%), a slight reduction in tabulars and cylindroids (4%), extremely low levels of globulars (0.86%), and absence of short cells.
The top Kisele horizon belongs with the late MSA, 63–73 ka (Unit G 1, 2) (Table 2). Its phytolith profile is similar to that in Unit F, with blocky percentages at their highest in the entire stratigraphy (22.77%–41.02%). Conversely, globulars, tabulars, and cylindroids appear at low percentages, with some short cells being <1% and others zero.
The mid to lower Kisele appears in Unit G 3 (63–73 ka) (Table 2), where tabulars are common (34.52%), with globulars (4.53%) and cylindroids (5.55%) also increasing. Notably, there is a saddle peak (9.52%) relative to G1 and G2, along with a greater abundance of rondels (3.57%) and lobates (2.77%). Blockies are scarce (2.77%).
The oldest Kisele layers for which there is a phytolith record are those from Unit H (1, 2; 93–108 ka) (Table 2). These samples are dominated by blockies (18.04%–7.1%), globulars (12.69%–11.62%), tabulars (up to 8.7%), and cylindroids (up to 5.5%). Grass short cells rank lobates first, followed by saddles and rondels at <5%.
Statistical Analysis
Individual phytolith counts in C2, C3, G1, and G2 are the highest, while Units I 1 – I 3 are the lowest (Figure 7A). Samples C2, C3, and B2 record the highest morphotype variability. In contrast, I 1 – I 3 are the least variable (Figure 7B). Dominance per morphotype is centered around globular psilates in C2 and C3, while the blocky dominates G2 (Figure 7C). Evenness, as a measure of morphotype relative abundance, is highest in C2/C3, while I 1 – I 3 are the most uneven phytolith sets (Figure 7D).
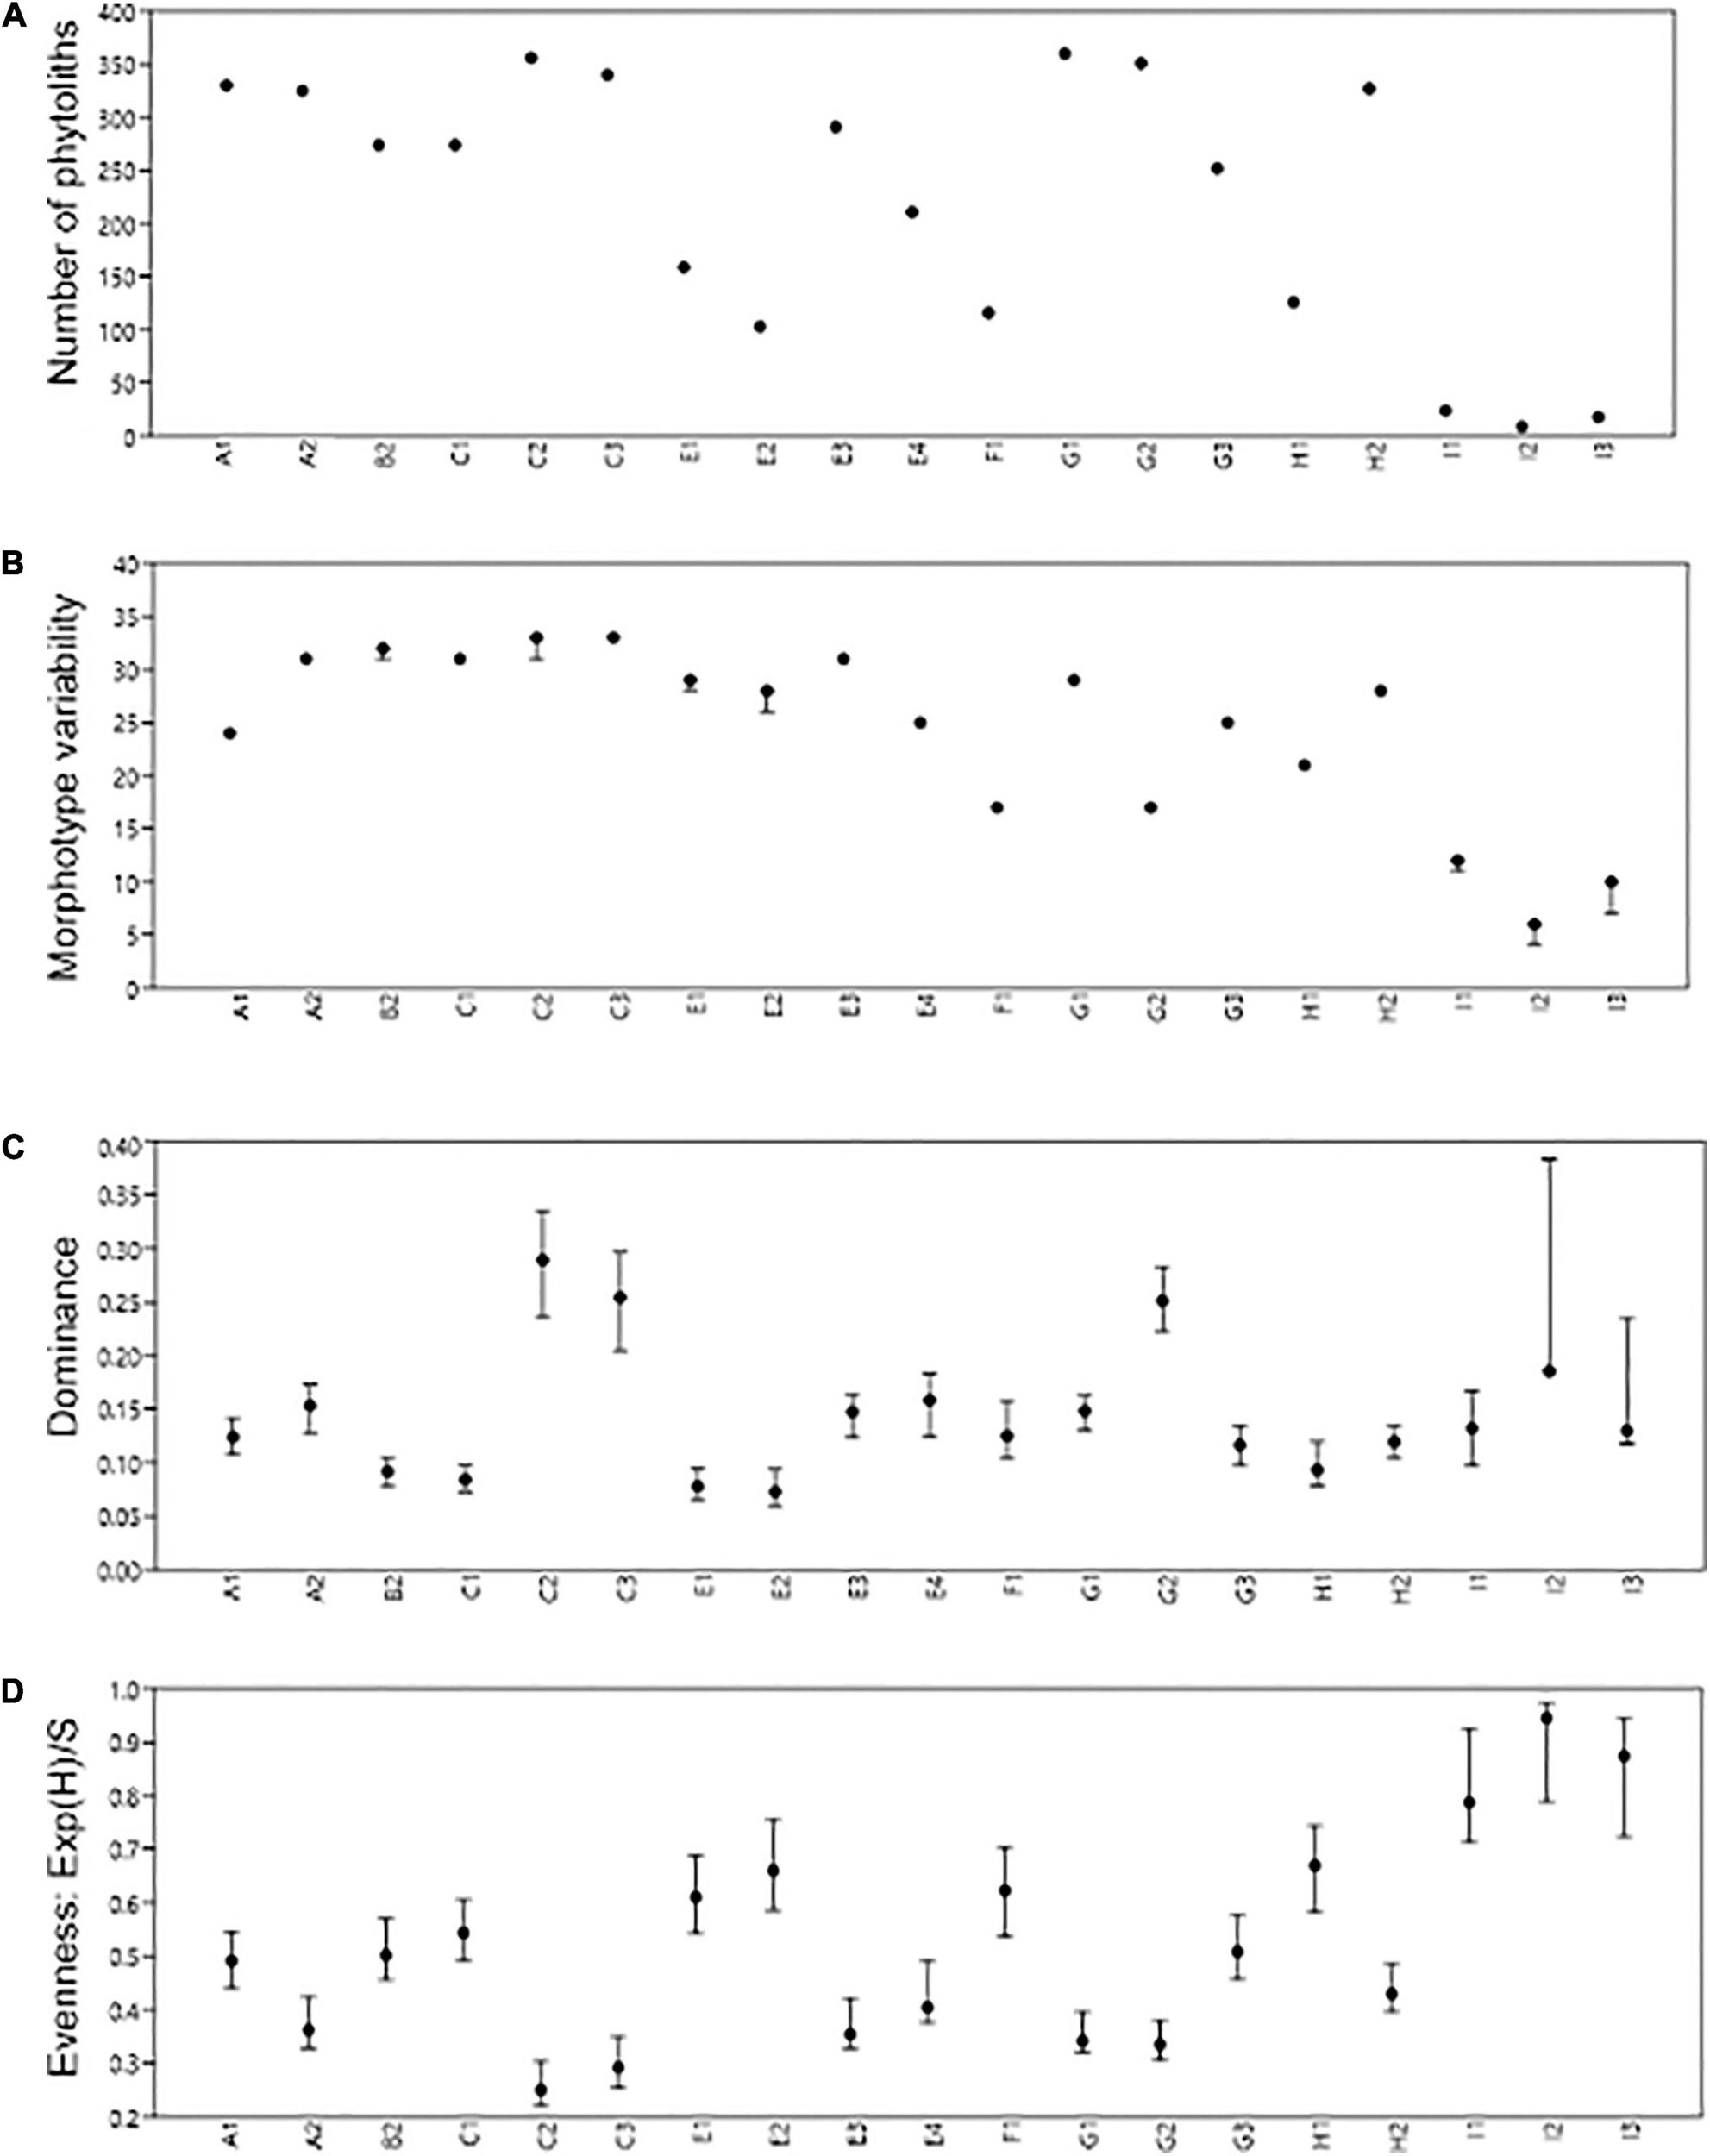
Figure 7. Phytolith richness (A), variability (B), dominance (C), and evenness (D).
Archaeological phytolith assemblages from Mumba follow non-normal distribution (Table 5). The Kruskal–Wallis test for non-parametric distributions yielded an H (χ2) = 68.42 and a p-value ≤0.00 when applied to either stratigraphic units or archaeological affiliations, demonstrating that all phytolith assemblages differ from each other significantly.

Table 5. Normality tests for phytolith distribution.
The raw p-values for phytolith distributions from Dunn’s post hoc tests (Table 6) discriminates recent stratigraphic units (A – B) from older sediments of E – F/G – H. (Unit I is an outlier.) Interestingly, per archaeological phase (Table 6), the test segregates samples in clear concordance with culture history: A – B (Recent – Iron Age) C (LSA/Nasera); E – F (Mumba Industry); G – H (Kisele); I (Sanzako).
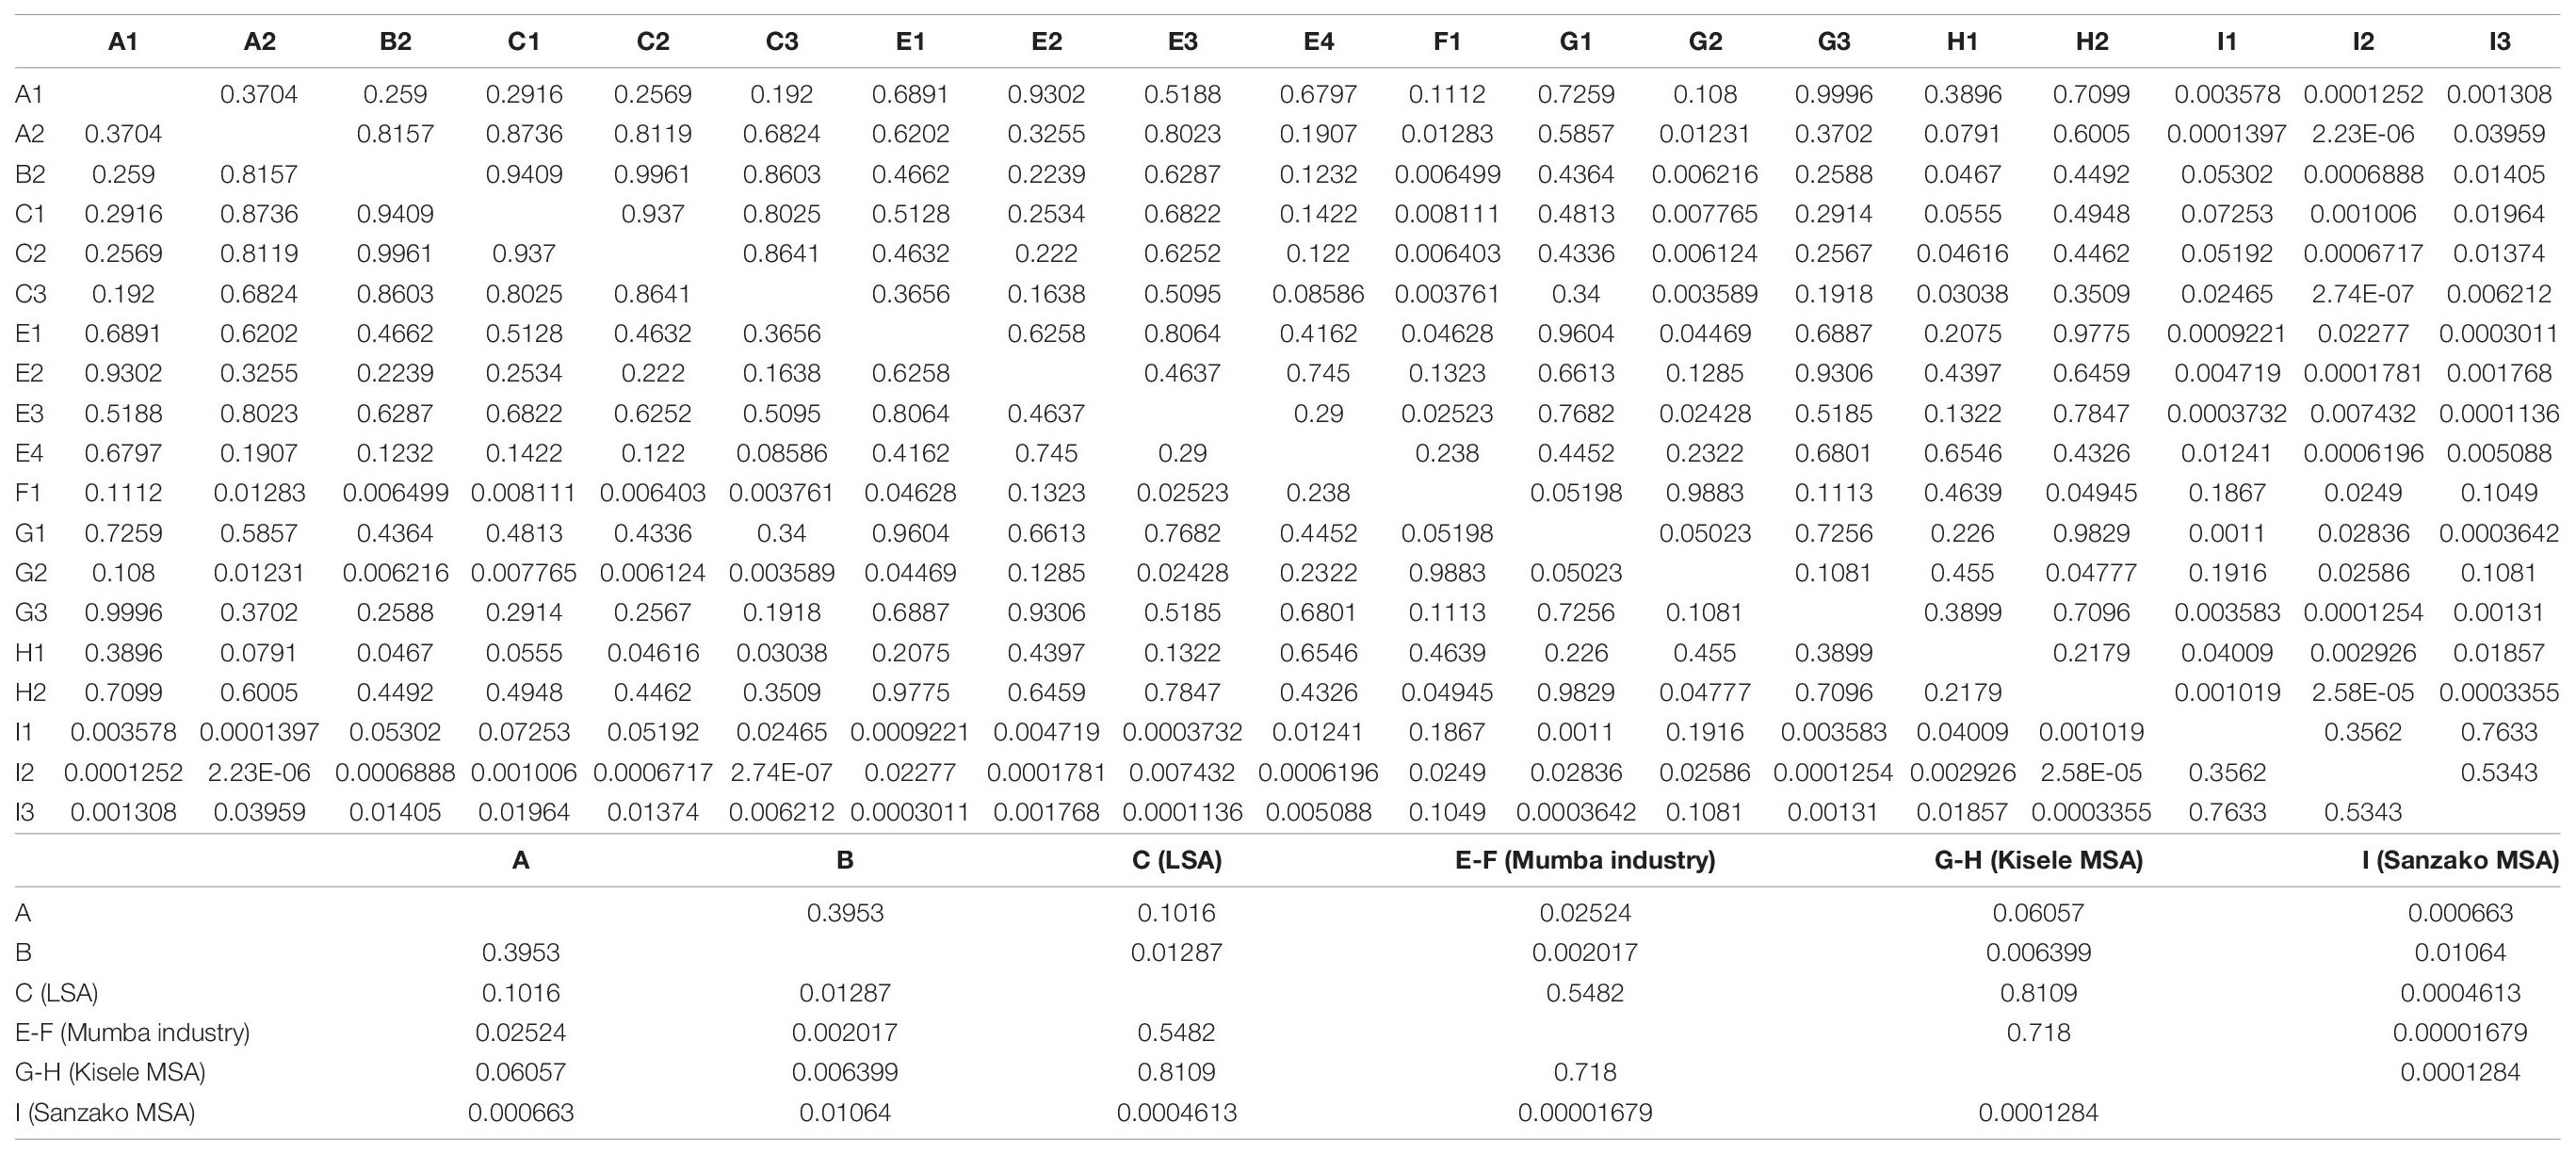
Table 6. Raw p-values from Dunn’s post hoc test on phytolith distribution (significant values are shaded) and per chronological and cultural phase.
Principal component analysis transformed 14 variables (phytolith classes) (Table 7). The first and second components account for 83.42% of the variance (Figure 8). This PCA is inclusive of archaeological samples, along with three comparative datasets representing the phytolith spectra from known environments locally and regionally today. PCA shows strong similarities for the samples plotting in quadrants 3 – 4, which clusters present-day topsoil (A1 – A2), Bed VI – A – 2 (G3), Lower Bed V (E4) and present-day Acacia – Commiphora woodland, due to their woody tabular phytoliths. The sample from B2 and C1, although in quadrant 3, diverges from the previous set in their undifferentiated tabulars. Quadrant 1 represents lowermost Bed III (C2 – C3), with a position that indicates a strong affinity with Zambezian woodland references, as per abundance in globular phytoliths. The highest intra-group variance is found in quadrant 2, where the remaining phytolith samples from units E and G are very diverse and plot in the proximities of semiarid and arid wooded grassland and shrubland. Within this quadrant, the Poaceae classes, together with blocky and cylindroid morphotypes, plot F – H in close proximity.
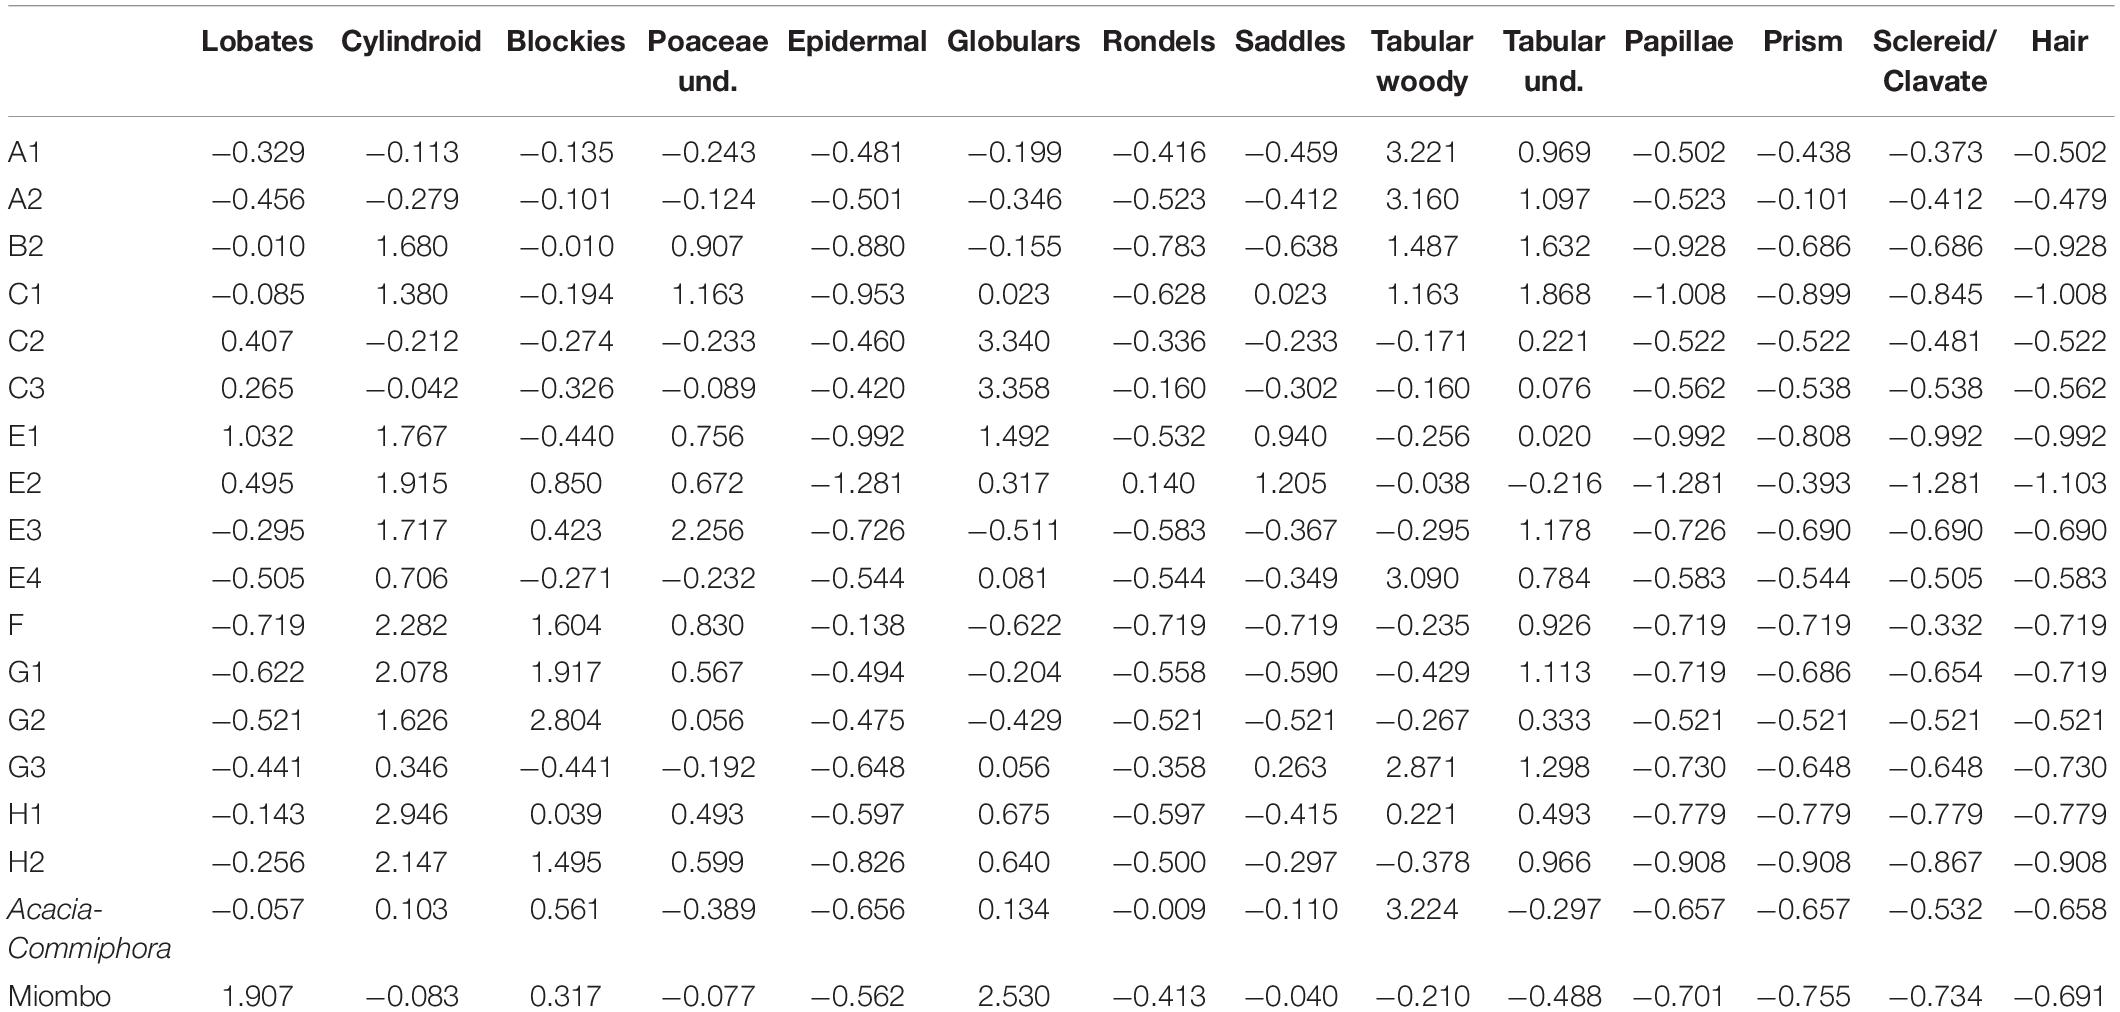
Table 7. Standardized (Z-score) for phytolith variables from Mumba and comparative, present-day baselines.
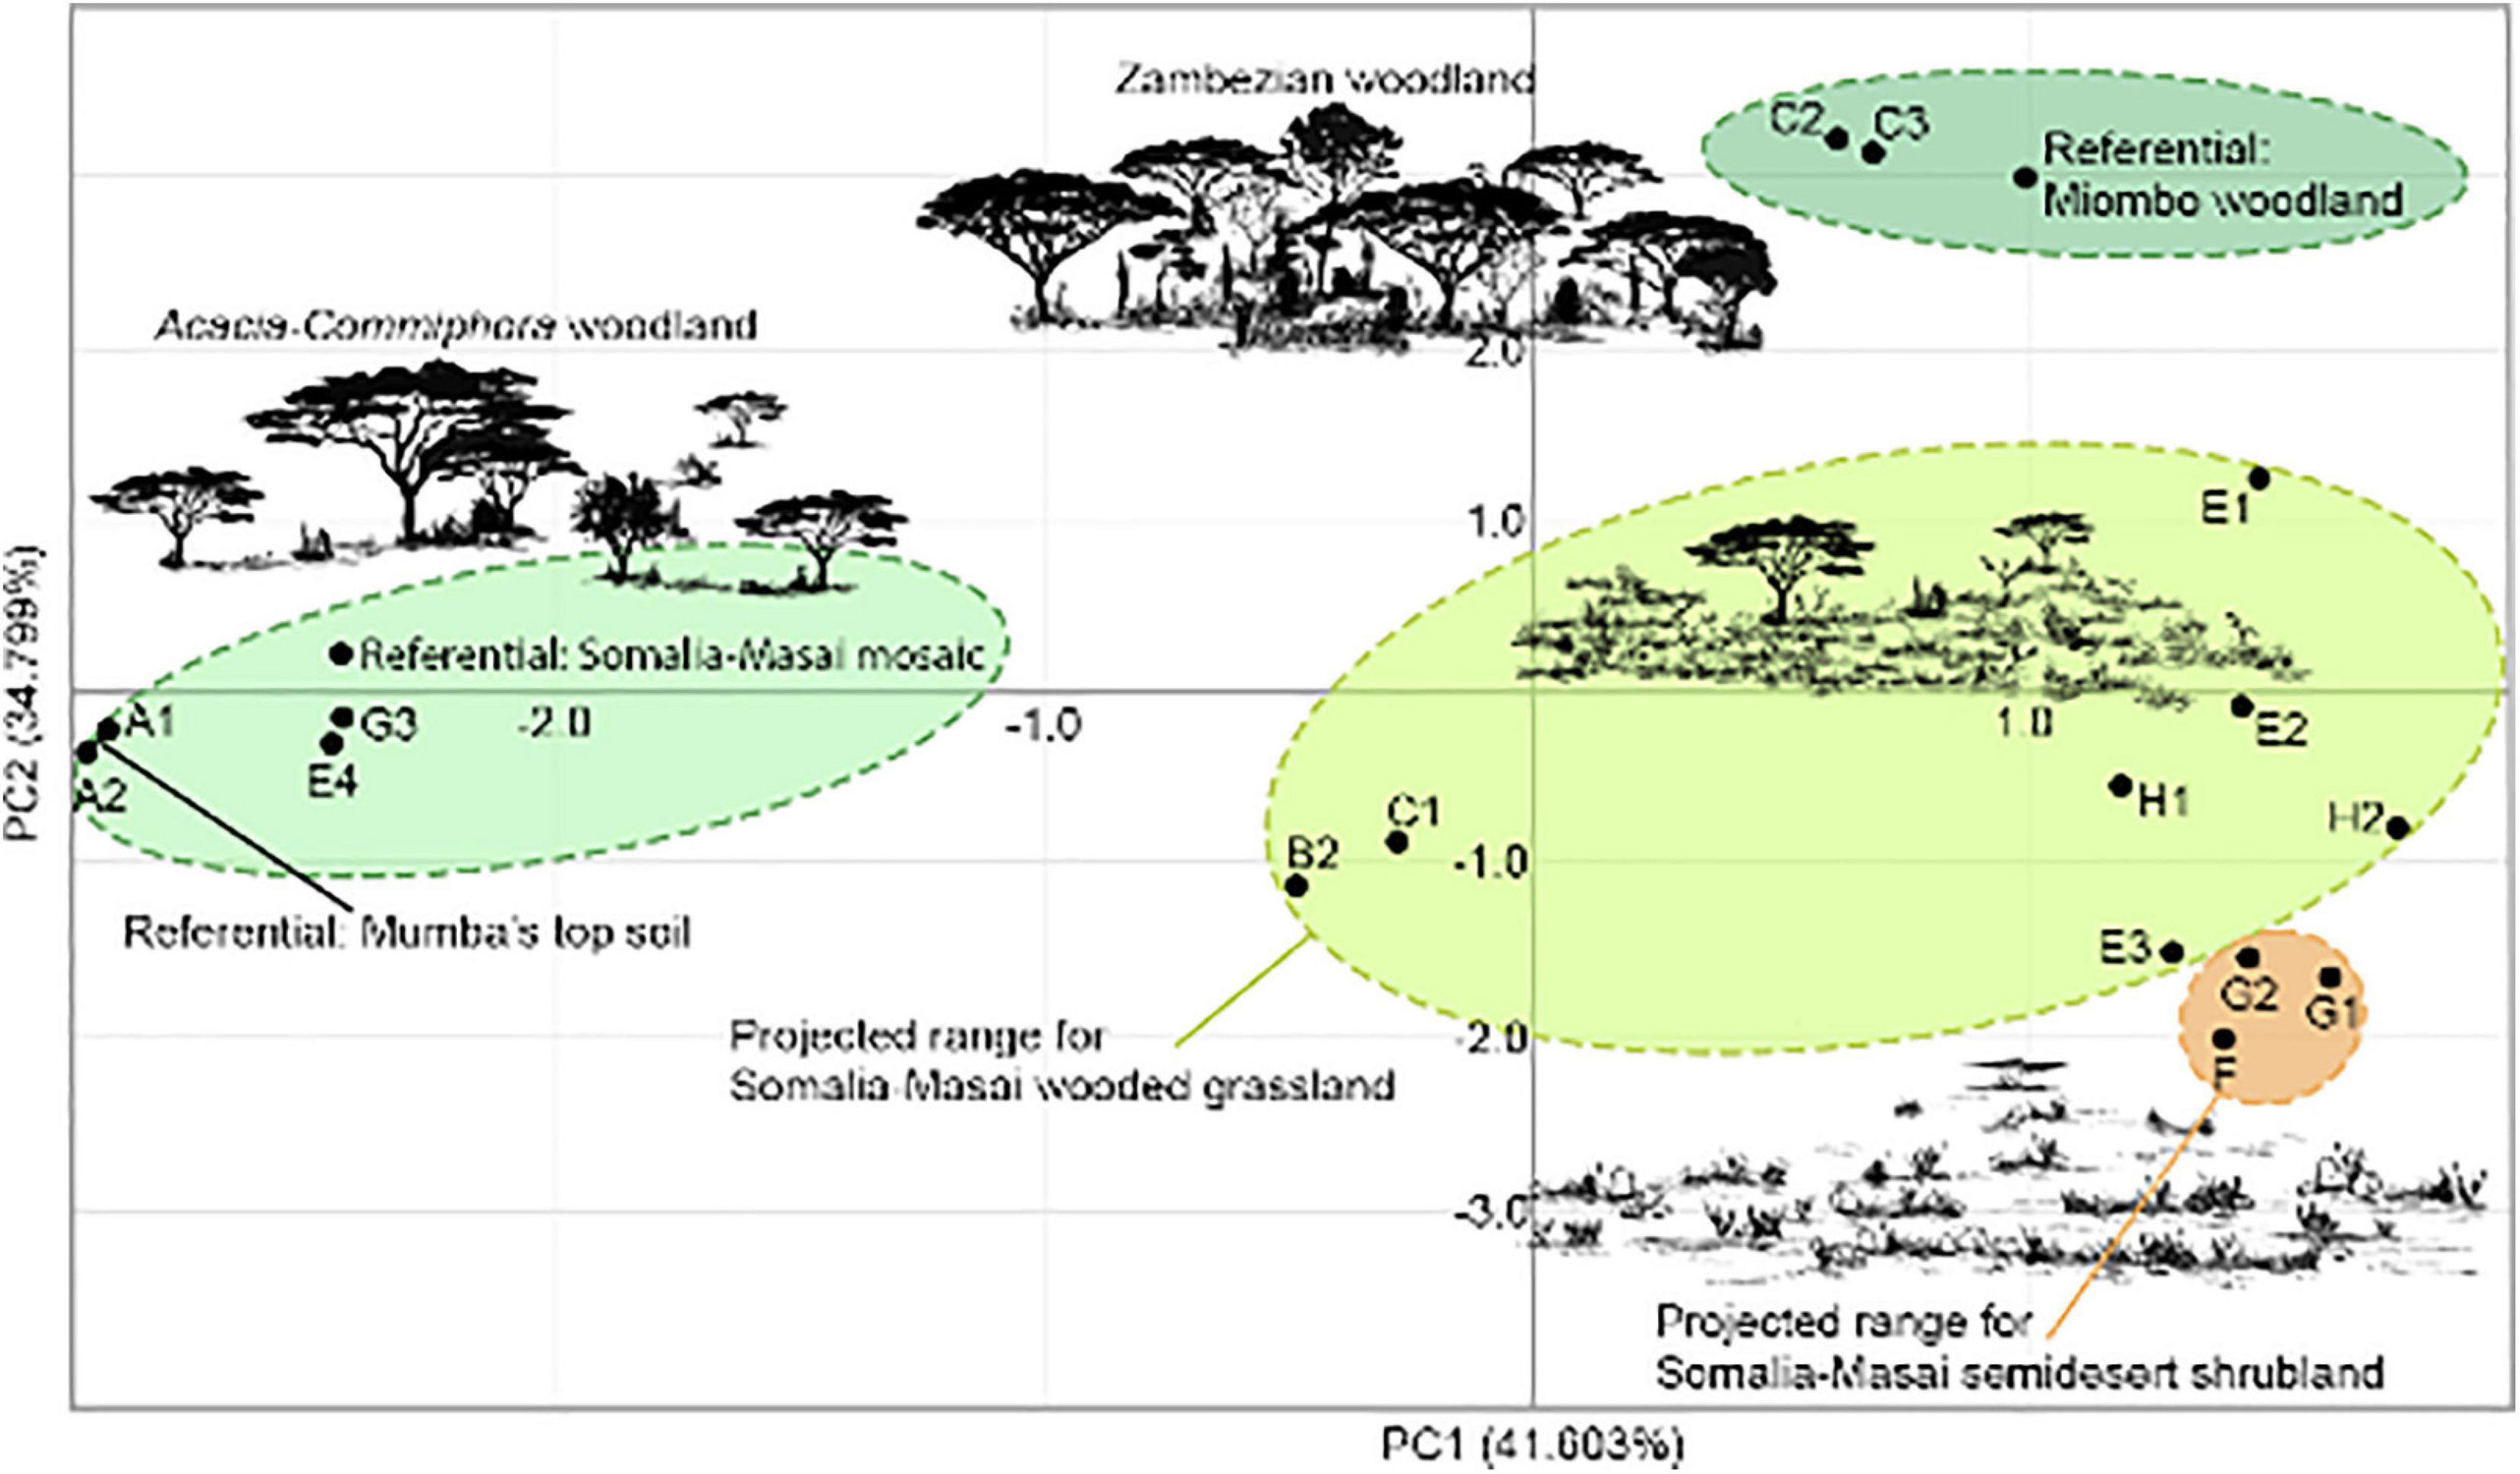
Figure 8. Principal component analysis of Mumba phytoliths.
Discussion
When looking at the environmental imprint of Mumba phytoliths as a whole, it is noticeable that the richest phytolith classes, accounting for more than three-quarters of the variability studied (Figure 6), closely mirror the dominant classes registered in the regional soil and botanical record today (Albert et al., 2006, 2015a; Mercader et al., 2019). Qualitatively speaking, therefore, this may indicate that the phytolith record of Mumba signifies paleoenvironments with analogs in the Somalia – Masai bushland and grassland (White, 1983; Kindt et al., 2011). Today, soil phytolith influx in the Acacia – Commiphora ecozone (Mercader et al., 2019 – cf. Blinnikov, 1994; Fredlund and Tieszen, 1994; Blinnikov et al., 2002) reveal time-averaged palimpsests representing phytolith catchment smaller than five hectares. As natural and anthropogenic plant sources must both contribute to Mumba’s phytolith record, it is important to outline scenarios for how the phytoliths deposited in the shelter, to estimate transport range and the overall landscape representativity of the vegetation signal:
Beds III, IV, and V contain a record of local vegetation around the shelter, as gravity and rainwash sedimentation dominate. Bed VI represents both local and intra-basin vegetation, as aeolian input mixes with non-aeolian sources in Bed VI-A1, while Bed VI-A2/3 record rock shelter, lake shore, and floodplain environments. The fluvial sediments from level I (Bed VI B) have not been included in the discussion because of low counts, and therefore the environmental interpretation presented in this paper excludes the Middle Pleistocene (Domínguez-Rodrigo et al., 2007).
Quantitative analysis detects no evidence that phytolith distribution through the stratigraphic column is homogeneous or random, as it would be if biogenic and/or geogenic processes had turned over the original fabric to any significant extent. Kruskal–Wallis demonstrates substantial differences among samples, and Dunn’s post hoc tests discriminate them in perfect coherence with their stratigraphic provenance and cultural affiliation.
A qualitative assessment of phytolith preservation at Mumba relying on the frequency of dissolution marks suggests that compositional bias is minor, as the percentage of weathered phytoliths is very low, and corroded shapes retain their original morphology (Appendix Figure A1). The phytoliths from Mumba constitute a rich morphotype complement, inclusive of 60 variants, which is very high and indirectly indicates acceptable preservation. In addition, articulated phytoliths and fragile silica shapes have been preserved; thus, speaking to optimal silica preservation. There are three samples from the base of the column (Table 2, I1, I2, I3 = MSA, Sanzako industry) that yielded few phytoliths. We surmise that the high-energy fluvial environment that deposited the gravel-supported matrix of Bed VI – B (Bushozi et al., 2017, 2020) winnowed out the silt, phytolith-bearing fraction. Additional biases to consider in the interpretation of the assemblage could come from aeolian transport in Bed VI – A-1 (Bushozi et al., 2017). We cannot ascertain whether windblown sand and dust (Kok et al., 2012) are partly responsible for phytolith deposition in this specific layer. Even if windborne sediments included phytoliths piggybacking on sand grains, we show that aeolian deposition did not selectively sort phytoliths by size. For instance, phytolith sizes in this interval include small phytoliths, such as grass short cells (mean maximum length = 13.73 μm) and globulars (mean maximum length = 7.02 μm), along with much larger classes containing blockies (mean maximum length = 48.23 μm), tabulars (mean maximum length = 65.41 μm) and cylindroids (mean maximum length = 60.99 μm). In fact, the mean maximum length for the top class (blockies) overlaps with blocky metrics throughout Mumba’s stratigraphy both in Bed V (E2: mean blocky size = 40.47 ± 13.59 μm) and Bed III (mean blocky size = 49.07 ± 14.84 μm). However, the reader should note that sometimes phytoliths can be transported as part of soil aggregates, resulting in little damage or size sorting (Osterrieth et al., 2009). The near absence of diatoms and sponge spicules, two common siliceous biomarkers in regional modern soils (e.g., Albert et al., 2015a; Mercader et al., 2019) and in Lake Eyasi sediments (Gasse et al., 1983), represent the last source of potential bias we discuss. In our analysis, however, diatoms are exceedingly rare (n = 2) and sponges are absent. This may suggest that the lacustrine habitats or the seasonally flooded soils that would be conducive to diatom and sponge growth have not been recorded in the rock shelter’s sector that we sampled.
A closer look at the Mumba dataset through multivariate analysis suggests several environmental scenarios and hypotheses for future research:
1. During the MSA of unit H (93–108 ka), coeval with the earlier Kisele industry (Bed VI – A-3), the phytolith assemblages represent floodplain environments that could have an analog in the wooded grasslands of the Serengeti today (Albert et al., 2015a) (Figure 8). Subsequently, there is no record of this plant habitat type, but then it is registered again around the rock shelter during the LSA from Upper and Middle Bed V, the LSA from the early Holocene (Bed III), and in the early Iron Age (Bed III).
2. We suggest an environmental context of Acacia – Commiphora woodlands for the Kisele industry penecontemporaneous with the deposition of unit G3 (Bed VI – A-2), approximately 63 ka – 73 ka, as indicated by PCA (Figure 8); also in a floodplain context. A similar environmental record is observed for Lower Bed V, contemporaneous with the Mumba industry and the onset of the Later Stone Age (51–49 ka); but the sedimentary context of the latter signals a habitat that includes both the rock shelter surroundings and the nearby basin.
3. The Kisele complex evolved in environmental contexts other than the local mosaics mentioned above. The phytolith assemblage from units G2 – G1 ∼57 ka (Bed VI – A-1) may denote semi-desert shrubland in a spectrum that was plausibly produced by xeric shrubs and grasses; namely, a cohort dominated by blockies, saddles, bilobates, and rondels. Other proxies, such as the aeolian deposits from G2 to G1, also suggest marked aridity (Bushozi et al., 2017, 2020): In wind beaten grasslands, grassland succession typically shifts to steppe conditions (Alvarez et al., 2012). Somalia – Masai semi-desert vegetation however is not present in northern Tanzania today, with its nearest tally 600–1200 km northeast (Figure 2B). Semi-deserts are populated by shrubs (Kindt et al., 2011), while grasses are rare but do include Eragrostis mahrana, Panicum turgidum, and Centropodia glauca (White, 1983). In tandem, these plant groups would produce the phytolith morphotype co-dominance we observed at Mumba’s Bed VI – A-1.
4. A fourth plant habitat can be put forward for the rock shelter environmental context during the Nasera phase (C3: 27–37 ka) and the last glacial maximum (C2: 15–19 ka), whose phytolith classes plot near referentials from mesic woodlands in our PCA.
Conclusion
Phytoliths detect an ecological signature for the MSA and LSA occupation of Mumba whose imprint is from habitats similar to present-day environments regionally, with exceptions. It is apparent that the MSA inhabitants of the rock shelter settled the area under very diverse and changing environmental conditions over time, encompassing steppe, wooded grasslands, and woodlands. Although the transition to the LSA coincides with the establishment of wooded landscapes after a long hyper-arid phase, the environmental context where the earliest Mumba industry from the LSA catalyzed was not new in the area, as MSA groups inhabited woodlands earlier in the late Pleistocene. Thus, phytolith analysis cannot demonstrate a causative relationship between plant habitats from lower Bed V and the transition from the MSA to the LSA.
Data Availability Statement
The original contributions presented in the study are included in the article/Supplementary Material further inquiries can be directed to the corresponding author.
Author Contributions
JM and PB contributed to the original idea and experimental conceptualization. JM, SC, and GS contributed to the phytolith analysis. MS, JM, and GS carried out the quantitative analysis. All authors contributed to the data interpretation. JM, SC, MM, GS, MS, and PB contributed to the figures and tables. JM wrote the manuscript, with all authors contributing to its editing.
Funding
We acknowledge the funding to conduct this work through Volkswagen Foundation grants nos. 88015, 92047, and 96977 to PB and the Lake Eyasi Basin archaeological project. The Mercader laboratory was supported by the Canadian Social Sciences and Humanities Research Council under its Partnership Grant Program no. 895-2016-1017.
Conflict of Interest
The authors declare that the research was conducted in the absence of any commercial or financial relationships that could be construed as a potential conflict of interest.
Acknowledgments
We are grateful to COSTECH and the division of Antiquities for authorizing our work. Numerous undergraduates and postgraduates from the University of Dar es Salaam participated in fieldwork, and the local community of Mang’ola made this work possible.
Supplementary Material
The Supplementary Material for this article can be found online at: https://www.frontiersin.org/articles/10.3389/fevo.2021.699609/full#supplementary-material
Footnotes
References
Albert, R. M., Bamford, M., and Cabanes, D. (2009). Palaeoecological significance of palms at Olduvai Gorge, Tanzania, based on phytolith remains. Quat. Int. 193, 41–48. doi: 10.1016/j.quaint.2007.06.008
Albert, R. M., Bamford, M. K., and Cabanes, D. (2006). Taphonomy of phytoliths and macroplants in different soils from Olduvai Gorge (Tanzania) and the application to Plio-Pleistocene palaeoanthropological samples. Quat. Int. 148, 78–94. doi: 10.1016/j.quaint.2005.11.026
Albert, R. M., Bamford, M. K., and Esteban, I. (2015a). Reconstruction of ancient palm vegetation landscapes using a phytolith approach. Quat. Int. 369, 1–16. doi: 10.1016/j.palaeo.2012.10.026
Albert, R. M., Bamford, M., Stanistreet, I. G., Stollhofen, H., Rivera-Rondón, C., and Rodríguez-Cintas, A. (2015b). Vegetation landscape at DK locality, Olduvai Gorge, Tanzania. Palaeogeogr. Palaeoclimatol. Palaeoecol. 426, 34–45. doi: 10.1016/j.palaeo.2015.02.022
Alvarez, L. J., Epstein, H. E., Li, J., and Okin, G. S. (2012). Aeolian process effects on vegetation communities in an arid grassland ecosystem. Ecol. Evol. 2, 809–821. doi: 10.1002/ece3.205
Barboni, D., Bonnefille, R., Alexandre, A., and Meunier, J. D. (1999). Phytoliths as palaeoenvironmental indicators, west side middle awash valley, Ethiopia. Palaeogeogr. Palaeoclimatol. Palaeocol. 152, 87–100. doi: 10.1016/s0031-0182(99)00045-0
Barboni, D., and Bremond, L. (2009). Phytoliths of East African grasses: an assessment of their environmental and taxonomic significance based on floristic data. Rev. Palaeobot. Palynol. 158, 29–41. doi: 10.1016/j.revpalbo.2009.07.002
Barboni, D., Bremond, L., and Bonnefille, R. (2007). Comparative study of modern phytolith assemblages from inter-tropical Africa. Palaeogeogr. Palaeoclimatol. Palaeocol. 246, 454–470. doi: 10.1016/j.palaeo.2006.10.012
Beuning, K., Zimmerman, K., Ivory, S., and Cohen, A. (2011). Vegetation response to glacial-interglacial climate variability near lake malawi in the southern African tropics. Palaeogeogr. Palaeoclimatol. Palaeocol. 303, 81–92. doi: 10.1016/j.palaeo.2010.01.025
Beverly, E. J., Peppe, D. J., Driese, S. G., Blegen, N., Faith, J. T., Tryon, C. A., et al. (2017). Reconstruction of late pleistocene paleoenvironments using bulk geochemistry of paleosols from the Lake Victoria Region. Front. Earth Sci. 5:93. doi: 10.3389/feart.2017.00093
Blinkhorn, J., and Eren, M. (2020). Neural networks differentiate between middle and later stone age lithic assemblages in eastern Africa. PLoS One 15:e0237528. doi: 10.1371/journal.pone.0237528
Blinnikov, M. (1994). Phytolith analysis and holocene dynamics of alpine vegetation. Zürich: Veröffentlichungen des Geobotanischen Institutes der ETH 115:18.
Blinnikov, M., Busacca, A., and Whitlock, C. (2002). Reconstruction of the late Pleistocene grassland of the Columbia basin, Washington, USA, based on phytolith records in loess. Palaeogeogr. Palaeoclimatol. Palaeoecol. 177:25.
Blome, M., Cohen, A., Tryon, C., and Brooks, A. (2012). The environmental context for the origins of modern human diversity: a synthesis of regional variability in African climate 150,000-30,000 years ago. J. Hum. Evol. 62, 563–592. doi: 10.1016/j.jhevol.2012.01.011
Brown, E., Johnson, E., Scholz, C., Cohen, A., and King, J. (2007). Abrupt change in tropical African climate linked to the bipolar seesaw over the past 55,000 years. Geophys. Res. Lett. 34, L20702–L20706.
Bushozi, G. M. P., Luque, L., and Mabulla, A. (2017). Geochronology and technological development: The microscopic and metric evidence from Middle Stone Age (MSA) points at Mumba rock-shelter, northern Tanzania. Paleoecol. Afr. 34, 183–206. doi: 10.1201/9781315161808-10
Bushozi, P. M., Skinner, A., and de Luque, L. (2020). The middle stone age (MSA) technological patterns, innovations, and behavioral changes at bed VIA of Mumba Rockshelter, Northern Tanzania. Afr. Archaeol. Rev. 37, 293–310. doi: 10.1007/s10437-019-09360-y
Cohen, A., Stone, J., Beuning, K., Park, L., Reinthal, P., Dettman, D., et al. (2007). Ecological consequences of early late Pleistocene megadroughts in tropical Africa. Proc. NatL. Acad. Sci. U S A 104, 16422–16427. doi: 10.1073/pnas.0703873104
Collura, L. V., and Neumann, K. (2017). Wood and bark phytoliths of West African woody plants. Quat. Int. 43, 142–159. doi: 10.1016/j.quaint.2015.12.070
Diez-Martín, F., Domínguez-Rodrigo, M., Sánchez, P., Mabulla, A., Tarriño, A., Barba, R., et al. (2009). The middle to later stone age technological transition in East Africa. New data from mumba rockshelter bed V (Tanzania) and their implications for the origin of modern human behavior. J. Afr. Archaeol. 7, 1–27. doi: 10.1163/26836408-15010020
Domínguez-Rodrigo, M., Díez-Martín, F., Mabulla, A., de Luque, L., Alcalá, L., Tarriño, A., et al. (2007). The Archaeology of the middle pleistocene deposits of Lake Eyasi, Tanzania. J. Afr. Archaeol. 5, 47–78. doi: 10.3213/1612-1651-10085
Ebinger, C., Djomani, Y. P., Mbede, E., Foster, A., and Dawson, J. B. (1997). Rifting Archaean lithosphere: the Eyasi–Manyara–Natron rifts, East Africa. J. Geol. Soc. 154, 947–960. doi: 10.1144/gsjgs.154.6.0947
Eichhorn, B., Neumann, K., and Garnier, A. (2010). Seed phytoliths in west african commelinaceae and their potential for palaeoecological studies. Palaeogeogr. Palaeoclimatol. Palaeoecol. 298, 300–310. doi: 10.1016/j.palaeo.2010.10.004
Eren, I. M., Diez-Martin, F., and Dominguez-Rodrigo, M. (2013). An empirical test of the relative frequency of bipolar reduction in Beds VI, V, and III at Mumba Rockshelter, Tanzania: implications for the East African Middle to Late Stone Age transition. J. Archael. Sci. 40, 248–256. doi: 10.1016/j.jas.2012.08.012
Fahmy, A. G. (2008). Diversity of lobate phytoliths in grass leaves from the Sahel region, west tropical Africa: Tribe Paniceae. Plant Syst. Evol. 270, 1–23. doi: 10.1007/s00606-007-0597-z
Fredlund, G. G., and Tieszen, L. T. (1994). Modern phytolith assemblages from the Northern American Great Plains. J. Biogeogr. 21, 321–335. doi: 10.2307/2845533
Garcin, Y., Vincens, A., Williamson, D., and Guiot, J. (2006). Wet phases in tropical southern Africa during the last glacial period. Geophys. Res. Lett. 33, L07703–L07706.
Gasse, F., Talling, J., and Kilham, P. (1983). Diatom assemblages in East Africa: classification, distribution and ecology. Rev. d’hydrobiologie tropicale 16, 3–34.
Gliganic, L. A., Jacobs, Z., Roberts, R. G., Domínguez-Rodrigo, M., and Mabulla, A. Z. P. (2012). New ages for middle and later stone age deposits at mumba rockshelter, Tanzania: optically stimulated luminescence dating of quartz and feldspar grains. J. Hum. Evol. 62, 533–547. doi: 10.1016/j.jhevol.2012.02.004
Greenway, P. J., and Vesey-Fitzgerald, D. F. (1969). The vegetation of lake manyara national park. J. Ecol. 57, 127–149. doi: 10.2307/2258212
Hammer, Ø, Harper, D. A. T., and Ryan, P. D. (2001). Past: paleontological statistics software package for education and data analysis. Palaeontol. Elect. 4:9.
Kindt, R., van Breugel, P., Lillesø, J.-P. B., Bingham, M., Demissew, S., Dudley, C., et al. (2011). “Potential natural vegetation of Eastern Africa (Ethiopia, Kenya, Malawi, Rwanda, Tanzania, Uganda and Zambia),” in Description and Tree Species Composition for Woodland and Wooded Grassland Potential Natural Vegetation Types, Vol. 3, 63 Edn. (københavn: Forest & Landscape, University of Copenhagen), 176.
Kohl-Larsen, L. (1943). Auf den Spuren des Vormenschen. Forschungen, Fahrten und Erlebnisse in Deutsch-Ostafrika (Deutsche Afrika-Expedition 1934-1936 und 1937-1939), Band II. Stuttgart: Strecker und Schröder.
Kok, J. F., Parteli, E. J. R., Michaels, T. I., and Karam, D. B. (2012). The physics of wind-blown sand and dust. Rep. Prog. Phys. 75:106901. doi: 10.1088/0034-4885/75/10/106901
Madella, M., Alexandre, A., and Ball, T. (2005). International code for phytolith nomenclature 1.0. Ann. Bot. 96, 253–260. doi: 10.1093/aob/mci172
McBrearty, S., and Brooks, A. (2000). The revolution that Wasn’t: A new interpretation of the origin of modern human behavior. J. Hum. Evol. 39, 453–563. doi: 10.1006/jhev.2000.0435
Mehlman, M. (1989). Later Quaternary Archaeological Sequences in Northern Tanzania. Champaign, IL: University of Illinois.
Mehlman, M. J. (1979). Mumba-Hohle revisited: The relevance of a forgotten excavatio to some current issues in east african prehistory. World Archaeol. 11, 80–94. doi: 10.1080/00438243.1979.9979751
Mercader, J., Astudillo, F., Barkworth, M., Bennett, T., Esselmont, C., Kinyanjui, R., et al. (2010). Poaceae phytoliths from the Niassa Rift, Mozambique. J. Archaeol. Sci. 37, 1953–1967. doi: 10.1016/j.jas.2010.03.001
Mercader, J., Bennett, T., Esselmont, C., Simpson, S., and Walde, D. (2009). Phytoliths in woody plants from the Miombo woodlands of Mozambique. Ann. Bot. 104, 91–113. doi: 10.1093/aob/mcp097
Mercader, J., Bennett, T., Esselmont, C., Simpson, S., and Walde, D. (2011). Soil phytoliths from miombo woodlands in Mozambique. Quat. Res. 75, 138–150. doi: 10.1016/j.yqres.2010.09.008
Mercader, J., Bennett, T., Esselmont, C., Simpson, S., and Walde, D. (2013). Phytoliths from middle stone age habitats in the mozambican Rift (105-29ka). J. Hum. Evol. 64, 328–336. doi: 10.1016/j.jhevol.2012.10.013
Mercader, J., Clarke, S., Bundala, M., Favreau, J., Inwood, J., Itambu, M., et al. (2019). Soil and plant phytoliths from the Acacia-Commiphora mosaics at Oldupai Gorge (Tanzania). Peer J. 7:e8211. doi: 10.7717/peerj.8211
Mercader, J., Marti, R., Gonzalez, I., Sanchez, A., and Garcia, P. (2003). Archaeological site formation in tropical forests: insights from the Ituri rock shelters, Congo. J. Archaeol. Sci. 30, 45–65. doi: 10.1006/jasc.2002.0810
Mercader, J., Runge, F., Vrydaghs, L., Doutrelepont, H., Ewango, C. E. N., and Juan-Tresseras, J. (2000). Phytoliths from archaeological sites in the tropical forest of ituri, Democratic Republic of Congo. Quat. Res. 54, 102–112. doi: 10.1006/qres.2000.2150
Mulholland, S. C. (1989). Phytolith shape frequencies in North Dakota grasses: a comparison to general patterns. J. Archaeol. Sci. 16, 489–511. doi: 10.1016/0305-4403(89)90070-8
Mumbi, C., Marchant, R., Hooghiemstra, H., and Wooller, M. J. (2008). Late Quaternary vegetation reconstruction from the Eastern Arc Mountains, Tanzania. Quat. Res. 69, 326–341. doi: 10.1016/j.yqres.2007.10.012
Mwitondi, M. S. (2021). Establishing Neolithic Chronology, Mobility and Settlement Patterns at Lake Eyasi Basin, Northern Tanzania. Dar es Salaam: University of Dar es Salaam.
Neumann, K., Fahmy, A. G., Lespez, L., Ballouche, A., and Huysecom, E. (2009). The Early Holocene palaeoenvironment of Ounjougou (Mali): Phytoliths in a multiproxy context. Palaeogeogr. Palaeoclimatol. Palaeoecol. 276, 87–106. doi: 10.1016/j.palaeo.2009.03.001
Neumann, K., Fahmy, A. G., Müller-Scheeßel, N., and Schmidt, M. (2017). Taxonomic, ecological and palaeoecological significance of leaf phytoliths in West African grasses. Quat. Int. 434:18.
Nightingale, S., Schilt, F., Thompson, J. C., Wright, D. K., Forman, S., Mercader, J., et al. (2019). Late middle stone age behavior and environments at chaminade I (Karonga, Malawi). J. Paleolithic Archaeol. 2, 258–297. doi: 10.1007/s41982-019-00035-3
Novello, A., Barboni, D., Berti-Equille, L., Mazur, J. C., Poilecot, P., and Vignaud, P. (2012). Phytolith signal of aquatic plants and soils in Chad, Central Africa. Rev. Palaeobot. Palynol. 178, 43–58. doi: 10.1016/j.revpalbo.2012.03.010
Osterrieth, M., Madella, M., Zurro, D., and Alvarez, M. F. (2009). Taphonomic aspects of silica phytoliths in the loess sediments of the Argentinean Pampas. Quat. Int. 193, 70–79. doi: 10.1016/j.quaint.2007.09.002
Prendergast, M., Luque, L., Domínguez-Rodrigo, M., Diez-Martín, F., Mabulla, A., and Barba, R. (2007). New excavations at Mumba Rockshelter. J. Afr. Archaeol. 5, 217–243. doi: 10.3213/1612-1651-10093
Rovner, I. (1971). Potential of opal phytoliths for use in paleoecological reconstruction. Quat. Res. 1, 343–359. doi: 10.1016/0033-5894(71)90070-6
Runge, F. (1999). The opal phytolith inventory of soils in Central Africa - Quantities, shapes, classification, and spectra. Rev. Palaeobot. Palynol. 107, 23–53. doi: 10.1016/s0034-6667(99)00018-4
Schagerl, M., and Burian, A. (2016). “The Ecology of African Soda Lakes: Driven by Variable and Extreme Conditions,” in Soda Lakes of East Africa, ed. M. Schagerl (Cham: Springer), 295–320. doi: 10.1007/978-3-319-28622-8_12
Schagerl, M., and Renault, R. W. (2016). Soda Lakes of East Africa. Switzerland: Springer International Publishing.
Scoon, R. N. (2018). Geology of National Parks of Central/Southern Kenya and Northern Tanzania Geotourism of the Gregory Rift Valley, Active Volcanism and Regional Plateaus. Berlin: Springer.
Shipton, C., Roberts, P., Archer, W., Armitage, S. J., Bita, C., Blinkhorn, J., et al. (2018). 78,000-year-old record of middle and later stone age innovation in an East African tropical forest. Nat. Commun. 9:1832. doi: 10.1038/s41467-018-04057-3
Strömberg, C. A. E., Dunn, R. E., Crifò, C., and Harris, E. B. (2018). “Phytoliths in Paleoecology: Analytical Considerations, Current Use, and Future Directions,” in Methods in Paleoecology, eds D. A. Croft, D. F. Su, and S. W. Simpson (Berlin: Springer), 235–288. doi: 10.1007/978-3-319-94265-0_12
Tierney, J. E., Russel, J. M., Huang, Y., Damsté, J. S. S., Hopmans, E. C., and Cohen, A. S. (2008). Northern hemisphere controls on tropical southeast african climate during the past 60,000 years. Science 322, 252–255. doi: 10.1126/science.1160485
Timmermann, A., and Friedrich, T. (2016). Late Pleistocene climate drivers of early human migration. Nature 538, 92–95. doi: 10.1038/nature19365
Trauth, M. H., Deino, A., and Strecker, M. R. (2001). Response of the East African climate to orbital forcing during the last interglacial (130–117 ka) and the early last glacial (117–60 ka). Geology 29, 499–502. doi: 10.1130/0091-7613(2001)029<0499:roteac>2.0.co;2
Tryon, C. A. (2018). The middle/later stone age transition and cultural dunamics of late Pleistocene East Africa. Evol. Anthropol. 28, 267–282. doi: 10.1002/evan.21802
Tryon, C. A., and Faith, T. J. (2013). Variability in the middle stone age of eastern Africa. Curr. Anthropol. 54, 234–254.
Vincens, A., Garcin, Y., and Buchet, G. (2007). Influence of rainfall seasonality on African lowland vegetation during the late quaternary: pollen evidence from Lake Masoko, Tanzania. J. Biogeogr. 34, 1274–1288. doi: 10.1111/j.1365-2699.2007.01698.x
White, F. (1983). The Vegetation of Africa: A descriptive memoir to accompany the UNESCO/AETFAT/UNSO vegetation map of Africa. Unesco, Paris: Natural Resources Research, 336.
Keywords: Mumba rock shelter, Middle to Later Stone Age Transition, phytolith analysis, Somalia-Masai/Zambezian zone, Acacia-Commiphora mosaic, grassland, steppe
Citation: Mercader J, Clarke S, Itambu M, Mohamed A, Mwitondi M, Siljedal G, Soto M and Bushozi P (2021) Phytolith Palaeoenvironments at Mumba Rock Shelter. Front. Ecol. Evol. 9:699609. doi: 10.3389/fevo.2021.699609
Received: 23 April 2021; Accepted: 07 June 2021;
Published: 09 July 2021.
Edited by:
Florent Rivals, Catalan Institution for Research and Advanced Studies (ICREA), SpainReviewed by:
Marco Madella, Pompeu Fabra University, SpainGregor Bader, Senckenberg Nature Research Society, Germany
Copyright © 2021 Mercader, Clarke, Itambu, Mohamed, Mwitondi, Siljedal, Soto and Bushozi. This is an open-access article distributed under the terms of the Creative Commons Attribution License (CC BY). The use, distribution or reproduction in other forums is permitted, provided the original author(s) and the copyright owner(s) are credited and that the original publication in this journal is cited, in accordance with accepted academic practice. No use, distribution or reproduction is permitted which does not comply with these terms.
*Correspondence: Julio Mercader, bWVyY2FkZXJAdWNhbGdhcnkuY2E=