 Martin Drechsler1,2*
- 1Department of Ecological Modelling, Helmholtz Centre for Environmental Research – UFZ, Leipzig, Germany
- 2Chair of Economics, in Particular Environmental Economics, Brandenburg University of Cottbus-Senftenberg, Cottbus, Germany
An important mechanism of species co-existence in spatially structured landscapes is the competition-colonisation trade-off which states that co-existence of competing species is possible if, all other things equal, the better competitor is the worse coloniser. The effectiveness of this trade-off for the facilitation of co-existence, however, is likely to depend on the spatial arrangement of the habitat, because too strong agglomeration of the habitat may overly benefit the strong competitor (being the poor disperser), implying extinction of the inferiour competitor, while too much dispersion of the habitat may drive the superiour competitor (being the inferiour coloniser) to extinction. In working landscapes, biodiversity conservation is often induced through conservation payments that offset the forgone profits incurred by the conservation measure. To control the spatial arrangement of conservation measures and habitats in a conservation payment scheme, the agglomeration bonus has been proposed to provide financial incentives for allocating conservation measures in the vicinity of other sites with conservation measures. This paper presents a generic spatially explicit ecological-economic simulation model to explore the ability of the agglomeration bonus to cost-effectively conserve multiple competing species that differ by their competition strengths, their colonisation rates and their dispersal ranges. The interacting effects of the agglomeration bonus and different species traits and their trade-offs on the species richness in the model landscape are analysed. Recommendations for the biodiversity-maximising design of agglomeration bonus schemes are derived.
Introduction
Loss and fragmentation of habitat are major drivers of the world-wide decline of biodiversity (Millennium Ecosystem Assessment, 2005). Restoring contiguous habitat is a means to counteract this process (Harris and Hobbs, 2001). While the implementation of such conservation measures is relatively easy on public lands, on private lands it is generally possible only with the consent of the landowners. Financial incentives like conservation payments are voluntary instruments that induce landowners to carry out conservation measures on their land. Such payment schemes are usually spatially homogeneous in that each landowners receives the same payment per area for a particular conservation measure, so the conservation agency has no control over the spatial allocation of the conservation measures. Instead, measures are usually carried out where they are least expensive, which may not be the ecologically most beneficial allocation.
An increasingly popular approach to incentivise the spatially aggregated provision of habitats is the agglomeration bonus by Parkhurst et al. (2002) in which a landowners receives a base payment for carrying out a conservation measure, and on top of this a bonus that is proportional to the number of adjacent land parcels on which the conservation measure is carried out, too. By now, the agglomeration bonus, and related concepts, have been studied in numerous theoretical (Drechsler et al., 2010; Bell et al., 2016; Iftekhar and Tisdell, 2016), experimental (Parkhurst and Shogren, 2007; Banerjee et al., 2012) and empirical (Lewis et al., 2011; Huber et al., 2021) articles and has found its way into various real-world applications (Krämer and Wätzold, 2018; Huber et al., 2021).
While most of the research on the agglomeration bonus is of a disciplinary economic nature, some research links the economic dimension with the ecological dimension to assess, e.g., the cost-effectiveness of different agglomeration bonus designs. A useful approach for such analyses is ecological-economic modelling (Wätzold et al., 2006; Drechsler, 2020). Much of the existing ecological-economic research on the agglomeration bonus, however, has focused only on single or non-interacting species (this applies not only to the particular topic of the agglomeration bonus but to ecological-economic research in the field of biodiversity conservation in general).
In contrast, ecologists have developed various useful concepts for the consideration of multiple interacting species. The oldest examples are the models by Lotka (1920) and Volterra (1931) for the description of two competing species and predator-prey systems. Another useful ecological concept is the competition-colonisation trade-off coined by Tilman (1994). It proposes that two species competing for the same resource can coexist if the superiour competitor has a lower mobility or ability to colonise empty habitat patches, so that the inferiour but more mobile species can persistently escape from the superiour competitor.
Such a trade-off has been observed, e.g., in species of Asteracea in Sweden (Jakobsson and Eriksson, 2003) where species with a good dispersal ability (measured, among others, by the number of dispersing seeds and the velocity by which seeds fall to the ground) tend to have a lower competition strength (measured by the size of seedlings after a given time with and without the presence of other species). Another example is the plant-ant community in Cameroon studied by Debout et al. (2009) where the ant species with the higher dispersal ability has the lower ability to maintain viable colonies in the presence of the other species.
A recent and very popular concept for the consideration of multiple interacting species is the metacommunity concept (Leibold et al., 2004; Holyoak et al., 2005). In a way it extends Tilman’s (1994) concept to more than two species (and to other types of interspecies interactions beyond competition). For this it combines two important ecological research fields: community ecology and metapopulation ecology. While community ecology focuses on the dynamics of multiple interacting species in a homogenous environment, metapopulation ecology (generally) focuses on the dynamics of single species in patchy environments where habitable patches are surrounded by a hostile “matrix” that can be crossed trough dispersal but is not suitable for reproduction. Habitable patches can harbour local populations which go extinct at a certain extinction rate, while empty habitat patches are colonised by neighbouring local populations at a certain colonisation rate (Hanski, 1999).
While the ecological dimension of metacommunity conservation has been addressed (e.g., in the research topic “Metacommunity Spatio-Temporal Dynamics: Conservation and Management Implications” of Frontiers of Ecology and Evolution), not much research exists that links ecological and economic research in the field. With respect to the agglomeration bonus, most of the empirical and theoretical research on the agglomeration bonus is either purely economic, not considering the influence of the bonus-induced land-use on the survival of species (cf. the references above); or where the ecological dimension is addressed, only single or multiple independent species are considered (e.g., Hartig and Drechsler, 2009).
To the author’s knowledge, the only paper that analysed the conservation of interacting species through the agglomeration bonus is by Surun and Drechsler (2018). In that analysis an ecological-economic model of a conservation offset scheme with agglomeration bonus was developed in which the number of land-use permits (conservation credits) awarded for the restoration of land are related to the number of conserved neighbouring land parcels. Based on the outlined competition-colonisation trade-off, a superiour competitor with a lower colonisation rate and an inferiour competitor with a higher colonisation rate were considered, and it was analysed which levels of the agglomeration bonus allow for the coexistence of the two species, and how the suitable bonus levels depend on the traits of the species. The influence of the agglomeration bonus on the costs of conserving the two species were not considered, so the analysis addressed only the ecological effectiveness of the conservation scheme.
The present paper extends the analysis of Surun and Drechsler (2018) to address issues of cost-effectiveness such that the ecological benefit (survival of species) is maximised for a given conservation budget. A major focus will be on the question of how the cost-effective level of the agglomeration bonus depends on the traits of the species, such as their competition strengths, colonisation rates and dispersal ranges, as well as the shape of the trade-off between competition strength and colonisation rate.
For this, the model of Surun and Drechsler (2018) is extended to consider (up to) five species, as well as non-local dispersal so land parcels at larger distances can be reached. Furthermore, a deterministic and a probabilistic version of the competition-colonisation trade-off are considered. To simplify the analysis, and since the practicality of the agglomeration bonus within conservation offsets has been questioned (Parkhurst et al., 2016), the paper returns to the original application of the agglomeration bonus concept within conservation payments.
In the following section the model is presented as well as the way in which it is analysed, which includes, among others, the specification of model parameter ranges and the introduction of ecological and economic output variables. Extensive sensitivity analyses are carried with respect to these output variables whose results are presented and discussed in the Results and the Discussion.
Materials and Methods
Model Description
The model is a generic model which is based on fundamental ecological and economic concepts. It assumes a fictitious landscape (model region) and consists of an economic and ecological module.
Model Region
The model region is a square grid with N by N grid cells (land parcels). Each land parcel i can be managed for economic purposes (intensive agriculture: zi = 0) or for the provision of habitat (conservation: zi = 1). Conservation of land parcel i incurs an opportunity cost (foregone agricultural profit) ci. The costs ci are drawn randomly and independently from a uniform distribution with bounds 1 ± σ. By choosing a mean cost of 1, all economic quantities, including the budget and the conservation payments (in particular, the base payment and the agglomeration bonus introduced below) are scaled in units of the mean cost. Boundary conditions are periodic, so if a model process (see below) depends on the state of a grid cell outside the model region and l units away from a boundary, the state of the grid cell inside the model region and l units away from the opposite boundary is considered (by this the model world has the shape of a torus).
Economic Module
The economic module is initialised with all land parcels being in agricultural use (zi = 0 for all i). The conservation agency offers a base payment b for those land parcels that change to conservational use. An additional agglomeration bonus a is paid for each adjacent conserved land parcel, so the total conservation payment for land parcel i equals:
where the sum runs over the eight adjacent land parcels around land parcel i (land parcel i’s Moore neighbourhood Mi). A landowner will conserve if pi > ci and do agriculture otherwise. With the model region being initially in agricultural use, so that pi = bzi, land parcels with b > ci switch to conservation. Based on the resulting land-use pattern, the payment pi is offered again for all landowners who now switch to conservation. Land parcels that are adjacent to conserved land parcels receive the bonus a as described in Eq. (1). Based on the new land-use pattern the payment pi is offered again for all landowners who switch to conservation. This process is continued until the land-use pattern does not change any more.
The analysis assumes that the payments pi are supplied by a conservation agency which has a budget B to cover the payments:
The budget B is monotonically increasing in a and b, so for given B a large (small) a is associated with a comparatively small (large) b to exhaust the budget.
Ecological Module
The output of the economic module is the land-use pattern, characterised by the zi for all N by N land parcels. All land parcels with zi = 1 are suitable habitat for a local population while the others are suitable only for dispersal. The ecological module is initialised by assuming that each habitat parcel is occupied by one species, and the identity of the species is selected randomly.
The dynamics of the S species in the ecosystem are simulated in discrete time steps. Local populations of all species go extinct with probability e per time step. For the colonisation of unoccupied, empty, habitat parcels, first for each land parcel i the number nis of local populations of species s in the neighbourhood around parcel i is determined.
The neighbourhood Hi(d) around land parcel (grid cell) i has a square shape and is defined by the set of land parcels whose east-west and north-south coordinates differ from those of land parcel i by less than or equal to d, where d is identified with the species dispersal range. So the neighbourhood Hi(d = 1) contains the eight land parcels adjacent to land parcel i, Hi(2) contains these plus the 16 adjacent land parcels and so on.
Ignoring for the moment the competition between the different species, it is assumed that each of the local population in neighbourhood Hi(d) colonises the empty land parcel i with probability cs per time step. The probability Cis of being colonised by at least one local population of species s thus is:
Obviously, for given colonisation probability, the probability of a local population colonising an empty land parcel increases with increasing dispersal range. This effectively increases the number of overall colonisation events and—as preliminary simulations show—strongly dominates the spatial effect of the increased dispersal range (such that a local population is able to affect more distant land parcels). In order to detect such spatial effects, the colonisation probability is rescaled dependent on d via:
where cs is understood as the colonisation probability for the case of d = 1. By this an increase in the dispersal range, e.g., from d = 1 to d = 2 will change the colonisation probability only if the proportion of occupied land parcels in the larger neighbourhood H(2) differs from that in the smaller neighbourhood H(1).
Using the probabilities Cis from Eq. (3), for each land parcel it is sampled by which species it could be “potentially” colonised, i.e., if there were immigrants only from species s. The result is expressed by a vector vi = (vi1, …, viS) where vis = 1 if species s can potentially colonise land parcel i and vis = 0 otherwise.
Now consider that, in the presence of multiple species, only one species can actually colonise the habitat parcel, and that the species have different competition strengths ks. Species s then is assumed to win the competition for habitat parcel i with probability:
To complete the description of the colonisation process, if the habitat parcel is not empty but occupied by some species s, this presence is considered by vis = 1. Implicitly, this assumes that being a resident in the habitat parcel is neither an advantage nor a disadvantage relative to being an immigrant—an assumption that might be relaxed in future analyses.
Lastly, a model is required for the trade-off between competition strength k and colonisation probability c. Two approaches are considered, one for perfect negative correlation and one for imperfect negative correlation. For perfect negative correlation (as it is considered, e.g., in Tilman, 1994), the competition strengths of the S species are assumed to be distributed at equal distances between two bounds, mk ± sdk so that the competition strength of species s is given by:
By Eq. (6), species 1 is the most competitive one with k1 = mk + sdk, and species S is the least competitive one with kS = mk – sdk. The ranking of the colonisation probabilities is exactly opposite:
so that species 1 has the lowest colonisation probability c1 = mc – sdc and species S has the highest, cS = mc + sdc.
For imperfectly correlated species traits, S pairs of correlated numbers, (x1, y1), (x2, y2), …, (xS, yS), are drawn uniformly from the unit interval [0, 1] with correlation ρ < 0, as proposed by Drechsler and Wätzold (2020). The competition strengths and colonisation probabilities of the species are then calculated as:
A real example of the correlated distribution and competition strengths and colonisation rates (though considering very small spatial scales) is provided by Cadotte et al. (2006) who ranked protozoan and rotifer species by their competition strength and colonisation ability and found a correlation between competition and colonisation ranks of –0.74. Since these ranks provide only ordinal information, this correlation coefficient can, of course, only be a rough estimate on the correlation coefficient that would be obtained if the competition strengths and colonisation rates were measured on cardinal scales, and standard deviations of the competition strengths and colonisation rates cannot be calculated at all.
To complete the model description, the dispersal range is sampled from the uniform distribution with bounds md ± sdc and rounded to the next integer number.
Model Analysis
Model Simulation and Output
As indicated in the previous section, the model simulation consists of two parts. First, starting from a model region in agricultural use, the conservation payment, Eq. (1) induces landowners to conserving their land parcel, and time step by time step a pattern of agricultural and conserved land parcels emerges. Typically, it takes about 10–20 time steps to reach a static pattern that does not change any more.
The land-use pattern depends on the magnitudes of the base payment b and the agglomeration bonus a. Since the focus is on cost-effectiveness as defined in the Introduction, a fixed budget is assumed, which implies that for given base payment b the agglomeration bonus a is uniquely defined. The determination of the appropriate bonus is done via Newton’s secant method. Sometimes, due to mathematical discontinuities the budget constraint cannot be met with the desired accuracy (one integer budget unit which is a few percent of the available budget: see section “Sensitivity Analysis”), and only runs of the economic module are considered that fulfil this constraint. The output of the economic simulation is the bonus a that is associated with the chosen base payment b and budget B, as well as the information which of the land parcels are conserved.
Having determined the land-use pattern, the ecological module is simulated with the initial condition mentioned above, that each conserved land parcel is randomly assigned a local population of one of the S species. The ecological dynamics are simulated for 100 time steps. In the final time step it is recorded for each land parcel by which species it is occupied (or whether it is empty).
From the recorded land-use and occupancy data the following output variables are calculated:
(1) the proportion of conserved land parcels (cons)
(2) the level of spatial agglomeration of the conserved land parcels (clust_cons) (Eq. 9)
(3) the number of extant species (which occupy at least one land parcel) (nspp)
(4) the mean competition strength taken over of the extant species (m_comp)
(5) the mean colonisation probability taken over the extant species (m_col)
(6) the mean dispersal distance taken over the extant species (m_disp)
(7) the mean proportion of occupied land parcels in the model region (m_occ), taken over all extant species
(8) the mean level of spatial aggregation of the occupied land parcels (m_clust_occ) (analogous to Eq. 9), taken over all extant species.
The ecological simulation, including the sampling of the species traits, is repeated 100 times, and averages over the eight output variables are taken to encompass the ecological stochasticity. The simulation of the economic module and the associated 100 replications of the ecological module are repeated 100 times to encompass the economic stochasticity, and again an average of the eight output variables is taken.
The ninth and last quantity of interest is the cost-effective ratio, (a/b)ce of agglomeration bonus and base payment. To determine it, the base payment b and the agglomeration bonus a are varied systematically under the budget constraint, Eq. (2). Following the definition of cost-effectiveness provided in the Introduction, the cost-effective combination of a and b is where nspp is maximised for the given budget B.
Technically, the base payment b is varied in 21 steps from the minimum conservation cost, 1 – σ, to the maximum conservation cost, 1 + σ. For each level of b the ecological-economic model is simulated and for each of the 100 replicates of the economic simulation the agglomeration bonus a is determined, so that the conservation budget is exactly exhausted, as explained above. An average is taken over the 100 simulation replicates. Out of the 21 considered combinations of a and b the one is identified that maximises the (mean) number of extant species, nspp.
Values of the Model Parameters
Two sizes of model regions are considered (Table 1). For the small region, N = 11, two species are considered to mimic the 2-species model of Tilman (1994). As an alternative, a region with S = 5 species is considered. Preliminary model analyses revealed that the small region is too small to allow for the persistence of more than two competing species. So the case of S = 5 is considered only with the large model region, N = 15.
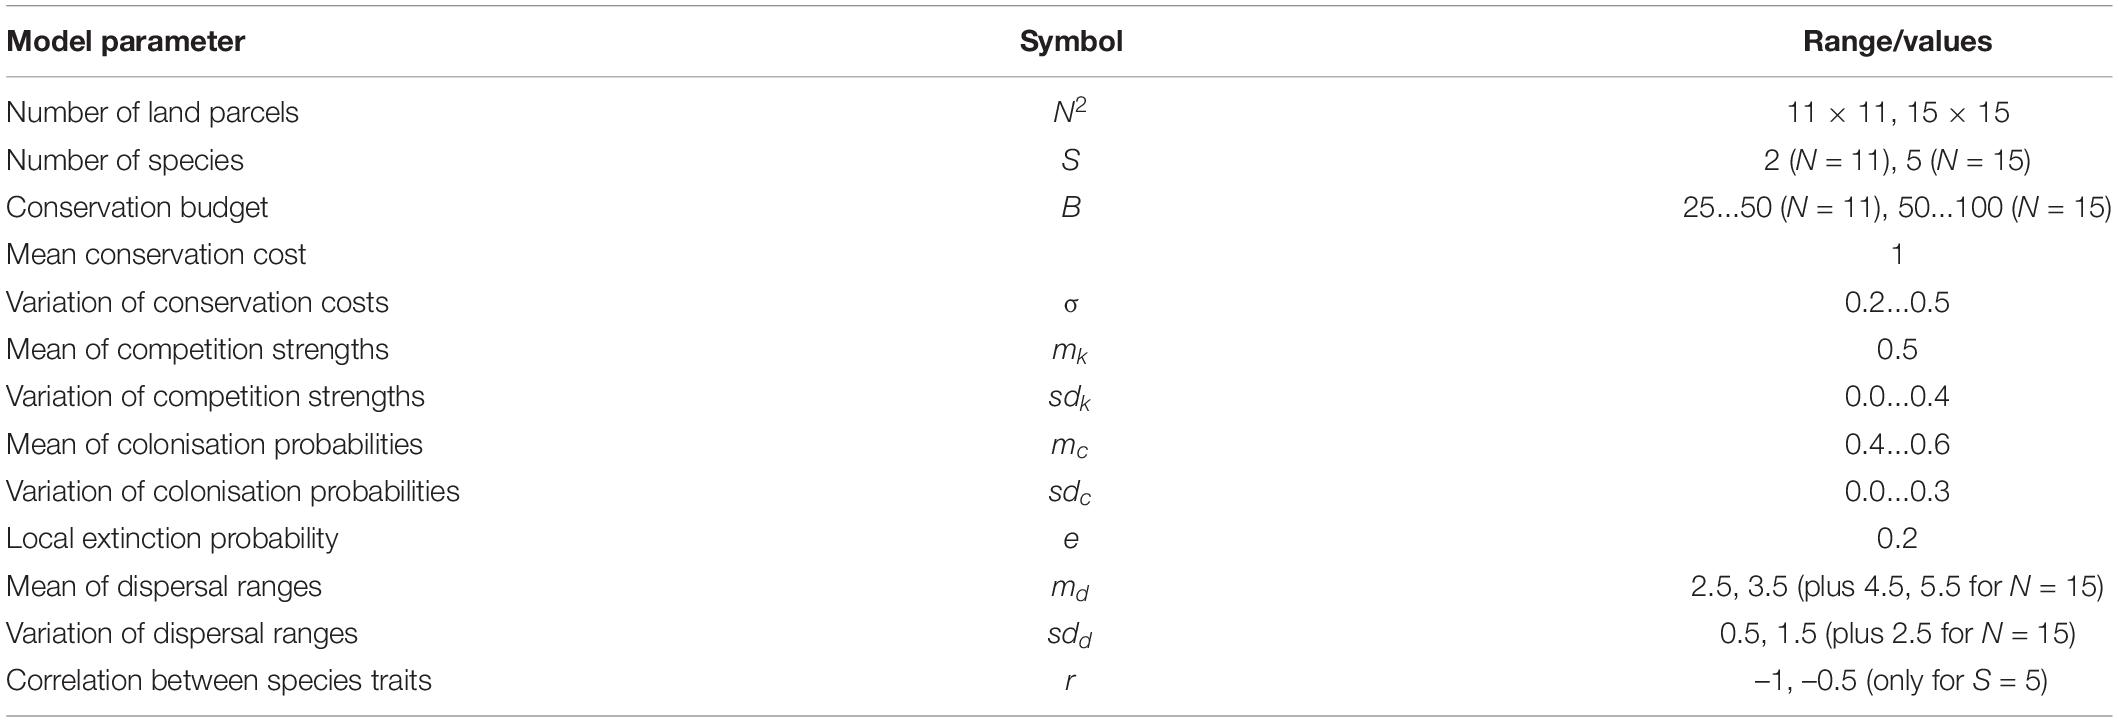
Table 1. Values of the model parameters.
The range of the conservation budget is chosen so that in general between a few and a few dozen percent of the land parcels can be conserved, and the cost variation has a similar range as, e.g., in Drechsler (2021). A value of σ = 0.2 (0.5) means that the most costly land parcel is about 50 percent (three times) more costly than the least costly one, which should cover a wide range of real situations.
As described in section “Ecological Module,” the competition strengths ks, as well as the colonisation probabilities cs and dispersal ranges ds, are sampled from ranges mk ± sdk, mc ± sdc, and md ± sdd, respectively. The competition strengths range, without loss of generality, between zero and one. Table 1 shows the considered values for mk and sdk which encompass high to low variation in the competition strengths among the species. The range of the mean colonisation probability, mk, as well as the value for the local extinction probability, e, are chosen so that for average values of the other model parameters the expected number of surviving species is at about S/2. The ranges of sdk and sdc are chosen to encompass a wide range of cases from those where the inferiour species has little survival chances (large sdk and small sdc) to the those where the superiour species has little survival chances (small sdk and large sdc).
The dispersal range d measures how many grid cells a dispersing individual can travel. Considering, as described above, that non-integer dispersal ranges are rounded to the next integer, the minimum sensible (non-integer) value for the dispersal range is 0.5. Under periodic boundary conditions, a dispersal range of d = N/2 represents global dispersal under which dispersers from a local population can reach any other land parcel. These two constraints explain the ranges of md and sdd in Table 1.
Lastly, for the case of imperfect negative correlations between species traits, a value if ρ = –0.5 is considered. Imperfect correlation is not very meaningful if there are only two species, so this case is considered only for the case of S = 5.
Sensitivity Analysis
Three scenarios are considered:
1 N = 11, S = 2, ρ = –1
2 N = 15, S = 5, ρ = –1
3 N = 15, S = 5, ρ = –0.5
The first scenario is closest to the 2-species systems of Tilman (1994) and Surun and Drechsler (2018). The second scenario extends to the consideration of five species with the same deterministic trade-off between competition strength and colonisation rate, where the stronger competitor is, with certainty, the worse coloniser (Eqs. 6 and 7). The size of the model region is enlarged to 15 × 15 land parcels. The larger size of the model region allows for larger meaningful dispersal ranges of the species and a better analysis of the influence of the species dispersal ranges. The third scenario is identical to the second but considers the alternative, probabilistic trade-off of Eq. (8), so that the stronger competitor is not with certainty, but only likely to be, the worse coloniser.
For each of the three scenarios, 8,000, 4,000, and 1,000 random model parameter combinations are sampled from the ranges in Table 1 (the smaller numbers of replicates in scenarios 2 and 3 were chosen for computation time constraints). For each parameter combination the nine introduced output variables are determined, representing a global sensitivity analysis (Saltelli et al., 2019). The range of each of the model parameters B, σ, sdk, mc and sdc is split into five subranges of equal size. For md and sdd, the 2 × 2 (N = 11) or 4 × 3 (N = 15) possible combinations of values are considered. By this the multidimensional model parameter space is subdivided into small segments into which the model parameter combinations are sorted into, and an average of the nine output variables is taken.
Plotting an output variable versus the five subranges of a particular model parameter resembles a one-at-a time (OAT) sensitivity analysis (Saltelli et al., 2019) to detect main effects, and plotting it versus the subranges of two model parameters simultaneously allows detecting 2-way interactions between model parameters. The chosen approach of model analysis is more flexible and makes the parallel analysis of a multitude of model parameter combinations more easy than standard sensitivity analysis in which the model parameter values are chosen from a fixed set of values. Effectively, however, both approaches are equivalent.
To explore some issues in more detail, two additional analyses are carried out. The first reveals how the number of extant species nspp depends on the variations in the competition strengths and colonisation rates (sdk and sdc) for several levels of their correlation ρ.; the other model parameters are set at the mean values of their ranges (Table 1). The second analysis investigates how selected model output variables depend on the ratio a/b of agglomeration bonus and base payment. Eight model parameter combinations are considered here, defined by systematically varying sdk ∈ {0.1, 0.4}, sdc ∈ {0.1, 0.3} and md ∈ {2.5, 5.5}; scenario 2 is assumed with N = 15, S = 5 and ρ = –1, with all other model parameters at their median values.
Results
The results below are sorted with respect to whether they refer to the ecological dimension of the conservation problem, or the economic dimension, or whether they are of an ecological-economic nature. Each section combines the results from the three scenarios defined above which are presented in detail in Supplementary Appendices A–C, respectively.
Ecological Results
(1) According to the simulation experiments for scenario 1 (N = 11, S = 2), the expected number of surviving species nspp (as well as the mean proportion of occupied land parcels m_occ) is maximised if the variation in the competition strengths of the species is of a similar magnitude as the variation in the colonisation probabilities: sdk ≈ sdc (Supplementary Figure A1).
(2) The mean competition strength m_comp (taken over all extant species) increases with increasing sdk and decreasing sdc (Supplementary Figure A4) while the mean colonisation probability m_col increases with decreasing sdk and increasing sdc (Supplementary Figure A5). The former observation indicates a dominance of superiour species while the latter indicates a dominance of inferiour species.
(3) The mean dispersal range m_disp (taken over all extant species) is not considerably affected by any model parameter (Supplementary Figure A6).
(4) The analysis of scenario 2 with the larger number of and parcels and species (N = 15, S = 5) confirms these findings (see the corresponding Supplementary Figures B1, B4–B6) and in addition reveals that the expected number of extant species, nspp, decreases within increasing md and increasing sdd (Supplementary Figure B1).
(5) In contrast to nspp, the proportion and spatial aggregation of occupied land parcels, m_occ and m_clust_occ, increase with increasing md (Supplementary Figures B2, B3).
(6) And, as one could expect, the mean of the dispersal ranges, m_disp, increases with increasing md (Supplementary Figure B6).
(7) The results for scenario 3 with imperfect negative correlation between competition strength and colonisation probability are largely identical to those for scenario 2, with one important difference: the expected number of extant species is not maximised by equating the variation of competition strengths (sdk) with that of the colonisation probabilities (sdc), but it is maximised when both these model parameters are small, i.e., if all species have more or less identical competitions strengths and identical colonisation probabilities (Supplementary Figure C1).
To further elaborate on this finding, another analysis was added for which all model parameters except for sdk, sdc and the correlation ρ are fixed at the median values of their ranges, while those three are varied to six equidistant levels within their ranges. Figure 1 confirms that for small negative correlations ρ, the expected number of extant species declines with increasing sdk and sdc, while only at large negative correlations it has fairly large levels even for larger sdk and sdc, as long as these have similar magnitudes.
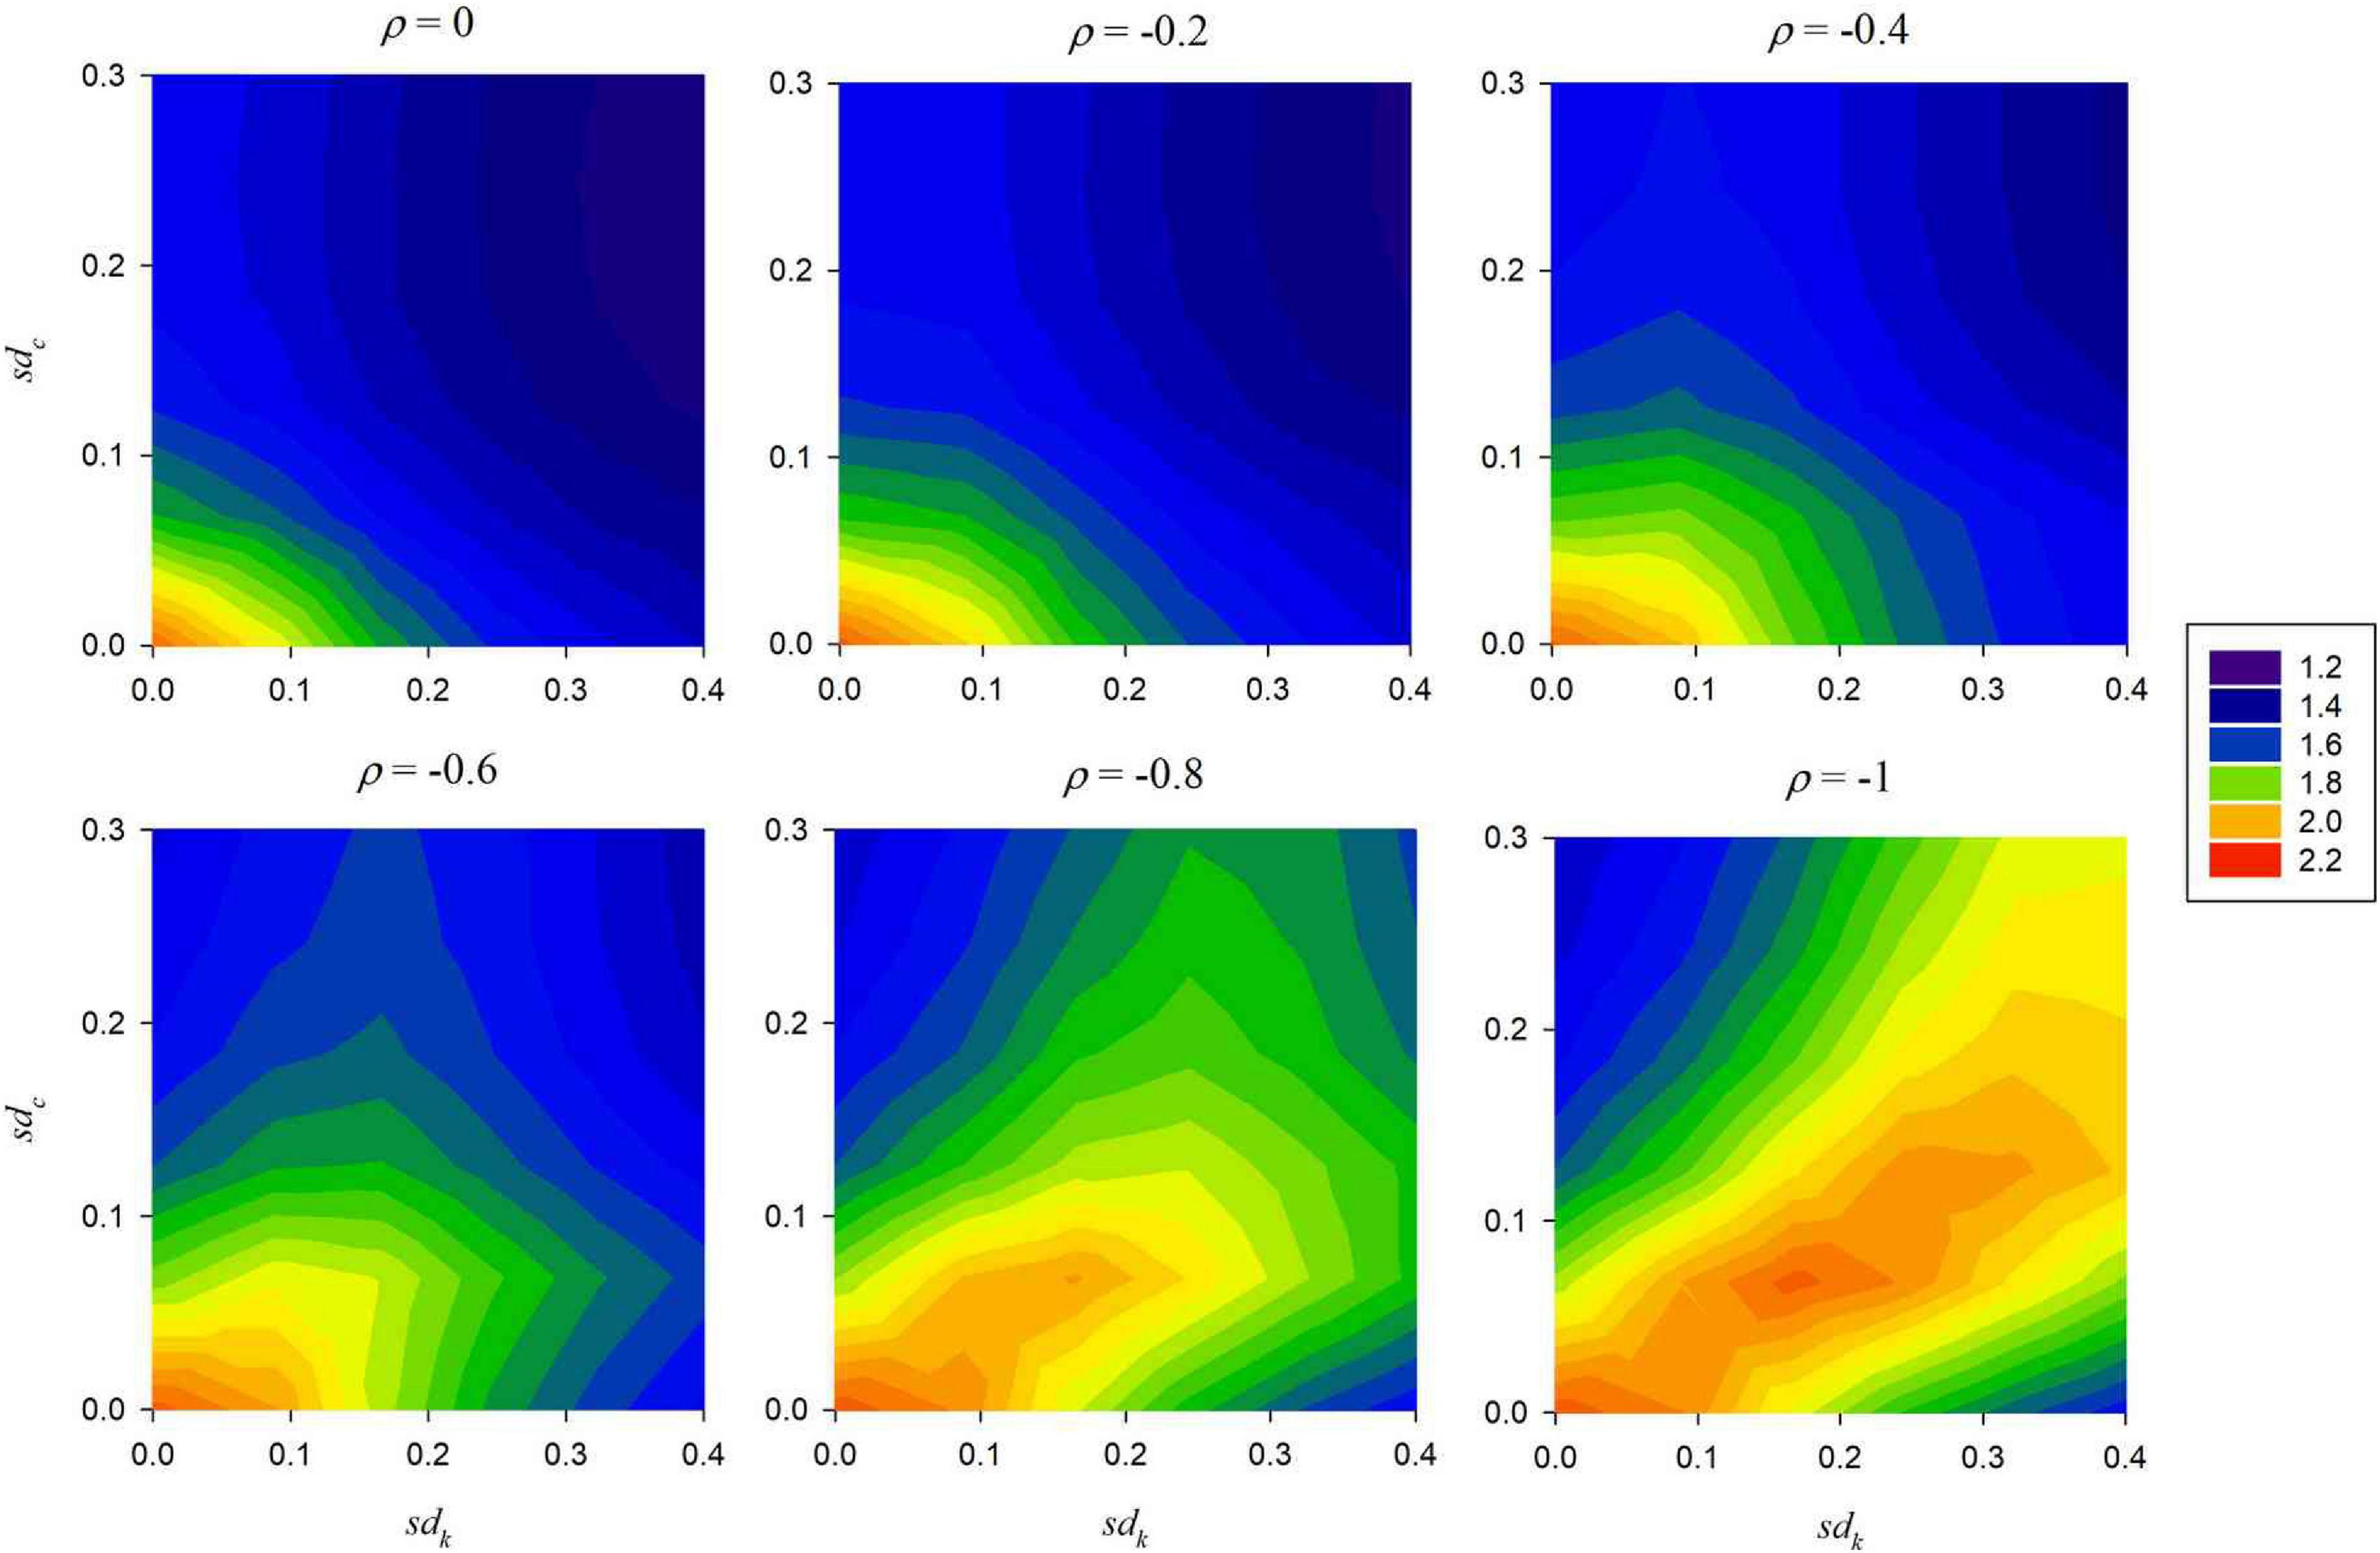
Figure 1. Expected number of extant species (nspp), by colour, as a function of the variation in competition strengths (sdk) and the variation in the colonisation probabilities (sdc) for various levels of the correlation ρ between competition strength and colonisation probability. Number of land parcels N2 = 115, number of species S = 5; other model parameters at the median values of their ranges (Table 1).
Economic Results
(8) Analysis of scenario 1 (scenarios 2 and 3 lead to the same economic results as scenario 1) yields the expected result that increasing the conservation budget B increases the proportion cons of conserved land parcels (Supplementary Figure A8)—which increases the expected number of surviving species nspp (Supplementary Figure A1). Otherwise the conservation budget has no considerable effect.
(9) Increasing the cost variation σ increases the cost-effective agglomeration bonus (a/b)ce (Supplementary Figure A7) because the likelihood of finding low-cost neighbours is reduced. So at high cost variation a rather high agglomeration bonus must be offered to induce a desired level of spatial agglomeration of conserved land parcels, which agrees with findings of Drechsler and Wätzold (2009).
(10) The proportion of conserved land parcels cons is negatively correlated with clust_cons (compare Supplementary Figure A8 with Supplementary Figure A9). This is a simple consequence of the “patch selection effect” coined by Drechsler et al. (2010): a high spatial agglomeration implies high average cost of the conserved land parcels, so for given conservation budget the total number of conserved land parcels is low—causing a trade-off between the number and the spatial agglomeration of conserved land parcels.
Ecological-Economic Results
(11) Analysis of scenario 1 reveals that the cost-effective level of the agglomeration bonus (a/b)ce (Supplementary Figure A7) and the implied level of spatial agglomeration of the conserved land parcels, clust_cons (Supplementary Figure A9), is negatively correlated with nspp, so that for sdk ≈ sdc the cost-effective bonus is smaller than in the cases in which sdk and sdc strongly differ from each other. In that latter case only one species survives (Supplementary Figure A1) and the survival of a single species is, of course, favoured by a high level of habitat agglomeration and a rather large agglomeration bonus. In contrast, for the coexistence of both species, with sdk ≈ sdc, too much habitat agglomeration is harmful, so (a/b)ce is rather small.
(12) The same result is obtained for scenario 2 (Supplementary Figure B7), except that even for very unequal sdk and sdc, species numbers nspp > 1 can be achieved. For sdk >> sdc these are the superiour competitors, while for sdk << sdc the good colonisers survive. In either case, the cost-effective agglomeration bonus is relatively large.
(13) The cost-effective level of the agglomeration bonus (a/b)ce decreases with increasing mean dispersal range md (Supplementary Figure B7). As explained above, via the patch selection effect this allows for the conservation of a higher number of land parcels, increasing the proportion of conserved land parcels, cons (Supplementary Figure B8).
(14) While in scenario 2 the cost-effective level of the agglomeration bonus (a/b)ce, decreases with increasing sdk, in scenario 3 it increases (Supplementary Figure C7), so an increasingly higher agglomeration bonus should be offered with increasing variation in the species’ competition strengths.
(15) Starting from the observed existence of a cost-effective level of a/b, in an additional analysis the effect of a/b on nspp and the mean traits of the extant species, m_comp, m_col and m_disp, is analysed for eight different combinations of the model parameters sdk, sdc and md (section “Sensitivity Analysis”). Figure 2A shows that nspp exhibits a maximum as a function of a/b which is located toward larger a/b ≈ 0.05 for the large dispersal range md = 5.5 and toward smaller a/b ≈ 0.01 for the small dispersal range md = 2.5.
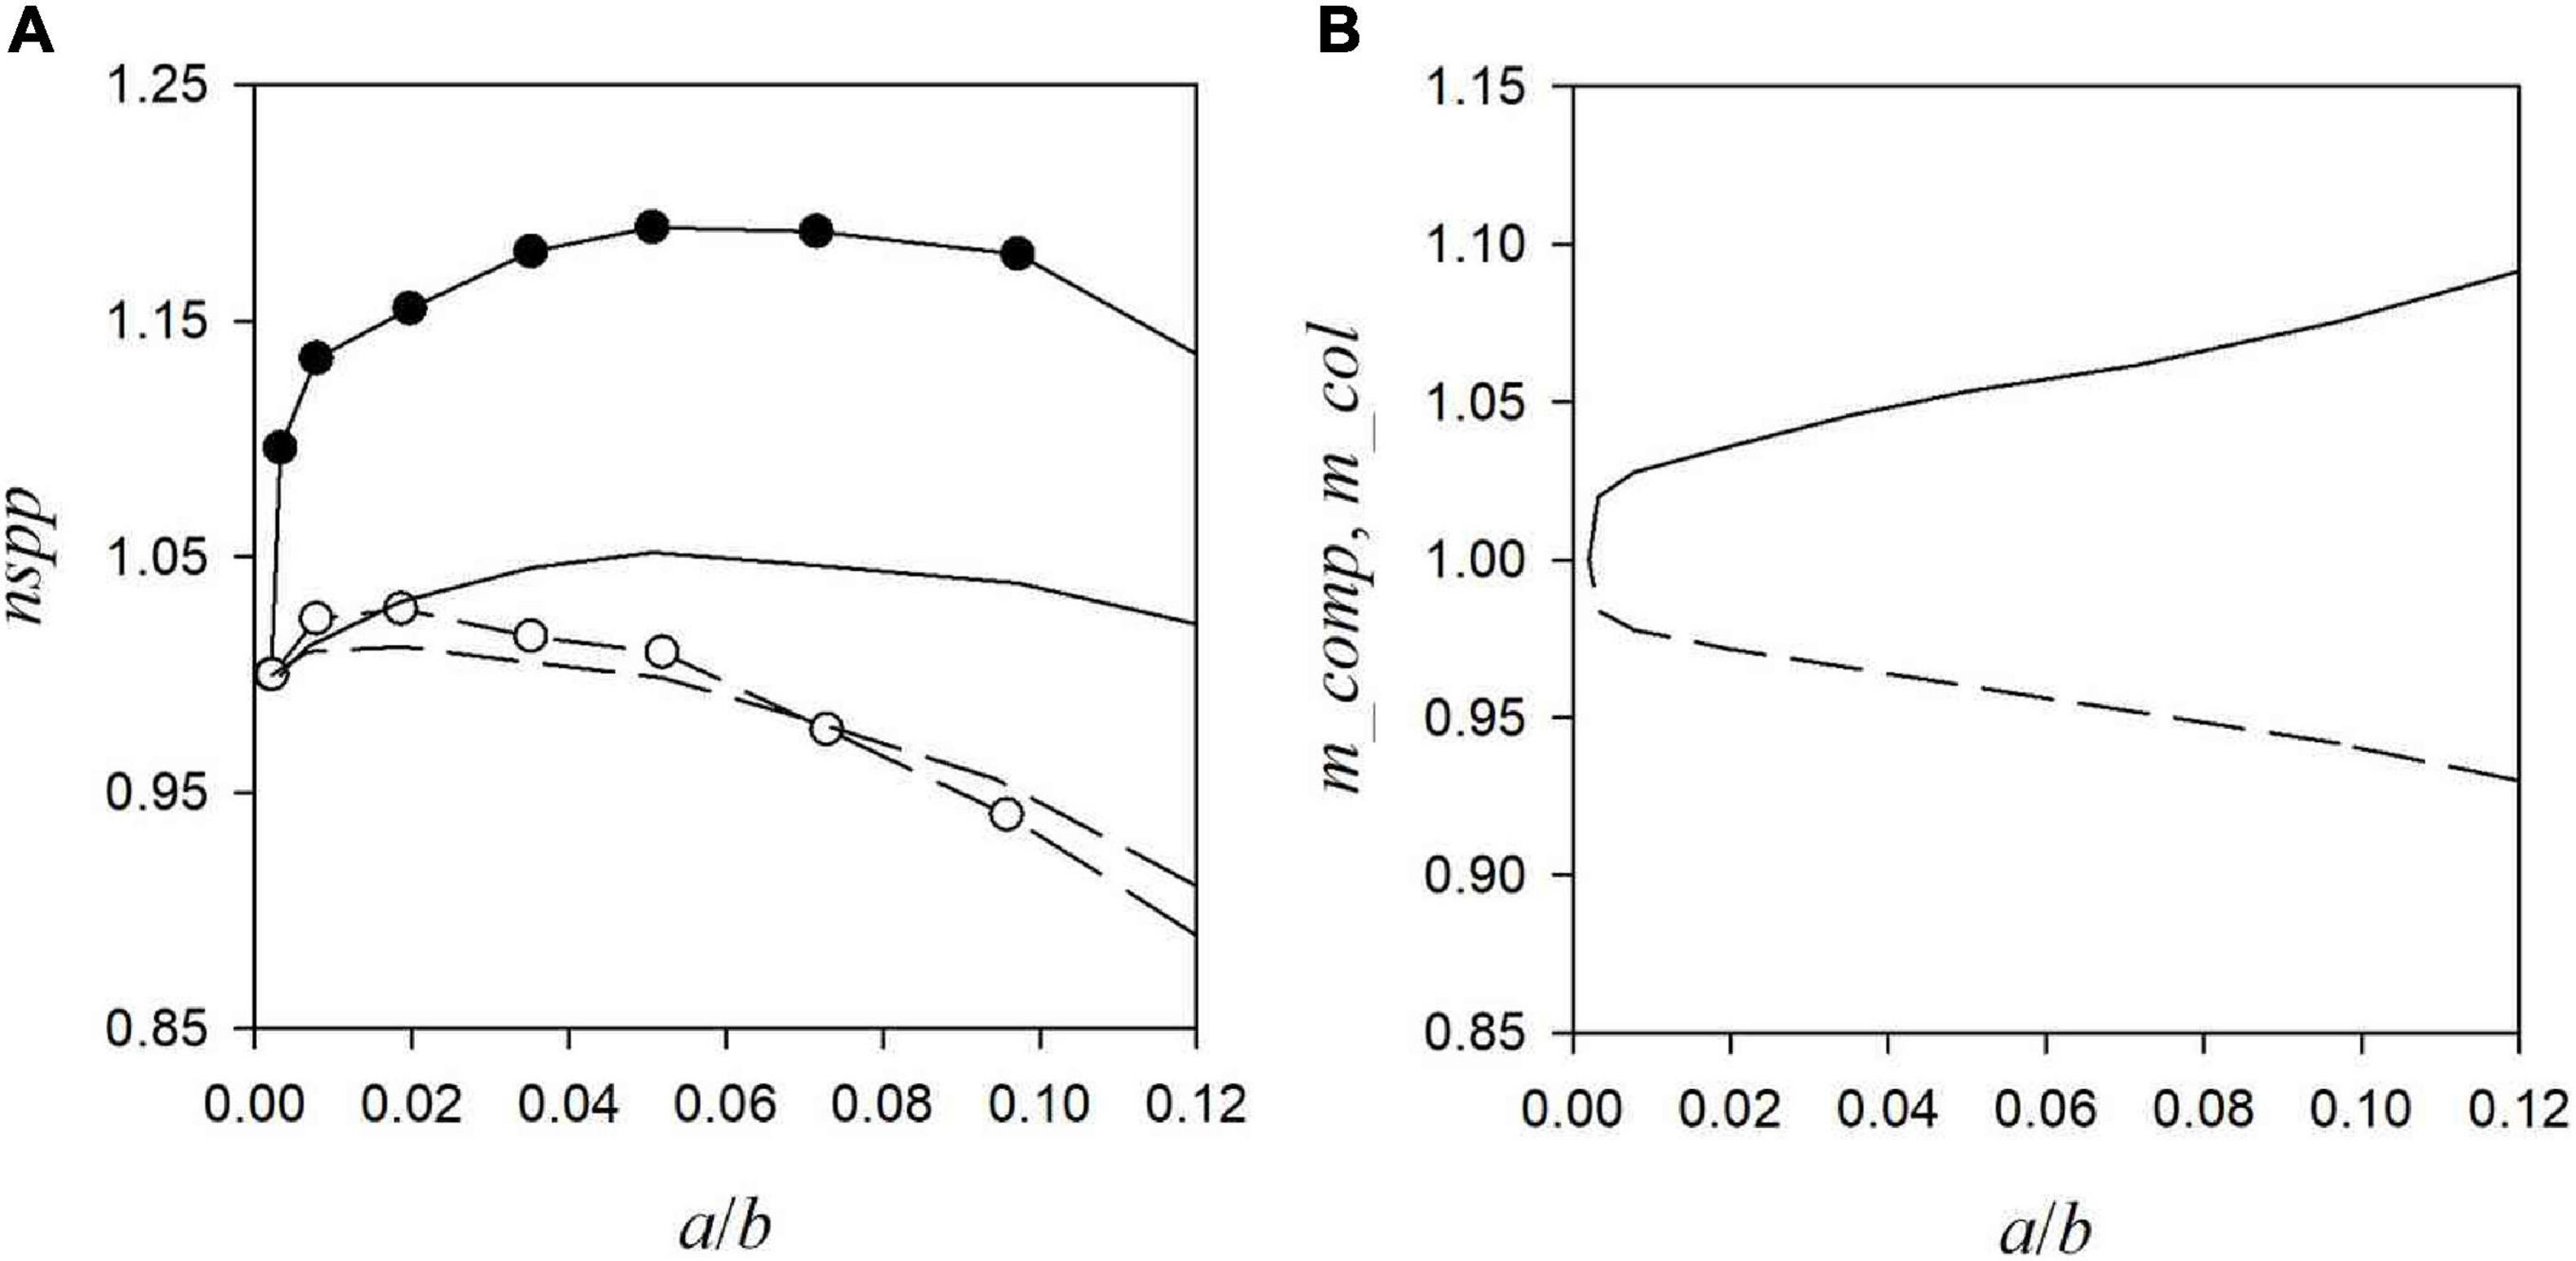
Figure 2. (A) Shows the expected number of extant species nspp as a function of the ratio of agglomeration bonus and base payment (a/b) for four model parameter combinations, defined in section Sensitivity Analysis by the variations in the competition strengths and colonisation rates sdk and sdc and the mean dispersal range md. Lines without and with symbols: sdc = 0.1 and sdc = 0.3; solid and dashed lines: md = 2.5 and md = 5.5; sdk = 0.4 (the results for sdk = 0.1 are similar: Supplementary Table D1). (B) Shows the mean competition strength m_comp (solid line) and colonisation rate, m_col (dotted line) of the extant species as functions of a/b, for sdk = 0.4, sdc = 0.3 and md = 2.5 (the results for the other model parameter combinations are shown in Supplementary Table D1). All quantities are scaled relative to their values obtained at a/b = 0.
(16) The effect of the agglomeration bonus on the competition strengths and colonisation rates of the extant species (m_comp and m_col) is small except for the case of large trait variations sdk and sdc, where an increasing a/b increases m_comp and decreases m_col (Figure 2B). The dispersal range of the extant species (m_disp) increases with increasing a/b (Supplementary Table D1).
Discussion
A generic model is developed and analysed to explore the cost-effectiveness of the agglomeration bonus (Parkhurst et al., 2002) to conserve several competing species which are structured as a metacommunity (Leibold et al., 2004; Holyoak et al., 2005). Competition here is modeled such that the species differ by their competition strength, and if individuals from several species immigrate into a habitat patch the superiour species are likely to win the competition and colonise the patch; while inferiour species are likely to be locally replaced by superiour species.
As shown by Tilman (1994), two competing species with the same ecological niche can only co-exist if the locally inferiour species has the higher colonisation probability (the probability by which a local population can colonise empty habitat patches), because otherwise the superiour species will displace the inferiour species from the landscape. This relationship is known as the competition-colonisation trade-off (Amarasekare, 2003).
Against this background, a main question of the present analysis is under which conditions the expected number of extant species (nspp) is maximised. If competition strengths and colonisation probabilities of the species are perfectly negatively correlated (as in the model of Tilman (1994)) coexistence of the species is maximised if the variation of the competition strengths and the colonisation probabilities over the species is about equal (sdk ≈ sdc: result 1 in section “Ecological Results”).
If one deviates from this equality nspp declines. Two opposite effects are possible. First, if there is low variation in the competition strengths (sdk) and high variation in the colonisation probabilities (sdc) the good colonisers have no competitive disadvantages compared to the poor colonisers, so the poor colonisers go extinct. Second and opposite, if there is high variation in the competition strengths (sdk) and low variation in the colonisation probabilities (sdc) the superiour competitors have no disadvantages in terms of colonisation ability compared to the weak competitors, so the weak competitors go extinct.
A different result is obtained if the correlation between competition strengths and colonisation probabilities is not perfectly negative (result 7). Here high values of nspp can be achieved only if the variations sdk and sdc are small.
The expected number of extant species, nspp, further declines if the dispersal ranges of the species are increased (result 4), despite an observed increase in the proportion of land parcels occupied by the (superiour) species. The reason is that at large dispersal ranges the superiour species can reach more distant habitat parcels, diminishing the refuge for the inferiour species and intensifying the competition between the species. This agrees with Snyder and Chesson (2003) who found that local dispersal can facilitate species coexistence. In a different but related context, Nowak and May (1992) showed that the restriction of interaction range from global to local facilitates the coexistence of cooperators and defectors in a prisoners dilemma in which the agents are located and interact on a spatial grid.
These ecological findings have consequences for the cost-effective level of the agglomeration bonus. It is known that the survival of inferiour competitors can be enhanced by introducing spatial habitat heterogeneity (Amarasekare, 2003), which provides an additional ecological niche (Yu and Wilson, 2001). Since the agglomeration of habitat induced by the agglomeration bonus can be seen as a form of spatial homogeneity, to provide a sufficient degree of spatial habitat heterogeneity the agglomeration bonus must not be too large.
On the other hand, too much spatial dispersion of habitat hinders the colonisation of habitat patches, especially for species with low colonisation rates and small dispersal ranges. An agglomeration bonus that is chosen too small thus compromises the metapopulation dynamics of the species, and threatens in particular the strong competitors with their small colonisation rates. This implies that nspp exhibits a maximum as a function if the agglomeration bonus (a/b) (Figure 2A). In the text below the influence of the ecological model parameters on that cost-effective agglomeration bonus (a/b)ce is discussed (the observed influences of the economic parameters in section “Economic Results” confirm previous results).
If the variations in the competition strengths and colonisation rates allow for the coexistence of superiour and inferiour competitors (sdk ≈ sdc for large negative ρ, and sdk, sdc << 1 for small negative ρ, as discussed above) the agglomeration bonus should not be chosen too large to generate a sufficient level of spatial heterogeneity and support species coexistence (results 11 and 14 in section “Ecological-Economic Results”). In the other cases, the number of extant species is smaller and the species have similar traits (either all are superiour competitors with low colonisation rates or all are inferiour competitors with higher colonisation rates). This lessens the relevance of the species competition, and the conservation problem can be considered as one of a “single” species, which calls for a rather large agglomeration bonus (e.g., Hartig and Drechsler, 2009).
The metapopulation dynamics of species do not necessarily depend on the spatial structure of the habitat in geographic units but on the spatial structure as it is perceived by the species (With and Crist, 1995). A landscape that appears heterogeneous for a species with a short dispersal range may appear homogenous for a species with a large dispersal range. Thus, since the coexistence of the species requires a moderate level of spatial heterogeneity, for species with large dispersal ranges the agglomeration bonus should be chosen rather small (result 13).
The quantitative results of the analysis (see Figure 2A and the Supplementary Appendices) suggest that cost-effective levels of the agglomeration bonus range below about (a/b)ce < 0.1, where in the discussions above a “rather large” value should be identified with that upper bound, and a “rather small” value with a few percent. If one deviates from the cost-effective level the number of extant species declines (result 15), but this decline is generally not so severe that one would have to hit the cost-effective level with high precision (Figure 2A). Instead it appears to be sufficient to choose the right order of magnitude.
Next to the decline of the number of species, the composition of the traits in the extant species changes when deviating from the cost-effective level (a/b)ce: if the agglomeration bonus is reduced to a smaller value a/b < (a/b)ce the extant species tend to have lower competition strengths (m_comp) and higher colonisation rates (m_col) (result 16), which indicates that the spatial agglomeration of the habitats is too low for the superiour competitors with the small colonisation rates to survive. In the opposite direction, if the agglomeration bonus is increased to higher levels than the cost-effective one the extant species tend to have higher competition strengths (m_comp) and smaller colonisation rates (m_col), which indicates that the spatial agglomeration (and homogeneity) of habitat is so high that the superiour competitors are able to replace the inferiour competitors and prevail.
The model is based on a number of assumptions that may limit the range of its applicability. On the economic side, it was assumed that the land-use pattern builds up step by step in response to the base payment and the agglomeration bonus and the land use in the previous time step. This myopic and “solitary” behaviour ignores that real landowners have foresight and communicate with each other—which affects the speed at which a land-use pattern emerges (Parkhurst and Shogren, 2007). Nevertheless, at least in a qualitative sense the land-use pattern in the present model should respond realistically to the payment scheme, such that, e.g., an increase in the agglomeration bonus, or a decrease in the spatial variation of the conservation costs, will increase the level of spatial agglomeration of conserved land parcels; and that for given conservation budget there is a (more or less strong) trade-off between the amount and the spatial agglomeration of conservation efforts. However, in a quantitative sense these features may depend on the spatial correlation of the conservation costs whose role may be a matter of future research.
Another loss of generality in the analysis may arise from the particular way in which the species competitions are modelled, where each species is assigned a competition strength and the probability of winning a competition is proportional to that strength (Eq. 5). Alternatively, one could consider a lexicographic model of competition according to which superiour species always outcompete inferiour species. In addition, the present model assumes that only one species can inhabit a land parcel, ignoring the possibility of local coexistence that can be induced, e.g., by ecological niches (Amarasekare, 2003); or there may be transient effects such that in the long run only one species can prevail, but at intermediate time scales several species can coexist.
Future research may address the above issues and relax some of the assumptions. On the economic side one could further introduce dynamics in the conservation costs and more complex landowner behaviour (Groeneveld et al., 2017; Drechsler, 2021). On the ecological side one could include other types of inter-specific interactions (Baumgärtner, 2004), such as parasitism, mutualism, or predator-prey interactions (Begon et al., 1990). More generally, one could consider food webs or ecological networks (which specify which species interacts with which other species, and how: Pascual and Dunne, 2005) and make better use of ecological theories of species coexistence (Chesson, 2000a,b; Amarasekare, 2003; Barabás et al., 2018). Another interesting issue would be the trade-off between species richness (nspp) and the survival of rare species with particular traits. A challenge with respect to the practical application of the model is that while mechanisms of coexistence are by now quite well understood qualitatively, it appears to be very difficult to quantify them and assess their relative contributions to observed species coexistence (Yu et al., 2004).
Nevertheless, the present study provides some useful insights into the potential effects of agglomeration bonus schemes on species coexistence and biodiversity and in particular demonstrates that the choice of the cost-effective size of the agglomeration bonus is a balance that needs to take into account the different species traits (e.g., their competition strengths and colonisation rates) and depends on a number of ecological and economic factors, such as species dispersal rates and the spatial heterogeneity of conservation costs.
Although the agglomeration bonus concept has been applied in several agri-environmental schemes (Mills et al., 2012; Krämer and Wätzold, 2018; Huber et al., 2021) the design of cost-effective schemes is a challenge. Huber et al. (2021) stress the influence of the conservation costs on the propensity of land parcel enrolment. Agglomeration is likely to come at a cost, since it may exclude the selection of inexpensive but isolated land parcels but require the selection of costly land parcels in the neighbourhood (Drechsler et al., 2010). The results in section “Economic Results” highlight the importance of the spatial variation in the conservation costs.
A key decision in the design of an agglomeration bonus scheme appears to be the choice of the base payment b and the bonus per conserved neighbour, a. Altogether, if x percent of the land should be conserved the total payment should be about the lower x-percentile of the regional cost distribution. The question is how this payment is distributed into b and a. The Swiss Ordinance on Direct Payments, e.g., offers a base payment in lowlands of CHF 1,080/ha plus a bonus for connectivity of CHF 1,000/ha (BLW, 2020). If one, somewhat speculatively, considers those CHF 1,000/ha for the adjacency with eight neighbours this would correspond to a ratio a/b = 0.12.
The present analysis reveals that the cost-effective level of a/b depends not only on the mentioned spatial cost distribution but also on the traits of the species to be conserved. The results provide some hints under which conditions the ratio should be rather large and when it should be rather small. As demonstrated, the cost-effective level of a/b depends on a considerable number of ecological and economic factors, so quantitative methods like ecological-economic modelling are helpful, if not necessary, to make informed and good decisions.
Data Availability Statement
The original contributions presented in the study are included in the article/Supplementary Material, further inquiries can be directed to the corresponding author/s.
Author Contributions
The author confirms being the sole contributor of this work and has approved it for publication.
Conflict of Interest
The author declares that the research was conducted in the absence of any commercial or financial relationships that could be construed as a potential conflict of interest.
Publisher’s Note
All claims expressed in this article are solely those of the authors and do not necessarily represent those of their affiliated organizations, or those of the publisher, the editors and the reviewers. Any product that may be evaluated in this article, or claim that may be made by its manufacturer, is not guaranteed or endorsed by the publisher.
Acknowledgments
The manuscript benefited considerably for the thorough and helpful comments of two reviewers.
Supplementary Material
The Supplementary Material for this article can be found online at: https://www.frontiersin.org/articles/10.3389/fevo.2021.695764/full#supplementary-material
References
Amarasekare, P. (2003). Competitive coexistence in spatially structured environments: a synthesis. Ecol. Lett. 6, 1109–1122. doi: 10.1046/j.1461-0248.2003.00530.x
Banerjee, S., Kwasnica, A. M., and Shortle, J. S. (2012). Agglomeration bonus in small and large local networks: a laboratory examination of spatial coordination. Ecol. Econ. 84, 142–152. doi: 10.1016/j.ecolecon.2012.09.005
Barabás, G., D’Andrea, R., and Stump, S. M. (2018). Chesson’s coexistence theory. Ecol. Monogr. 88, 277–303. doi: 10.1002/ecm.1302
Baumgärtner, S. (2004). Optimal investment in multi-species protection: interacting species and ecosystem health. Ecosyst. Health 1, 101–110. doi: 10.1007/s10393-004-0003-z
Begon, M., Townsend, C. R., and Harper, J. L. (1990). Ecology: From Individuals to Ecosystems. Blackwell, 2nd Edn. Boston, MA: Blackwell Scientific Publications.
Bell, A., Parkhurst, G., Droppelmann, K., and Benton, T. G. (2016). Scaling up proenvironmental agricultural practice using agglomeration payments: proof of concept from an agent-based model. Ecol. Econ. 126, 32–41. doi: 10.1016/j.ecolecon.2016.03.002
BLW (2020). Agrarbericht 2020. Bundesamt für Landwirtschaft BLW. Available online at: https://www.agrarbericht.ch/de/politik/direktzahlungen/biodiversitaetsbeitraege (accessed July 09, 2021).
Cadotte, M. W., Mai, D. V., Jantz, S., Collins, M. D., Keele, M., and Drake, J. A. (2006). On testing the competition-colonization trade-off in a multispecies assemblage. Am. Nat. 168, 704–709. doi: 10.2307/3873464
Chesson, P. (2000a). General theory of competitive coexistence in spatially-varying environments. Theor. Populat. Biol. 58, 211–237. doi: 10.1006/tpbi.2000.1486
Chesson, P. (2000b). Mechanisms of maintenance of species diversity. Ann. Rev. Ecol. Evol. Syst. 31, 343–366. doi: 10.1146/annurev.ecolsys.31.1.343
Debout, G. D. G., Dalecky, A., Ngomi Ngomi, A., and McKey, D. B. (2009). Dynamics of species coexistence: maintenance of a plant-ant competitive metacommunity. Oikos 118, 873–884. doi: 10.1111/j.1600-0706.2009.16317.x
Drechsler, M. (2020). Ecological-Economic Modelling for Biodiversity Conservation. Cambridge: Cambridge University Press.
Drechsler, M. (2021). Impacts of human behaviour in agri-environmental policies: how adequate is homo oeconomicus in the design of market-based conservation instruments? Ecol. Econ. 184:107002. doi: 10.1016/j.ecolecon.2021.107002
Drechsler, M., and Wätzold, F. (2009). Applying tradable permits to biodiversity conservation: effects of space-dependent conservation benefits and cost heterogeneity on habitat allocation. Ecol. Econ. 68, 1083–1092. doi: 10.1016/j.ecolecon.2008.07.019
Drechsler, M., and Wätzold, F. (2020). Biodiversity conservation in a dynamic world may lead to inefficiencies due to lock-in effects and path dependence. Ecol. Econom. 173:106652
Drechsler, M., Johst, K., Wätzold, F., and Shogren, J. F. (2010). An agglomeration payment for cost-effective biodiversity conservation in spatially structured landscapes. Resour. Energy Econ. 32, 261–275. doi: 10.1016/j.reseneeco.2009.11.015
Groeneveld, J., Müller, B., Buchmann, C. M., Dressler, G., Guo, C., Hase, N., et al. (2017). Theoretical foundations of human decision-making in agent-based land use models – A review. Environ. Model. Softw. 87, 39–48. doi: 10.1016/j.envsoft.2016.10.008
Harris, J. A., and Hobbs, R. J. (2001). Restoration ecology: repairing the earth’s ecosystems in the new millennium. Restor. Ecol. 9, 239–246. doi: 10.1046/j.1526-100x.2001.009002239.x
Hartig, F., and Drechsler, M. (2009). Smart spatial incentives for market-based conservation. Biol. Conserv. 142, 779–788. doi: 10.1016/j.biocon.2008.12.014
Holyoak, M., Leibold, M. A., and Holt, R.D. (eds) (2005). Metacommunities: Spatial Dynamics and Ecological Communities. Chicago, IL: University of Chicago Press.
Huber, R., Zabel, A., Schleiffer, M., Vroege, W., Brändle, J. M., and Finger, R. (2021). Conservation costs drive enrolment in agglomeration bonus scheme. Ecol. Econ. 186, 107064. doi: 10.1016/j.ecolecon.2021.107064
Iftekhar, S., and Tisdell, J. G. (2016). An agent based analysis of combinatorial bidding for spatially targeted multi-objective environmental programs. Environ. Resource Econ. 64, 537–558. doi: 10.1007/s10640-015-9882-4
Jakobsson, A., and Eriksson, O. (2003). Trade-offs between dispersal and competitive ability: a comparative study of wind-dispersed Asteraceae forbs. Evol. Ecol. 17, 233–246. doi: 10.1023/A:1025526903281
Krämer, J. E., and Wätzold, F. (2018). The agglomeration bonus in practice: an exploratory assessment of the Swiss network bonus. J. Nat. Conserv. 43, 126–135. doi: 10.1016/j.jnc.2018.03.002
Leibold, M. A., Holyoak, M., Mouquet, N., Amarasekare, P., Chase, J. M., Hoopes, M. F., et al. (2004). The metacommunity concept: A framework for multi-scale community ecology. Ecol. Lett. 7, 601–613. doi: 10.1111/j.1461-0248.2004.00608.x
Lewis, D. J., Plantinga, A. J., Nelson, E., and Polasky, S. (2011). The efficiency of voluntary incentive policies for preventing biodiversity loss. Resour. Energy Econ. 33, 192–211. doi: 10.1016/j.reseneeco.2010.04.012
Lotka, A. J. (1920). Analytical note on certain rhythmic relations in organic systems. Proc. Natl. Acad. Sci. U.S.A. 6, 410–415. doi: 10.1073/pnas.6.7.410
Millennium Ecosystem Assessment (2005). Ecosystems and Human Well-being: Biodiversity Synthesis. Washington, DC: World Resources Institute.
Mills, J., Short, C., Courtney, P., and Cairns, A. (2012). Economics of Co-Ordination in Environmental Stewardship. Final Report to the Department of Environment Food and Rural Affairs and Natural England by the Countryside and Community Research Institute. Project No. DO0119. Available online at: http://eprints.glos.ac.uk/4503/7/Economics%20of%20Co-ordination%20in%20Environmental.pdf (accessed July 22, 2021).
Parkhurst, G. M., and Shogren, J. F. (2007). Spatial incentives to coordinate contiguous habitat. Ecol. Econ. 64, 344–355. doi: 10.1016/j.ecolecon.2007.07.009
Parkhurst, G. M., Shogren, J. F., and Crocker, T. (2016). Tradable set-aside requirements (TSARs): conserving spatially dependent environmental amenities. Environ. Resour. Econ. 63, 719–744. doi: 10.1007/s10640-014-9826-4
Parkhurst, G. M., Shogren, J. F., Bastian, C., Kivi, P., Donner, J., and Smith, R. B. W. (2002). Agglomeration bonus: an incentive mechanism to reunite fragmented habitat for biodiversity conservation. Ecol. Econ. 41, 305–328. doi: 10.1016/S0921-8009(02)00036-8
Pascual, M., and Dunne, J.A. (eds) (2005). Ecological Networks: Linking Structure to Dynamics in Food Webs. Oxford: Oxford University Press.
Saltelli, A., Aleksankina, K., Becker, W., Fennell, P., Ferretti, F., Holst, N., et al. (2019). Why so many published sensitivity analyses are false: a systematic review of sensitivity analysis practices. Environ. Model. Softw. 114, 29–39. doi: 10.1016/j.envsoft.2019.01.012
Snyder, R. E., and Chesson, P. (2003). Local dispersal can facilitate coexistence in the presence of permanent spatial heterogeneity. Ecol. Lett. 6, 301–309. doi: 10.1046/j.1461-0248.2003.00434.x
Surun, C., and Drechsler, M. (2018). Effectiveness of tradable permits for the conservation of metacommunities with two competing species. Ecol. Econ. 147, 189–196. doi: 10.1016/j.ecolecon.2018.01.016
Tilman, D. (1994). Competition and biodiversity in spatially structured habitats. Ecol. 75, 2–16. doi: 10.2307/1939377
Volterra, V. (1931). “Variations and fluctuations of the number of individuals in animal species living together,” in Animal Ecology with Special Reference to Insects, ed. R. N. Chapman (New York, NY: McGraw-Hill), 409–448.
Wätzold, F., Drechsler, M., Armstrong, C. W., Baumgärtner, S., Grimm, V., Huth, A., et al. (2006). Ecological-economic modeling for biodiversity management: potential, pitfalls, and prospects. Conserv. Biol. 20, 1034–1041.
With, K. A., and Crist, T. O. (1995). Critical thresholds in species’ responses to landscape structure. Ecology 76, 2446–2459. doi: 10.2307/2265819
Yu, D. W., and Wilson, H. B. (2001). The competition-colonization trade-off is dead; long live the competition-colonization trade-off. Am. Nat. 158, 49–63. doi: 10.1086/320865
Keywords: agglomeration bonus, species co-existence, competition-colonisation trade-off, conservation payment, ecological-economic model, metacommunity
Citation: Drechsler M (2021) On the Cost-Effective Design of Agglomeration Bonus Schemes for the Conservation of Multiple Competing Species. Front. Ecol. Evol. 9:695764. doi: 10.3389/fevo.2021.695764
Received: 15 April 2021; Accepted: 15 July 2021;
Published: 03 August 2021.
Edited by:
Jody R. Reimer, The University of Utah, United StatesReviewed by:
Diogo Alagador, Centro de Investigacao em Biodiversidade e Recursos Geneticos (CIBIO-InBIO), PortugalRobert Huber, ETH Zürich, Switzerland
Copyright © 2021 Drechsler. This is an open-access article distributed under the terms of the Creative Commons Attribution License (CC BY). The use, distribution or reproduction in other forums is permitted, provided the original author(s) and the copyright owner(s) are credited and that the original publication in this journal is cited, in accordance with accepted academic practice. No use, distribution or reproduction is permitted which does not comply with these terms.
*Correspondence: Martin Drechsler, bWFydGluLmRyZWNoc2xlckB1ZnouZGU=