 Catherine C. Sun
 Jeremy E. Hurst2
95% of researchers rate our articles as excellent or good
Learn more about the work of our research integrity team to safeguard the quality of each article we publish.
Find out more
ORIGINAL RESEARCH article
Front. Ecol. Evol. , 15 June 2021
Sec. Conservation and Restoration Ecology
Volume 9 - 2021 | https://doi.org/10.3389/fevo.2021.682124
This article is part of the Research Topic Citizen Science for Future Generations View all 13 articles
Citizen science, or community science, has emerged as a cost-efficient method to collect data for wildlife monitoring. To inform research and conservation, citizen science sampling designs should collect data that match the robust statistical analyses needed to quantify species and population patterns. Further increasing the contributions of citizen science, integrating citizen science data with other datasets and datatypes can improve population estimates and expand the spatiotemporal extent of inference. We demonstrate these points with a citizen science program called iSeeMammals developed in New York state in 2017 to supplement costly systematic spatial capture-recapture sampling by collecting opportunistic data from one-off observations, hikes, and camera traps. iSeeMammals has initially focused on the growing population of American black bear (Ursus americanus), with integrated analysis of iSeeMammals camera trap data with systematic data for a region with a growing bear population. The triumvirate of increased spatial and temporal coverage by at least twofold compared to systematic sampling, an 83% reduction in annual sampling costs, and improved density estimates when integrated with systematic data highlight the benefits of collecting presence-absence data in citizen science programs for estimating population patterns. Additional opportunities will come from applying presence-only data, which are oftentimes more prevalent than presence-absence data, to integrated models. Patterns in data submission and filtering also emphasize the importance of iteratively evaluating patterns in engagement, usability, and accessibility, especially focusing on younger adult and teenage demographics, to improve data quality and quantity. We explore how the development and use of integrated models may be paired with citizen science project design in order to facilitate repeated use of datasets in standalone and integrated analyses for supporting wildlife monitoring and informing conservation.
A common objective of citizen science (i.e., community science) is to assist in scientific research by contributing data beyond the spatial and temporal capacities of professional researchers (Shirk et al., 2012). Facilitated by widespread internet access, ecological monitoring through citizen science is increasingly used to document and study wildlife populations across wide spatial distributions and timeframes (Bonney et al., 2009; Follett and Strezov, 2015). For example, iNaturalist has collected over 60 million biodiversity observations on all 7 continents, from over 3.5 million contributors since its start in 20081; eBird has collected over 900 million bird observations from approximately 800,000 users since its start in 2002 (Sullivan et al., 2009). Citizen science has advanced our knowledge of wildlife patterns, including species distribution, phenology, and behavior (Dickinson et al., 2012; Fink et al., 2013; Soroye et al., 2018), and has even discovered new species (e.g., Amézquita et al., 2013). Importantly, in the age of rapid habitat change and biodiversity loss, citizen science can also support wildlife conservation and management. For example, citizen science has helped confer conservation status to at-risk species and identify hotspots of human-wildlife conflict (Dwyer et al., 2016). Management agencies have also long collected harvest data from hunters, a form of citizen science data, to estimate population trends (Gove et al., 2002), and have begun to request public assistance in monitoring wildlife health and species of concern (Burr et al., 2014; Dissanayake et al., 2019). To address biodiversity issues, from local to global, citizen science datasets should endeavor to meet the requirements of analyses that produce robust inferences for evidence-based action (Guillera-Arroita et al., 2015; Parrish et al., 2018).
A fundamental design consideration in citizen science programs is the type of data to collect. Data on species or individuals may include information only about detected presences (i.e., presence-only, PO data), or also information about sampling effort through absence/non-detections (i.e., presence-absence, PA data). The most common form of PO data is one-off observations, such as those submitted to iNaturalist, while examples of PA data include complete checklists of detected species (e.g., eBird; Johnston et al., 2020) and data from motion-triggered trail cameras (i.e., camera traps) when periods of camera operation are reported (e.g., McShea et al., 2015; Hsing et al., 2018). Information about sampling effort in PA data help model the data collection process and account for noise and variable quality (Isaac et al., 2014) that can occur due to variation in user expertise (Johnston et al., 2018), imperfect detection (MacKenzie et al., 2002), and spatial and temporal sampling biases (Courter et al., 2013; Geldmann et al., 2016). In contrast, PO data, which do not contain information absences or sampling effort, are limited to relative patterns of abundance and occurrence probabilities rather than absolute measures (Royle et al., 2012; Fithian et al., 2015) and are more prone to unreliable and biased inferences. Functionally, PA data also enable a broader range of analyses compared to PO data; PA data can be used in PO data analyses by removing absence information, but PO data cannot be used as-is in PA data analyses. As a result, many have cautioned against the collection of PO data and advocate instead for PA data collection for rigorous analyses and robust inferences about population size, distribution, and habitat use (Brotons et al., 2004; Isaac et al., 2014; Bayraktarov et al., 2019; Callaghan et al., 2019).
We expand on these recognized benefits of PA data in citizen science programs by highlighting their ability to improve ecological inferences when integrated with other datasets within a single statistical framework. While standalone analyses of citizen science data can yield robust inferences (Davies et al., 2012; Crum et al., 2017; Altwegg and Nichols, 2019), there is also growing interest in maximizing the value of citizen science data through joint analysis with other datasets that have partially overlapping information content (Zipkin and Saunders, 2018). Integrated models can improve parameter estimates, expand the spatial and/or temporal extents of inference, and even estimate latent parameters that were previously unidentifiable (Schaub and Abadi, 2010; Chandler and Clark, 2014; Robinson et al., 2018). Small or sparse datasets, such as in nascent citizen science programs, can both contribute to and benefit from integrated modeling approaches. In short, integrated analyses provide opportunities to synthesize new knowledge to support biodiversity research and conservation (Theobald et al., 2015; Miller et al., 2019).
Integrated models based on spatial point processes are of particular interest, because it is natural to understand and straightforward to model spatial encounter data on species or individuals as realizations (i.e., sampling/data collection process) of a spatial point process (i.e., population of individuals) (Royle et al., 2017; Kery and Royle, 2020) in a hierarchical framework. Spatially explicit encounter histories of individuals (i.e., spatial capture-recapture; SCR) are an ideal type of PA data to include in such integrated approaches because they are highly informative about the point process. Furthermore, each PA dataset can be modeled as arising from its own distinct sampling process that served its original citizen science program or sampling objective. Most integrated models have therefore focused on PA data, as incorporating PO data requires new model structure to either infer missing information about sampling effort based on other species (Fithian et al., 2015) or explain the PO data as a thinned point process (Dorazio, 2014). We therefore echo recommendations for citizen science programs that monitor wildlife for scientific purposes to collect PA datasets when possible, given the ease with which they can be incorporated into integrated models.
Citizen science data collection and submission should also be accessible and usable while in the pursuit of data. This serves the practical need to collect sufficient high quality data for analysis (Lasky et al., 2021) and upholds the democratic spirit and intention of citizen science (Mueller et al., 2012; Lynn et al., 2019). Accessibility refers to how easily contributors with different resources can participate (e.g., collect and submit data), while usability refers to the effectiveness, efficiency, and satisfaction of the user experience (Petrie and Kheir, 2007). Limited access to equipment and onerous protocols can deter participation (Newman et al., 2010). Indeed, more programs still collect PO data than PA data because the former are easier to collect (i.e., more accessible) (Pocock et al., 2017). Similarly, opportunistic sampling—in which data are collected upon encounter—may pose a lower barrier to access compared to systematic sampling—in which data are collected only under specific spatial and temporal conditions (Dennis et al., 2017; Bradter et al., 2018). Further declines in participation due to unfamiliar or inaccessible technologies, platforms, or poor user-interfaces (Newman et al., 2010), can be reduced through multiple submission platforms (e.g., computer, paper, and devices such as smartphones) to increase access and engagement with diverse participants. User-interfaces that build minimum data requirements into succinct workflows may also create positive and engaging experiences (Wald et al., 2016). The ability of citizen science programs to collect data for robust ecological inferences is influenced by interrelated decisions concerning data types and effective, user-centered protocols.
Here, we describe a citizen science program called iSeeMammals that was designed to collect opportunistic species-level data in New York state, United States. iSeeMammals enables members of the public to collect any of three types of data: PO data from one-off observations, PA data from hikes, and PA data from camera traps (Figure 1). iSeeMammals launched in 2017 and has focused initially on American black bears (Ursus americanus), with the objective of assessing how citizen science efforts could support integrated analyses to improve population abundance estimates. Exploring the feasibility and benefits of a citizen science approach was motivated by logistical and financial limitations of systematic sampling; New York is 141,300 km2 but annual spatial capture-recapture data collection in June—August since 2015 had been restricted to approximately 241 locations in the southern part of the state (40,079 km2) due to its high annual cost of approximately $192,000 USD. We describe the iSeeMammals data collection and submission process and report results from its first year of black bear monitoring. Finally, we reflect on the analytical and citizen science developments that can facilitate more opportunities for integrated models with citizen science data to meet research and conservation needs.
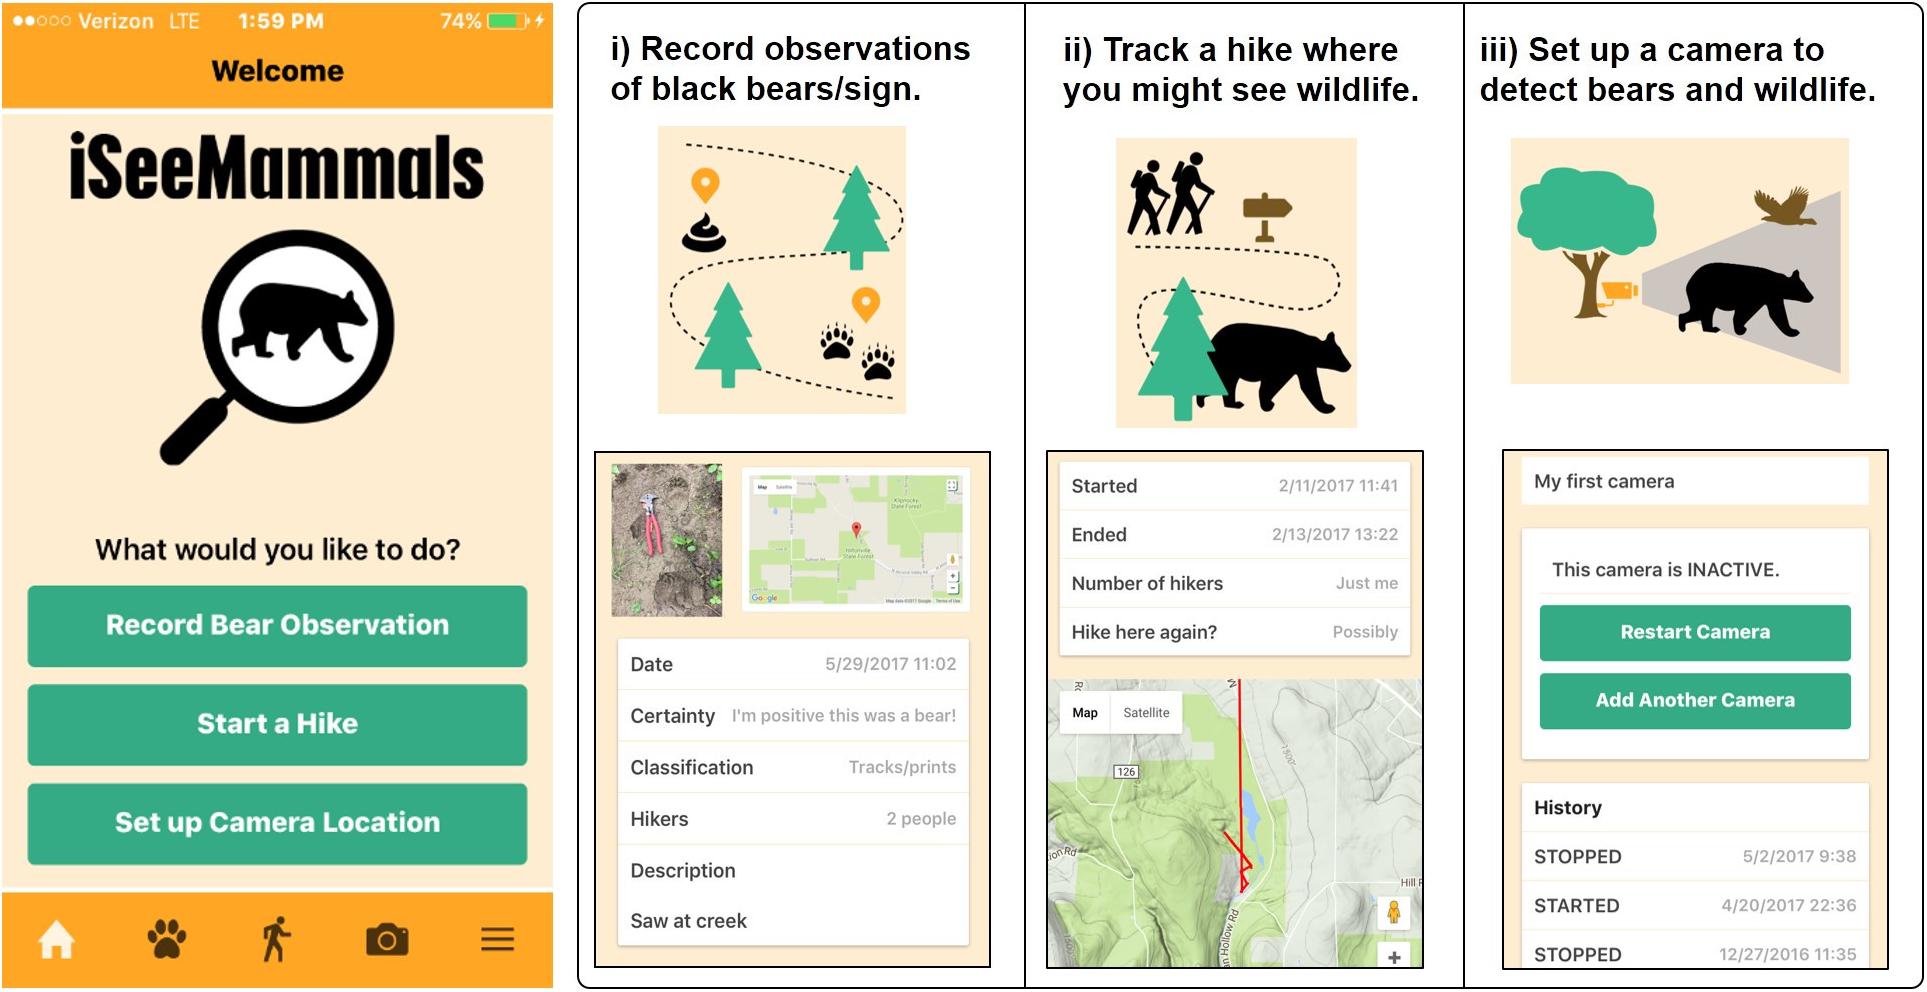
Figure 1. Home screen of iSeeMammals smartphone app and the 3 ways to collect presence-only (PO) and presence-absence (PA) data on black bears in New York with observations, hikes, and camera traps. Users provide details, including time, location, and descriptions which can be viewed on the website and app. Some features can only be accessed with the app, including creation and tracking of a hike and recording the location of a camera trap. Other features can only be accessed with the website (not shown), including submission of camera trap photos.
We created iSeeMammals so members of the public could contribute data on black bears from one-off observations (PO data), hikes (PA data), and camera traps (PA data) toward statewide wildlife monitoring and research. We offered both PO and PA data options because both can be used in joint models and also to collect as much data as possible given the popularity of PO data in citizen science approaches. We considered hikes an accessible extension of PO data, similar to traveling counts in eBird. Camera traps are already familiar to and commonly used by many hunters, wildlife enthusiasts, and citizen science wildlife monitoring programs (McShea et al., 2015). Prior to launching, iSeeMammals outreach included social media communications (Twitter, Facebook, Instagram, radio, television), connecting with established organizations to share information with their members, meeting with local communities and interest groups, and attending outdoor and wildlife-related events. After launching, outreach continued through newsletters to participants, social media communication, trainings, and word-of-mouth.
The potential for iSeeMammals to serve as a long-term monitoring tool motivated the development of an internet-based portal for data submission, with multiple platforms to increase access. Data could be submitted through a website2 and a free eponymous application (app) available in the Apple and Google app stores (Apple, Inc., Cupertino, CA, United States; Google, Inc., Mountain View, CA, United States) (Figure 1). We refer generally to contributors as participants, but specifically as users when in relation to the data submission platforms. An account with the iSeeMammals program was not necessary to submit data but was encouraged so that users could keep track of their submissions. The website and app included instructions for submission, tips and tricks for identifying signs of black bear presence, recommendations for how to set up a camera trap (height of camera, angle placement relative to the sun, local habitat, etc.), and additional training materials including images and quizzes. The app requested access to the user’s (device) location and camera in order to collect GPS coordinates and photographs that were critical for data quality. Due to concerns raised by participants about private property and potentially sensitive locations, personally identifying information and raw GPS coordinates were used only for research purposes. A privacy policy communicated that publically shared results would be anonymized, and either spatially jittered or displayed at coarser aggregate scales.
Observations of black bears included detections of bears or bear signs (e.g., scat, track, hair, or markings). In a series of multiple choice questions on either the website or app, iSeeMammals required (1) the category of observation (bear, scat, track, hair, or markings), (2) verification of the time and GPS location of the observation based either automatically on the metadata of an included photograph or by manual entry, (3) confidence in identification (Could be anything; Might have been a bear; Probably was a bear; I’m positive this was a bear), and (4) number of people present for the observation (Just me; 2; 3; 4; or ≥5 people). Questions about confidence of species identification and party size were collected to potentially help quantify sampling effort. Users were encouraged to include a photograph of the observation to help confirm species identification. Users could also supply a text description. An observation by itself constituted a one-off observation and provided PO data, while observations submitted in association with a hike provided PA data (described below).
Hikes at minimum consisted of sequential, timestamped GPS coordinates. Users could submit hikes through the app and view hike submissions on both the app and website. At the start of a hike, the user would begin the hike function and provide a unique name for the hike. The app recorded GPS coordinates at approximately 500 m increments to prevent excessive battery drainage during long hikes. When a hike was complete, users would press a button to end the hike. iSeeMammals then required (1) confirmation of the general accuracy of the route based on a map outlining the hike route, (2) the number of people in the hiking party (Just me; 2; 3; 4; or ≥5 people), and (3) the likelihood of returning at a later date to repeat the hike (Not at all; Possibly; Most likely). Questions about party size and likelihood of return were, respectively, collected to potentially help quantify sampling effort and data quality through repeat visits. Lastly, the user could attach observations based on submitted observations or photographs taken with the app during the hike. Hikes thus provided PA data, with absence information from the hike GPS coordinates and presence data from any associated observations.
Camera trap data consisted of the GPS coordinates of the camera, periods of operation, and any motion-triggered photographs of bears that were taken. Both the website and app were required to enter camera trap data; the app was necessary to automatically obtain GPS coordinates, while the website was necessary to upload photographs. Both the website and app could be used to provide records of each time the camera started and stopped and times of day the camera was scheduled to take pictures when triggered by motion. Users were required to explicitly report periods of operation rather than submit all camera trap photographs because a lack of motion-triggered photographs could be due to lack of wildlife rather than low sampling effort. When users checked on the camera trap to retrieve photographs, the app confirmed required information about camera trap location and setup, asked about periods of camera malfunction, and rhetorically asked whether or not bears were detected on the camera as a reminder to use the website for submitting photographs that contained bears. Users could also provide information about camera trap make and model. Camera traps thus provided PA data, with submitted photographs providing presence data and periods of camera operation providing absence information.
Users could delay submission by answering all questions to reach the submission page but then choose to save instead of submit. This enabled data collection on the app even when internet access or cell service were not immediately available, such as in rural or remote areas. Saved but un-submitted entries appeared with a red flag on the app and website to indicate that outstanding action remained for submission. Users were required to confirm or change their saved responses before final submission. On the website, a single page displayed all questions for each type of data and missing responses would trigger an error message; in the app, an arrow to proceed to the next question appeared when the question on the screen was answered.
We summarized the iSeeMammals data collected in its first year, between 1 January 2017 and 31 October 2017, reporting summary statistics and describing data filtering, data quality, and spatial patterns. We filtered out one-off observations that lacked spatial data or incorrect species identification based on the provided photograph, and duplicates based on photographs and descriptions. For hikes, we filtered out duplicates, hikes that were described as inaccurate by the user, and hikes that lasted <1 min or contained <2 sets of GPS coordinates. We filtered out camera traps that were only partially set up, lacked GPS coordinates, or had periods that monitored a location <1 day. If camera traps were still operating on 31 October 2017, we right-censored the period and assumed no malfunctions and no photographs/detections of bears.
The inaugural year of iSeeMammals was the first coordinated collection of opportunistic PA data on black bears in New York. iSeeMammals cost $32,000 USD to develop in the previous year (2016), which involved a local web and app development company that we hired on a pay-per services basis to develop and host the technology, and a team of 4 short-term high school and undergraduate research assistants compensated through university research and course credits. A total of 712 participants registered within the first 10 months, and 624 (88%) subsequently activated their accounts, which involved clicking on an email link sent after registration. iSeeMammals received a total of 629 one-off observations, hikes, and trail camera periods over a spatial extent of 113,392 km2 (95% minimum convex polygon, MCP), from 126 users. The majority of submissions were one-off observations (79%). Most users (n = 118, 94%), submitted one-off observations, while 9 users submitted multiple types of data; 7 of 13 users who submitted trail camera data also submitted one-off observations; 1 of 3 users who submitted hike data also submitted one-off observations; one user submitted all three types of data.
iSeeMammals received 373 one-off observations that included all five types of bear sign (bear, scat, tracks, hair, markings; Table 1). We accepted 339 (91%) observations, having filtered out 14 misidentifications based on photographs, 8 duplicates, 10 with no spatial information, and 2 that users rescinded due to incorrect information. We further removed 49 observations (14%) from Pennsylvania, resulting in 290 accepted observations (86%) in New York (Figure 2), across 113,392 km2 in 38 counties (95% MCP). A greater proportion of accepted observations reported confident identification compared to rejected observations (1.0 vs. 0.72, exact test 2-tailed p < 0.001). Photographs were included in 222 one-off observations (77%), although 25 were from camera traps of unregistered users. A greater proportion of observations with photographs reported bear signs rather than bears compared to observations without photographs (0.41 vs. 0.06, exact test 2-tailed p < 0.001). The average party size was 1.6 people; most observations (88%) were submitted by parties of 1 or 2 people (n = 150 and n = 105 observations, respectively), with 10 observations (3.4%) submitted by parties of ≥5 people.
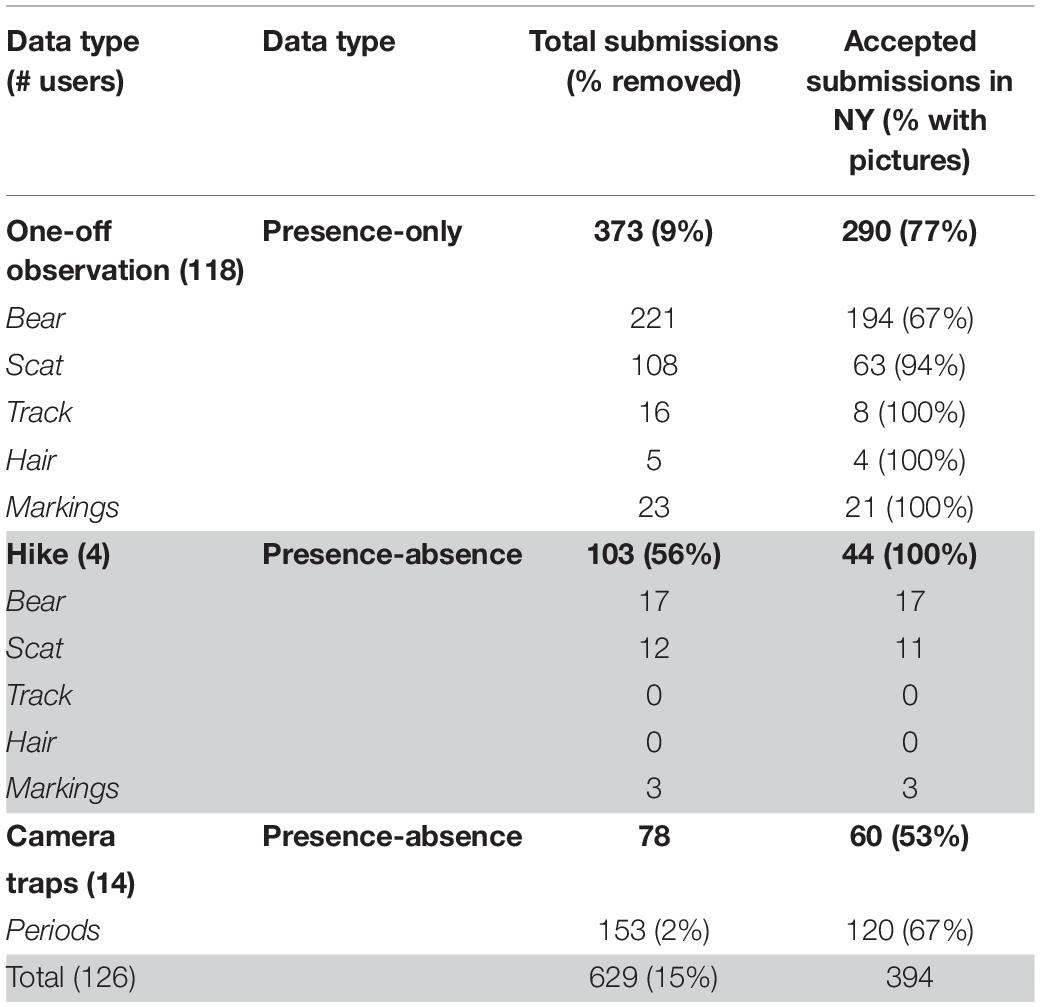
Table 1. Between 1 January 2017 and 31 October 2017, iSeeMammals collected black bear data from one-off observations, hikes, and trail cameras in New York state.
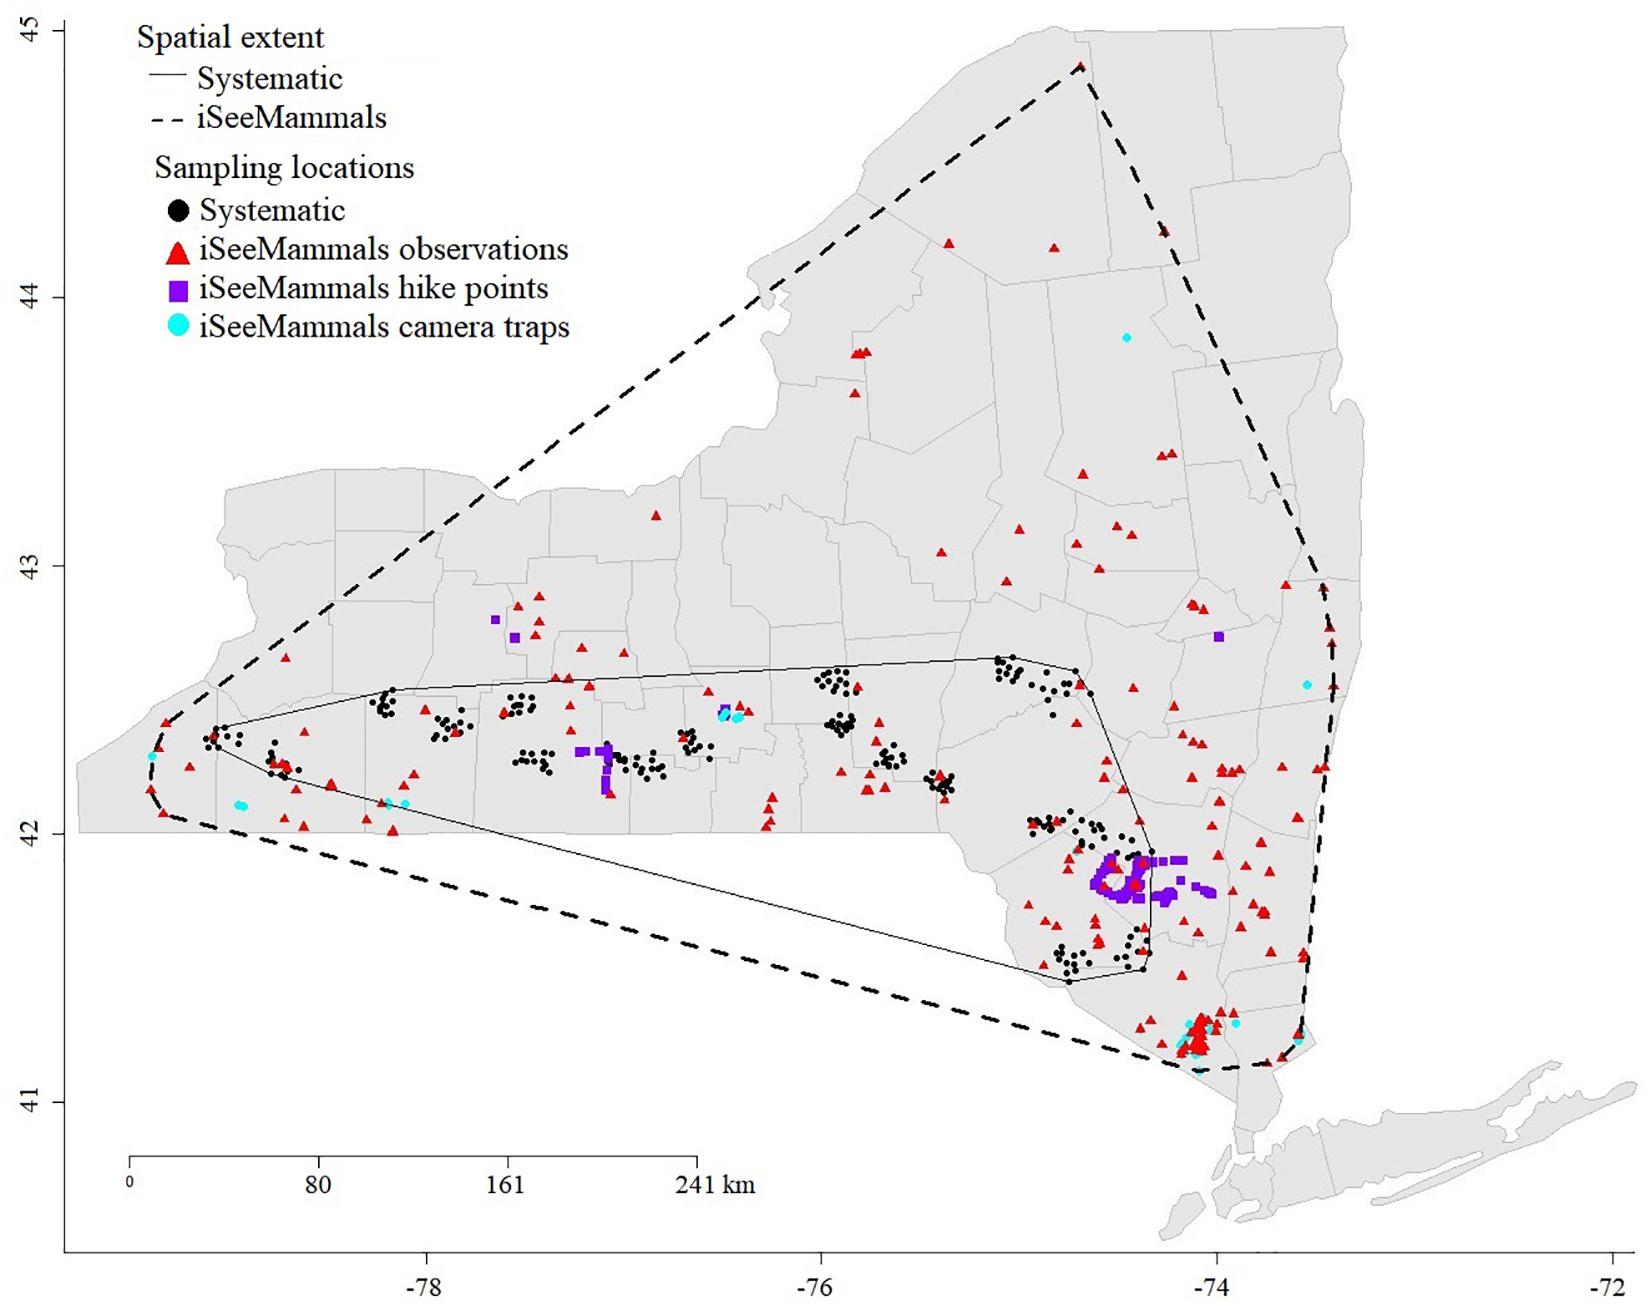
Figure 2. Location of iSeeMammals one-off observations, hikes, and camera traps collected between 1 January 2017 and 31 October 2017 across New York state. Also shown, in black dots, are the location of 241 systematic SCR sites deployed from June to August, 2017. Light gray lines indicate county borders. The minimum convex polygons for the systematic (40,079 km2) and iSeeMammals (113,392 km2) sampling highlight the value of citizen science data for increasing spatial extent and quantity of data that can be collected. Coordinates shown in latitude and longitude.
iSeeMammals received 103 hikes (Table 1). We accepted 46 hikes (45%), after filtering out 49 hikes due to user-identified GPS inaccuracy, 5 duplicate hike entries, and 3 hikes with <2 pairs of GPS coordinates. We further filtered out 2 hikes in Pennsylvania, resulting in 44 accepted hikes (43%) in New York across 25,400 km2 (95% MCP) in 8 counties (Figure 2). Of the accepted hikes in New York, 18 (41%) attached observations, with an average of 0.67 observations per hike. All hike observations were submitted with confidence. Most hikes (n = 37, 84%) had only 1 person, and most users indicated they would likely return to hike again in 3 months (n = 38, 86%). Average hike duration was 1.9 h (maximum of 4.7 h), totaling 82.3 h of effort. Hikes collected an average 24 GPS locations (range: 3–138) (Figure 2), resulting in a total of 1,264 correlated spatial PA data points in 44 sets.
iSeeMammals received data from 73 camera traps deployed at a total of 78 different locations (Table 1). We filtered out 16 trail cameras in Massachusetts and 4 periods of camera operation in New York that were less than 1 day. This resulted in 57 trail cameras in New York that operated continuously during 120 periods at 60 locations across 86,372 km2 (95% MCP) in 12 counties (Figure 2). Periods of camera operation were an average 57 days per location (range: 8–153 days). However, two cameras malfunctioned a total of 14 days, resulting in 3,604 camera-days of sampling effort. iSeeMammals received 835 images of bears from 32 camera locations in New York, with an average of 25 photographs per location (range: 1–134 photographs). Eighteen cameras were still operating on October 31, 2017.
iSeeMammals collected spatiotemporally extensive PO and PA data that cost-effectively augmented the limited systematic PA dataset on black bears in New York state. Specifically, iSeeMammals collected data at 394 new locations in 38 counties over 7 additional months compared to the systematic SCR data that was collected at 241 locations in 17 counties in 3 months. Citizen science therefore increased the spatial extent of total research data on black bears in 2017 by 2.8-fold, the number of locations by 1.6-fold, and the temporal extent by 2.3-fold, while costing 83% less than annual SCR sampling. Data from neighboring states (i.e., Pennsylvania and Massachusetts) further highlighted the spatial extensiveness that is possible with a network of citizen science participants. Hikes and trail cameras covered one additional county in New York compared to the more numerous one-off observations, and importantly, seven counties not represented in the systematic sampling. iSeeMammals was not developed to replace the systematic collection of SCR data given the former’s lack of individual-level information valuable for abundance estimation, but it successfully collected new and cheaper information to supplement SCR data and thereby potentially improve population estimation and ecological inference.
Camera trapping is a common method for citizen science programs to monitor wildlife patterns (McShea et al., 2015; Willi et al., 2019). Integrated analyses offer an opportunity to extract even more value from these programs and data sets. To explore this potential with iSeeMammals, Sun et al. (2019) developed an integrated model to unite citizen science camera trap data with the systematic SCR data. They applied the model to estimate bear abundance in southeastern New York where the increasing bear population and frequency of human-bear interactions are of management concern (New York State Department of Environmental Conservation (NYSDEC), 2003). iSeeMammals contributed bear detections at 19 of 26 camera trap locations, adding to the 114 individual bears detected at 37 of 47 different SCR sites. iSeeMammals and SCR data were subset to the same time period (June–August 2017) and region (southeast New York) to ensure that datasets provided inference on the same population (Tenan et al., 2017). Compared to using only the SCR data, integrating iSeeMammals data increased precision of the abundance, estimate, by narrowing the 95% confidence intervals around the mean estimate by 206 individuals. The point estimate increased slightly from 3,663 to 3,702. The opportunistic iSeeMammals camera trap data thus contained sufficient information about population structure to improve abundance estimates, despite lacking individual level data and being relatively small due to the infancy of the program. With continued program maintenance, data collection, and the addition of a dedicated outreach specialist, which would in total not likely cost as much as annual SCR sampling, iSeeMammals may also be informative about population trends and improve estimates of demographic rates such as survival and recruitment (Sun et al., 2019). To identify optimal combinations of citizen science and systematic sampling, simulations of data collection and population analysis paired with cost comparisons would be required.
Other recently developed integrated models incorporate opportunistic PO data, presenting additional opportunities, risks, and challenges. Advances in modeling PO data as a thinned point process have made it possible to integrate PO data with systematic data based on an underlying spatial point process (Dorazio, 2014; Renner et al., 2015; Miller et al., 2019). This offers PO data additional robust modeling approaches. For PO data in the iSeeMammals program, the location of one-off observations could help identify and specify sources of spatial bias, such as proximity to human development, while party size could be used to account for variation in imperfect detection, such as increased collective effort or reduced effort due to social distraction. However, we caution that while statistical techniques can compensate for low quality data or account for variation and biases common in and across citizen science datasets (Kelling et al., 2015; Johnston et al., 2018)—PO or otherwise—analytical fixes are not a substitute for carefully designed data collection and submission protocols. We therefore highlight the importance of developing and adopting data and metadata standards and minimum requirements (Storksdieck et al., 2016; Bowser et al., 2020), similar to efforts by global networks for camera trap data to facilitate collaboration across programs (Forrester et al., 2016; Steenweg et al., 2017). In this way, citizen science datasets can be used repeatedly to synthesize knowledge across scales, guide conservation strategies, and shape policy (Newman et al., 2011; Burgess et al., 2017; Curty et al., 2017; Fritz et al., 2019).
Patterns of iSeeMammals data filtering suggested that not all forms of PO data may be equally amenable to citizen science data collection or useful for ecological inference and integrated analyses. Hikes may not be an efficient source of opportunistic PA data, given that they were the least submitted and most filtered data type. Citizen science participants may not be willing to modify their hiking patterns while recreating in order to adhere to detection protocols such as minimum durations or distances. Furthermore, while hikes could be considered transect data for distance sampling (Buckland et al., 2012; Kumar et al., 2017), detection probability likely decreases sharply with distance from the trail path, and so hikes may provide limited spatial inference. Human activity in general may also hinder detection and bias sampling with opportunistic approaches, by displacing wildlife and altering their fine-scale spatial patterns of habitat use or temporal activity patterns to locations where and times when humans are not present (Larson et al., 2019; Zeller et al., 2019; Naidoo and Burton, 2020). Sensitivity analyses would be needed to explore the value of hike data in integrated models. Instead, citizen science participants may be more willing to follow guidelines for camera trap data, which have already proven useful in integrated analyses. Standards or minimum metadata requirements such as camera model and placement (e.g., height off ground and camera angle; Burton et al., 2015), would be helpful in accounting for detection probability, especially when focal species for monitoring are smaller-bodied. The marginal benefit of citizen science data for statistical analyses therefore depends on the information content about ecological patterns (Callaghan et al., 2019) as well as the relative ease of collection while maintaining data quality.
Indeed, citizen science data of sufficient quality and quantity rely on user-facing protocols that successfully engage with the target participant demographics. To develop a viable platform that balanced data needs with accessibility and usability, we conducted several rounds of beta-testing and expected results from the first year to provide feedback for improvement (i.e., lean product development, Poppendieck and Poppendieck, 2003). We targeted outreach to adults who were likely already familiar with or interested in wildlife, but the low participation rate (18%) suggests that protocols could have better matched participant motivations (Rotman et al., 2012; Beirne and Lambin, 2013; Eveleigh et al., 2014; Nov et al., 2014). Future iterations of the platform would benefit from tracking patterns of online versus smartphone app submission and demographics of the actual users such as gender, age, access to the outdoors, and familiarity with wildlife, in order to help develop strategies for engagement and retention. Importantly, a focus more on Generation Y and Generation Z participants (i.e., born since the 1980s), and even younger, could markedly increase participation and data quantity, given the ease of data collection with smartphones and the large amount of time that these age groups spend with developing technologies (Mutchler et al., 2011)—often to the point of technology mediating their recreation and time spent in nature (Barton, 2012; Wang et al., 2012). For example, social media posts of images and videos with date and timestamps can contain valuable ecological information (Dylewski et al., 2017; Toivonen et al., 2019) that could be collected in a formal citizen science framework. Gamification of data collection tasks have also been found to be effective at engaging younger demographics, who are already familiar with apps and features such as augmented reality (Bowser et al., 2013; Iacovides et al., 2013; Malik et al., 2020). Incidentally, gamification could also guide sampling to particular time periods or regions with data gaps in citizen science or systematic data (Xue et al., 2016; Callaghan et al., 2019). Additional participant-oriented objectives, such as science education and addressing the nature-deficit disorder, could both sustain participation in younger generations (Barton, 2012) and encourage collection of the more complex and robust PA data (Chase and Levine, 2016). Improving citizen science data quality and quantity will therefore benefit from improving engagement, accessibility, and usability, especially for younger demographics.
Citizen science is increasingly acknowledged for its ability to contribute to wildlife monitoring and management (McKinley et al., 2017). Cost efficiencies suggest that citizen science approaches can become an integral component of long term monitoring and supplement more costly systematic sampling (De Barba et al., 2010). iSeeMammals in its first year illustrated how citizen science programs can collect data for integrated analyses to support and improve population estimation. We reiterate calls to prioritize protocols that collect PA data, for their relative robustness in comparison to PO data for standalone and integrated analyses. Also critical are approaches to data collection that reserve the capacity for a range of currently available and future analyses, and therefore also times that datasets can be used to answer different questions (Curty et al., 2017) as statistical developments expand the toolbox and take advantage of different types of data (Miller et al., 2019). To further facilitate collaborations and ask new questions with integrated models, we also recommend greater emphasis and uptake of data standards and minimum requirements to ensure data quality across citizen science programs, and that younger demographics be explicitly considered when developing strategies for engagement. In this way, citizen science can continue to meet the increasing need for ecological knowledge at scales and extents larger than individual datasets (Silvertown, 2009; Theobald et al., 2015).
Requests to access the datasets should be directed to the corresponding author CS, Q2F0aGVyaW5lLmMuc3VuQGdtYWlsLmNvbQ==.
Ethical review and approval was not required for the animal study because while the research pertains to vertebrate wildlife, data were collected only with non-invasive observations without any direct interactions with animals.
CS, JH, and AF contributed to conception and design of the study. CS conducted the research and analyses and wrote the first draft of the manuscript. All authors contributed to manuscript revision, read, and approved the submitted version.
The authors declare that the research was conducted in the absence of any commercial or financial relationships that could be construed as a potential conflict of interest.
We would like to thank the iSeeMammals contributors and staff at the New York State Department of Environmental Conservation who assisted with data collection. We are also grateful to P. J. Finlay (as well as Jonathan Gomes-Selman, Vivian Garcia, and Kelly Crandall) for their assistance in developing web and app prototypes, and Vivian Garcia and Kelly Crandall with helping develop social media content. Any use of trade, firm, or product names is for descriptive purposes only and does not imply endorsement by the U.S. Government. An early draft of this manuscript appears as an online preprint (Sun et al., 2018).
Altwegg, R., and Nichols, J. D. (2019). Occupancy models for citizen-science data. Methods Ecol. Evol. 10, 8–21. doi: 10.1111/2041-210X.13090
Amézquita, A., Márquez, R., Medina, R., Mejía-Vargas, D., Kahn, T. R., Suárez, G., et al. (2013). A new species of Andean poison frog, Andinobates (Anura: dendrobatidae), from the northwestern Andes of Colombia. Zootaxa 3620, 163–178. doi: 10.11646/zootaxa.3620.1.8
Barton, K. S. (2012). Colorado’s millennial generation: youth perceptions and experiences of nature. J. Geogr. 111, 213–223. doi: 10.1080/00221341.2011.652648
Bayraktarov, E., Ehmke, G., O’Connor, J., Burns, E. L., Nguyen, H. A., McRae, L., et al. (2019). Do big unstructured biodiversity data mean more knowledge? Front. Ecol. Evol. 6:239. doi: 10.3389/fevo.2018.00239
Beirne, C., and Lambin, X. (2013). Understanding the determinants of volunteer retention through capture-recapture analysis: answering social science questions using a wildlife ecology toolkit. Conserv. Lett. 6, 391–401. doi: 10.1111/conl.12023
Bonney, R., Cooper, C. B., Dickinson, J., Kelling, S., Phillips, T., Rosenberg, K. V., et al. (2009). Citizen science: a developing tool for expanding science knowledge and scientific literacy. BioScience 59, 977–984. doi: 10.1525/bio.2009.59.11.9
Bowser, A., Cooper, C., Sherbinin, A., Wiggins, A., Brenton, P., Chuang, T.-R., et al. (2020). Still in need of norms: the state of the data in citizen science. Citizen Science: Theory Practice 5:18. doi: 10.5334/cstp.303
Bowser, A., Hansen, D., He, Y., Boston, C., Reid, M., Gunnell, L., et al. (2013). “Using gamification to inspire new citizen science volunteers,” in Proceedings of the First International Conference on Gameful Design, Research, and Applications Gamification ’13, (New York, NY: ACM), 18–25.
Bradter, U., Mair, L., Jönsson, M., Knape, J., Singer, A., and Snäll, T. (2018). Can opportunistically collected Citizen Science data fill a data gap for habitat suitability models of less common species? Methods Ecol. Evol. 9, 1667–1678. doi: 10.1111/2041-210X.13012
Brotons, L., Thuiller, W., Araújo, M. B., and Hirzel, A. H. (2004). Presence-absence versus presence-only modelling methods for predicting bird habitat suitability. Ecography 27, 437–448. doi: 10.1111/j.0906-7590.2004.03764.x
Buckland, S. T., Anderson, D. R., Burnham, K. P., and Laake, J. L. (2012). Distance Sampling: Estimating Abundance of Biological Populations. London: Springer London, Limited.
Burgess, H. K., DeBey, L. B., Froehlich, H. E., Schmidt, N., Theobald, E. J., Ettinger, A. K., et al. (2017). The science of citizen science: exploring barriers to use as a primary research tool. Biol. Conserv. 208, 113–120. doi: 10.1016/j.biocon.2016.05.014
Burr, D., Kline, J., and Perryman, A. (2014). A smartphone application for monitoring gopher tortoises in Florida. Florida Sci. 77, 198–203.
Burton, A. C., Neilson, E., Moreira, D., Ladle, A., Steenweg, R., Fisher, J. T., et al. (2015). Wildlife camera trapping: a review and recommendations for linking surveys to ecological processes. J. Appl. Ecol. 52, 675–685. doi: 10.1111/1365-2664.12432
Callaghan, C. T., Poore, A. G. B., Major, R. E., Rowley, J. J. L., and Cornwell, W. K. (2019). Optimizing future biodiversity sampling by citizen scientists. Proc. R. Soc. B: Biol. Sci. 286:20191487. doi: 10.1098/rspb.2019.1487
Chandler, R., and Clark, J. (2014). Spatially explicit integrated population models. Methods Ecol. Evol. 5, 1351–1360. doi: 10.1111/2041-210X.12153
Chase, S. K., and Levine, A. (2016). A framework for evaluating and designing citizen science programs for natural resources monitoring. Conserv. Biol. 30, 456–466. doi: 10.1111/cobi.12697
Courter, J. R., Johnson, R. J., Stuyck, C. M., Lang, B. A., and Kaiser, E. W. (2013). Weekend bias in citizen science data reporting: implications for phenology studies. Int. J. Biometeorol. 57, 715–720. doi: 10.1007/s00484-012-0598-7
Crum, N. J., Fuller, A. K., Sutherland, C. S., Cooch, E. G., and Hurst, J. (2017). Estimating occupancy probability of moose using hunter survey data. J. Wildlife Manag. 81, 521–534. doi: 10.1002/jwmg.21207
Curty, R. G., Crowston, K., Specht, A., Grant, B. W., and Dalton, E. D. (2017). Attitudes and norms affecting scientists’ data reuse. PLoS One 12:e0189288. doi: 10.1371/journal.pone.0189288
Davies, T. K., Stevens, G., Meekan, M. G., Struve, J., and Rowcliffe, J. M. (2012). Can citizen science monitor whale-shark aggregations? Investigating bias in mark–recapture modelling using identification photographs sourced from the public. Wildl. Res. 39, 696–704. doi: 10.1071/wr12092
De Barba, M., Waits, L. P., Genovesi, P., Randi, E., Chirichella, R., and Cetto, E. (2010). Comparing opportunistic and systematic sampling methods for non-invasive genetic monitoring of a small translocated brown bear population. J. Appl. Ecol. 47, 172–181. doi: 10.1111/j.1365-2664.2009.01752.x
Dennis, E. B., Morgan, B. J. T., Brereton, T. M., Roy, D. B., and Fox, R. (2017). Using citizen science butterfly counts to predict species population trends. Conserv. Biol. 31, 1350–1361. doi: 10.1111/cobi.12956
Dickinson, J. L., Shirk, J., Bonter, D., Bonney, R., Crain, R. L., Martin, J., et al. (2012). The current state of citizen science as a tool for ecological research and public engagement. Front. Ecol. Environ. 10:291–297. doi: 10.1890/110236
Dissanayake, R. B., Stevenson, M., Allavena, R., and Henning, J. (2019). The value of long-term citizen science data for monitoring koala populations. Sci. Rep. 9, 1–12. doi: 10.1038/s41598-019-46376-5
Dorazio, R. M. (2014). Accounting for imperfect detection and survey bias in statistical analysis of presence-only data. Glob. Ecol. Biogeogr. 23, 1472–1484. doi: 10.1111/geb.12216
Dwyer, R. G., Carpenter-Bundhoo, L., Franklin, C. E., and Campbell, H. A. (2016). Using citizen-collected wildlife sightings to predict traffic strike hot spots for threatened species: a case study on the southern cassowary. J. Appl. Ecol. 53, 973–982. doi: 10.1111/1365-2664.12635
Dylewski, Ł, Mikula, P., Tryjanowski, P., Morelli, F., and Yosef, R. (2017). Social media and scientific research are complementary—YouTube and shrikes as a case study. Sci. Nat. 104:48. doi: 10.1007/s00114-017-1470-8
Eveleigh, A., Jennett, C., Blandford, A., Brohan, P., and Cox, A. L. (2014). “Designing for dabblers and deterring drop-outs in citizen science,” in Proceedings of the SIGCHI Conference on Human Factors in Computing Systems CHI ’14, (New York, NY: ACM), 2985–2994.
Fink, D., Damoulas, T., and Dave, J. (2013). “Adaptive spatio-temporal exploratory models: hemisphere-wide species distributions from massively crowdsourced eBird data,” in Proceeding of the Twenty-Seventh AAAI Conference on Artificial Intelligence, (California, CA: Menlo Park).
Fithian, W., Elith, J., Hastie, T., and Keith, D. A. (2015). Bias correction in species distribution models: pooling survey and collection data for multiple species. Methods Ecol. Evol. 6, 424–438. doi: 10.1111/2041-210X.12242
Follett, R., and Strezov, V. (2015). An analysis of citizen science based research: usage and publication patterns. PLoS One 10:e0143687. doi: 10.1371/journal.pone.0143687
Forrester, T., O’Brien, T., Fegraus, E., Jansen, P. A., Palmer, J., Kays, R., et al. (2016). An open standard for camera trap data. Biodivers Data J. 4:e10197. doi: 10.3897/BDJ.4.e10197
Fritz, S., See, L., Carlson, T., Haklay, M., Oliver, J. L., Fraisl, D., et al. (2019). Citizen science and the United Nations Sustainable Development Goals. Nat. Sustain. 2, 922–930. doi: 10.1038/s41893-019-0390-3
Geldmann, J., Heilmann-Clausen, J., Holm, T. E., Levinsky, I., Markussen, B., Olsen, K., et al. (2016). What determines spatial bias in citizen science? Exploring four recording schemes with different proficiency requirements. Diversity Distribut. 22, 1139–1149. doi: 10.1111/ddi.12477
Gove, N. E., Skalski, J. R., Zager, P., and Townsend, R. L. (2002). Statistical models for population reconstruction using age-at-harvest data. J. Wildlife Manag. 66, 310–320. doi: 10.2307/3803163
Guillera-Arroita, G., Lahoz-Monfort, J. J., Elith, J., Gordon, A., Kujala, H., Lentini, P. E., et al. (2015). Is my species distribution model fit for purpose? Matching data and models to applications. Glob. Ecol. Biogeogr. 24, 276–292. doi: 10.1111/geb.12268
Hsing, P.-Y., Bradley, S., Kent, V. T., Hill, R. A., Smith, G. C., Whittingham, M. J., et al. (2018). Economical crowdsourcing for camera trap image classification. Remote Sensing Ecol. Conserv. 4, 361–374. doi: 10.1002/rse2.84
Iacovides, I., Jennett, C., Cornish-Trestrail, C., and Cox, A. L. (2013). “Do games attract or sustain engagement in citizen science?: a study of volunteer motivations,” in Proceeding of the CHI ’13 Extended Abstracts on Human Factors in Computing Systems CHI EA ’13, (New York, NY: ACM), 1101–1106.
Isaac, N. J. B., van Strien, A. J., August, T. A., de Zeeuw, M. P., and Roy, D. B. (2014). Statistics for citizen science: extracting signals of change from noisy ecological data. Methods Ecol. Evol. 5, 1052–1060. doi: 10.1111/2041-210X.12254
Johnston, A., Fink, D., Hochachka, W. M., and Kelling, S. (2018). Estimates of observer expertise improve species distributions from citizen science data. Methods Ecol. Evol. 9, 88–97. doi: 10.1111/2041-210X.12838
Johnston, A., Hochachka, W. M., Strimas-Mackey, M. E., Gutierrez, V. R., Robinson, O. J., Miller, E. T., et al. (2020). Analytical guidelines to increase the value of citizen science data: using eBird data to estimate species occurrence. bioRxiv [preprint] 574392. doi: 10.1101/574392
Kelling, S., Fink, D., Sorte, F. A. L., Johnston, A., Bruns, N. E., and Hochachka, W. M. (2015). Taking a ‘Big Data’ approach to data quality in a citizen science project. Ambio 44, 601–611. doi: 10.1007/s13280-015-0710-4
Kery, M., and Royle, J. A. (2020). Applied Hierarchical Modeling in Ecology: Analysis of Distribution, Abundance and Species Richness in R and BUGS, 1st Edn. Amsterdam: Elsevier.
Kumar, N. S., Harihar, A., O’Kelly, H. J., and Pattanavibool, A. (2017). “Field practices: estimating abundance of prey species using line transect sampling,” in Methods For Monitoring Tiger And Prey Populations, eds K. U. Karanth and J. D. Nichols (Singapore: Springer), 121–136. doi: 10.1007/978-981-10-5436-5_7
Larson, C. L., Reed, S. E., Merenlender, A. M., and Crooks, K. R. (2019). A meta-analysis of recreation effects on vertebrate species richness and abundance. Conserv. Sci. Practice 1:e93. doi: 10.1111/csp2.93
Lasky, M., Parsons, A., Schuttler, S., Mash, A., Larson, L., Norton, B., et al. (2021). Candid Critters: challenges and solutions in a large-scale citizen science camera trap project. Citizen Sci.: Theory Practice 6:4. doi: 10.5334/cstp.343
Lynn, S. J., Kaplan, N., Newman, S., Scarpino, R., and Newman, G. (2019). Designing a platform for ethical citizen science: a case study of CitSci.org. Citizen Sci.: Theory Practice 4:14. doi: 10.5334/cstp.227
MacKenzie, D. I., Nichols, J. D., Lachman, G. B., Droege, S., Royle, J. A., and Langtimm, C. A. (2002). Estimating site occupancy rates when detection probabilities are less than one. Ecology 83, 2248–2255. doi: 10.2307/3072056
Malik, A., Hiekkanen, K., Hussain, Z., Hamari, J., and Johri, A. (2020). How players across gender and age experience Pokémon Go? Univ. Access Inf. Soc. 19, 799–812. doi: 10.1007/s10209-019-00694-7
McKinley, D. C., Miller-Rushing, A. J., Ballard, H. L., Bonney, R., Brown, H., Cook-Patton, S. C., et al. (2017). Citizen science can improve conservation science, natural resource management, and environmental protection. Biol. Conserv. 208, 15–28. doi: 10.1016/j.biocon.2016.05.015
McShea, W. J., Forrester, T., Costello, R., He, Z., and Kays, R. (2015). Volunteer-run cameras as distributed sensors for macrosystem mammal research. Landscape Ecol. 31, 55–66. doi: 10.1007/s10980-015-0262-9
Miller, D. A. W., Pacifici, K., Sanderlin, J. S., and Reich, B. J. (2019). The recent past and promising future for data integration methods to estimate species’ distributions. Methods Ecol. Evol. 10, 22–37. doi: 10.1111/2041-210X.13110
Mueller, M., Tippins, D., and Bryan, L. (2012). The Future of Citizen Science. Democracy and Education 20. Available online at: https://democracyeducationjournal.org/home/vol20/iss1/2 (accessed March 7, 2021).
Mutchler, L. A., Shim, J. P., and Ormond, D. (2011). “Exploratory study on users’ behavior: smartphone usage,” in Proceedings of the Seventeenth Americas Conference on Information Systems (Detroit, MI). Available online at: https://aisel.aisnet.org/amcis2011_submissions/418
Naidoo, R., and Burton, A. C. (2020). Relative effects of recreational activities on a temperate terrestrial wildlife assemblage. Conserv. Sci. Practice 2:e271. doi: 10.1111/csp2.271
New York State Department of Environmental Conservation (NYSDEC) (2007). Black Bears in New York: Natural History, Range, and Interactions With People. 2nd edn. Albany, NY: New York State Department of Environmental Conservation.
Newman, G., Graham, J., Crall, A., and Laituri, M. (2011). The art and science of multi-scale citizen science support. Ecol. Inform. 6, 217–227. doi: 10.1016/j.ecoinf.2011.03.002
Newman, G., Zimmerman, D., Crall, A., Laituri, M., Graham, J., and Stapel, L. (2010). User-friendly web mapping: lessons from a citizen science website. Int. J. Geogr. Inform. Sci. 24, 1851–1869. doi: 10.1080/13658816.2010.490532
Nov, O., Arazy, O., and Anderson, D. (2014). Scientists@Home: what drives the quantity and quality of online citizen science participation? PLoS One 9:e90375. doi: 10.1371/journal.pone.0090375
Parrish, J. K., Burgess, H., Weltzin, J. F., Fortson, L., Wiggins, A., and Simmons, B. (2018). Exposing the science in citizen science: fitness to purpose and intentional design. Integr. Comparative Biol. 58, 150–160. doi: 10.1093/icb/icy032
Petrie, H., and Kheir, O. (2007). “The relationship between accessibility and usability of websites,” in Proceedings of the SIGCHI Conference on Human Factors in Computing Systems - CHI ’07, (San Jose, CA: ACM Press), 397–406.
Pocock, M. J. O., Tweddle, J. C., Savage, J., Robinson, L. D., and Roy, H. E. (2017). The diversity and evolution of ecological and environmental citizen science. PLoS One 12:e0172579. doi: 10.1371/journal.pone.0172579
Poppendieck, M., and Poppendieck, T. (2003). Lean Software Development: An Agile Toolkit. Boston, MA: Addison Wesley.
Renner, I. W., Elith, J., Baddeley, A., Fithian, W., Hastie, T., Phillips, S. J., et al. (2015). Point process models for presence-only analysis. Methods Ecol. Evol. 6, 366–379. doi: 10.1111/2041-210X.12352
Robinson, O. J., Ruiz-Gutierrez, V., Fink, D., Meese, R. J., Holyoak, M., and Cooch, E. G. (2018). Using citizen science data in integrated population models to inform conservation. Biol. Conserv. 227, 361–368. doi: 10.1016/j.biocon.2018.10.002
Rotman, D., Preece, J., Hammock, J., Procita, K., Hansen, D., Parr, C., et al. (2012). “Dynamic changes in motivation in collaborative citizen-science projects,” in Proceedings of the ACM 2012 Conference on Computer Supported Cooperative Work CSCW ’12, (New York, NY: ACM), 217–226.
Royle, J. A., Chandler, R. B., Yackulic, C., and Nichols, J. D. (2012). Likelihood analysis of species occurrence probability from presence-only data for modelling species distributions. Methods Ecol. Evol. 3, 545–554. doi: 10.1111/j.2041-210X.2011.00182.x
Royle, J. A., Fuller, A. K., and Sutherland, C. (2017). Unifying population and landscape ecology with spatial capture–recapture. Ecography 41, 444–456. doi: 10.1111/ecog.03170
Schaub, M., and Abadi, F. (2010). Integrated population models: a novel analysis framework for deeper insights into population dynamics. J. Ornithol. 152, 227–237. doi: 10.1007/s10336-010-0632-7
Shirk, J., Ballard, H., Wilderman, C., Phillips, T., Wiggins, A., Jordan, R., et al. (2012). Public participation in scientific research: a framework for deliberate design. Ecol. Soc. 17:29. doi: 10.5751/ES-04705-170229
Silvertown, J. (2009). A new dawn for citizen science. Trends Ecol. Evol. 24, 467–471. doi: 10.1016/j.tree.2009.03.017
Soroye, P., Ahmed, N., and Kerr, J. T. (2018). Opportunistic citizen science data transform understanding of species distributions, phenology, and diversity gradients for global change research. Glob. Change Biol. 24, 5281–5291. doi: 10.1111/gcb.14358
Steenweg, R., Hebblewhite, M., Kays, R., Ahumada, J., Fisher, J. T., Burton, C., et al. (2017). Scaling-up camera traps: monitoring the planet’s biodiversity with networks of remote sensors. Front. Ecol. Environ. 15:26–34. doi: 10.1002/fee.1448
Storksdieck, M., Shirk, J., Cappadonna, J., Domroese, M., Göbel, C., Haklay, M., et al. (2016). Associations for citizen science: regional knowledge, global collaboration. Citizen Sci.: Theory Practice 1:10. doi: 10.5334/cstp.55
Sullivan, B. L., Wood, C. L., Iliff, M. J., Bonney, R. E., Fink, D., and Kelling, S. (2009). eBird: a citizen-based bird observation network in the biological sciences. Biol. Conserv. 142, 2282–2292. doi: 10.1016/j.biocon.2009.05.006
Sun, C. C., Fuller, A. K., and Hurst, J. E. (2018). Citizen science data enhance spatio-temporal extent and resolution of animal population studies. bioRxiv [preprint] 352708. doi: 10.1101/352708
Sun, C. C., Royle, J. A., and Fuller, A. K. (2019). Incorporating citizen science data in spatially explicit integrated population models. Ecology 100:e02777. doi: 10.1002/ecy.2777
Tenan, S., Pedrini, P., Bragalanti, N., Groff, C., and Sutherland, C. (2017). Data integration for inference about spatial processes: a model-based approach to test and account for data inconsistency. PLoS One 12:e0185588. doi: 10.1371/journal.pone.0185588
Theobald, E. J., Ettinger, A. K., Burgess, H. K., DeBey, L. B., Schmidt, N. R., Froehlich, H. E., et al. (2015). Global change and local solutions: tapping the unrealized potential of citizen science for biodiversity research. Biol. Conserv. 181, 236–244. doi: 10.1016/j.biocon.2014.10.021
Toivonen, T., Heikinheimo, V., Fink, C., Hausmann, A., Hiippala, T., Järv, O., et al. (2019). Social media data for conservation science: a methodological overview. Biol. Conserv. 233, 298–315. doi: 10.1016/j.biocon.2019.01.023
Wald, D. M., Longo, J., and Dobell, A. R. (2016). Design principles for engaging and retaining virtual citizen scientists. Conserv. Biol. 30, 562–570. doi: 10.1111/cobi.12627
Wang, D., Park, S., and Fesenmaier, D. R. (2012). The role of smartphones in mediating the touristic experience. J. Travel Res. 51, 371–387. doi: 10.1177/0047287511426341
Willi, M., Pitman, R. T., Cardoso, A. W., Locke, C., Swanson, A., Boyer, A., et al. (2019). Identifying animal species in camera trap images using deep learning and citizen science. Methods Ecol. Evol. 10, 80–91. doi: 10.1111/2041-210X.13099
Xue, Y., Davies, I., Fink, D., Wood, C., and Gomes, C. P. (2016). “Avicaching: a two stage game for bias reduction in citizen science,” in Proceedings of the 2016 International Conference on Autonomous Agents & Multiagent Systems AAMAS ’16, (Richland, SC: International Foundation for Autonomous Agents and Multiagent Systems), 776–785.
Zeller, K. A., Wattles, D. W., Conlee, L., and DeStefano, S. (2019). Black bears alter movements in response to anthropogenic features with time of day and season. Mov. Ecol. 7:19. doi: 10.1186/s40462-019-0166-4
Keywords: community science, integrated model, point process, presence-only, presence-absence, wildlife population, engagement, technology
Citation: Sun CC, Hurst JE and Fuller AK (2021) Citizen Science Data Collection for Integrated Wildlife Population Analyses. Front. Ecol. Evol. 9:682124. doi: 10.3389/fevo.2021.682124
Received: 17 March 2021; Accepted: 21 May 2021;
Published: 15 June 2021.
Edited by:
Reuven Yosef, Ben-Gurion University of the Negev, IsraelReviewed by:
Piotr Tryjanowski, Poznań University of Life Sciences, PolandCopyright © 2021 Sun, Hurst and Fuller. This is an open-access article distributed under the terms of the Creative Commons Attribution License (CC BY). The use, distribution or reproduction in other forums is permitted, provided the original author(s) and the copyright owner(s) are credited and that the original publication in this journal is cited, in accordance with accepted academic practice. No use, distribution or reproduction is permitted which does not comply with these terms.
*Correspondence: Catherine C. Sun, Q2F0aGVyaW5lLmMuc3VuQGdtYWlsLmNvbQ==
Disclaimer: All claims expressed in this article are solely those of the authors and do not necessarily represent those of their affiliated organizations, or those of the publisher, the editors and the reviewers. Any product that may be evaluated in this article or claim that may be made by its manufacturer is not guaranteed or endorsed by the publisher.
Research integrity at Frontiers
Learn more about the work of our research integrity team to safeguard the quality of each article we publish.