 Lorna E. Kearns
 Steven M. Bohaty1
 K. M. Edgar
 Sandra Nogué
 Thomas H. G. Ezard
95% of researchers rate our articles as excellent or good
Learn more about the work of our research integrity team to safeguard the quality of each article we publish.
Find out more
ORIGINAL RESEARCH article
Front. Ecol. Evol. , 06 July 2021
Sec. Paleoecology
Volume 9 - 2021 | https://doi.org/10.3389/fevo.2021.679722
This article is part of the Research Topic Functional Traits as Indicators of Past Environmental Changes View all 11 articles
Dead species remain dead. The diversity record of life is littered with examples of declines and radiations, yet no species has ever re-evolved following its true extinction. In contrast, functional traits can transcend diversity declines, often develop iteratively and are taxon-free allowing application across taxa, environments and time. Planktonic foraminifera have an unrivaled, near continuous fossil record for the past 200 million years making them a perfect test organism to understand trait changes through time, but the functional role of morphology in determining habitat occupation has been questioned. Here, we use single specimen stable isotopes to reconstruct the water depth habitat of individual planktonic foraminifera in the genus Subbotina alongside morphological measurements of the tests to understand trait changes through the Middle Eocene Climatic Optimum [MECO: ∼40 Myr ago (mega annum, Ma)]. The MECO is a geologically transient global warming interval that marks the beginning of widespread biotic reorganizations in marine organisms spanning a size spectrum from diatoms to whales. In contrast to other planktonic foraminiferal genera, the subbotinids flourished through this interval despite multiple climatic perturbations superimposed on a changing background climate. Through coupled trait and geochemical analysis, we show that Subbotina survival through this climatically dynamic interval was aided by trait plasticity and a wider ecological niche than previously thought for a subthermocline dwelling genus supporting a generalist life strategy. We also show how individually resolved oxygen isotopes can track shifts in depth occupancy through climatic upheaval. During and following the MECO, temperature changes were substantial in the thermocline and subthermocline in comparison to the muted responses of the surface ocean. In our post-MECO samples, we observe restoration of planktonic foraminifera depth stratification. Despite these changing temperatures and occupied depths, we do not detect a contemporaneous morphological response implying that readily available traits such as test size and shape do not have a clear functional role in this generalist genus. Modern imaging measurement technologies offer a promising route to gather more informative morphological traits for functional analysis, rather than the traditional candidates that are most easily measured.
Existence in an ecosystem implies importance. Abundance estimates and extinction rates are key measures used to monitor efforts to conserve species but counting alone cannot accurately demonstrate the health of an ecosystem and the species within it (Akçakaya et al., 2020). To be present in an ecosystem an organism must have a role, and thus a function (Jax, 2005), which is fluid through time, space and biota (Akçakaya et al., 2020). The key is therefore not to merely note an organism’s presence but to understand the traits that allows it to function within an ecosystem such as pollinator body and face hairiness which aids pollination (Stavert et al., 2016) or wing length which influences foraging distance (Brousseau et al., 2018). Functional loss through species extinction can be undetectable, if another species has the same or a similar function, or non-linear and saturating (Cardinale et al., 2012), with the smallest of functions having large impacts on ecosystem health (Akçakaya et al., 2020). But function is not yet used effectively in conservation. For example, functional rarity is highest for species not identified at risk on the IUCN red list in global coral reefs (Grenié et al., 2018) and simulations based on Californian bee populations show the most functionally efficient and important bees (from an analysis of 12 species/genera) are most at risk of extinction (Larsen et al., 2005). Therefore, identifying and understanding function is of paramount importance.
Simply described, a function typically describes some form of ecological process (Farnsworth et al., 2017) yet applying this definition in ecology has led to much ambiguity (Jax, 2005; Farnsworth et al., 2017). In modern ecosystems, assigning function to a trait can be done through observation and experiments with direct reference to human requirements and usefulness (Mace et al., 2014). In situ observations are one dimensional, however, and if the past is the key to predicting the future (Tierney et al., 2020), then we need to test modes of inference of how organisms lived thousands to millions of years ago and we need to be able to integrate modern and fossil functional indices. In the fossil record, direct observations of physiology and ecological function are typically not possible, so we are often left instead to infer an organism’s functional role in its community from the preserved morphological traits. Such traits may therefore be a viable currency to “bind the past and present together” (Eronen et al., 2010). Here, we relate morphological traits in fossilized planktonic foraminifera to inferred depth habitats, derived from geochemical measurements, through climatic change during the middle Eocene (∼48 to 38 Ma).
We define a trait as any morphological, physiological, phenological or behavioral feature measurable at the individual level (Violle et al., 2007). Traits are the avenue through which an organism interacts with its environment (biotic and abiotic) (Lacourse, 2009; Oksanen et al., 2019) and determine whether an organism survives or meets its demise in a changing environment (McGuire and Lauer, 2020). Thus, traits capture the most important aspects of the environment, and consequently it is the trait and not taxonomic identity that is crucial (Lacourse, 2009). For a trait to be classed as functional, it must, directly or indirectly, impact individual performance and fitness of species (McGill et al., 2006).
Taxon-free traits are a specific class of traits that transcend taxonomic classification and provide a commonality to allow comparisons across communities in different climatic and geographical settings (McGill et al., 2006). Often these traits are phenotypic such as dental morphology (e.g., Renaud et al., 2005; Žliobaitë et al., 2016; Oksanen et al., 2019; McGuire and Lauer, 2020), overall body geometry (Bregman et al., 2014; Pimiento et al., 2017; Macumber et al., 2020; Antczak-Orlewska et al., 2021; Di Martino and Liow, 2021) and, in our study system planktonic foraminifera, test morphology (Baumfalk et al., 1987; Huber et al., 1997; Renaud and Schmidt, 2003; Schmidt et al., 2004, 2006; Payne et al., 2012; Rego et al., 2012; Weinkauf et al., 2014, 2019; Weiner et al., 2015; Brombacher et al., 2017; Kucera et al., 2017). Traits can also include ecological traits like habitat (Bregman et al., 2014; Pimiento et al., 2017) and feeding behavior (Bregman et al., 2014). Despite morphological traits being collected in abundance (Parr et al., 2012), trait based research on fauna is reduced compared to flora (Lavorel and Garnier, 2002; Lacourse, 2009; Steinthorsdottir et al., 2016; Fried et al., 2019; Birks, 2020), which has resulted in a plethora of plant-based data bases [e.g., TRY (Kattge et al., 2020); LEDA (Kleyer et al., 2008) and BIEN (Enquist et al., 2016)]. One reason for this discrepancy, is that faunal morphological traits were collected before the birth of trait-based ecology and are therefore not located in easy-to-access databases and require advancements and applications of text mining tools (Parr et al., 2012). Another fundamental issue is that plants make up 81% of global biomass compared to the 0.73% made up by protists (including planktonic foraminifera) and 0.37% made up by animals (Bar-On et al., 2018), meaning flora is more accessible for research. One promising approach then is to apply trait-based methods in the geological record to understand faunal responses to environmental change.
We have the clearest indication of the impact of extinction on species richness/taxon counts in the deep time fossil record, but assignment of a functional trait in extinct species implies some knowledge of the environment (Violle et al., 2007), as well as an observation of how the trait reacts to climatic fluctuations (Eronen et al., 2010). This correlative relationship allows us to infer the (biotic and abiotic) environment from the traits observed, or vice versa if we wish (Eronen et al., 2010). If function only exists within the context of the broader community, then this inference is particularly challenging and prone to inconsistent extrapolation. Ideally, we should measure traits with an inferred ecological function alongside an environmental indicator that indicates habitat, and then seek to match the two signals.
Our goal in this study is to understand trait changes within the context of a broader community undergoing large-scale abiotically induced change. We present new morphological and geochemical data on planktonic foraminifera. Planktonic foraminifera are extant, holoplanktonic, single celled organisms that build calcite shells (tests) that, upon death, rain down in abundance to the seafloor contributing significantly to deep-sea biogenic carbonate (Vincent and Berger, 1981). Foraminifera tests provide a near continuous, spatially and temporally high-resolution fossil record dating back ∼200 Myrs to the Jurassic (Fraass et al., 2015). Additionally, planktonic foraminifera are currently represented by ∼50 extant species (Kucera, 2007) meaning specimens can be cultured in the lab (e.g., Bé et al., 1981, 1982; Bijma et al., 1990; Spero and Lea, 1993; Henehan et al., 2017; Burke et al., 2018; Fehrenbacher et al., 2018; Holland et al., 2020), yielding an ever-growing knowledge of micro and macroscale influences on foraminifera life-history. In addition, our understanding of what are functional traits in foraminifera is increasing. Some traits have obvious function such as spines for feeding (Hemleben et al., 1991) or the presence of symbionts (Bé et al., 1977, 1981, 1982; Takagi et al., 2019). Recent studies, building on previous hypotheses, have shown that pores on foraminifera tests may be functionally linked to gas exchange (Bé, 1968; Baumfalk et al., 1987; Burke et al., 2018) but are only measured reliably from the inside of the test requiring scanning electron microscope (SEM) images or micro-CT scanning (Constandache et al., 2013; Burke et al., 2018). In contrast, traits such as test shape and size must have a function, but what those functions are remain highly debated (Renaud and Schmidt, 2003; Caromel et al., 2014; Burke and Hull, 2017).
A high-resolution fossil record, advances in morphological measurements and increasing knowledge of function mean planktonic foraminifera are an ideal candidate to investigate trait-based responses to environmental change in the geological record. Furthermore, geochemical methods are advancing at an astounding rate making ecological inferences such as life history, metabolic rate, gene flow and geolocations accessible in deep time (Trueman et al., 2016). In planktonic foraminifera these advances have allowed geochemical measurements to be taken at the level of the individual, enhancing our knowledge of paleoclimate (Thirumalai et al., 2013; Schmitt et al., 2019; Glaubke et al., 2021) and the impact of individual planktonic foraminifera ecology on geochemical signatures (Eggins et al., 2003, 2004; Friedrich et al., 2012; Fehrenbacher et al., 2018; Groeneveld et al., 2019; Weinkauf et al., 2020). We leverage these advances in analytical techniques alongside the exemplary evolutionary record of planktonic foraminifera to investigate trait, organismal and community responses to climatic change on geological timescales. Here, we focus on planktonic foraminifera trait changes across a transient warming event known as the Middle Eocene Climatic Optimum (MECO).
The Eocene was a time of global climatic and biotic restructuring. Following the “Hothouse” interval from the Paleocene-Eocene Thermal Maximum [PETM; 56 Ma (Westerhold et al., 2020)] through the Early Eocene Climatic Optimum [EECO; 48 Ma (Westerhold et al., 2018, 2020)], global climate gradually cooled (Zachos et al., 2001, 2008; Cramer et al., 2009). This long-term cooling trend culminated at the Eocene-Oligocene Climatic Transition [EOT; 34 Ma (Westerhold et al., 2020; Hutchinson et al., 2021)] with the onset of large-scale glaciation on Antarctica (Zachos et al., 1996; Coxall et al., 2005). The early to middle Eocene is punctuated by multiple short-lived (∼40–200 kyrs) transient global warming events or “hyperthermals” (Westerhold et al., 2020). During the middle Eocene there was a ∼270–500-kyr transient warming event known as the Middle Eocene Climatic Optimum that interrupted the long-term cooling trend (Bohaty and Zachos, 2003; Bohaty et al., 2009; Rivero-Cuesta et al., 2019; Edgar et al., 2020). The MECO was recognized by a progressive shift to lower deep-sea δ18O records between ∼40.6 and 40 Ma followed by an abrupt return to higher δ18O values (Bohaty et al., 2009). Interpretations of this shift suggest a gradual ∼3–6°C increase in surface and deep waters (Bohaty and Zachos, 2003; Bohaty et al., 2009; Bijl et al., 2010; Cramwinckel et al., 2019; Henehan et al., 2020) followed by a rapid 200-kyr cooling to pre-excursion temperatures (Bohaty et al., 2009). This upheaval is the pre-cursor to the restructuring of planktonic foraminifera communities in the proceeding 6 Myrs, which included the progressive loss of characteristic Eocene surface dwellers that were host to algal photosymbionts (Wade, 2004; Ezard et al., 2011; Fraass et al., 2015), a reduction in morphological (Schmidt, 2004) and assemblage complexity (Schmidt, 2004; Wade and Pearson, 2008). We use the MECO as an exemplar to test for functional shifts amongst the contemporaneous planktonic foraminifera community.
Samples were taken from two scientific drillholes on the North Atlantic Southeast Newfoundland Ridge in the northwest Atlantic Ocean, ∼700 km east-southeast of Newfoundland, which were cored during International Ocean Discovery Program (IODP) Expedition 342 at Sites U1408 (41°26.3′N, 49°47.1′W) and U1410 (41°19.6993′N, 49°10.1847′W) (Norris et al., 2014). The material collected from these sites is dominated by clay-rich drift sediments that were deposited at seafloor depths well above the average late Paleogene carbonate compensation depth (CCD) (Norris et al., 2014; Boyle et al., 2017). The clay-rich lithology resulted in good to excellent preservation of carbonate microfossils including foraminifera (Norris et al., 2014; Boyle et al., 2017), with most specimens appearing “glassy” under light microscope observations indicating little or no diagenetic alteration of the calcite (Sexton et al., 2006a). Sample ages were calculated based on an age-depth model constructed using available biostratigraphic and magnetostratigraphic data for Sites U1408 and U1410 (Norris et al., 2014; Yamamoto et al., 2018; Cappelli et al., 2019). Age calibrations from the 2012 geologic timescale were used for middle Eocene geomagnetic polarity reversals [GTS2012; (Gradstein et al., 2012)]. Six samples that span the MECO (∼38.50–43.50 Ma) were selected with a ∼0.5–1-Myr sample spacing (Supplementary Table 1).
Each sample was dried at 40°C for 4 days and then soaked in sodium hexametaphosphate for a minimum of 4 days on a shaker table to disaggregate the sediment. Samples were then washed over a 38 μm sieve using deionized water until the water ran clear and then dried overnight in a 40°C oven overnight before being transferred to vials. Each sample was subsequently dry sieved to allow picking of individual specimens under the light microscope. For multi-specimen analysis (Section “Stable isotope analysis”) foraminifera were picked from a narrow sieve size fraction of 250–315 μm to avoid the effects of foraminifera size on geochemical analysis. For the individual foraminifera analysis (Section “Individual foraminifera analysis”) we picked from the > 180 μm size fraction to capture the widest range of morphological variation from the adult population.
Planktonic foraminifera occupy different depth niches within the water column creating an ecologically stratified community. As a result of isotopic fractionation in the water column, the stable isotopic signature of planktonic foraminifera tests reflects the depth habitat in which they live. The fractionation of oxygen into foraminifera calcite is temperature dependent, resulting in increasing foraminifera test δ18O values with increasing depth paralleling the trend of decreasing temperature with depth in the oceans (Fairbanks et al., 1980, 1982). The opposite depth dependent trend is seen in carbon isotopes with foraminifera calcite δ13C decreasing with depth. This relationship is due to the preferential uptake of 12C during photosynthesis at shallow water depths and the export of particulate organic carbon from the upper water column. Remineralization of particulate organic carbon at depth then releases isotopically light carbon back into the dissolved organic carbon (DIC) pool. Thus, surface ocean symbiont-hosting foraminifera have relatively low δ18O and high δ13C values relative to non-symbiont subthermocline dwellers with thermocline dwelling sitting somewhere in-between (Figure 1). These relationships do assume isotopic equilibrium between the foraminifera test and seawater. However, this equilibrium is offset by a number of physical parameters such as salinity, carbonate ion concentration (Urey, 1947; Urey et al., 1951; Epstein et al., 1953; Epstein and Lowenstam, 1954; Spero et al., 1997; Pearson, 2012) as well as foraminifera biology and ecology often referred to as “vital effects” (Erez, 1978; Spero and Williams, 1989; Spero et al., 1991; Bemis et al., 1998; Friedrich et al., 2012; Birch et al., 2013). These factors, especially foraminifera biology (Edgar et al., 2017), tend to impact test δ13C more than δ18O and can be minimized, for example, by picking foraminifera within a narrow size fraction. Nevertheless, the broad patterns of depth ranking using δ18O and δ13C (Figure 1) remains true and can be used to reconstruct foraminifera depth habitats through geological time (Pearson, 1998; Spero, 1998; Pearson et al., 2001; Sexton et al., 2006a,b; Coxall et al., 2007; Birch et al., 2013). To investigate water column structure across our study interval, planktonic foraminifera from genera representing three depth ecologies were picked: Globigerinatheka (mixed layer), Subbotina (thermocline) and Catapsydrax (sub-thermocline) (Figure 1).
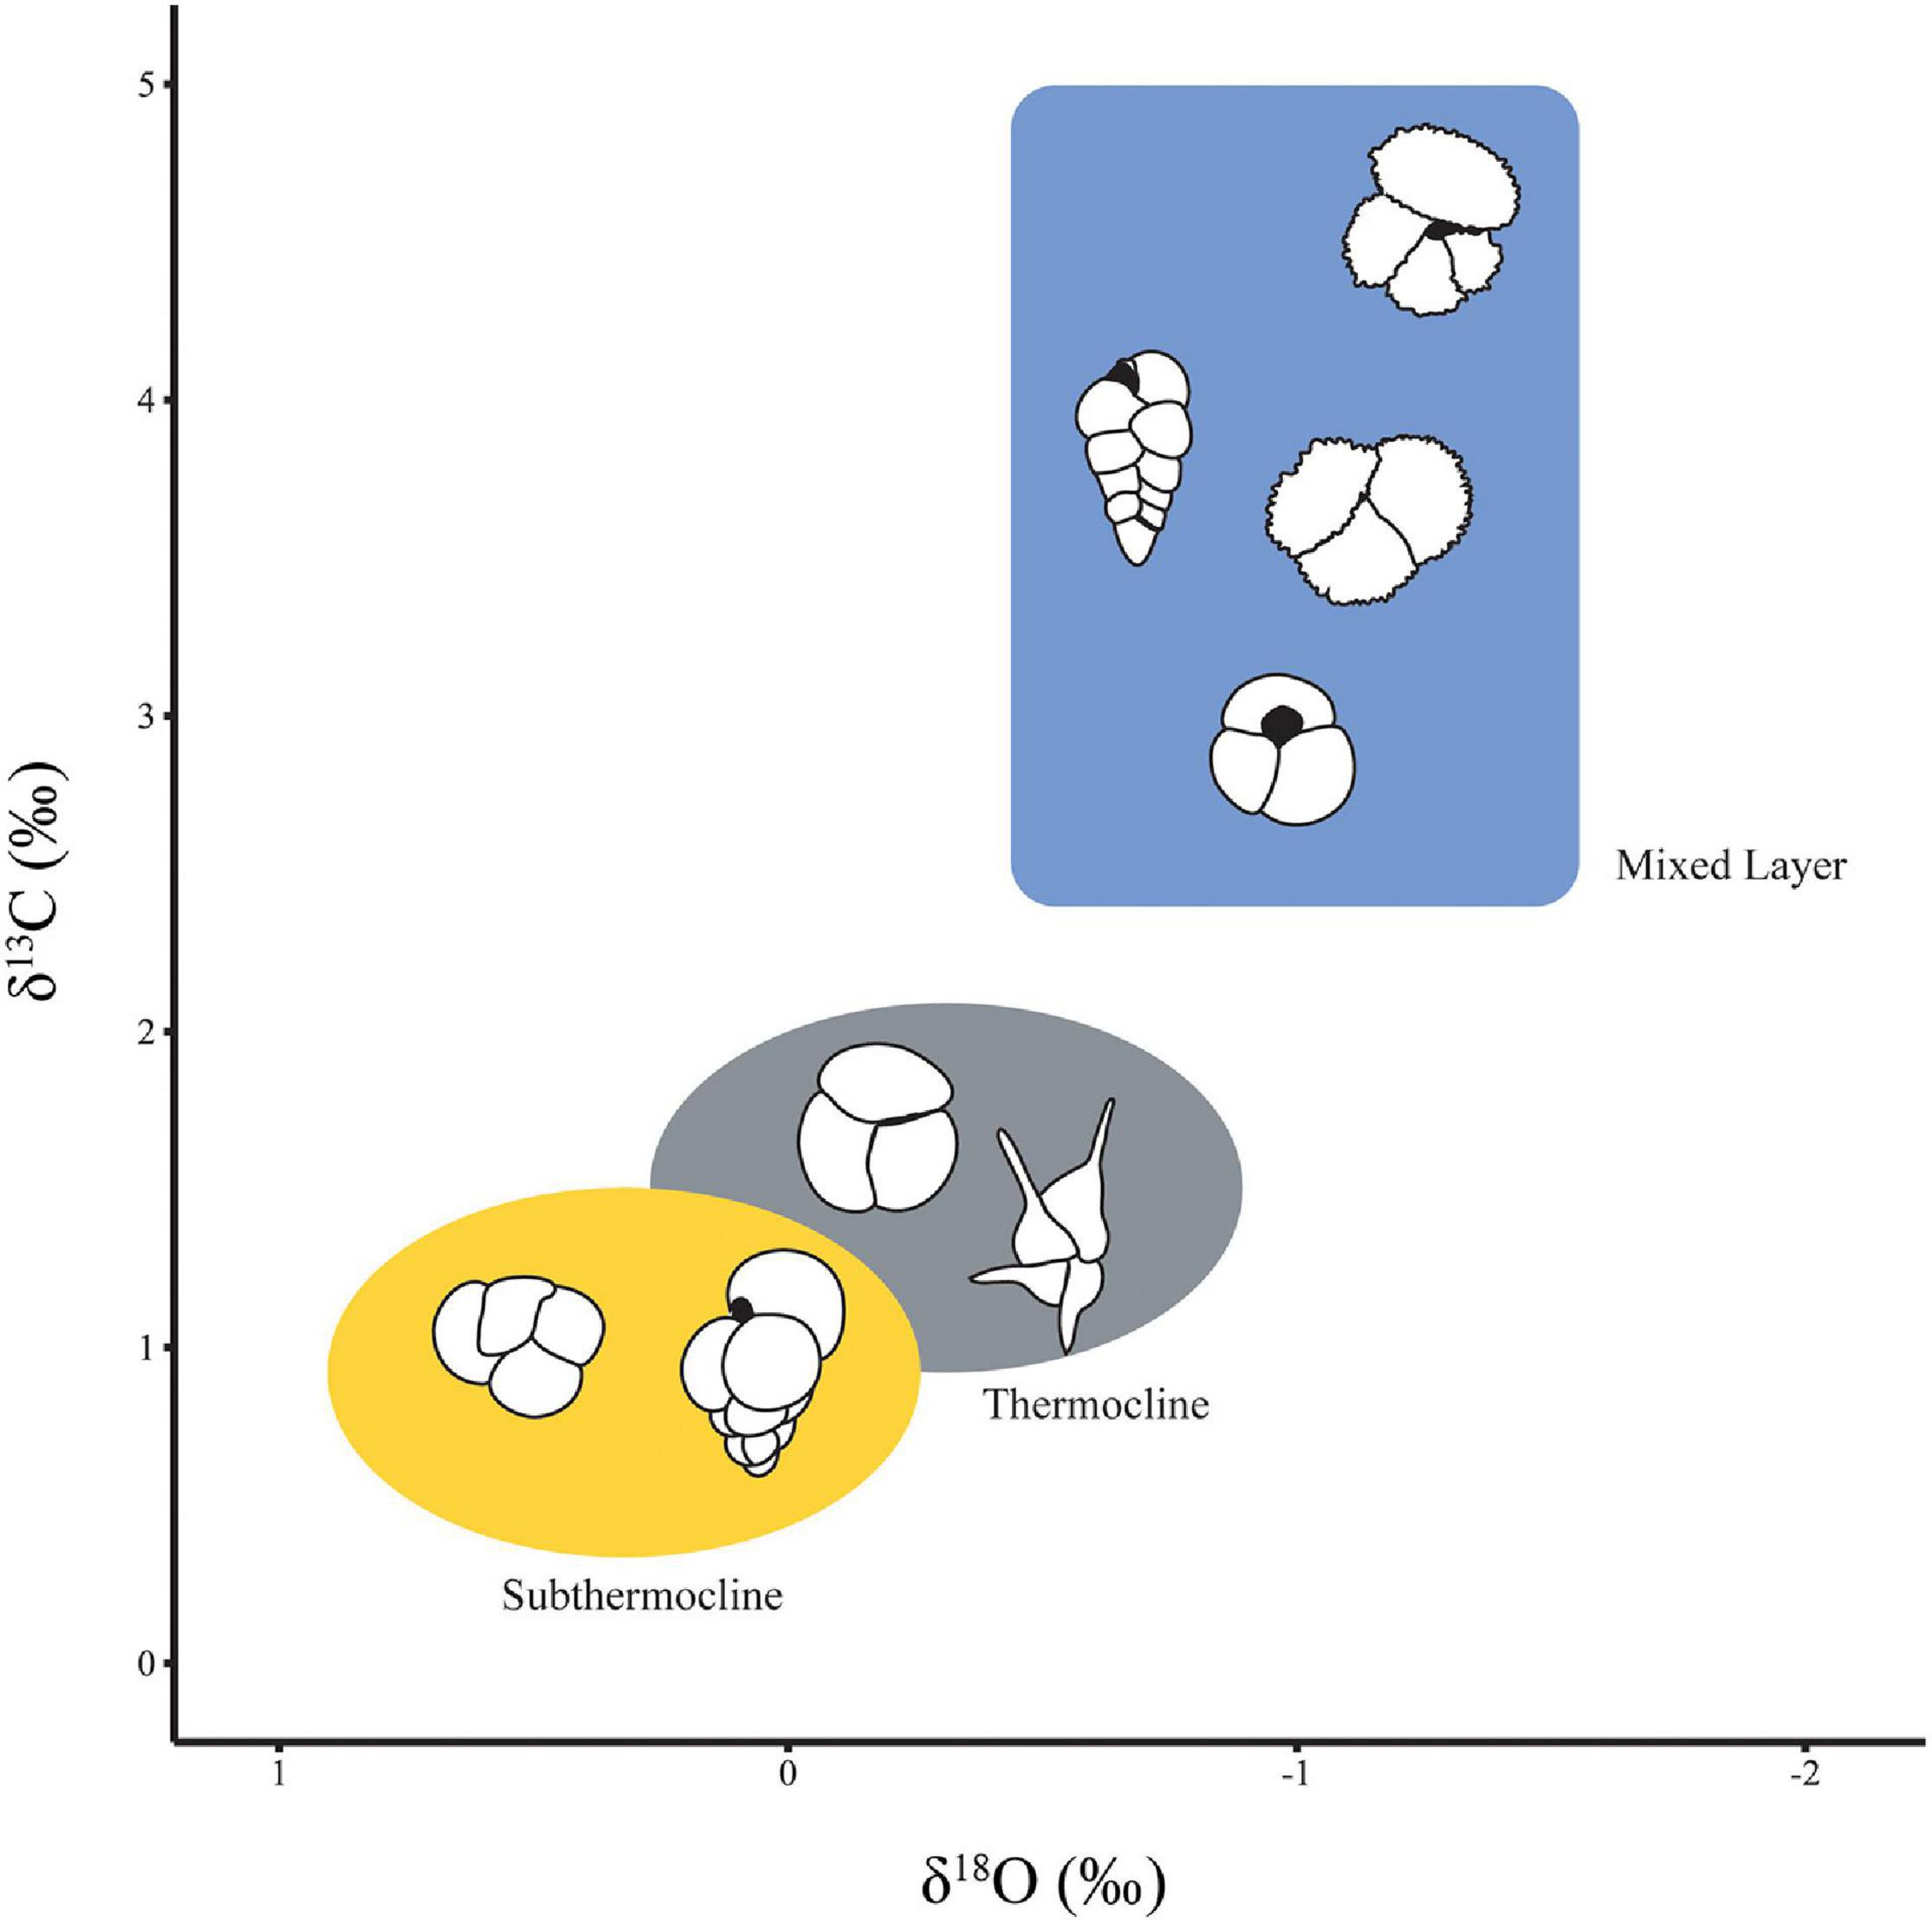
Figure 1. Schematic figure showing the three main eco groups as defined in Aze et al. (2011) based on stable isotope measurements. This figure is illustrative and does not represent absolute values for each ecogroup. Top to bottom the mixed layer is represented by schematic outlines of Acaranina spp., Chiloguembelina spp., Morozovelloides spp. and Globigerinatheka spp. Left to right the thermocline is represented by Subbotina spp. and Hantkenina spp. and the subthermocline represented by Catapsydrax spp. and Jenkinsina spp. Note the reversed scale on the x-axis. Modified from Pearson (1998).
We use the symbiont bearing, deep mixed layer dwelling Globigerinatheka (Sexton et al., 2006b; Edgar et al., 2013) to represent the mixed layer (Figure 1) rather than other commonly used shallower mixed layer inhabitants Acarinina or Morozovelloides. Morozovelloides which were not abundant enough in our samples for statistically robust isotope or morphological analyses, whilst Acarinina were abundant but showed signs of reworking (stained and heavily fragmented) and recrystallization. We made every effort to pick individuals with no visible signs of either gametogenic calcite or recrystallized wall textures and were mindful of the caveats during interpretation. To represent the thermocline and subthermocline we used asymbiotic Subbotina and Catapsydrax, respectively (Figure 1).
Approximately 20 individuals from each of Globigerinatheka spp., Subbotina spp. (S. utilisindex, S. eoceana, S. projecta, and S. linaperta) and Catapsydrax unicavus were picked from each of the 6 samples following the taxonomy of Pearson et al. (2006). The 18 subsamples, each of 20 individuals, were then crushed, homogenized and weighed into vials. Each subsample weighed between 50 and 60 μg (Supplementary Table 2) and was then cleaned by ultrasonification in ethanol for 3–5 s, rinsed in deionized water and then placed in a 40°C oven for 1–2 h to dry. Coupled δ18O and δ13C measurements were analyzed in the Stable Isotope Mass Spectrometry Laboratory at the National Oceanographic Centre, University of Southampton, using a Thermo Fisher Scientific Kiel IV carbonate device coupled to a MAT253 stable isotope ratio mass spectrometer. All samples were measured against the reference standards NBS19 and NBS18, as well as an in-house quality control standard (GS1) and then standardized using a two-point calibration between NBS19 and NBS18 to Vienna Pee Dee Belemnite (VPDB). Long-term analytical precision based on repeat analysis of GS1 is estimated as ± 0.09‰ for δ18O and δ13C.
To investigate the link between functional traits and environmental change in deep time we use individual foraminifera analysis (IFA) on the extinct, thermocline dwelling, asymbiotic planktonic foraminifera genus Subbotina (Edgar et al., 2013). Subbotina was present globally in Earth’s oceans from the early Paleocene through to the end of the Oligocene (∼65–23 Ma) (Aze et al., 2011; Wade et al., 2011). During the middle Eocene, Subbotinids increased in abundance at multiple sites across the globe flourishing over a period detrimental to many other groups (Macleod et al., 1990; Luciani et al., 2010). A possible reason for this survival is a hypothesized adaptable depth ecology, which is suggested in various intervals of the Eocene based on stable isotope measurements (Macleod et al., 1990; Bralower et al., 1995; Wade, 2004; Dutton et al., 2005; Wade and Pearson, 2008; Stap et al., 2010; Arimoto et al., 2020). Their ecology, diversity fluctuations and depth habitat make Subbotina a versatile group to investigate the link between functional traits and the environment.
To collect morphological traits, 50 individuals of Subbotina were picked from each of the six sample residues (discarding specimens showing gametogenic overgrowth and evidence of reworking) resulting in 300 individuals in total. To obtain 50 Subbotina individuals per sample, each sample was split using a microsplitter until approximately 300 foraminifera remained, shown to represent the diversity of a sample (Al-Sabouni et al., 2007). Subbotina were then picked from this “split.” To avoid biasing because of an uneven distribution of individuals on the picking tray, individuals were picked from square cells on the picking tray chosen by a random number generator until 50 well-preserved Subbotina were picked per sample. Subbotina individuals were mounted on glass slides with the aperture facing upward (umbilical view) using double sided sticky tape in groups of up to 20 for morphological analysis (Brombacher et al., 2017). Images of each block of 20 individuals were taken using a Leica M205C stereo microscope with IC90HD camera illuminated from above and then processed using Image Pro 9.1 Software. Automatic measurements of test area (size) and aspect ratio (shape) (Supplementary Figure 1) were taken using the automated image macro in Image Pro (Supplementary Table 3), which have high reproducibility (Brombacher et al., 2017). To maintain a similar scale across all analyses, size was log transformed and mean-centered around 0.
In addition to the 18 multi-specimen foraminifera samples analyzed, oxygen and carbon stable isotope ratios were determined for 120 Subbotina individuals. During the morphological analysis, described above, each individual from each sample was assigned a number from one to fifty. For each sample 20 individuals were chosen through computer generated random numbers with no replacement. Samples were cleaned in the same manner as the multi-specimen analysis described in section “Stable isotope analysis”. Weights of individuals ranged from 13 to 21 μg with an average weight of 14 μg (Supplementary Table 4). To account for the range of weights, vials were loaded into the Kiel in batches, with each batch consisting of vials of individuals with similar weights so that the settings across the whole batch were optimized for a narrower size fraction. Eight samples out of the analyzed 120 failed to record a measurement due to insufficient weight.
Ordinary least squares linear models constructed in the R environment (version 4.0.3; R Core Team, 2020) were applied to investigate the drivers of planktonic foraminifera δ18O and δ13C values. Separate models were built with δ18O and δ13C as the dependent variable and a combination of environmental (δ18O and Age), ecological (δ13C) and morphological (test area and test aspect ratio) traits as the independent variables. Numerous models were constructed with varying degrees of interaction. Models were compared using analysis of variance and the best model chosen based on likelihood ratio tests and Akaike Information Criterion (AIC). Clustering analysis was conducted with a Gaussian finite mixture model using the mclust package (Scrucca et al., 2016) with the best model and thus number of clusters chosen using the Bayesian Information Criterion (BIC). The influence of sample age on morphological and stable isotope variables was tested using one-way analysis of variance (ANOVA).
To analyze our trait data in the context of local MECO paleoceanographic changes, we generated stable isotope records from three genera at each of the sites each with different depth habitats (Figure 2 and Supplementary Table 2). Globigerinatheka show the lowest δ18O across the interval compared to Catapsydrax and Subbotina (Figure 2A). Between 43.50 and 41.31 Myrs Globigerinatheka δ18O increased by 0.25‰, over the same interval Subbotina δ18O increased by 0.72‰ whilst Catapsydrax increased by 1.03‰ (Figure 2A). Then at 40.14 Ma all genera show a decrease in δ18O with Globigerinatheka decreasing by 0.21‰, Subbotina by 0.64‰ and Catapsydrax by 1.50‰ (Figure 2A). Following the MECO to the end of our record at 38.50 Ma both Globigerinatheka and Catapsydrax show gradual increases in δ18O (0.41 and 1.40‰, respectively; Figure 2A). In contrast Subbotina shows an increase in δ18O of 0.89‰ at 39.56 Ma followed by a decrease of 0.17‰ at 38.50 Ma (Figure 2A).
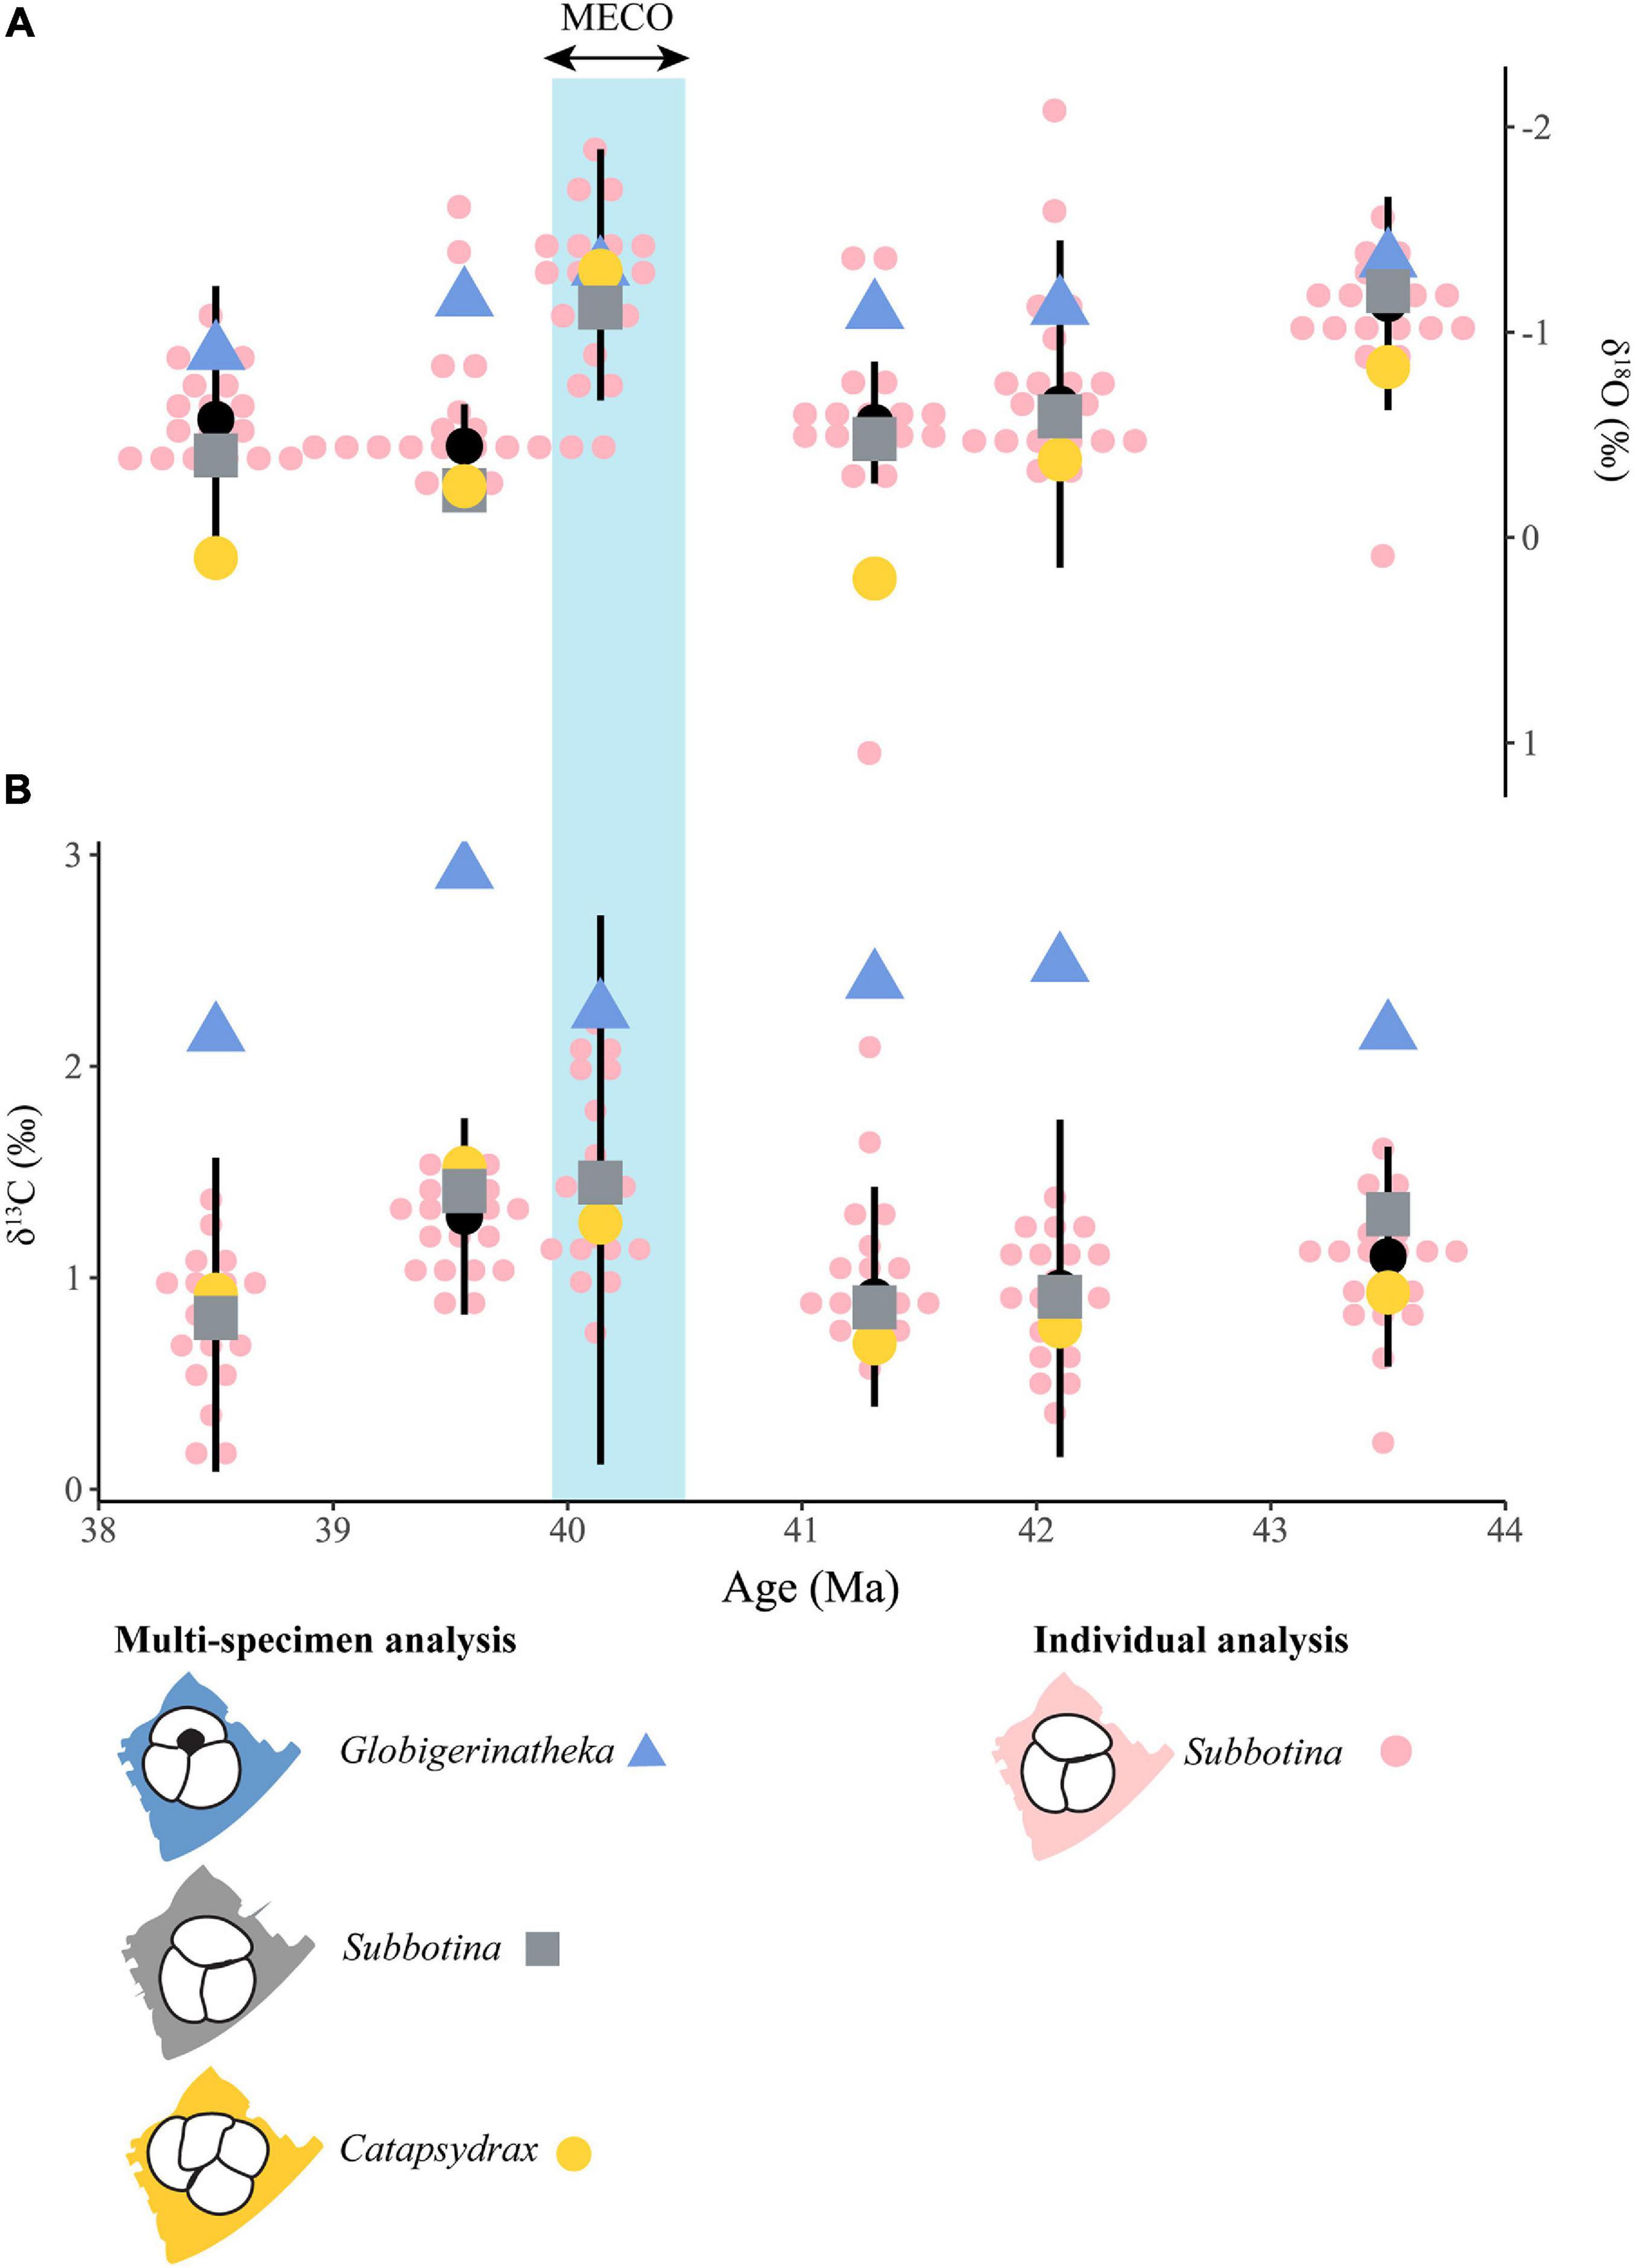
Figure 2. Oxygen (A) and carbon (B) stable isotope results from individual foraminifera analysis (IFA) and batch multi-specimen analysis. Small pink circles show IFA of Subbotina, where circles are stacked horizontally multiple individuals have the same measurement. The genera used in batch analysis are represented by consistent coloring and shapes across each time slice: Globigerinatheka = blue triangles, Subbotina = gray squares and Catapsydrax = yellow circles. The black circle and vertical lines represent summary statistics from IFA with the circle representing the median and vertical line indicating 2.5 absolute standard deviations of the median (MAD). Note the reversed y- axis on panel A. The vertical blue box indicates the position of the MECO.
The vertical thermal structure of the water column can be assessed by calculating the difference in δ18O between surface water dwellers (Globigerinatheka) and deeper dwellers (Subbotina (thermocline) and Catapsydrax (subthermocline): Δδ18Osurface−deep = δ18OCatapsydrax−Subbotina-δ18OGlobigerinatheka (Figure 3A and Supplementary Table 5). A multiple linear regression using the δ18O difference between Globigerinatheka and the two deeper dwelling genera (Subbotina and Catapsydrax) as the response variable showed a significant impact on the habitat differences in oxygen isotope space (p < 0.001) and in the MECO (p < 0.01) interval (Supplementary Table 6). There was a predicted 0.71 ± 0.11‰ overall decrease in the δ18O gradient between Globigerinatheka and the deeper dwelling genera (Subbotina and Catapsydrax) across the study interval compared to the gradient change observed in δ13C (Figure 3 and Supplementary Table 6). Additionally, there was a predicted 0.56 ± 0.15‰ decrease in overall isotopic gradient (both δ18O and δ13C) during the MECO interval compared to the other time slices, which was primarily due to a reduction δ18O gradient between all genera (Figure 3 and Supplementary Table 6). An adjusted R2 of 0.69 shows that 69% of variation in isotopic differences in Figure 3 can be explained by a model that includes isotope grouping (carbon and oxygen) and interval grouping (MECO or not). The Δδ18Osurface–Catapsydrax is between 0.52 and 1.30‰ for most of the interval except at 40.14 Ma where Δδ18O is 0.01 (Figure 3A). At this time, both Globigerinatheka and Catapsydrax have δ18O values of −1.31 and −1.30‰, respectively. Subbotina, with an inferred intermediate depth habitat, records a δ18O value of −1.12‰ (Figure 2A).
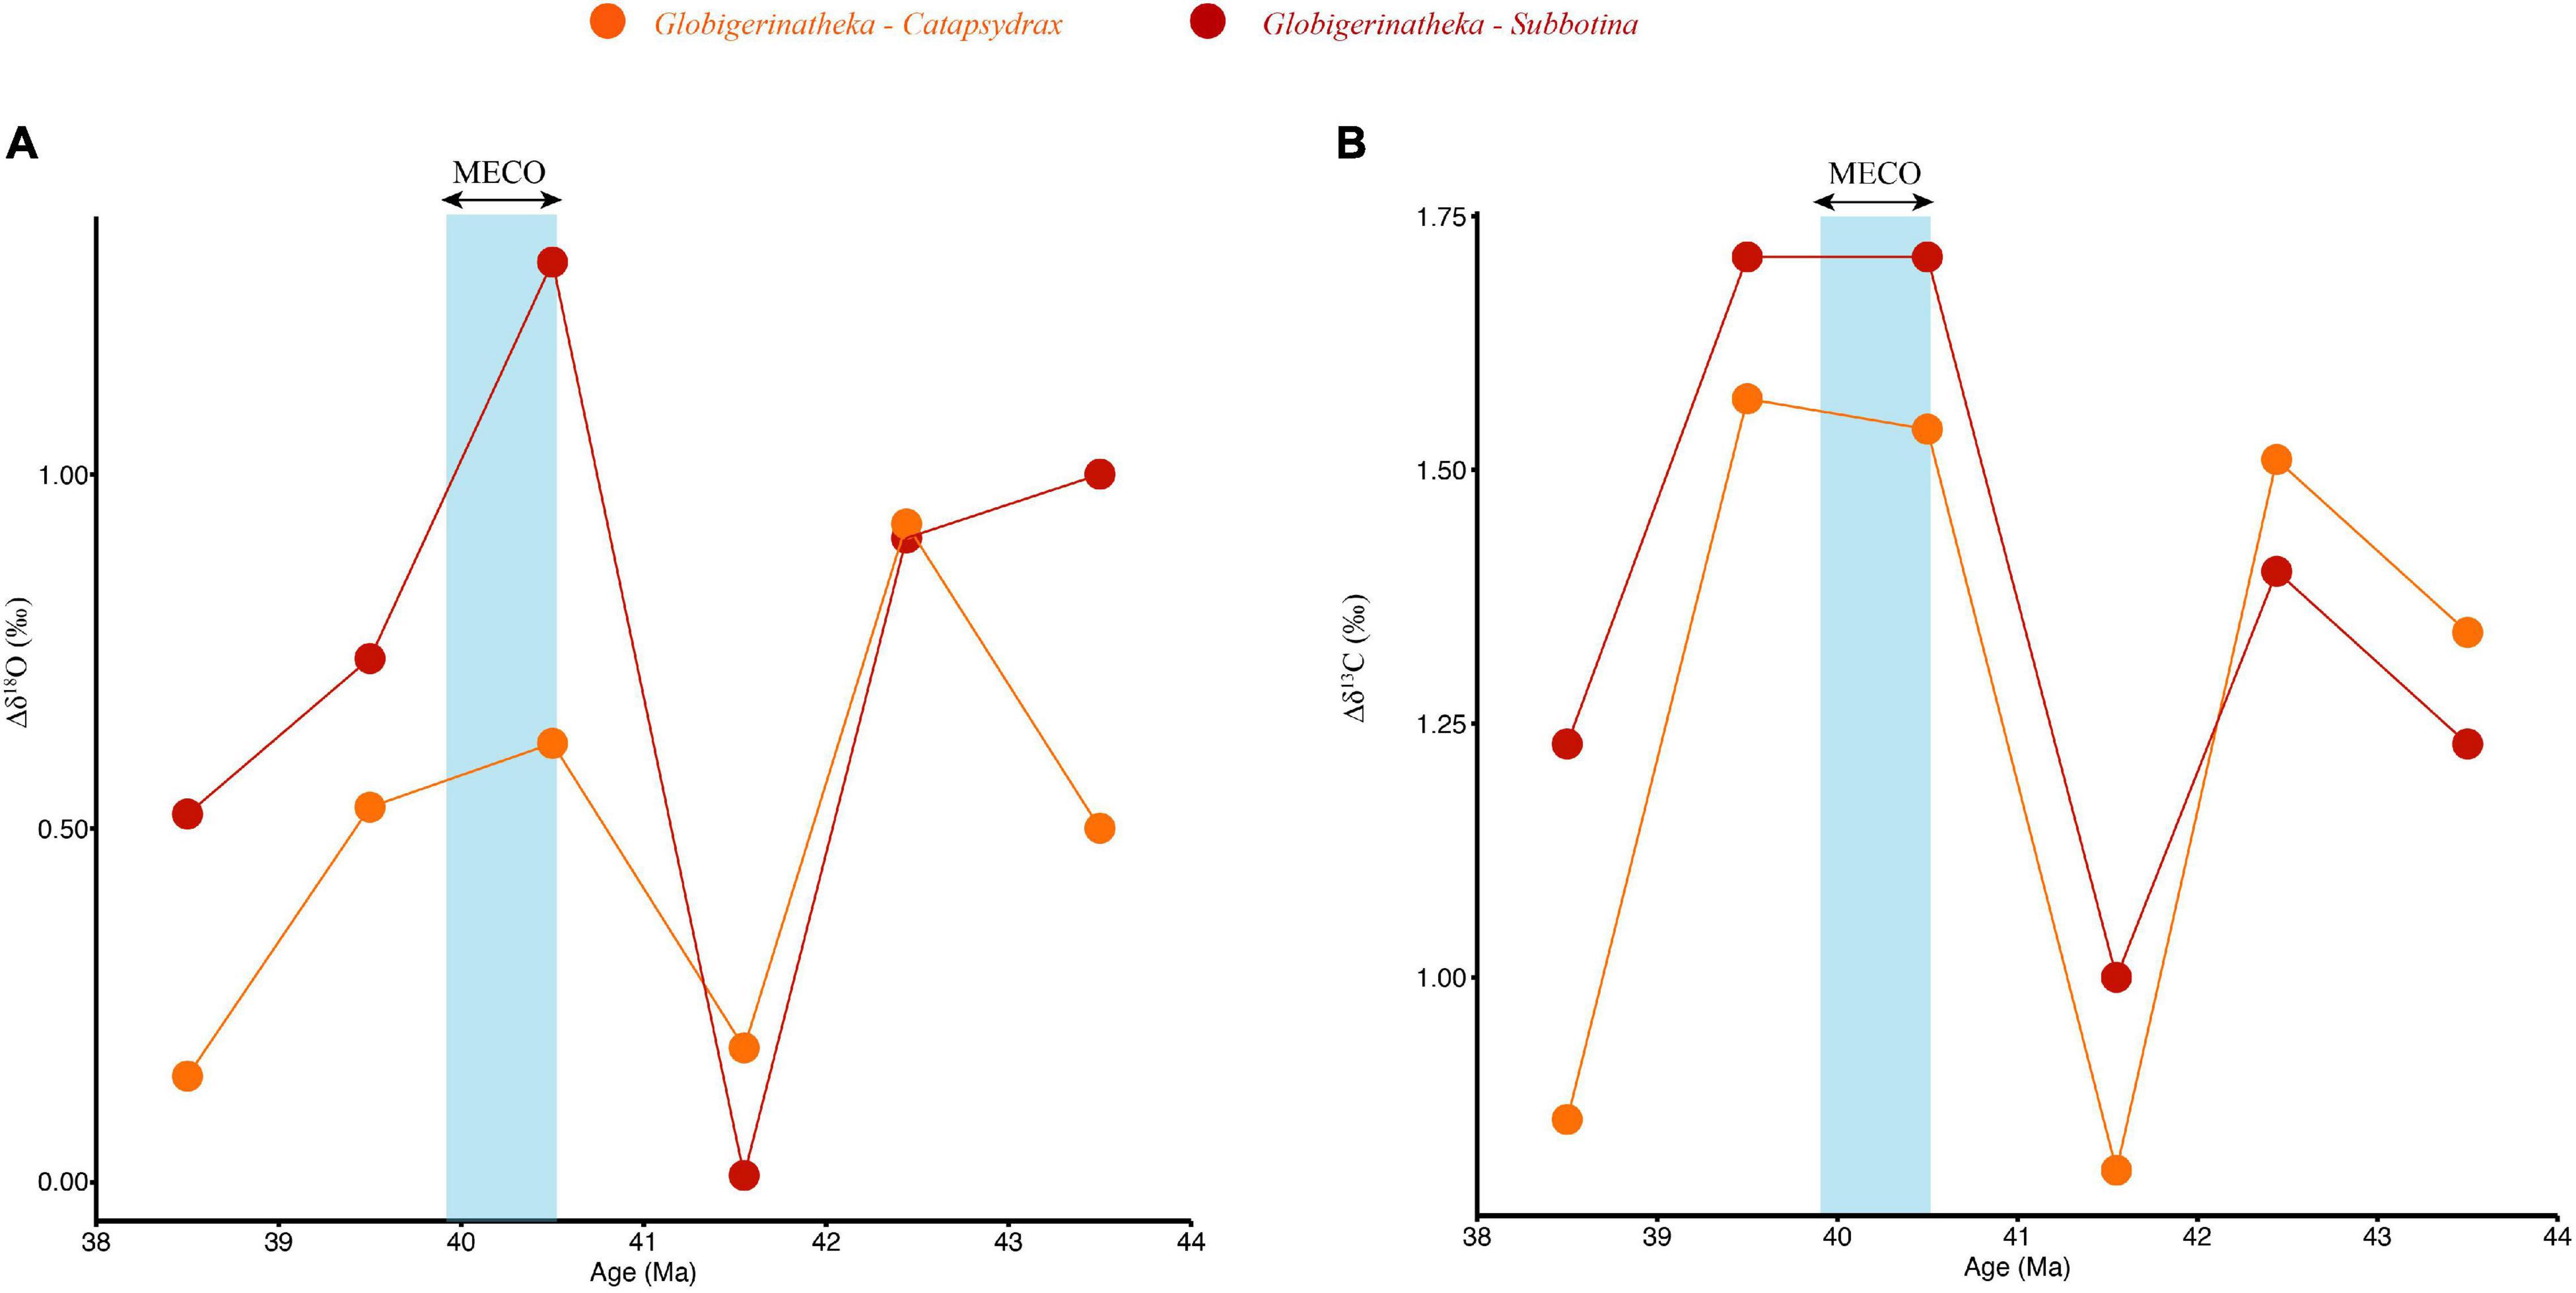
Figure 3. Stable oxygen (A) and carbon (B) isotope gradients between Globigerinatheka (surface) and Subbotina (thermocline) and Catapsydrax (subthermocline) across the MECO interval. As the line approaches zero the isotopic gradient between the different genera is reduced, with 0 indicating no difference in isotopic signature between the different depth habitats. The vertical blue box indicates the MECO.
Globigerinatheka consistently show the highest δ13C values of the measured genera throughout the study interval, and their values stay within a narrow δ13C range throughout (between 2.15 and 2.92‰; Figure 2B) with the highest δ13C value recorded immediately after the MECO. Subbotina and Catapsydrax consistently yield δ13C values > 1.00‰ lower than Globigerinatheka and show their highest δ13C values in the MECO and immediately after. Subbotina sits slightly above Catapsydrax in δ13C space as expected based on their recorded depth habitat but following the MECO this relationship is reversed (Figure 2B).
Individuals of Subbotina show variation around “batch” Subbotina measurements in both δ18O and δ13C space (Figure 2). However, the batch Subbotina measurements plot within 1 standard deviation of the median of the individual foraminifera analyses (IFA; black circle, Figure 2) in each time slice. This is expected and indicates that IFA analysis draws out intraindividual variation within a genus. The range in IFA δ18O values at each time slice, apart from at 38.50 Ma, is consistently >1.00‰, with the widest ranges observed prior to the MECO where one to three analyses sit outside of two absolute deviations of the median (Figure 2A). These “extreme” values sit apart from the rest of the measurements in each sample. For example, at 41.31 Ma one positive δ18O value leads to the largest range across the interval of 2.44‰ (Figure 2A). Only at 40.14 and 38.50 Ma do all measurements sit within 2.5 absolute deviations of the median. Although these points are more “extreme” there is no reason that they should be excluded. In all samples some individual Subbotina measurements plot within the same space or above that of the Globigerinatheka batch measurements (Figure 2A). In contrast to δ18O, individual measurements of Subbotina in δ13C space are overall more spaced out with limited or no clusters. The range of δ13C values in each time slice is > 1‰ throughout with the largest range seen between 40.14–41.31 Ma around the MECO. The exception is at 39.56 Ma where it is 0.70‰ (Figure 2B). Unlike δ18O, Subbotina individuals are consistently below and separated from batch Globigerinatheka δ13C values albeit with a reduction in this separation at the MECO (Figure 2B).
Cross plots of the individual Subbotina δ13C and δ18O measurements shows an apparent cluster of points in the middle of the plot (0.50–1.25‰ in δ13C and −0.20–1.20‰ in δ18O space) with higher δ13C values primarily from the MECO plotting to the side (Figure 4). To determine whether the MECO data genuinely represent a separate cluster of points, a clustering analysis was conducted using a Gaussian finite mixture model. The analysis revealed a spherical, varying volume model with two clusters fitted the data best with a BIC of -255 (Supplementary Figure 2). This model split the 112 data points into two relatively even clusters (Cluster 1: n = 53, Cluster 2: n = 59, Supplementary Table 7). The cluster classification does not cleanly follow the boundaries of our pre-defined time slices (Figure 4), with all but three data points from the MECO time slice and one from 43.50 Ma within a separate cluster (Cluster 1) along with some individuals from each other time slice. The MECO and oldest time slice cluster together as these two samples are climatically similar, as indicated by δ18O values, thus the cluster captures the transient warming interval and the earliest stage of the global cooling trend, respectively.
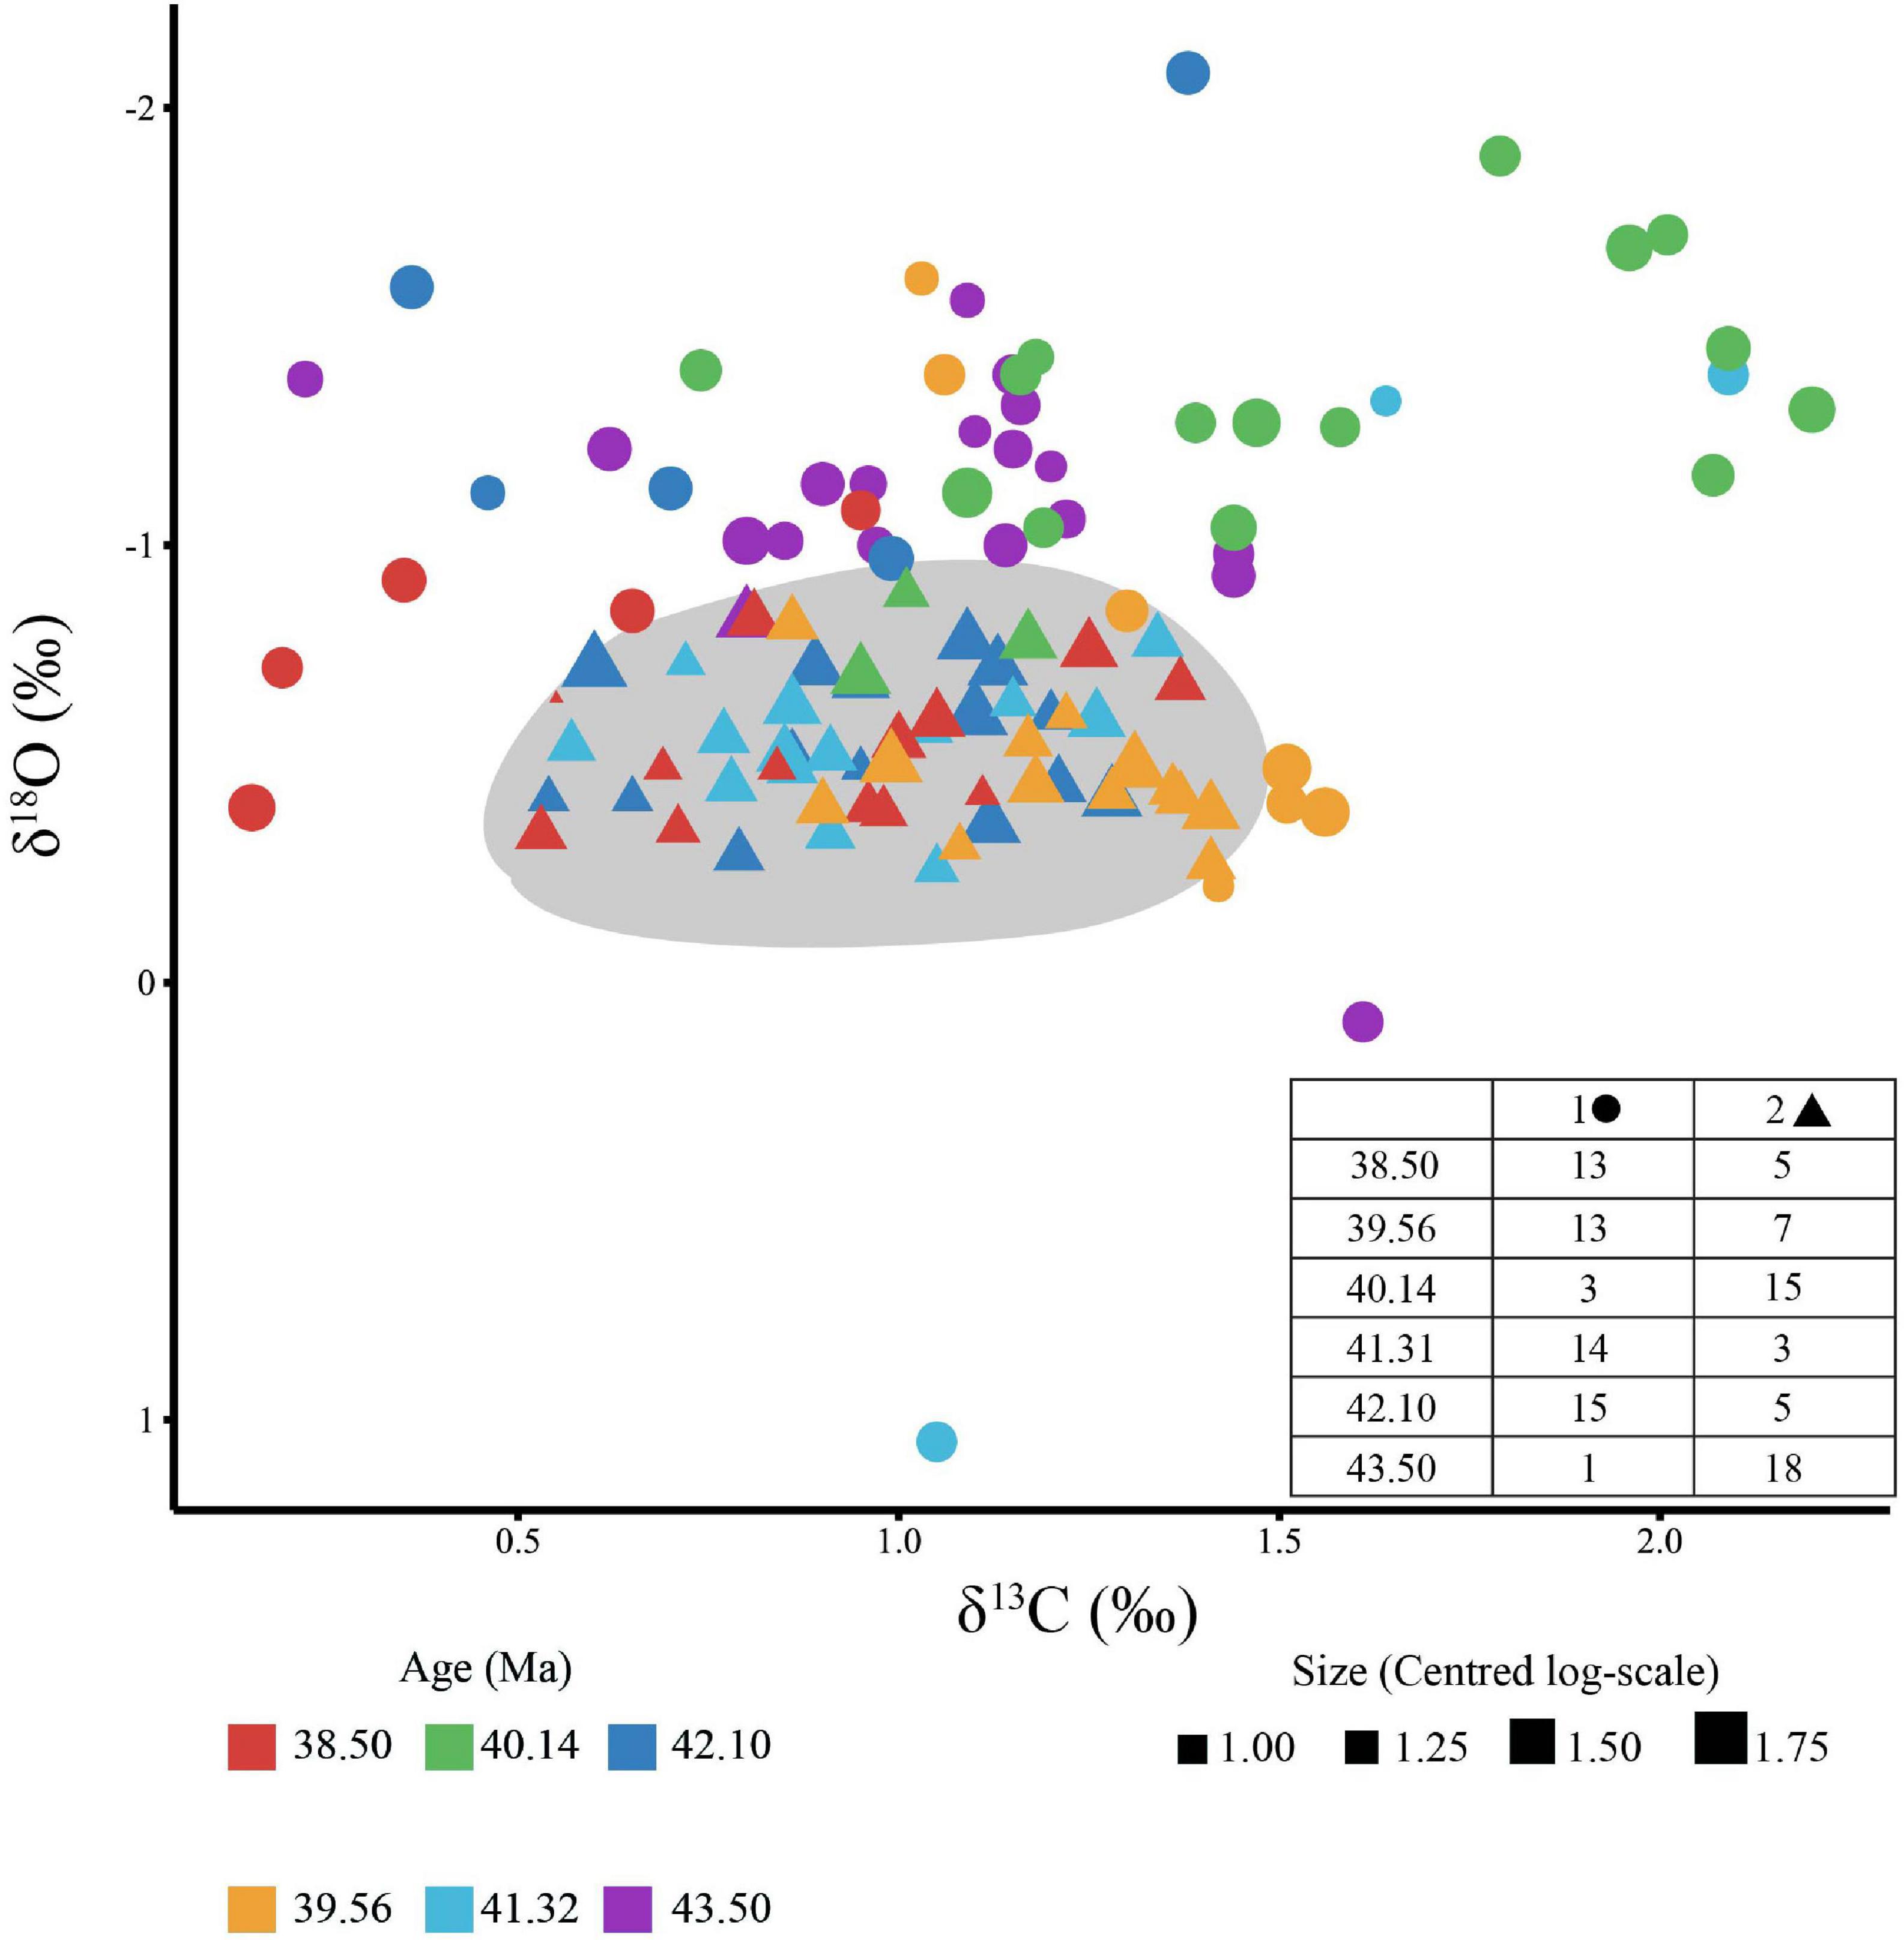
Figure 4. Cross plot of carbon versus oxygen isotopes for individual Subbotina analysis. Individual point size represents the size (area) of each individual on a log scale. The symbol (triangle vs. circle) indicates the cluster that each individual was assigned to following cluster analysis. Circles represent cluster 1 and consist primarily of individuals from 40.14 and 43.50 Ma as highlighted in the table inset into the figure, while triangles represent cluster 2. The number of individuals in each time slice assigned to each cluster is shown in the inset table. The gray area visually represents cluster 2 as identified by the model.
Although clustering analysis identifies two clusters from the data, there is uncertainty particularly where the clusters are in close contact when δ18O is around −1.00‰ (Figure 4). To investigate this signal further, one-way ANOVAs were fitted on carbon and oxygen separately with age as the groups. There was a statistically detectable difference between time slices in both δ18O [F(5,106) = 11.84, p < 0.001] (Supplementary Table 10) and δ13C [F(5,106) = 9.84, p < 0.001] (Supplementary Table 12). A post hoc TUKEY HSD test showed this difference to only be significant in δ18O between the MECO sample (40.14 Ma) and all other samples except for 43.50 Ma at the beginning of the record (p < 0.001) supporting the clustering analysis (Supplementary Table 11). In δ13C, the same post hoc test showed no detectable difference between the start (43.50 Ma) and end (38.50 Ma) of the record, but a supported a difference between the MECO and all pre-MECO samples (p < 0.05) (Supplementary Table 13). This, along with the clustering analysis, strengthens the inference that Subbotina isotopic variation is more nuanced in δ13C than δ18O, likely through the increased role of biological “vital effects”.
Morphological traits of test shape (test aspect ratio) and size (mean-centered test area on log scale) were also made on 300 Subbotina individuals including the 120 individuals that were used for geochemical analysis. Considering the full morphological dataset, both size and shape show large ranges in all samples with no clear trend with sample age (Figure 5). A one-way ANOVA showed detectable differences between time slices in both mean shape [F(5,294) = 3.171, p < 0.01] (Supplementary Table 14) and size [F(5,294) = 3.185, p < 0.01] (Supplementary Table 15). Used in isolation these traits give us little information, so we integrated the 120 individuals that had both morphological (size) and stable isotope measurements (Supplementary Table 4) into multiple linear regression models because size has an impact on stable isotope and trace element expression in planktonic foraminifera (Elderfield et al., 2002; Friedrich et al., 2012).
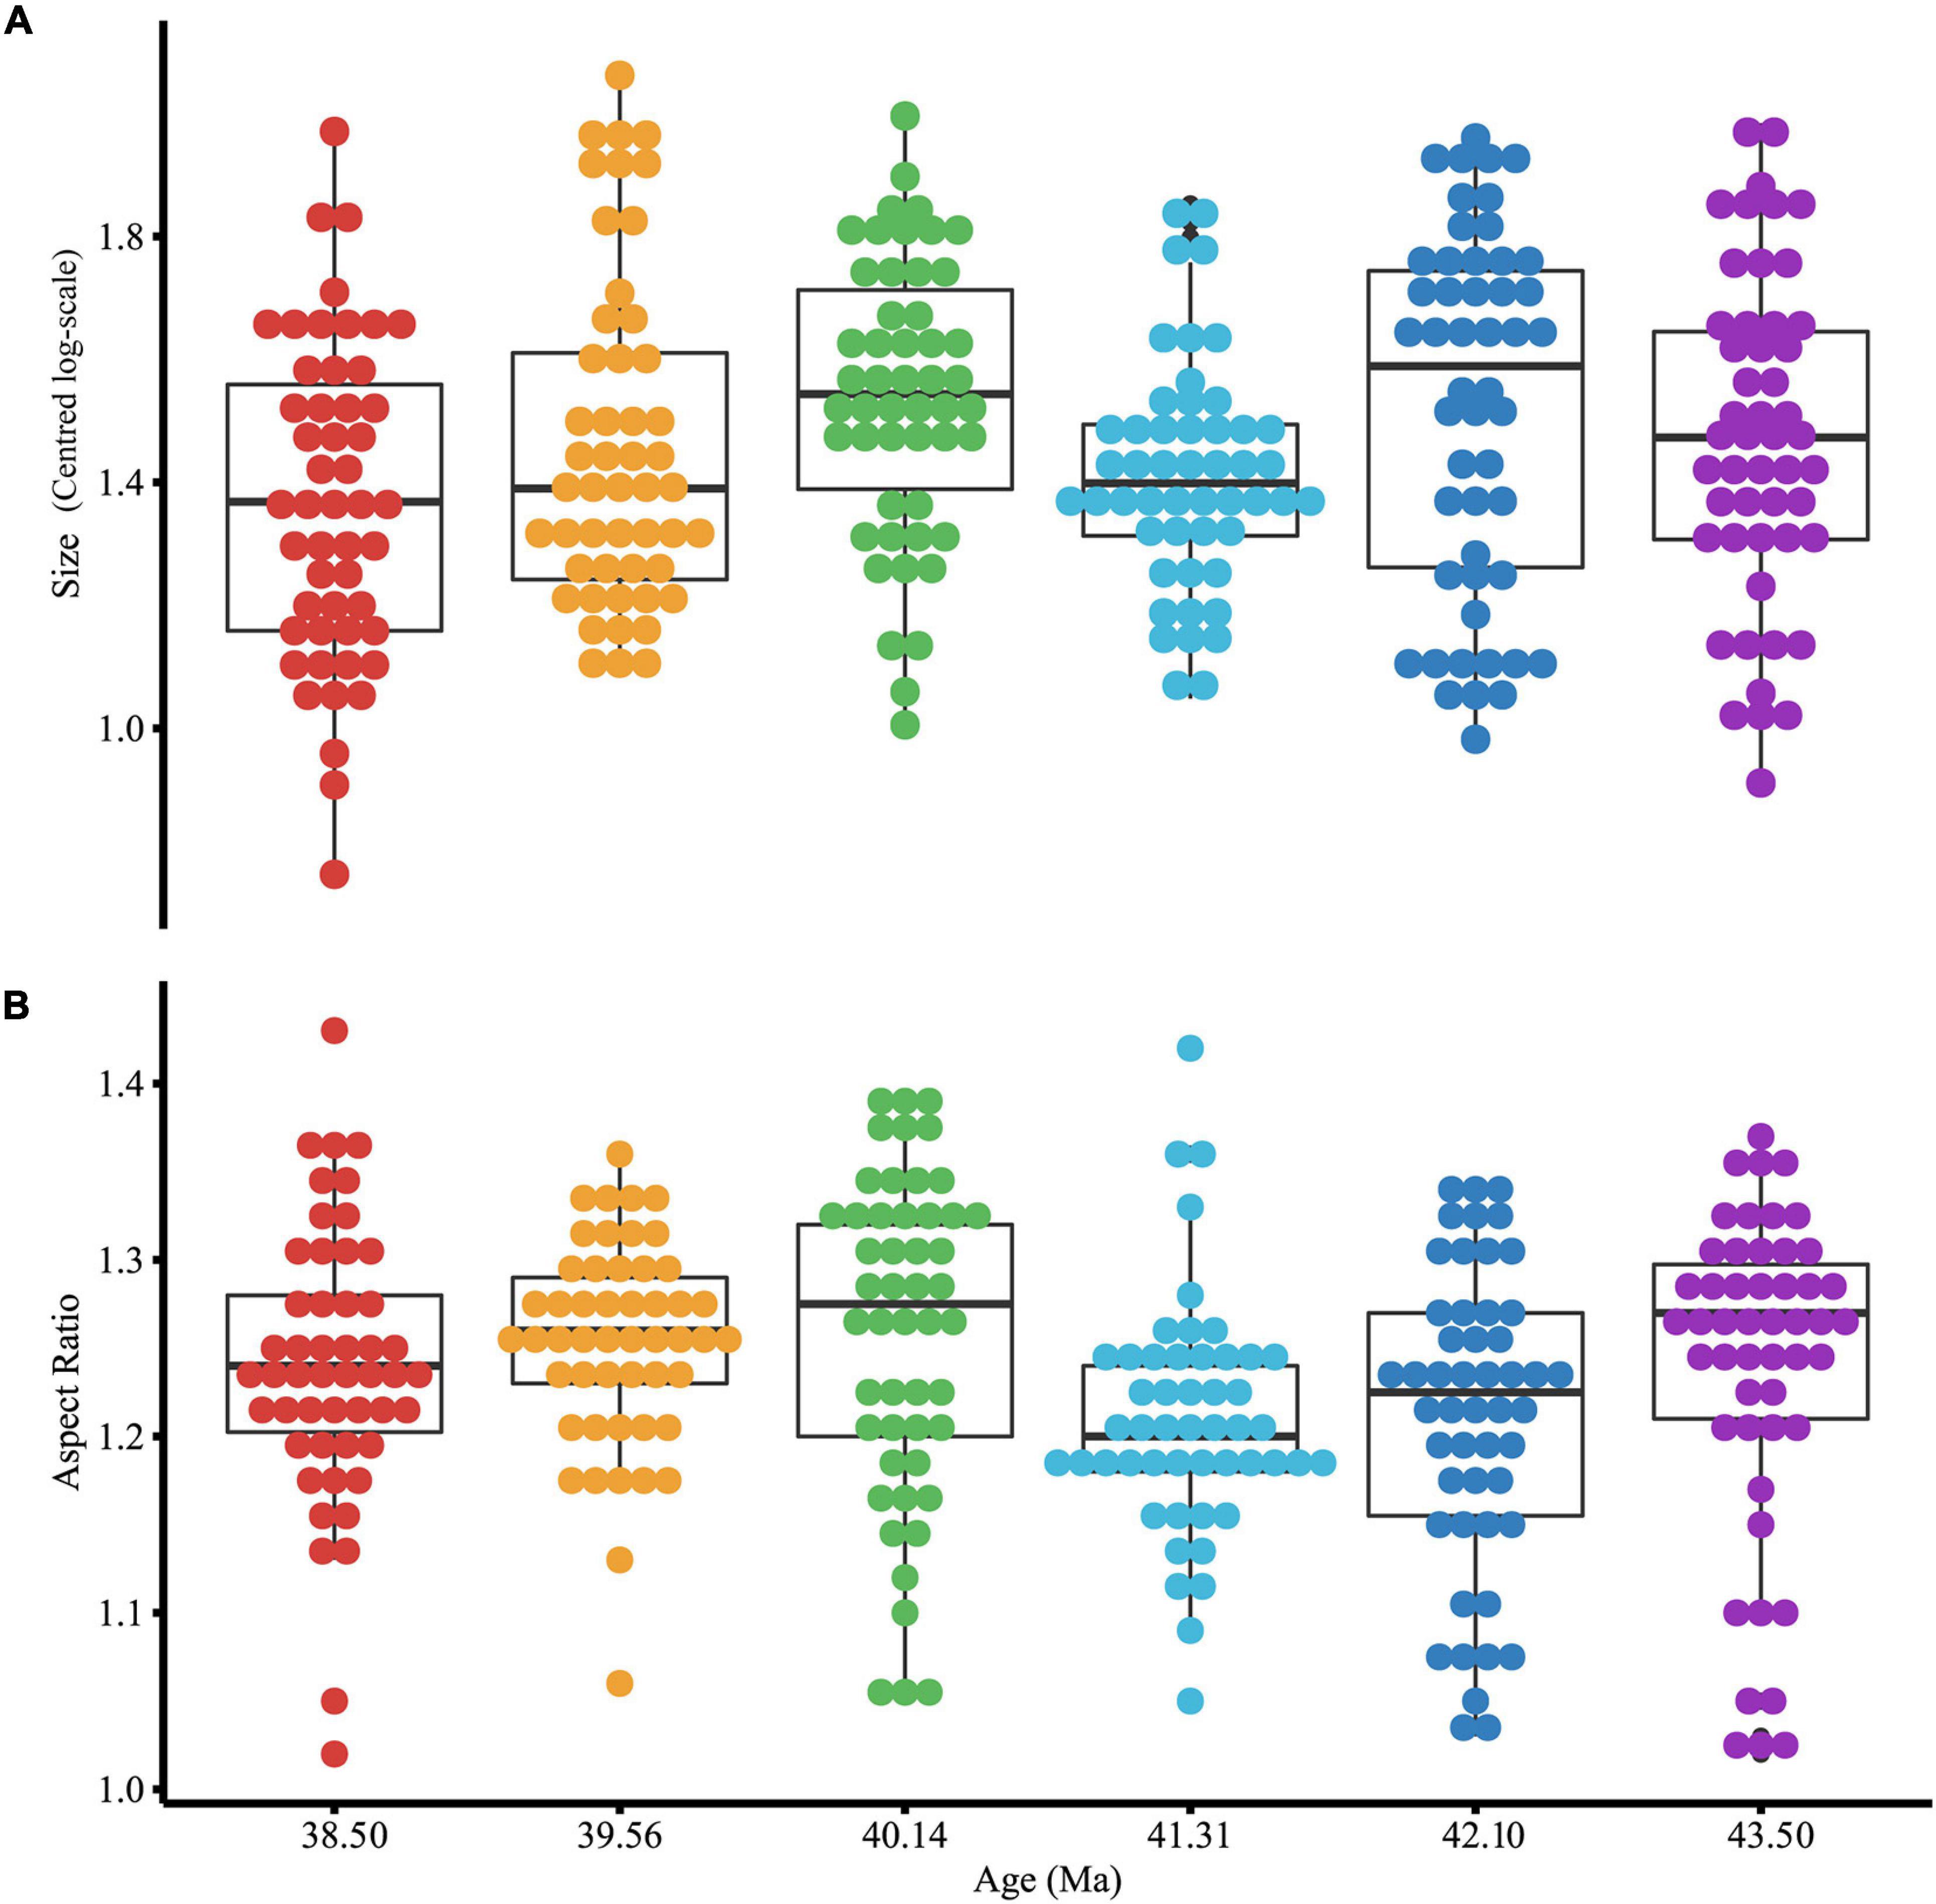
Figure 5. Morphological [test size (A) and test aspect ratio (B)] variation of all Subbotina measured in this study (n = 300). Size is on a log scale so has no unit of measure. The box represents the interquartile range whilst the whiskers show 1.5*interquartile range. The black line represents the median. Individual filled symbols represent all individual specimens sampled.
The best supported δ13C model included an interaction between δ18O and size with an adjusted R2 of 0.28 (Supplementary Table 16). Of the predictors included, only age at 40.14 and 39.56 Ma differed detectably from the baseline δ13C at 38.50 Ma (p < 0.001) (Supplementary Table 17). At 39.56 and 40.14 Ma (MECO) δ13C is predicted to increase by 0.46 ± 0.11‰ and 0.60 ± 0.13‰, respectively, compared to δ13C at 38.50 Ma (Supplementary Table 17). Our models predict a 0.10‰ decrease in Subbotina δ13C values per log size unit increase, although this relationship is not significant (Supplementary Table 17). Removal of sample age and oxygen isotopes leaves size as the only explanatory variable results in a positive relationship between δ13C and size [0.29 ± 0.15‰ increase per log(size) increase], but not one that is detectably different from 0 (Supplementary Table 18). For δ18O a similar model with an interaction between δ13C and size was the most supported to explain individual Subbotina δ18O (Supplementary Table 19). Of the predictors δ13C, size and sample age, sample age was the main driver of individual Subbotina δ18O (p < 0.001). At 40.13 Ma (MECO) and 43.50 Ma, δ18O is predicted to decrease by 0.61 ± 0.15‰ and 0.44 ± 0.13‰, respectively, compared to δ18O at 38.50 Ma (Supplementary Table 20). Replacing foraminifer size with weight yielded qualitatively similar results with best fitting model structure remaining the same (Supplementary Tables 21–24). The positive δ13C-weight relationship (p < 0.05) was qualitatively consistent with the inferred δ13C-size relationship, but weight explained more variation (lower residual sum of squares, Supplementary Tables 17, 22) than size.
Since we measured batch isotopes on foraminifera with three typically distinct depth ecologies (surface, thermocline and subthermocline), we can use the batch δ18O values to understand the impact of water-depth temperature changes on Subbotina δ18O, a proposed thermocline dweller. We used the same model as above but with the age predictor replaced by surface, thermocline and subthermocline δ18O measurements as a proxy for water depth temperature. It is the deeper ocean temperatures (thermocline and subthermocline), rather than surface ocean, that drive the individual foraminifera measurement of Subbotina δ18O (p < 0.05) (Supplementary Table 25). A subthermocline and thermocline δ18O increase of 1.00‰ is predicted to increase Subbotina δ18O by 0.34 ± 0.16‰ and 0.44 ± 0.19‰, respectively, translating to a deepening depth habitat for Subbotina as the deeper ocean cools at a faster rate than the surface waters (Supplementary Table 25).
Unpicking ecological signals from paleoceanographic signals is difficult, but worthwhile because of the ability to study transient climatic events in deep time. The most common way to infer functionality in deep time is to look for a correlation between a morphological trait and ecological differences (Eronen et al., 2010). We show complicated morphological and geochemical responses to the Middle Eocene Climatic Optimum (MECO, Figures 2–5). The reduction of surface-deep δ18O and δ13C gradients in our study at the MECO (Figure 5) could be explained by: (1) hydrological changes causing the changes in “batch” isotopes observed but depth habitat of foraminifera remaining constant through the interval (Figure 6) discussed in Section “Paleoenvironmental Changes”; or (2) ecological changes, with deeper dwelling foraminifera (Catapsydrax and Subbotina) migrating upward in the water column to occupy a similar thermal habitat to that of Globigerinatheka (Figure 6) discussed in Section “Measuring functionality in foraminifera traits.”
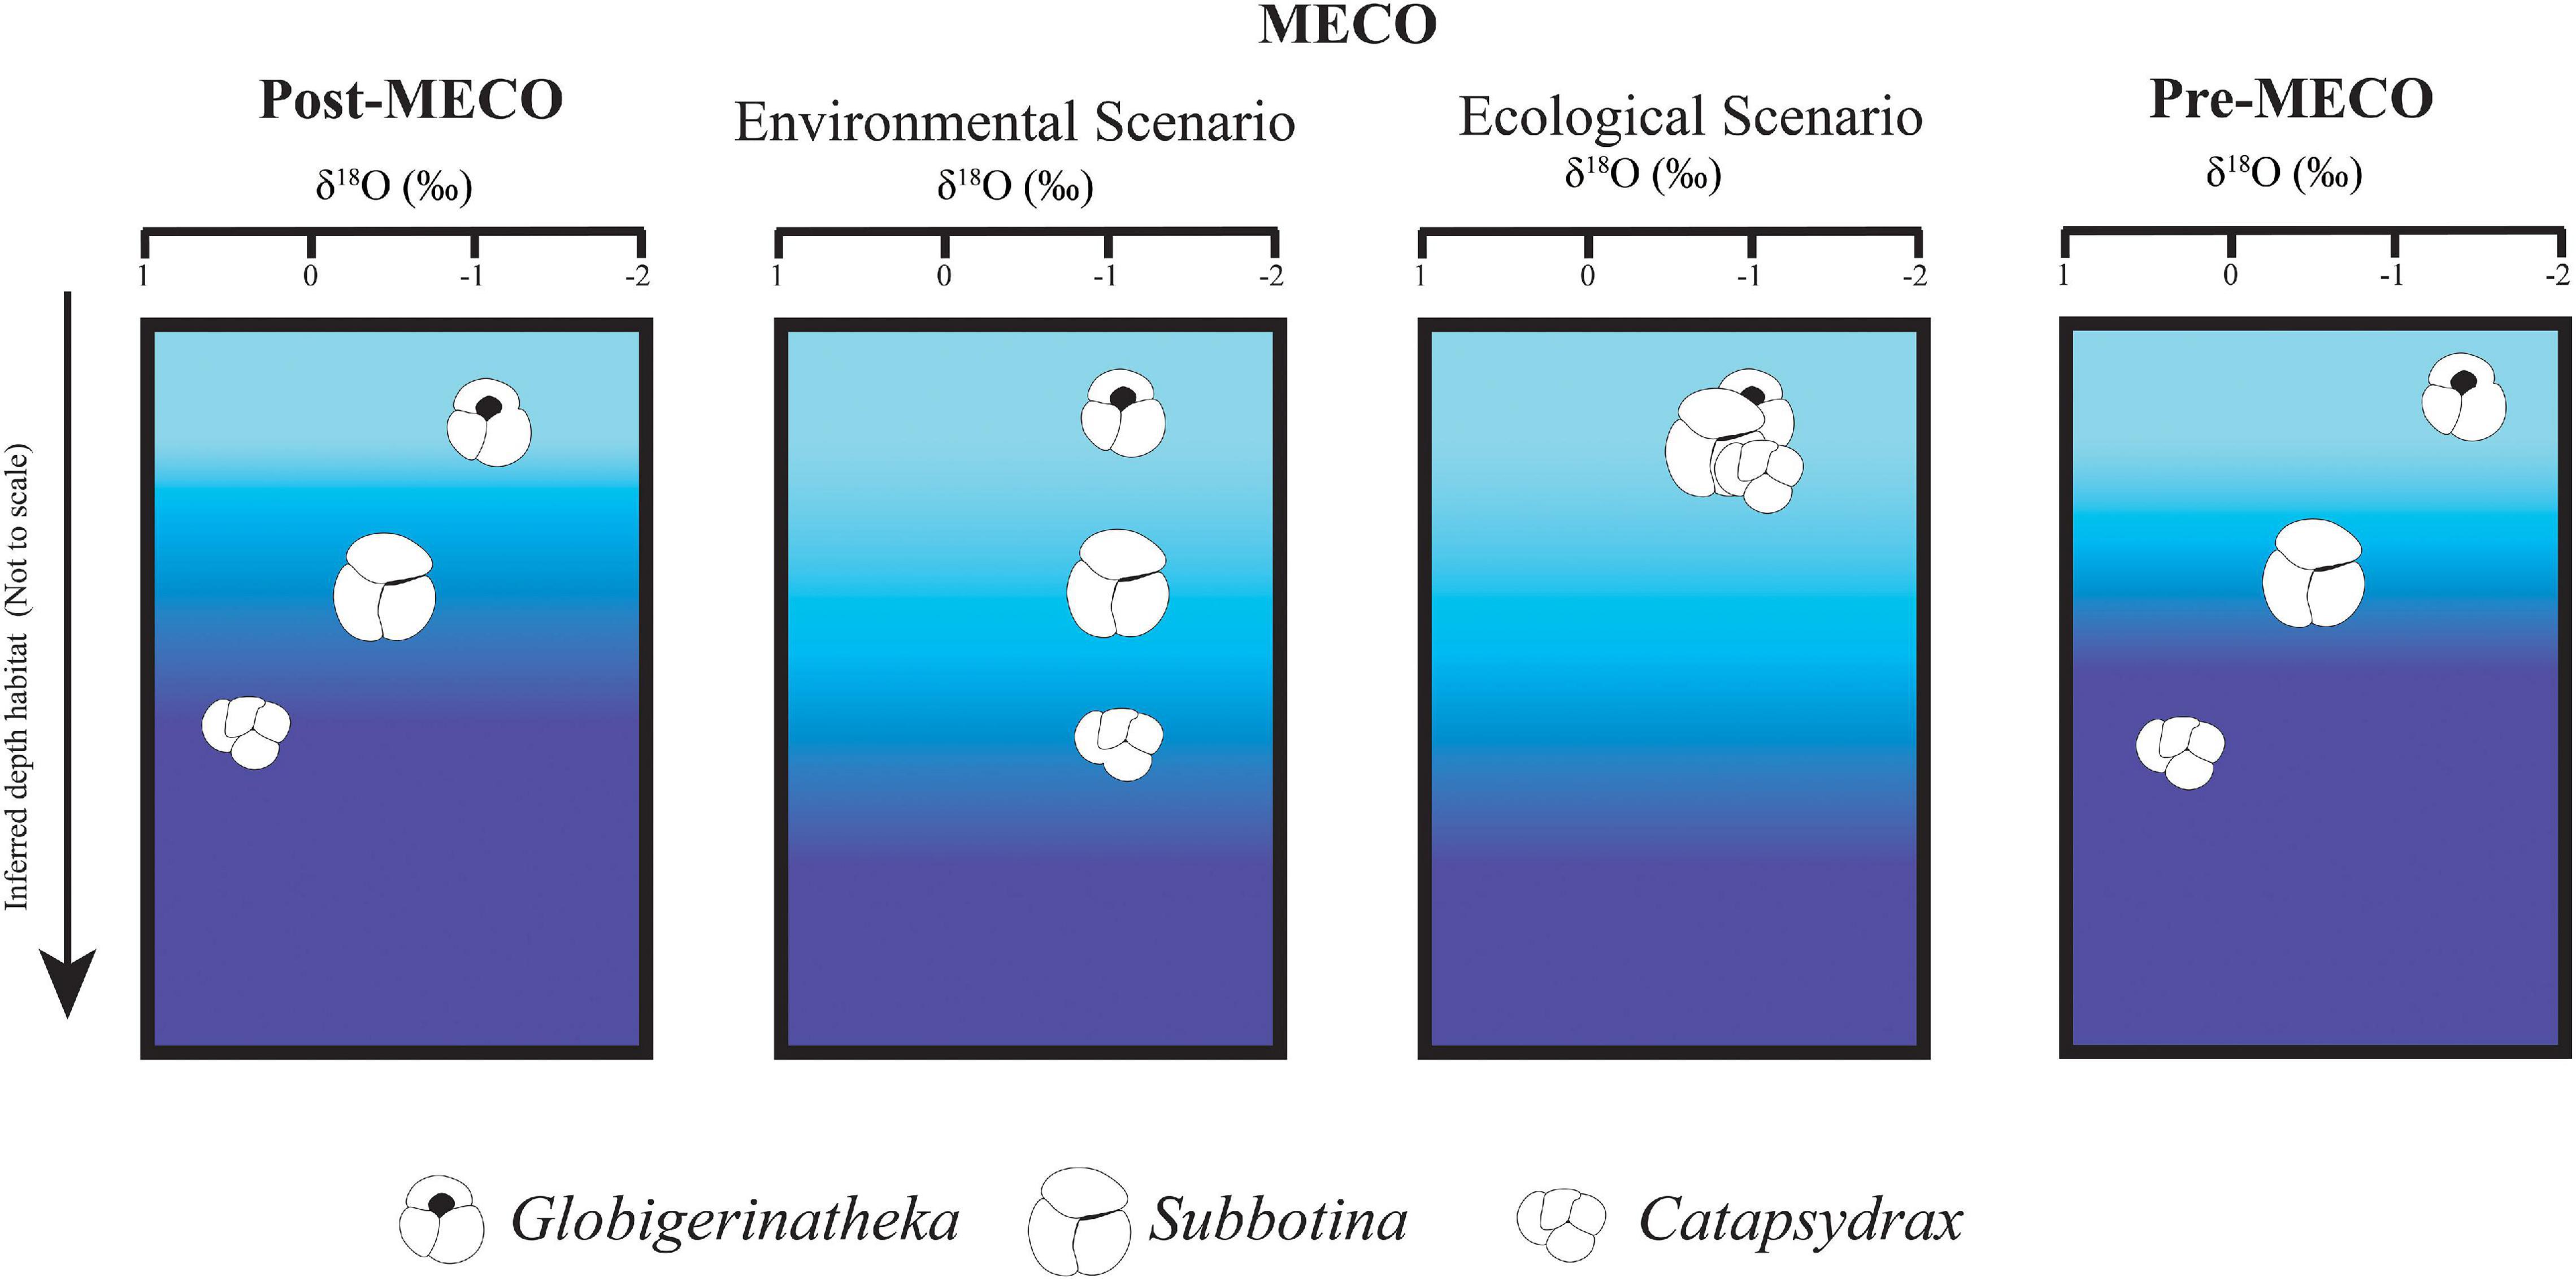
Figure 6. Schematic illustration of environmental versus ecological scenarios to explain the δ18O isotopic gradient changes between genera. Color gradient in all panels represents temperature change from warm (light blue) to cool (darker blue) temperatures.
The carbon isotope signature (δ13C) of planktonic foraminifera is controlled by biology (Edgar et al., 2017) and there are long established relationships between test size and δ13C signal in planktonic foraminifera (Berger et al., 1978; Oppo and Fairbanks, 1989; Spero et al., 1991; Elderfield et al., 2002; Friedrich et al., 2012). The δ13C-test size relationship is commonly controlled in stable isotope analysis by using narrow size fractions intended to remove the relationship between δ13C and size. Unfortunately, this pre-emptive censoring also removes the correlation needed to infer functionality. In this study, we use a wide size fraction (>180 μm) and detect no relationship between Subbotina δ13C and size (∼47,219–173,204 μm2) in either multivariate or univariate models when the presence of explanatory variables that track climatic fluctuations are removed (δ18O and sample age). Although only a single case study, the lack of size-δ13C relationship here has implications for studying functional traits in deep time where vast climatic changes can occur instantaneously in geological terms. Our discussion focusses on the challenges of interpreting these biologically driven isotopic signatures through periods of substantive environmental change.
Applying trait based studies on thousand-to-million year time scales requires a thorough understanding of climatic and environmental variables. To provide an environmental dimension to our study, we will focus on paleoenvironmental changes (Figure 6) across the 6 Myr focal interval using the inferred depth ecology of individual planktonic foraminifera alongside the measured δ13C and δ18O of the genera level isotopes. Through this comparison, we can infer potential water column thermal and trophic state changes across the MECO, which in concert with more temporally resolved studies can provide important climatic and environmental context for our trait-based analysis.
The Eocene saw a gradual change from hothouse to icehouse climate punctuated by short-lived global warming events, the final globally recognized of which is the MECO (Cappelli et al., 2019). Prior to the MECO, a positive shift in benthic foraminifera δ18O values at ∼42 Ma in the Atlantic Ocean and other ocean basins (Coxall et al., 2000; Edgar et al., 2007; Cramwinckel et al., 2018; Westerhold et al., 2020) as well as nannofossil assemblage composition changes toward cool water taxa in the Southern Ocean at ∼41.6 Ma (Villa et al., 2008, 2013) indicate that global temperatures were lower than in the early Eocene and that the transition from a hothouse to icehouse was already underway. Water column cooling resulted in increasing planktonic foraminifera depth habitat stratification (Figures 2, 3).
In our record from the Newfoundland margin, Catapsydrax and Subbotina show progressive δ18O increases of 0.45 and 0.61‰, respectively, suggesting up to 2°C cooling of deep water temperatures in comparison to the surface ocean by 41.44 Ma (Figure 2A). Thermal decoupling of the water column due to global cooling would result in the development of a strong, shallow thermocline and more thermally stratified water column prior to the MECO (43.50 to 41.44 Ma; Figure 2A), as suggested in previous research at this locality (Arimoto et al., 2020). In contrast, sea surface temperature change in the subtropical North Atlantic Ocean appear to be relatively minimal with Globigerinatheka Δδ18O of ∼0.23‰ across the same interval (Figure 2A) supported by minimal surface ocean changes in the South East Atlantic (Galazzo et al., 2014).
Our record indicates that decoupled water column responses to environmental changes continued during the MECO. We see a reduction in δ18O gradients between surface and deep water dwellers (Δδ18OGlobigerinatheka–Catapsydrax: 0.01‰; Figure 3) driven by large decreases in Subbotina and Catapsydrax δ18O values (Δδ18O: 0.64 and 1.50‰, respectively) and only small decreases in Globigerinatheka δ18O (Δδ18O: 0.21‰ compared to pre-MECO levels (Figure 2A). This suggests that warming was concentrated at thermocline and subthermocline depths (increasing by ∼7°C) compared to the surface ocean (∼1°C increase). This muted surface ocean response is not supported by high resolution stable isotope records at this locality that suggest a 4°C increase in surface ocean temperature (Arimoto et al., 2020) or most other global studies using various geochemical proxies which suggest between 3–6°C warming of sea surface temperatures across the MECO (Bohaty and Zachos, 2003; Bohaty et al., 2009; Bijl et al., 2010; Cramwinckel et al., 2018, 2019). Additional sites in the north Atlantic alongside temperature estimates from a greater range of proxies such as Mg/Ca and clumped isotopes are needed to understand the mismatch between this dataset and that of Arimoto et al. (2020) and any site-specific changes in the thermal structure of the water column.
Peak warming in the MECO was followed by globally rapid cooling (Villa et al., 2008; Bohaty et al., 2009; Arimoto et al., 2020) accompanied by increases in cool water taxa (Luciani et al., 2010; Villa et al., 2013), reduced abundances and eventual extinctions of oligotrophic, shallow mixed layer planktonic foraminifera Acarinina and Morozovelloides (Wade, 2004) and calcareous nannofossils discoasters (Villa et al., 2008). In our record, global cooling is represented by an increase in Δδ18O Globigerinatheka–Catapsydrax of ∼1.00‰ (Figure 3) re-establishing the pre-MECO planktonic foraminifera depth stratification in δ18O seen at 43.50 Ma by 38.50 Ma, indicating abrupt cooling of the thermocline following the MECO. Surprisingly, despite such rapid cooling, Catapsydrax takes ∼2 Myrs to reappear below Subbotina in the water column (Figure 2A), possibly not returning to its position below Subbotina in δ18O space until thermocline conditions became more stable at 38.50 Ma (Figure 2A). Globigerinatheka shows a slight increase of 0.15‰ in δ18O values post-MECO, returning to pre-MECO values (Figure 2A) indicating only minor cooling of the surface ocean.
Inferred trophic state changes are highly site specific (Witkowski et al., 2012, 2014; Moebius et al., 2015; Cramwinckel et al., 2019). Our study shows that, in tandem with the increased δ18O depth stratification between 43.50 and 41.31 Ma [described in section “Water column thermal structure changes across the middle Eocene (δ18O)”], the δ13C stratification also increased over the same pre-MECO period by 0.48‰ (Δδ13C Globigerinatheka–Catapsydrax). This increasing separation between genera is interrupted by a transient reduction in Δδ13C Globigerinatheka–Catapsydrax to 1.00‰ and Δδ13C Globigerinatheka–Subbotina to 0.81‰ at 40.15 Ma. These Δδ13C values during the peak of the MECO represent the lowest δ13C gradients between the surface and deep-water dwellers recorded in our samples (Figure 3B). The decreasing gradient is a result of increasing Subbotina and Catapsydrax δ13C values, coupled with a slight decline in Globigerinatheka of ∼0.14‰ (Figure 2B) suggesting a possible decrease in water column primary productivity at Sites U1408 and U1410.
The interpreted reduction in primary productivity from our record during the peak of the MECO event at 40.15 Ma is supported by another study at the same locality (Arimoto et al., 2020) that observed weakened depth stratification between planktic foraminifera and interpreted a large reduction in planktonic foraminifera accumulation rates as an indicator of primary productivity reduction (Arimoto et al., 2020). In addition, decreased productivity during the MECO has been observed in the Southeast Atlantic (Galazzo et al., 2014). Open ocean mid latitude south Atlantic (Galazzo et al., 2014) and north Atlantic (Arimoto et al., 2020) locations are therefore recording a different trophic signal than observed at other sites across the MECO where primary productivity increases have been proposed based on benthic foraminifera accumulation rates and assemblage structure (Boscolo Galazzo et al., 2013; Moebius et al., 2015), increased deposition of organic rich layers in the Tethys ocean (Luciani et al., 2010; Spofforth et al., 2010), increased diatom flux in the Southern Ocean (Witkowski et al., 2012) and North Atlantic Ocean (Witkowski et al., 2014), as well as shifts in planktonic foraminifera communities toward more eutrophic, opportunists (Luciani et al., 2010). At continental margin sites, these changes are attributed to increased weathering and terrestrial input as a result of global warming across the MECO (Moebius et al., 2015). The open ocean setting of our study sites (Sites U1408 and U1410) mean a similar terrestrial input of nutrients is not plausible, which potentially explains the decreased δ13C gradient and inferred productivity decrease we observe. Further studies combining micropalaeontological methods and geochemistry are needed in the North Atlantic to understand whether our results represent a local or regional signal. The described thermal and trophic state fluctuations above show the importance of including environmental change in functional trait-based studies. Whilst our study period and data reflect the globally observed rapid changes of the MECO, we also capture global background cooling (Figure 2). While background climatic changes are not often the focus of paleoecological studies, our low-resolution record shows how major changes to water column structure occur before and after large climatic fluctuations. These changes will have an impact on ecosystems and, as we have shown, on traits in planktonic foraminifera.
This study demonstrates that measurable morphological and ecological traits can be used to infer responses to abiotic forcing in paleoceanographically dynamic environments. However, inferring the functionality of measurable morphological traits is much harder for extinct than for extant species. Further, assigning functions to traits in deep time is often based on observations of extant taxa and the assumption that the observed functional relationship has not changed. Several studies indicate that this approach may be too simplistic (Wade et al., 2008; Eronen et al., 2010; Edgar et al., 2013). Presence of algal photosymbionts has been shown to be functional (Bé et al., 1977, 1981, 1982) in some modern planktonic foraminifera species (obligate symbiosis) (Takagi et al., 2019), with the only way of determining obligate symbiosis through direct observation. Other functional traits such as spines are not readily preserved in situ and require SEM images to identify. However, more complex morphological traits that are more tightly related to biogeochemical function (such as pore density) can now be easily measured through technological advances (Bé, 1968; Constandache et al., 2013; Burke et al., 2018). While gross morphology has been hypothesized to control buoyancy (Caromel et al., 2014), mathematical models suggest any potential relationship is weak at best (Caromel et al., 2017) and such features are variable even within a constant laboratory environment (Davis et al., 2020). One clear conclusion from these studies and our results is that simple measures of gross test morphology are not primary controls on organismal function, and that interdisciplinary developments offer promising avenues to extract more biogeochemically relevant signals.
Implying functionality of foraminifera traits is further complicated by foraminifera trait diversity, analytical protocols and trait plasticity. The genus based approach used in this study likely expands the range of morphological or geochemical values compared to species level analyses. Genera have long been argued to represent biological reality (Mayr, 1942) and analysis at the generic level has advantages and disadvantages (Hendricks et al., 2014). Despite their highly resolved, species-level record, a genera based approach is appropriate for planktonic foraminifera as phenotypic and ecological traits are shared across species and genera resulting in morphogroup and ecogroup classifications (Aze et al., 2011).
Despite increasing morphological and geochemical niche breadth by measuring genera rather than species, and measuring almost 8 times as many individuals for morphological as geochemical analysis, we do not detect a morphological response in terms of either test size or shape to either the long-term Eocene cooling trend or the transient MECO. In addition, our analysis found no detectable relationship between size and δ13C in Subbotina as expected for an asymbiotic foraminifera. Note though that we obtained statistical significance between specimen weight and δ13C (Supplementary Table 22), re-emphasizing the importance of measuring the most relevant trait rather than the easiest to measure. This implies that either size is not a functional trait (assuming a δ13C-size correlation infers functionality) or plasticity of Subbotina traits is sufficient to mask any functional relationship.
In contrast, to the lack of δ13C-size relationship in adult Subbotina, species hosting dinoflagellate algal photosymbionts do have a positive test size-δ13C relationship implying functionality (Berger et al., 1978; Oppo and Fairbanks, 1989; Spero et al., 1991; Elderfield et al., 2002; Friedrich et al., 2012; Edgar et al., 2017). The δ13C-size relationship in symbiont bearers is a results of algal preferential uptake of isotopically light carbon. If a correlation implies functionality, size is functional in at least symbiont bearing planktonic foraminifera. To understand this relationship further we propose the need for investigations at the individual level outside of analytical size constraints in symbiotic genera and additional research on whether this relationship extends to asymbiotic genera at the individual level.
Individual analysis will also further our ability to constrain the degree of plasticity in planktonic foraminifera traits and therefore better infer their functionality. The discussions in section “Trophic state changes across the Middle Eocene Climatic Optimum (δ13C)” focus on linking δ13C changes in planktonic foraminifera to trophic changes in the water column. This one-dimensional view of δ13C assumes that the depth ecology of planktonic foraminifera does not change and therefore paleohydrological changes drive stable isotope variations. Yet, studies based on extant foraminifera indicate that depth habitat can vary as a result of season, biogeography and environment (e.g., Jonkers and Kučera, 2017; Kretschmer et al., 2018; Taylor et al., 2018; Chernihovsky et al., 2020) as well as changes in life strategy (Darling et al., 2009). Additionally, studies of foraminifera species and across evolutionary lineages have shown changing depth habitats through evolutionary history (Norris et al., 1993; Coxall et al., 2000; Stewart et al., 2012). The increase in δ13C values in Subbotina and Catapsydrax (Δδ13C: 0.57–0.59‰, respectively) across the MECO compared to pre-MECO (Figure 2B), reducing the overall surface-deep δ13C depth gradient, suggests these genera could have migrated up in the water column during the MECO supporting an ecological scenario (Figure 6).
An adaptable depth ecology and generalist life strategy has been suggested to explain batch Subbotina variation in δ18O and δ13C at several points through the Eocene (Macleod et al., 1990; Bralower et al., 1995; Wade, 2004; Dutton et al., 2005; Wade and Pearson, 2008; Stap et al., 2010; Arimoto et al., 2020). In other studies these changes are most often associated with cooling of surface waters and/or increases in productivity (Macleod et al., 1990). However, with no symbionts and a preference for cooler thermocline waters it is hard to envisage this genus moving to a warmer (= shallower) part of the water column.
Utilizing single specimen analysis, we can explore this conundrum further. Depth habitat hypotheses of Subbotina through the Eocene have previously been based on multi-specimen (batch) isotope analyses hiding any interindividual variation (Macleod et al., 1990; Bralower et al., 1995; Wade, 2004; Dutton et al., 2005; Wade and Pearson, 2008; Stap et al., 2010; Arimoto et al., 2020). Assuming that our new individual isotopic measurements reflect a genuine isotopic signature of Subbotina, the wide range of individual isotopic values (Figures 2, 4) with some individuals plotting in the same space as both Globigerinatheka (mixed layer) and Catapsydrax (subthermocline) suggests that Subbotina had a large ecological niche extending from the surface ocean to the subthermocline during the middle Eocene (Figure 2). It is this wide ecological niche that may have aided species’ resilience through the MECO, multiple early Paleogene hyperthermal events and long-term Eocene cooling. More stable isotope studies of Subbotina at the individual level are needed to understand how the width of the Subbotina ecological niche changed through time and space during the Eocene and through to their demise in the Oligocene.
In this study, we have demonstrated that planktonic foraminifera are an ideal study organism for trait-based studies and can be integrated with paleoceanographic changes to investigate functional trait changes through climatic perturbations. Using an integrated approach with individual based analyses, we have demonstrated profound changes to ecosystems undergoing a transient global warming event. We did, however, detect no evidence that the measured morphological traits, and their relationship to stable isotopes, imply altered functionality across our time period. Further research is needed to reconcile the true meaning of which traits are functional for planktonic foraminifera in deep time, and how we can detect functional relationships statistically in “go-to” morphological traits such as size. We suggest that to truly investigate functionality in planktonic foraminifera we need to be measuring outside of size fractions, using the whole spectrum of genera diversity that planktonic foraminifera offer and leveraging developments in imaging techniques.
The original contributions presented in the study are included in the article/Supplementary Material, further inquiries can be directed to the corresponding author/s.
LK, TE, and SN conceived the study. LK analyzed the data, took the lead on writing the manuscript, and collected the data with help from SB and KE. All authors commented on subsequent drafts and approved submission.
This work was supported by the Natural Environment Research Council awards NE/L002531/1 and NE/P019269/1, as well as the University of Southampton’s Institute of Life Sciences (IfLS).
The authors declare that the research was conducted in the absence of any commercial or financial relationships that could be construed as a potential conflict of interest.
This research used samples provided by the International Ocean Discovery Program (IODP). We would like to thank Bastian Hambach and Megan Wilding at SEAPORT laboratories, University of Southampton located at the National Oceanography Centre in Southampton, United Kingdom for assistance in analyzing samples. We would like to thank Anieke Brombacher for taxonomic guidance during initial sample picking. We would also like to thank Max Holmström for taxonomic and analytical guidance as well as helpful discussions.
The Supplementary Material for this article can be found online at: https://www.frontiersin.org/articles/10.3389/fevo.2021.679722/full#supplementary-material
Akçakaya, H. R., Rodrigues, A. S. L., Keith, D. A., Milner-Gulland, E. J., Sanderson, E. W., Hedges, S., et al. (2020). Assessing ecological function in the context of species recovery. Conser. Biol. 34, 561–571. doi: 10.1111/cobi.13425
Al-Sabouni, N., Kucera, M., and Schmidt, D. N. (2007). Vertical niche separation control of diversity and size disparity in planktonic foraminifera. Mar. Micropaleontol. 63, 75–90. doi: 10.1016/j.marmicro.2006.11.002
Antczak-Orlewska, O., Płóciennik, M., Sobczyk, R., Okupny, D., Stachowicz-Rybka, R., Rzodkiewicz, M., et al. (2021). Chironomidae morphological types and functional feeding groups as a habitat complexity vestige. Front. Ecol. Evol. 8:583831. doi: 10.3389/fevo.2020.583831
Arimoto, J., Nishi, H., Kuroyanagi, A., Takashima, R., Matsui, H., and Ikehara, M. (2020). Changes in upper ocean hydrography and productivity across the : middle eocene climatic optimum: local insights and global implications from the Northwest Atlantic. Glob. Planet. Chang. 193:103258. doi: 10.1016/j.gloplacha.2020.103258
Aze, T., Ezard, T. H. G. G., Purvis, A., Coxall, H. K., Stewart, R. M., Wade, B. S., et al. (2011). A phylogeny of cenozoic macroperforate planktonic foraminifera from fossil data. Biol. Rev. 86, 900–927. doi: 10.1111/j.1469-185X.2011.00178.x
Bar-On, Y. M., Phillips, R., and Milo, R. (2018). The biomass distribution on Earth. Proc. Natl. Acad. Sci. U.S.A. 115, 6506–6511. doi: 10.1073/pnas.1711842115
Baumfalk, Y. A., Troelstra, S. R., Ganssen, G., and Van Zanen, M. J. L. (1987). Phenotypic variation of Globorotalia scitula (foraminiferida) as a response to Pleistocene climatic fluctuations. Mar. Geol. 75, 231–240. doi: 10.1016/0025-3227(87)90106-X
Bé, A. W. H. (1968). Shell porosity of recent planktonic foraminifera as a climatic index. Science 161, 881–884. doi: 10.1126/science.161.3844.881
Bé, A. W. H., Caron, D. A., and Anderson, O. R. (1981). Effects of feeding frequency on life processes of the planktonic foraminifer globigerinoides sacculifer in laboratory culture. J. Mar. Biol. Assoc. U.K. 61, 257–277. doi: 10.1017/S002531540004604X
Bé, A. W. H., Hemleben, C., Anderson, O. R., Spindler, M., Hacunda, J., and Tuntivate-Choy, S. (1977). Laboratory and field observations of living planktonic foraminifera. Micropaleontology 23, 155–179. doi: 10.2307/1485330
Bé, A. W. H., Spero, H. J., and Anderson, O. R. (1982). Effects of symbiont elimination and reinfection on the life processes of the planktonic foraminifer Globigerinoides sacculifer. Mar. Biol. 70, 73–86. doi: 10.1007/bf00397298
Bemis, B. E., Spero, H. J., and Bijma, J. (1998). Reevaluation of the oxygen isotopic composition of planktonic foraminifera. Paleoceanography 13, 150–160.
Berger, W. H., Killingley, J. S., and Vincent, E. (1978). Stable isotopes in deep-sea carbonates: box core EDRC-92, west equatorial pacific. Oceanol. Acta l, 203–216.
Bijl, P. K., Houben, A. J. P., Schouten, S., Bohaty, S. M., Sluijs, A., Reichart, G.-J., et al. (2010). Transient middle eocene atmospheric CO2 and temperature variations. Science 330, 819–821. doi: 10.1126/science.1193654
Bijma, J., Faber, W. W., and Hemleben, C. (1990). Temperature and salinity limits for growth and survival of some planktonic foraminifers in laboratory cultures. J. Foraminifer. Res. 20, 95–116. doi: 10.2113/gsjfr.20.2.95
Birch, H., Coxall, H. K., Pearson, P. N., Kroon, D., and O’Regan, M. (2013). Planktonic foraminifera stable isotopes and water column structure: disentangling ecological signals. Mar. Micropaleontol. 101, 127–145. doi: 10.1016/j.marmicro.2013.02.002
Birks, H. J. B. (2020). Reflections on the use of ecological attributes and traits in quaternary botany. Front. Ecol. Evol. 8:166. doi: 10.3389/fevo.2020.00166
Bohaty, S. M., and Zachos, J. C. (2003). Significant southern ocean warming event in the late middle eocene. Geology 31, 1017–1020. doi: 10.1130/G19800.1
Bohaty, S. M., Zachos, J. C., Florindo, F., and Delaney, M. L. (2009). Coupled greenhouse warming and deep-sea acidification in the middle Eocene. Paleoceanography 24:PA2207. doi: 10.1029/2008PA001676
Boscolo Galazzo, F., Giusberti, L., Luciani, V., and Thomas, E. (2013). Paleoenvironmental changes during the Middle Eocene Climatic Optimum (MECO) and its aftermath: the benthic foraminiferal record from the Alano section (NE Italy). Palaeogeogr. Palaeoclimatol. 378, 22–35. doi: 10.1016/j.palaeo.2013.03.018
Boyle, P. R., Romans, B. W., Tucholke, B. E., Norris, R. D., Swift, S. A., Sexton, P. F., et al. (2017). Cenozoic North Atlantic deep circulation history recorded in contourite drifts, offshore Newfoundland, Canada. Mar. Geol. 385, 185–203. doi: 10.1016/j.margeo.2016.12.014
Bralower, T. J., Zachos, J. C., Thomas, E., Parrow, M., Paull, C. K., Kelly, D. C., et al. (1995). Late paleocene to eocene paleoceanography of the equatorial pacific ocean: stable isotopes recorded at ocean drilling program Site 865, allison guyot. Paleoceanography 10, 841–865. doi: 10.1029/95PA01143
Bregman, T. P., Sekercioglu, C. H., and Tobias, J. A. (2014). Global patterns and predictors of bird species responses to forest fragmentation: implications for ecosystem function and conservation. Biol. Conserv. 169, 372–383. doi: 10.1016/j.biocon.2013.11.024
Brombacher, A., Wilson, P. A., Bailey, I., and Ezard, T. H. G. (2017). The breakdown of static and evolutionary allometries during climatic upheaval. Am. Nat. 190, 350–362. doi: 10.1086/692570
Brousseau, P.-M., Gravel, D., and Handa, I. T. (2018). On the development of a predictive functional trait approach for studying terrestrial arthropods. J. Anim. Ecol. 87, 1209–1220. doi: 10.1111/1365-2656.12834
Burke, J. E., and Hull, P. M. (2017). Effect of gross morphology on modern planktonic foraminiferal test strength under compression. J. Micropalaeontol. 2:jmaleo2016–jmaleo2017. doi: 10.1144/jmpaleo2016-007
Burke, J. E., Renema, W., Henehan, M. J., Elder, L. E., Davis, C. V., Maas, A. E., et al. (2018). Factors influencing test porosity in planktonic foraminifera. Biogeosciences 15, 6607–6619. doi: 10.5194/bg-15-6607-2018
Cappelli, C., Bown, P. R., Westerhold, T., Bohaty, S. M., Riu, M., de Lobba, V., et al. (2019). The early to middle eocene transition: an integrated calcareous nannofossil and stable isotope record from the Northwest Atlantic Ocean (Integrated Ocean Drilling Program Site U1410). Paleoceanogr. Paleoclimatol. 34, 1913–1930. doi: 10.1029/2019PA003686
Cardinale, B. J., Duffy, J. E., Gonzalez, A., Hooper, D. U., Perrings, C., Venail, P., et al. (2012). Biodiversity loss and its impact on humanity. Nature 489, 326–326. doi: 10.1038/nature11373
Caromel, A. G. M., Schmidt, D. N., and Rayfield, E. J. (2017). Ontogenetic constraints on foraminiferal test construction. Evol. Dev. 19, 157–168. doi: 10.1111/ede.12224
Caromel, A. G. M., Schmidt, D. N., Phillips, J. C., Rayfield, E. J., and Ray, E. J. (2014). Hydrodynamic constraints on the evolution and ecology of planktic foraminifera. Mar. Micropaleontol. 106, 69–78. doi: 10.1016/j.marmicro.2014.01.002
Chernihovsky, N., Almogi-Labin, A., Kienast, S. S., and Torfstein, A. (2020). The daily resolved temperature dependence and structure of planktonic foraminifera blooms. Sci. Rep. 10:17456. doi: 10.1038/s41598-020-74342-z
Constandache, M., Yerly, F., and Spezzaferri, S. (2013). Internal pore measurements on macroperforate planktonic Foraminifera as an alternative morphometric approach. Swiss J. Geosci. 106, 179–186. doi: 10.1007/s00015-013-0134-8
Coxall, H. K., Pearson, P. N., Shackleton, N. J., Hall, M. A., Shackleton, N. J., Hall, M. A., et al. (2000). Hantkeninid depth adaptation: an evolving life strategy in a changing ocean. Geology 28, 87–90. doi: 10.1130/0091-7613200028<87:HDAAEL<2.0.CO
Coxall, H. K., Wilson, P. A., Pälike, H., Lear, C. H., Backman, J., and Arrhenius, A. (2005). Rapid stepwise onset of Antarctic glaciation and deeper calcite compensation in the Pacific Ocean. Nature 433, 53–57. doi: 10.1038/nature03135
Coxall, H. K., Wilson, P. A., Pearson, P. N., and Sexton, P. F. (2007). Iterative evolution of digitate planktonic foraminifera. Paleobiology 33, 495–516. doi: 10.2307/4500169
Cramer, B. S., Toggweiler, J. R., Wright, J. D., Katz, M. E., and Miller, K. G. (2009). Ocean overturning since the late cretaceous: inferences from a new benthic foraminiferal isotope compilation. Paleoceanography 24:A4216. doi: 10.1029/2008PA001683
Cramwinckel, M. J., Huber, M., Kocken, I. J., Agnini, C., Bijl, P. K., Bohaty, S. M., et al. (2018). Synchronous tropical and polar temperature evolution in the Eocene. Nature 559, 382–386. doi: 10.1038/s41586-018-0272-2
Cramwinckel, M. J., Ploeg, R., van der Bijl, P. K., Peterse, F., Bohaty, S. M., Röhl, U., et al. (2019). Harmful algae and export production collapse in the equatorial Atlantic during the zenith of middle eocene climatic optimum warmth. Geology 47, 247–250. doi: 10.1130/G45614.1
Darling, K. F., Thomas, E., Kasemann, S. A., Seears, H. A., Smart, C. W., and Wade, C. M. (2009). Surviving mass extinction by bridging the benthic/planktic divide. Proc. Natl. Acad. Sci. U.S.A. 106, 12629–12633. doi: 10.1073/pnas.0902827106
Davis, C. V., Livsey, C. M., Palmer, H. M., Hull, P. M., Thomas, E., Hill, T. M., et al. (2020). Extensive morphological variability in asexually produced planktic foraminifera. Sci. Adv. 6:eabb8930. doi: 10.1126/sciadv.abb8930
Di Martino, E., and Liow, L. H. (2021). Trait–fitness associations do not predict within-species phenotypic evolution over 2 million years. Proc. R. Soc. B Biol. Sci. 288:20202047. doi: 10.1098/rspb.2020.2047
Dutton, A., Lohmann, K. C., and Leckie, R. M. (2005). Insights from the paleogene tropical Pacific: foraminiferal stable isotope and elemental results from Site 1209, Shatsky Rise. Paleoceanography 20:A3004. doi: 10.1029/2004PA001098
Edgar, K. M., Bohaty, S. M., Coxall, H. K., Bown, P. R., Batenburg, S. J., Lear, C. H., et al. (2020). New composite bio- and isotope stratigraphies spanning the middle eocene climatic optimum at tropical ODP Site 865 in the pacific ocean. J. Micropalaeontol. 39, 117–138. doi: 10.5194/jm-39-117-2020
Edgar, K. M., Bohaty, S. M., Gibbs, S. J., Sexton, P. F., Norris, R. D., and Wilson, P. A. (2013). Symbiont “bleaching” in planktic foraminifera during the middle eocene climatic optimum. Geology 41, 15–18. doi: 10.1130/G33388.1
Edgar, K. M., Hull, P. M., and Ezard, T. H. G. G. (2017). Evolutionary history biases inferences of ecology and environment from δ13C but not δ18O values. Nat. Commun. 8, 1106–1106. doi: 10.1038/s41467-017-01154-7
Edgar, K. M., Wilson, P. A., Sexton, P. F., and Suganuma, Y. (2007). No extreme bipolar glaciation during the main Eocene calcite compensation shift. Nature 448, 908–911. doi: 10.1038/nature06053
Eggins, S. M., De Deckker, P., and Marshall, J. (2003). Mg/Ca variation in planktonic foraminifera tests: implications for reconstructing palaeo-seawater temperature and habitat migration. Earth Planet. Sci. Lett. 212, 291–306. doi: 10.1016/S0012-821X(03)00283-8
Eggins, S. M., Sadekov, A., and De Deckker, P. (2004). Modulation and daily banding of Mg/Ca in Orbulina universa tests by symbiont photosynthesis and respiration: a complication for seawater thermometry? Earth Planet. Sci. Lett. 225, 411–419. doi: 10.1016/j.epsl.2004.06.019
Elderfield, H., Vautravers, M., and Cooper, M. (2002). The relationship between shell size and Mg/Ca, Sr/Ca, D 18 O, and D 13 C of species of planktonic foraminifera. Geochem. Geophys. Geosyst. 3, 1–13. doi: 10.1029/2001GC000194
Enquist, B. J., Condit, R., Peet, R. K., Schildhauer, M., and Thiers, B. M. (2016). Cyberinfrastructure for an integrated botanical information network to investigate the ecological impacts of global climate change on plant biodiversity. PeerJ. Preprints 4:e2615v2. doi: 10.7287/peerj.preprints.2615v2
Epstein, S., and Lowenstam, H. A. (1954). Temperature-shell-growth relations of recent and interglacial pleistocene shoal-water biota from bermuda. J. Geol. 61, 424–438. doi: 10.1086/626110
Epstein, S., Buchsbaum, R., Lowenstam, H. A., and Urey, H. C. (1953). Revised carbonate-water isotopic temperature scale. GSA Bull. 64, 1315–1326.
Erez, J. (1978). Vital effect on stable-isotope composition seen in foraminifera and coral skeletons. Nature 273, 199–202. doi: 10.1038/273199a0
Eronen, J. T., Polly, P. D., Fred, M., Damuth, J., Frank, D. C., Mosbrugger, V., et al. (2010). Ecometrics: the traits that bind the past and present together. Integr. Zool. 5, 88–101. doi: 10.1111/j.1749-4877.2010.00192.x
Ezard, T. H. G., Aze, T., Pearson, P. N., and Purvis, A. (2011). Interplay between changing climate and species’ ecology drives macroevolutionary dynamics. Science 332, 349–351. doi: 10.1126/science.1203060
Fairbanks, R. G., Sverdlove, M., Free, R., Wiebe, P. H., and Bé, A. W. H. (1982). Vertical distribution and isotopic fractionation of living planktonic foraminifera from the Panama Basin. Nature 298, 841–844. doi: 10.1038/298841a0
Fairbanks, R. G., Wiebe, P. H., and Bé, A. W. H. (1980). Vertical distribution and isotopic composition of living planktonic foraminifera in the Western North Atlantic. Science 207, 61–63. doi: 10.1126/science.207.4426.61
Farnsworth, K. D., Albantakis, L., and Caruso, T. (2017). Unifying concepts of biological function from molecules to ecosystems. Oikos 126, 1367–1376. doi: 10.1111/oik.04171
Fehrenbacher, J. S., Russell, A. D., Davis, C. V., Spero, H. J., Chu, E., and Hönisch, B. (2018). Ba/Ca ratios in the non-spinose planktic foraminifer Neogloboquadrina dutertrei: evidence for an organic aggregate microhabitat. Geochim. Cosmochim. Acta 236, 361–372. doi: 10.1016/j.gca.2018.03.008
Fraass, A. J., Kelly, D. C., and Peters, S. E. (2015). Macroevolutionary history of the planktic foraminifera. Annu. Rev. Earth Planet. Sci. 43, 139–166. doi: 10.1146/annurev-earth-060614-105059
Fried, G., Carboni, M., Mahaut, L., and Violle, C. (2019). Functional traits modulate plant community responses to alien plant invasion. Perspect. Plant Ecol. Evol. Syst. 37, 53–63. doi: 10.1016/j.ppees.2019.02.003
Friedrich, O., Schiebel, R., Wilson, P. A., Weldeab, S., Beer, C. J., Cooper, M. J., et al. (2012). Influence of test size, water depth, and ecology on Mg/Ca, Sr/Ca, δ 18O and δ 13C in nine modern species of planktic foraminifers. Earth Planet. Sci. Lett. 319–320, 133–145. doi: 10.1016/j.epsl.2011.12.002
Galazzo, F. B., Thomas, E., Pagani, M., Warren, C., Luciani, V., and Giusberti, L. (2014). The middle eocene climatic optimum (MECO): a multiproxy record of paleoceanographic changes in the southeast Atlantic (ODP Site 1263, Walvis Ridge). Paleoceanography 29, 1143–1161. doi: 10.1002/2014PA002670.Received
Glaubke, R. H., Thirumalai, K., Schmidt, M. W., and Hertzberg, J. E. (2021). Discerning changes in high-frequency climate variability using geochemical populations of individual foraminifera. Paleoceanogr. Paleoclimatol. 36:e2020A004065. doi: 10.1029/2020PA004065
Gradstein, F. M., Ogg, J. G., Schmitz, M. D., and Ogg, G. M. (2012). The Geologic Time Scale 2012. Amsterdam: Elsevier.
Grenié, M., Mouillot, D., Villéger, S., Denelle, P., Tucker, C. M., Munoz, F., et al. (2018). Functional rarity of coral reef fishes at the global scale: hotspots and challenges for conservation. Biol. Conserv. 226, 288–299. doi: 10.1016/j.biocon.2018.08.011
Groeneveld, J., Ho, S. L., and Mohtadi, M. (2019). Deciphering the variability in Mg / Ca and stable oxygen isotopes of individual foraminifera. Paleoceanogr. Paleoclimatol. 34, 755–773. doi: 10.1029/2018PA003533
Hemleben, C., Mühlen, D., Olsson, R. K., Berggren, W. A., Der Autoren, A., Hemleben, C., et al. (1991). Surface texture and the first occurrence of spines in planktonic foraminifera from the early tertiary. Geol. Jahrb. A 128, 117–146.
Hendricks, J. R., Saupe, E. E., Myers, C. E., Hermsen, E. J., and Allmon, W. D. (2014). The generification of the fossil record. Paleobiology 40, 511–528. doi: 10.1666/13076
Henehan, M. J., Edgar, K. M., Foster, G. L., Penman, D. E., Hull, P. M., Greenop, R., et al. (2020). Revisiting the middle eocene climatic optimum “carbon cycle conundrum” with new estimates of atmospheric pCO2 from boron isotopes. Paleoceanogr. Paleoclimatol. 35:e2019A003713. doi: 10.1029/2019PA003713
Henehan, M. J., Evans, D., Shankle, M., Burke, J. E., Foster, G. L., Anagnostou, E., et al. (2017). Size-dependent response of foraminiferal calcification to seawater carbonate chemistry. Biogeosciences 14, 3287–3308. doi: 10.5194/bg-14-3287-2017
Holland, K., Branson, O., Haynes, L. L., Hönisch, B., Allen, K. A., Russell, A. D., et al. (2020). Constraining multiple controls on planktic foraminifera Mg/Ca. Geochim. Cosmochim. Acta. 273, 116–136. doi: 10.1016/j.gca.2020.01.015
Huber, B. T., Bijma, J., and Darling, K. (1997). Cryptic speciation in the living planktonic foraminifer Globigerinella siphonifera (d’Orbigny). Paleobiology 23, 33–62. doi: 10.2307/2401156
Hutchinson, D. K., Coxall, H. K., Lunt, D. J., Steinthorsdottir, M., de Boer, A. M., Baatsen, M., et al. (2021). The eocene–oligocene transition: a review of marine and terrestrial proxy data, models and model–data comparisons. Clim. Past 17, 269–315. doi: 10.5194/cp-17-269-2021
Jax, K. (2005). Function and “functioning” in ecology: what does it mean? Oikos 111, 641–648. doi: 10.1111/j.1600-0706.2005.13851.x
Jonkers, L., and Kučera, M. (2017). Quantifying the effect of seasonal and vertical habitat tracking on planktonic foraminifera proxies. Clim. Past 13, 573–586. doi: 10.5194/cp-13-573-2017
Kattge, J., Bönisch, G., Díaz, S., Lavorel, S., Prentice, I. C., Leadley, P., et al. (2020). TRY plant trait database – enhanced coverage and open access. Glob. Chang. Biol. 26, 119–188. doi: 10.1111/gcb.14904
Kleyer, M., Bekker, R. M., Knevel, I. C., Bakker, J. P., Thompson, K., Sonnenschein, M., et al. (2008). The LEDA traitbase: a database of life-history traits of the Northwest European flora. J. Ecol. 96, 1266–1274. doi: 10.1111/j.1365-2745.2008.01430.x
Kretschmer, K., Jonkers, L., Kucera, M., and Schulz, M. (2018). Modeling seasonal and vertical habitats of planktonic foraminifera on a global scale. Biogeosciences 15, 4405–4429. doi: 10.5194/bg-15-4405-2018
Kucera, M. (2007). “Chapter six: planktonic foraminifera as tracers of past oceanic envrionments,” in Proxies in Late Cenozoic Paleoceanography, eds C. Hillaire-Marcel and A. de Vernal (Amsterdam: Elsevier), 213–262.
Kucera, M., Silye, L., Weiner, A. K. M., Darling, K., Lübben, B., Holzmann, M., et al. (2017). Caught in the act: anatomy of an ongoing benthic–planktonic transition in a marine protist. J. Plankton Res. 39, 436–449. doi: 10.1093/plankt/fbx018
Lacourse, T. (2009). Environmental change controls postglacial forest dynamics through interspecific differences in life-history traits. Ecology 90, 2149–2160. doi: 10.1890/08-1136.1
Larsen, T. H., Williams, N. M., and Kremen, C. (2005). Extinction order and altered community structure rapidly disrupt ecosystem functioning. Ecol. Lett. 8, 538–547. doi: 10.1111/j.1461-0248.2005.00749.x
Lavorel, S., and Garnier, E. (2002). Predicting changes in community composition and ecosystem functioning from plant traits: revisiting the holy grail. Funct. Ecol. 16, 545–556. doi: 10.1046/j.1365-2435.2002.00664.x
Luciani, V., Giusberti, L., Agnini, C., Fornaciari, E., Rio, D., Spofforth, D. J. A., et al. (2010). Ecological and evolutionary response of Tethyan planktonic foraminifera to the middle Eocene climatic optimum (MECO) from the Alano section (NE Italy). Palaeogeogr. Palaeoclimatol. Palaeoecol. 292, 82–95. doi: 10.1016/j.palaeo.2010.03.029
Mace, G. M., Reyers, B., Alkemade, R., Biggs, R., Chapin, F. S., Cornell, S. E., et al. (2014). Approaches to defining a planetary boundary for biodiversity. Glob. Environ. Change 28, 289–297. doi: 10.1016/j.gloenvcha.2014.07.009
Macleod, N., Keller, G., and Kitchell, J. A. (1990). Progenesis in Late eocene populations ofsubbotina linaperta (Foraminifera) from the western Atlantic. Mar. Micropaleontol. 16, 219–240. doi: 10.1016/0377-8398(90)90005-7
Macumber, A. L., Roe, H. M., Prentice, S. V., Sayer, C. D., Bennion, H., and Salgado, J. (2020). Freshwater testate amoebae (Arcellinida) response to eutrophication as revealed by test size and shape indices. Front. Ecol. Evol. 8:568904. doi: 10.3389/fevo.2020.568904
McGill, B. J., Enquist, B. J., Weiher, E., and Westoby, M. (2006). Rebuilding community ecology from functional traits. Trends Ecol. Evol. 21, 178–185. doi: 10.1016/j.tree.2006.02.002
McGuire, J. L., and Lauer, D. A. (2020). Linking patterns of intraspecific morphology to changing climates. J. Biogeogr. 47, 2417–2425. doi: 10.1111/jbi.13954
Moebius, I., Friedrich, O., Edgar, K. M., and Sexton, P. F. (2015). Episodes of intensified biological productivity in the subtropical Atlantic Ocean during the termination of the Middle Eocene Climatic Optimum (MECO). Paleoceanography 30, 1041–1058. doi: 10.1002/2014PA002673
Norris, R. D., Corfield, R. M., and Cartlidge, J. E. (1993). Evolution of depth ecology in the planktic foraminifera lineage Globorotalia (Fohsella). Geology 21, 975–978. doi: 10.1130/0091-76131993021<0975:eodeit<2.3.co;2
Norris, R. D., Wilson, P. A., Blum, P., Fehr, A., Agnini, C., Bornemann, A., et al. (2014). “Paleogene Newfoundland sediment drifts and MDHDS test,” in Proceedings of the Integrated Ocean Drilling Program. College Station, TX, 342.
Oksanen, O., Žliobaitë, I., Saarinen, J., Lawing, A. M., and Fortelius, M. (2019). A Humboldtian approach to life and climate of the geological past: estimating palaeotemperature from dental traits of mammalian communities. J. Biogeogr. 46, 1760–1776. doi: 10.1111/jbi.13586
Oppo, D. W., and Fairbanks, R. G. (1989). Carbon isotope composition of tropical surface water during the past 22,000 years. Paleoceanography 4, 333–351. doi: 10.1029/PA004i004p00333
Parr, C. S., Guralnick, R., Cellinese, N., and Page, R. D. M. (2012). Evolutionary informatics: unifying knowledge about the diversity of life. Trends Ecol. Evol. 27, 94–103.
Payne, J. L., Jost, A. B., Wang, S. C., and Skotheim, J. M. (2012). A shift in the long-term mode of foraminferan size evolution caused by the end-Permian mass extinction. Evolution 67, 816–827. doi: 10.5061/dryad.5pr86
Pearson, P. N. (1998). Stable isotopes and the study of evolution in planktonic foraminifera. Paleontol. Soc. Pap. 4, 138–178. doi: 10.1017/S1089332600000425
Pearson, P. N. (2012). Oxygen isotopes in foraminifera: overview and historical review. Paleontol. Soc. Pap. 18, 1–38. doi: 10.1017/s1089332600002539
Pearson, P. N., Ditch, P. W., Singano, J., Harcourt-brown, K. G., Nicholas, C. J., Olsson, R. K., et al. (2001). Warm tropical sea surface temperatures in the late cretaceous and eocene epochs. Nature 413, 481–488.
Pearson, P. N., Olsson, R. K., Huber, B. T., Hemleben, C., and Berggren, W. A. (2006). Atlas of Eocene Planktonic Foraminifera.
Pimiento, C., Griffin, J. N., Clements, C. F., Silvestro, D., Varela, S., Uhen, M. D., et al. (2017). The pliocene marine megafauna extinction and its impact on functional diversity. Nat. Ecol. Evol. 1, 1100–1106. doi: 10.1038/s41559-017-0223-6
R Core Team (2020). R: A Language and Environment for Statistical Computing. Vienna: R Foundation for Statistical Computing.
Rego, B. L., Wang, S. C., Altiner, D., and Payne, J. L. (2012). Within- and among-genus components of size evolution during mass extinction, recovery, and background intervals: a case study of Late Permian through Late Triassic foraminifera. Paleobiology 38, 627–643. doi: 10.1666/11040.1
Renaud, S., and Schmidt, D. N. (2003). Habitat tracking as a response of the planktic foraminifer globorotalia truncatulinoides to environmental fluctuations during the last 140 kyr. Mar. Micropaleontol. 49, 97–122. doi: 10.1016/S0377-8398(03)00031-8
Renaud, S., Michaux, J., Schmidt, D. N., Aguilar, J.-P., Mein, P., and Auffray, J.-C. (2005). Morphological evolution, ecological diversification and climate change in rodents. Proc. R. Soc. B Biol. Sci. 272, 609–617. doi: 10.1098/rspb.2004.2992
Rivero-Cuesta, L., Westerhold, T., Agnini, C., Dallanave, E., Wilkens, R. H., and Alegret, L. (2019). Paleoenvironmental changes at ODP Site 702 (South Atlantic): anatomy of the middle eocene climatic optimum. Paleoceanogr. Paleoclimatol. 34, 2047–2066. doi: 10.1029/2019PA003806
Schmidt, D. N. (2004). Abiotic forcing of plankton evolution in the Cenozoic. Science 303, 207–210. doi: 10.1126/science.1090592
Schmidt, D. N., Lazarus, D., Young, J. R., and Kucera, M. (2006). Biogeography and evolution of body size in marine plankton. Earth Sci. Rev. 78, 239–266. doi: 10.1016/j.earscirev.2006.05.004
Schmidt, D. N., Renaud, S., Bollmann, J., Schiebel, R., and Thierstein, H. R. (2004). Size distribution of Holocene planktic foraminifer assemblages: biogeography, ecology and adaptation. Mar. Micropaleontol. 50, 319–338. doi: 10.1016/S0377-8398(03)00098-7
Schmitt, A., Elliot, M., Thirumalai, K., La, C., Bassinot, F., Petersen, J., et al. (2019). Single foraminifera Mg/Ca analyses of past glacial-interglacial temperatures derived from G. ruber sensu stricto and sensu lato morphotypes. Chem. Geol. 511, 510–520. doi: 10.1016/j.chemgeo.2018.11.007
Scrucca, L., Fop, M., Murphy, T. B., and Raftery, A. E. (2016). mclust 5: clustering, classification and density estimation using Gaussian finite mixture models. R J. 8, 289–317.
Sexton, P. F., Wilson, P. A., and Pearson, P. N. (2006a). Microstructural and geochemical perspectives on planktic foraminiferal preservation: “Glassy” versus “Frosty.”. Geochem. Geophys. Geosyst. 7:Q12P19. doi: 10.1029/2006GC001291
Sexton, P. F., Wilson, P. A., and Pearson, P. N. (2006b). Palaeoecology of late middle eocene planktic foraminifera and evolutionary implications. Mar. Micropaleontol. 60, 1–16. doi: 10.1016/j.marmicro.2006.02.006
Spero, H. J. (1998). Life history and stable isotope geochemistry of planktonic foraminifera. Paleontol. Soc. Pap. 4, 7–36. doi: 10.1017/S1089332600000383
Spero, H. J., and Lea, D. W. (1993). Intraspecific stable isotope variability in the planktic foraminiferaGlobigerinoides sacculifer: results from laboratory experiments. Mar. Micropaleontol. 22, 221–234. doi: 10.1016/0377-8398(93)90045-Y
Spero, H. J., and Williams, D. F. (1989). Opening the carbon isotope “vital effect” black box 1. Seasonal tempratures in the euphotic zone. Paleoceanography 4, 593–601.
Spero, H. J., Bijma, J., Lea, D. W., and Bernis, B. E. (1997). Effect of seawater carbonate concentration on foraminiferal carbon and oxygen isotopes. Nature 390, 497–500. doi: 10.1038/37333
Spero, H. J., Lerche, I., and Williams, D. F. (1991). Opening the carbon isotope “vital effect” black box 2, quantative model for interesting foraminiferal carbon isotope data. Paleoceanogr. Paleoclimatol. 6, 639–655.
Spofforth, D. J. A., Agnini, C., Pälike, H., Rio, D., Fornaciari, E., Giusberti, L., et al. (2010). Organic carbon burial following the middle eocene climatic optimum in the central western Tethys. Paleoceanography 25:A3210. doi: 10.1029/2009PA001738
Stap, L., Lourens, L., Dijk, A., van Schouten, S., and Thomas, E. (2010). Coherent pattern and timing of the carbon isotope excursion and warming during eocene thermal maximum 2 as recorded in planktic and benthic foraminifera. Geochem. Geophys. Geosyst. 11:Q11011. doi: 10.1029/2010GC003097
Stavert, J. R., Liñán-Cembrano, G., Beggs, J. R., Howlett, B. G., Pattemore, D. E., and Bartomeus, I. (2016). Hairiness: the missing link between pollinators and pollination. PeerJ 4:e2779. doi: 10.7717/peerj.2779
Steinthorsdottir, M., Porter, A. S., Holohan, A., Kunzmann, L., Collinson, M., and Mcelwain, J. C. (2016). Fossil plant stomata indicate decreasing atmospheric CO 2 prior to the Eocene – Oligocene boundary. Clim. Past 12, 439–454. doi: 10.5194/cp-12-439-2016
Stewart, J. A., Wilson, P. A., Edgar, K. M., Anand, P., and James, R. H. (2012). Geochemical assessment of the palaeoecology, ontogeny, morphotypic variability and palaeoceanographic utility of “Dentoglobigerina” venezuelana. Mar. Micropaleontol. 84–85, 74–86. doi: 10.1016/j.marmicro.2011.11.003
Takagi, H., Kimoto, K., Fujiki, T., Saito, H., Schmidt, C., Kucera, M., et al. (2019). Characterizing photosymbiosis in modern planktonic foraminifera. Biogeosciences 16, 3377–3396. doi: 10.5194/bg-2019-145.
Taylor, B. J., Rae, J. W. B., Gray, W. R., Darling, K. F., Burke, A., Gersonde, R., et al. (2018). Distribution and ecology of planktic foraminifera in the North Pacific: implications for paleo-reconstructions. Quat. Sci. Rev. 191, 256–274. doi: 10.1016/j.quascirev.2018.05.006
Thirumalai, K., Partin, J. W., Jackson, C. S., and Quinn, T. M. (2013). Statistical constraints on El Niño Southern oscillation reconstructions using individual foraminifera: a sensitivity analysis. Paleoceanography 28, 401–412. doi: 10.1002/palo.20037
Tierney, J. E., Poulsen, C. J., Montañez, I. P., Bhattacharya, T., Feng, R., Ford, H. L., et al. (2020). Past climates inform our future. Science 370:eaay3701. doi: 10.1126/science.aay3701
Trueman, C. N., Chung, M.-T., and Shores, D. (2016). Ecogeochemistry potential in deep time biodiversity illustrated using a modern deep-water case study. Philos. Trans. R Soc. Lond B Biol. Sci. 371:20150223.
Urey, H. C. (1947). The thermodynamic properties of isotopic substances. J. Chem. Soc. 562–581. doi: 10.1039/JR9470000562
Urey, H. C., Lowenstam, H. A., Epstein, S., and McKinney, C. R. (1951). Measurement of paleotemperatures and temperatures and the Southeastern United States. Bull. Geol. Soc. Am. 62, 399–416.
Villa, G., Fioroni, C., Pea, L., Bohaty, S., and Persico, D. (2008). Middle eocene-late oligocene climate variability: calcareous nannofossil response at kerguelen plateau, site 748. Mar. Micropaleontol. 69, 173–192. doi: 10.1016/j.marmicro.2008.07.006
Villa, G., Fioroni, C., Persico, D., Roberts, A., and Florindo, F. (2013). Middle eocene to late oligocene antarctic gla-ciation/deglaciation and southern ocean productivity. Paleoceanography 29, 223–237. doi: 10.1002/2013PA002518
Vincent, E., and Berger, W. H. (1981). “Planktonic foraminifera and their use in paleoceanography,” in The Oceanic Lithosphere:The Sea, Vol. 7, eds C. Emiliani (New York, NY: J Wiley & Sons), 1025–1119.
Violle, C., Navas, M., Vile, D., Kazakou, E., Fortunel, C., Hummel, I., et al. (2007). Let the concept of trait be functional! Oikos 116, 882–892. doi: 10.1111/J.0030-1299.2007.15559.X
Wade, B. (2004). Planktonic foraminiferal biostratigraphy and mechanisms in the extinction of morozovella in the late middle eocene. Mar.Micropaleontol. 51, 23–38. doi: 10.1016/j.marmicro.2003.09.001
Wade, B., Al-Sabouni, N., Hemleben, C., and Kroon, D. (2008). Symbiont bleaching in fossil planktonic foraminifera. Evol. Ecol. 22, 253–265. doi: 10.1007/s10682-007-9176-6
Wade, B., and Pearson, P. N. (2008). Planktonic foraminiferal turnover, diversity fluctuations and geochemical signals across the Eocene / Oligocene boundary in Tanzania. Mar. Micropaleontol. 68, 244–255. doi: 10.1016/j.marmicro.2008.04.002
Wade, B., Pearson, P. N., Berggren, W. A., and P like, H. (2011). Review and revision of Cenozoic tropical planktonic foraminiferal biostratigraphy and calibration to the geomagnetic polarity and astronomical time scale. Earth Sci. Rev. 104, 111–142. doi: 10.1016/j.earscirev.2010.09.003
Weiner, A. K. M., Weinkauf, M., Kurasawa, A., Darling, K. F., and Kucera, M. (2015). Genetic and morphometric evidence for parallel evolution of the Globigerinella calida morphotype. Mar. Micropaleontol. 114, 19–35. doi: 10.1016/j.marmicro.2014.10.003
Weinkauf, M., Bonitz, F. G. W., Martini, R., and Kučera, M. (2019). An extinction event in planktonic foraminifera preceded by stabilizing selection. PLoS One 14:e0223490. doi: 10.1371/journal.pone.0223490
Weinkauf, M., Groeneveld, J., Waniek, J. J., Vennemann, T., and Martini, R. (2020). Stable oxygen isotope composition is biased by shell calcification intensity in planktonic foraminifera. Paleoceanogr. Paleoclimatol. 35:e2020A003941. doi: 10.1029/2020PA003941
Weinkauf, M., Moller, T., Koch, M. C., and Kučera, M. (2014). Disruptive selection and bet-hedging in planktonic foraminifera: shell morphology as predictor of extinctions. Front. Ecol. Evol. 2:64. doi: 10.3389/fevo.2014.00064
Westerhold, T., Marwan, N., Drury, A. J., Liebrand, D., Agnini, C., Anagnostou, E., et al. (2020). An astronomically dated record of Earth’s climate and its predictability over the last 66 million years. Science 369, 1383–1387. doi: 10.1126/science.aba6853
Westerhold, T., Röhl, U., Donner, B., and Zachos, J. C. (2018). Global Extent of early eocene hyperthermal events: a new pacific benthic foraminiferal isotope record from shatsky rise (ODP Site 1209). Paleoceanogr. Paleoclimatol. 33, 626–642. doi: 10.1029/2017PA003306
Witkowski, J., Bohaty, S. M., Edgar, K. M., and Harwood, D. M. (2014). Rapid fluctuations in mid-latitude siliceous plankton production during the Middle Eocene Climatic Optimum (ODP Site 1051, western North Atlantic). Marine Micropaleontology 106, 110–129. doi: 10.1016/j.marmicro.2014.01.001
Witkowski, J., Bohaty, S. M., McCartney, K., and Harwood, D. M. (2012). Enhanced siliceous plankton productivity in response to middle Eocene warming at Southern Ocean ODP Sites 748 and 749. Palaeogeogr. Palaeoclimatol. Palaeoecol. 326–328, 78–94. doi: 10.1016/j.palaeo.2012.02.006
Yamamoto, Y., Fukami, H., Taniguchi, W., and Lippert, P. C. (2018). “Data report: updated magnetostratigraphy for IODP Sites U1403, U1408, U1409, and U1410,” in Proceedings of the Integrated Ocean Drilling Program, Vol. 342, (College Station, TX).
Zachos, J. C., Dickens, G. R., and Zeebe, R. E. (2008). An early Cenozoic perspective on greenhouse warming and carbon-cycle dynamics. Nature 451, 279–283. doi: 10.1038/nature06588
Zachos, J. C., Pagani, M., Sloan, L., Thomas, E., and Billups, K. (2001). Trends, global rhythms, aberrations in global climate 65Ma to present. Science 292, 686–693. doi: 10.1126/science.1059412
Zachos, J. C., Quinn, T. M., and Salamy, K. A. (1996). High-resolution (104 years) deep-sea foraminiferal stable isotope records of the Eocene-Oligocene climate transition. Paleoceanography 11, 251–266. doi: 10.1029/96PA00571
Keywords: functional trait, ecological niches, paleoclimate, paleoecology, planktonic foraminifera
Citation: Kearns LE, Bohaty SM, Edgar KM, Nogué S and Ezard THG (2021) Searching for Function: Reconstructing Adaptive Niche Changes Using Geochemical and Morphological Data in Planktonic Foraminifera. Front. Ecol. Evol. 9:679722. doi: 10.3389/fevo.2021.679722
Received: 12 March 2021; Accepted: 02 June 2021;
Published: 06 July 2021.
Edited by:
Vincent Jassey, UMR 5245 Laboratoire Ecologie Fonctionnelle et Environnement (ECOLAB), FranceReviewed by:
Katarzyna Marcisz, Adam Mickiewicz University, PolandCopyright © 2021 Kearns, Bohaty, Edgar, Nogué and Ezard. This is an open-access article distributed under the terms of the Creative Commons Attribution License (CC BY). The use, distribution or reproduction in other forums is permitted, provided the original author(s) and the copyright owner(s) are credited and that the original publication in this journal is cited, in accordance with accepted academic practice. No use, distribution or reproduction is permitted which does not comply with these terms.
*Correspondence: Lorna E. Kearns, TC5LZWFybnNAc290b24uYWMudWs=
Disclaimer: All claims expressed in this article are solely those of the authors and do not necessarily represent those of their affiliated organizations, or those of the publisher, the editors and the reviewers. Any product that may be evaluated in this article or claim that may be made by its manufacturer is not guaranteed or endorsed by the publisher.
Research integrity at Frontiers
Learn more about the work of our research integrity team to safeguard the quality of each article we publish.