 Laura Martín-Torrijos
 David Buckley
 Ignacio Doadrio4
 Annie Machordom
 Javier Diéguez-Uribeondo
- 1Department of Mycology, Real Jardín Botánico-CSIC (RJB-CSIC), Madrid, Spain
- 2Department of Biology (Genetics), Universidad Autónoma de Madrid (UAM), Madrid, Spain
- 3Centro de Investigación en Biodiversidad y Cambio Global (CIBC-UAM), Universidad Autónoma de Madrid (UAM), Madrid, Spain
- 4Department of Biodiversity and Evolutionary Biology, Museo Nacional de Ciencias Naturales-CSIC (MNCN-CSIC), Madrid, Spain
Several European freshwater crayfish species are currently included in one of the IUCN Red list categories. In the Iberian Peninsula, the native Austropotamobius pallipes species complex (the white clawed crayfish, WCC) has experienced a drastic decline since 1973. Implementing conservation management strategies for this species requires a better understanding of the patterns and structure of its genetic diversity. In this study, we assessed the levels and patterns of genetic variation in 71 populations along the whole distributional range of the WCC in the Iberian Peninsula. The two mitochondrial markers analyzed (Cytochrome Oxidase subunit I and 16S rRNA genes) indicated high levels of genetic diversity, which are significantly geographically structured in three main genetic groups, two corresponding to Northern and one to Central-Eastern and the westernmost Iberian Peninsula. The diversity found included new private haplotypes, and revealed the potential effect of paleogeographic barriers and last glaciations in the population structure observed. Current conservation and management programs for the WCC in the Iberian Peninsula should consider these three phylogeographic groups as essential management units in order to preserve the remaining genetic diversity in the species.
Introduction
The status of the European crayfish represents a paradigmatic example of the worldwide freshwater biodiversity crisis. Currently, there are six native European crayfish species: the white-clawed crayfish (WCC) (Austropotamobius pallipes species complex, see below), the stone crayfish (SC) (Austropotamobius torrentium), the noble crayfish (NC) (Astacus astacus), the narrow-clawed crayfish (NCC) (Pontastacus leptodactylus), the thick-clawed crayfish (TCC) (Pontastacus pachypus), and the recently described Austropotamobius bihariensis (Pârvulescu, 2019). These crustaceans have experienced a rapid decimation due to overexploitation, water pollution, flow modification, habitat destruction, habitat and populations fragmentation, invasive species, and especially the emerging crayfish plague disease caused by the pathogen Aphanomyces astaci (Jussila et al., 2021 for review).
As a consequence of this decline, several crayfish species are included in one of the IUCN Red list categories (e.g., WCC and NC are listed as endangered and vulnerable, respectively) with a declining population trend (IUCN, 2021). Thus, there has been a recent interest in studying the patterns of genetic diversity in the European crayfish species to establish sound management and conservation plans (Schubart and Huber, 2006; Akhan et al., 2014; Jelić et al., 2016; Bláha et al., 2017; Schrimpf et al., 2017; Lovrenčić et al., 2020). This is especially true for the WCC in the Iberian Peninsula since this species has experienced a drastic decline for the last 45 years (Füreder et al., 2010). The taxonomic status of WCC, furthermore, is complex. Initial analyses based on nuclear DNA supported the existence of one species (Chiesa et al., 2011; Scalici and Bravi, 2012) while analyses based on mitochondrial DNA (mtDNA) and allozymes suggested that Austrapotamobius pallipes actually represents a species complex. This complex was proposed to comprise two species, A. pallipes sensu stricto and A. italicus, which in turn includes four subspecies: A. i. carsicus, A. i. meridionalis, A. i. italicus and A. i. carinthiacus (Fratini et al., 2005).
The WCC populations of the Iberian Peninsula have been referred as the westernmost part of the A. i. italicus lineage. They were thought as an introduction from the Italian Peninsula (Vedia and Miranda, 2013; Clavero et al., 2016), although they are now considered of autochthonous/natural origin (e.g., Beroiz et al., 2008; Diéguez-Uribeondo et al., 2008; Pedraza-Lara et al., 2010; Matallanas et al., 2011, 2016). Historically, its distributional range in the Iberian territory covered most part of this area until the introduction of two North American invasive crayfish, Procambarus clarkii and Pacifastacus leniusculus, which are chronic carriers of the crayfish plague pathogen (Alonso et al., 2000). Since the introduction of this pathogen, at least 80% of the original European populations have disappeared (Füreder et al., 2010), and the trend of the remaining Iberian populations is still decreasing (Aldabe et al., 1991; Temiño and Sáez-Royuela, 1998). The remaining Iberian WCC populations, and their genetic diversity, thrive in isolated mountainous creeks or in inaccessible brooks. Initial studies analyzing the genetic diversity of the Iberian WCC were based on mitochondrial regions, e.g., 16S rRNA and Cytochrome Oxidase Subunit I (COI). These investigations did not find significant levels of genetic diversity among the populations studied (Santucci et al., 1997; Grandjean et al., 2000, 2001, 2002; Trontelj et al., 2005). However, subsequent studies evidenced higher levels of genetic diversity and a perceptible genetic structure by increasing the number of populations and sample size (Beroiz et al., 2008; Diéguez-Uribeondo et al., 2008), especially when new markers were designed. These studies indicated a strong geographical structure and confirmed the existence of high genetic diversity, similar to the levels found in other European crayfish populations (Pedraza-Lara et al., 2010; Matallanas et al., 2011, 2016). In these studies, however, the distributional range of WCC in the Iberian Peninsula was not fully covered. Although this species does not appear to be naturally distributed in some areas of the Western Iberia peninsula (is absent or very rare in the acid rock areas of Portugal, Galicia, Extremadura and West of Andalucía) (Alonso et al., 2000), there was an overlooked gap in the Central-Western area, still under-sampled and unstudied. The fact that WCC has not been studied within its whole range of distribution, could bias the estimates for overall genetic patterns of diversity for the species in the Iberian Peninsula. Therefore, a study considering the whole range of this species in the Iberian Peninsula is in need, and will provide new insights that will also help clarifying previous claims of a non-native origin of this species in the Iberian Peninsula (Vedia and Miranda, 2013; Clavero et al., 2016).
Thus, the aim of this study was to unravel the potential hidden genetic diversity within the unexplored Iberian WCC populations and to identify patterns of the genetic variation and structure. For this purpose, we have significantly increased the number of sampled populations from previous studies along a wider distributional range in the Iberian Peninsula, applying two highly informative mitochondrial DNA regions, the 16S rRNA and COI genes. Approaching the true diversity and identifying patterns of genetic diversity of the native WCC in the Iberian Peninsula is crucial for maintaining the genetic pool of this endangered species. Moreover, these results will improve the design of conservation programs for the species.
Materials and Methods
Crayfish Sampling
A total of 265 specimens of WCC were collected from 47 populations throughout the geographical distribution of the WCC in the Iberian Peninsula (Table 1). Due to the conservation status of some populations, and variability in populations size, the number of specimens per population included in the study was unequal. Crayfish were captured using nets and by hand in collaboration with the environmental officers of each of the localities. In addition, and to cover the geographical range of the WCC distribution, we included specimens from the “Crayfish Collection” of the RJB-CSIC in Madrid (set of historical samples collected and preserved since 1998). A walking leg from each individual was excised and preserved in 96% ethanol in a 2 ml tube until the molecular analysis. All crayfish were returned to their habitat alive.
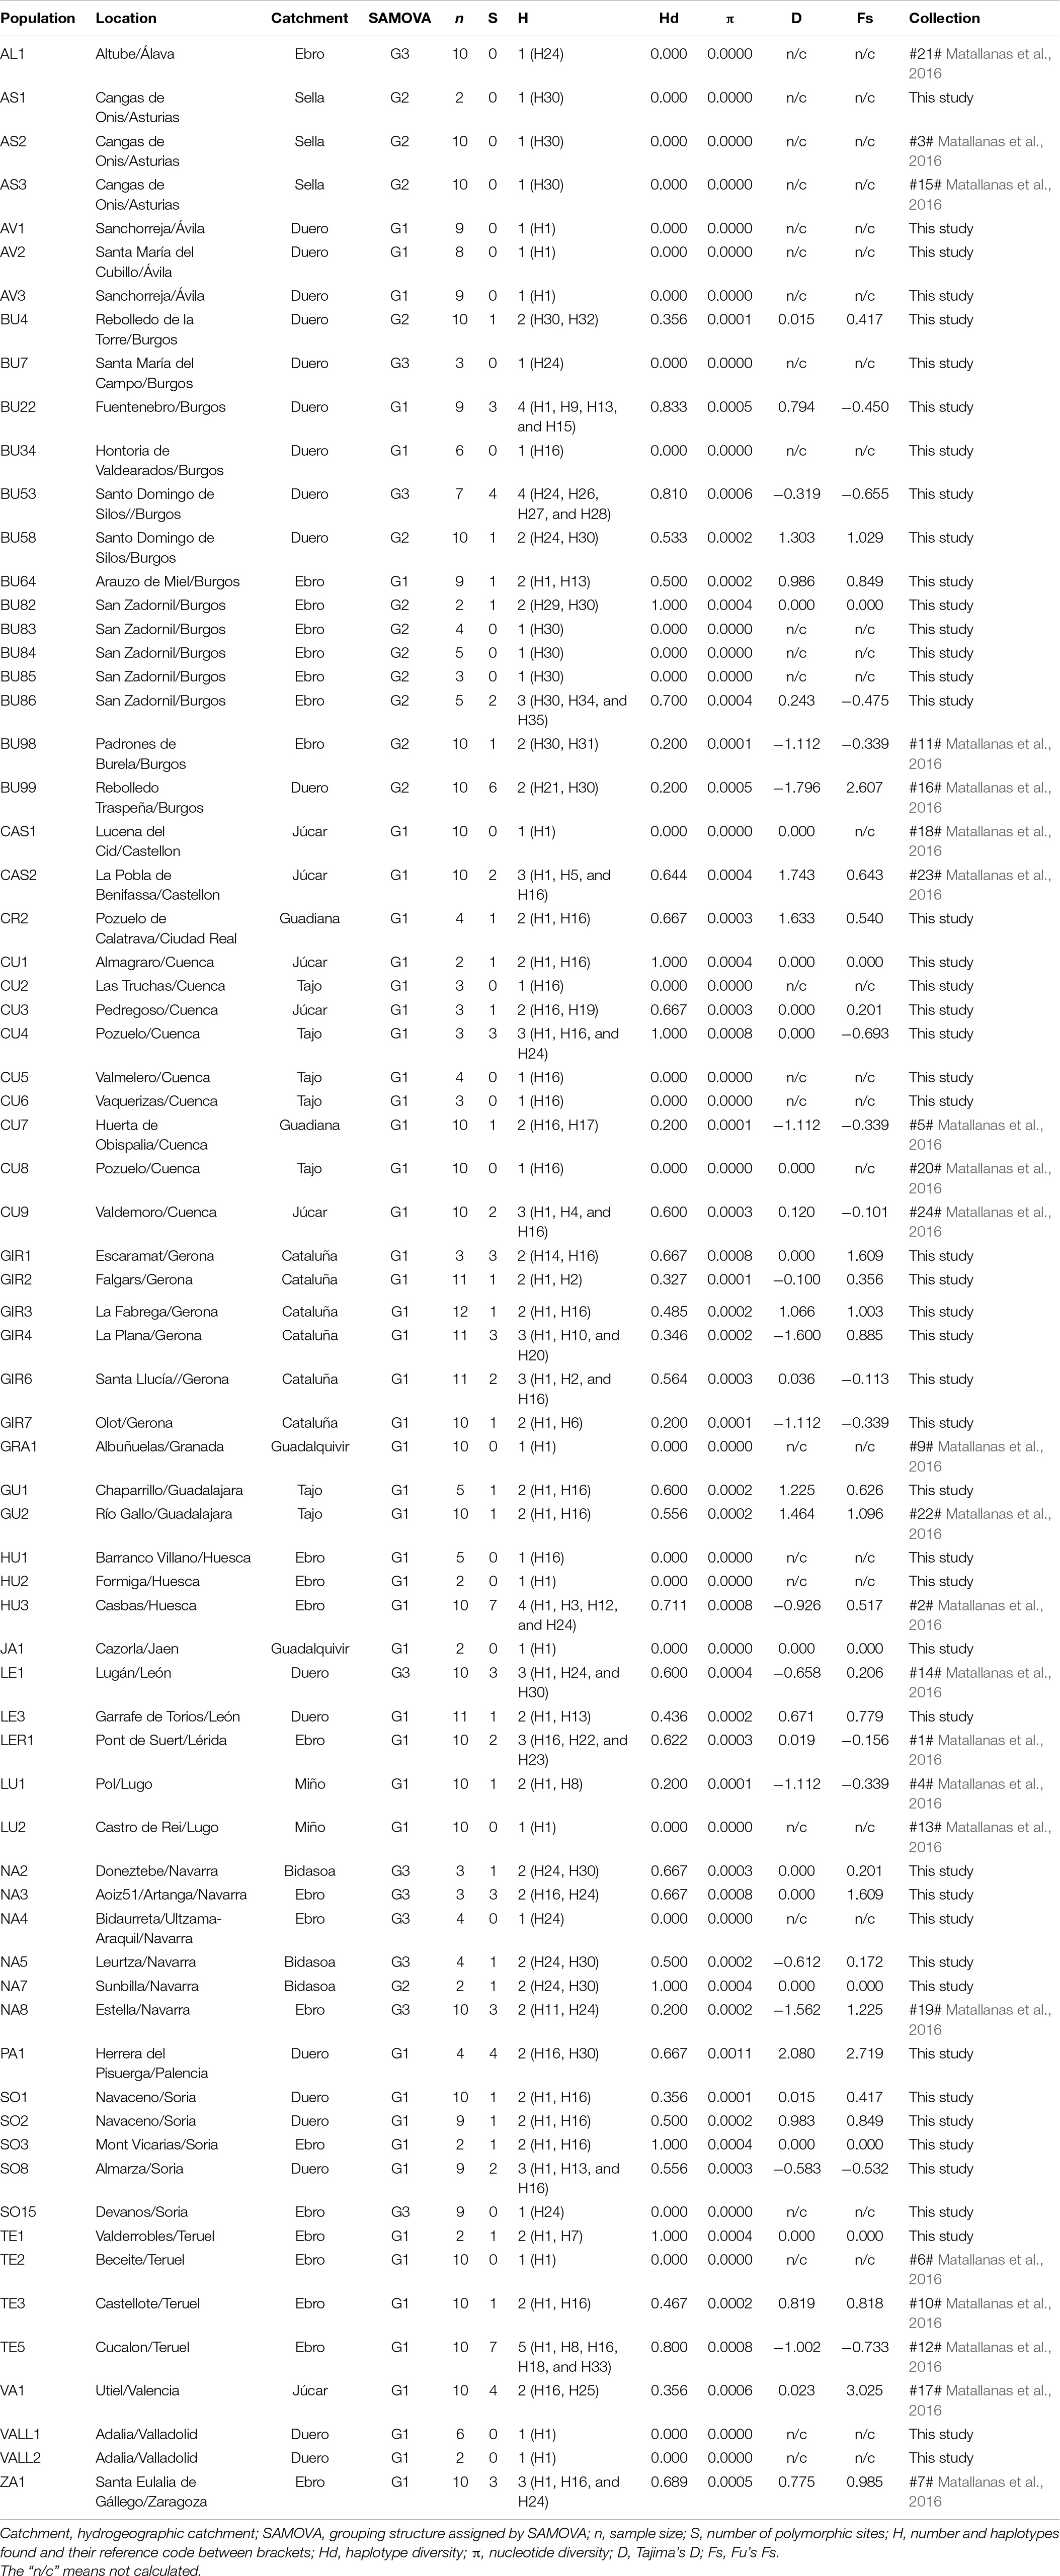
Table 1. Populations and locations of the white-clawed crayfish analyzed in the present work (Figure 3).
DNA Extraction, Amplification and Sequencing
Samples were first rinsed with TE buffer (Tris 10 mM/EDTA 1 mM, pH 8) to remove the preserving ethanol. Each walking leg was cleaned up to three times with TE and left overnight in the buffer. Each sample was then transferred to a 2 ml tube, which was frozen at −80°C and afterward lyophilized in a freeze dryer VirTis BenchTop K for 24 h (≤−50°C; ≤ 20 mTorr) to facilitate the grinding of the genetic material by mechanical rupture using a TissueLyser (QIAGEN).
Genomic DNA was extracted with an E.Z.N.A. ®Insect DNA Kit (Omega bio-tek, Norcross, Atlanta, United States). The election of the mitochondrial markers used in this study was made trying to maximized the information obtained from the sequences as well as the compatibility with the information available in GenBank. Therefore, we selected the mitochondrial 16S rRNA and COI genes. The primers pair used to amplify the mitochondrial 16S rRNA gene, 1472 (Crandall and Fitzpatrick, 1996) and Tor12sc (Largiadèr et al., 2000) amplified a fragment that included partial sequences of the 12S rRNA, the 16S rRNA and the val-tRNA. From hereafter, the combination of the 12S rRNA, val-tRNA and 16S rRNA regions will be referred as 16S. The primers pair used to amplify the mitochondrial COI gene was C/N 2769 (Gopurenko et al., 1999) and LCO1490 (Folmer et al., 1994). Both were used in a single round PCR following the protocols in Matallanas et al. (2016). Negative controls containing no DNA were included in all single round PCR for both primer pairs.
We checked for positive amplicons by running an electrophoresis with 3-μl aliquots of the amplification product in 1% agarose TAE gels stained with SBYR-Safe (Thermo Fisher Scientific). Amplified products were purified using a QIAquick PCR Purification Kit (Qiagen, Germany). Double strand PCR positive products were sequenced using an automated sequencer (Applied Biosystems 3730xl DNA, Macrogen, Netherlands).
Sequence Data
Both mtDNA sequence strands were assembled and analyzed using the program Geneious v10.0.2 (Kearse et al., 2012). We ran BLAST searches to check the nature of the generated sequences. We revised the sequences chromatograms for double-peaks and performed the alignments using the MAFFT algorithm (Katoh et al., 2002). The final alignments included sequences of 1,317 base pairs (bp) for 16S gene and 1,151 bp for COI gene.
Additionally, we downloaded a total of 748 sequences for the 16S gene and 669 sequences for the COI gene from GenBank from previous studies (Supplementary Appendix 1). Moreover, the sequences for the 16S and COI genes from the genome of Austropotamobius torrentium were also downloaded from GenBank (accession numbers NC_033504), as well as the sequences for the 16S and COI for A. italicus carsicus (accession numbers KX370126 and KX369706, respectively) and were used as outgroups in the phylogenetic analyses (Supplementary Appendix 1).
Data Sets
We designed three different data sets to take advantage of the genetic information in previous studies. Data Set 1 was designed to frame the samples from this study within the last phylogenetic scenario proposed by Jelić et al. (2016). Data Set 2 was designed to reconstruct the phylogenetic relationships of lineages within the Iberian Peninsula. Data Set 3 was designed to estimate the genetic diversity and the population structure of the existing populations in the Iberian Peninsula.
Data Set 1 comprised all the sequences from the range of distribution of WCC in Europe, including three subsets: (i) 16S with a total of 1,013 sequences, (ii) COI with a total of 934 sequences, and (iii) concatenated 16S and COI genes from the specimens that had both genes sequenced with a total of 934 specimens. Austropotamobius torrentium was used as an outgroup in all the subsets.
The Data Set 2 comprised all the sequences from the distributional range of the WCC in the Iberian Peninsula, including three subsets: (i) 16S with a total of 706 sequences, (ii) COI with a total of 706, and (iii) concatenated 16S and COI genes from the specimens that had both genes sequenced with a total of 706 specimens. One specimen from the sister clade of the Iberian WCC populations (A. italicus carsicus) was used as an outgroup in all the subsets.
The Data Set 3 comprised a total of 505 sequences with the largest base pair length for the three defined subsets: (i) 16S, (ii) COI and (iii) concatenated 16S and COI genes, of which 265 sequences were obtained from the 47 populations of this study (GenBank accession numbers MW317197-MW317461 for 16S and MW325345-MW325609 for COI). The remaining 240 sequences belong to 24 populations spanning the distributional range of the A. pallipes complex in the Iberian Peninsula (Matallanas et al., 2016) (Table 1). This data set was used to determine both genetic diversity and genetic structure of the existing populations in the Iberian Peninsula.
Phylogenetic Relationships
Phylogenetic relationships were analyzed for the Data Set 1 and Data Set 2. We identified the best model of nucleotide substitution and best partition schemes for the 16S and the COI genes for each of the data sets in Partition Finder v2.1.1 (Lanfear et al., 2016), using the Bayesian Information criterion (BIC). The base frequencies were estimated using maximum likelihood (+X) rather than empirically (+F) for the implemented models.
Phylogenetic analyses for the 16S, the COI and the concatenated 16S and COI genes were run under Bayesian inference (BI) and maximum likelihood (ML). The BI analysis was performed in MrBayes v.3.2.6 software (Ronquist et al., 2012) using the default MCMCMC search algorithm with 100,000,000 generations, three runs (eight chains per run) with a burn-in of 25% generations. Nodes with posterior probability (pp) values ≥ 0.95 were considered as supported. Tracer v1.6.0 (Rambaut et al., 2014) was used to check for convergence and stationarity of the three runs. The ML analysis was performed in RAxML v.8 (Stamatakis, 2014) as implemented in raxmlGUI v1.5b1 (Silvestro and Michalak, 2012), with 100 independent replicates and 1,000 rapid bootstraps. Nodes with bootstrap values ≥ 75 were considered as supported. The resulting trees from the BI and ML analyses were visualized in FigTree v1.4.2 (Rambaut, 2012).
Genetic Diversity and Genetic Structure
We examined the genetic structure of the WCC in the Iberian Peninsula using the Data Set 3 with a Spatial Analysis of the Molecular Variance (SAMOVA v2.0) (Dupanloup et al., 2002). This method defines groups of populations (k) that are genetically and geographically homogeneous and maximally differentiated from each other (it maximizes the proportion of total genetic variance, FCT) to identify genetic barriers. Moreover, it also defines groups of populations that are maximally differentiated from each other, without constraint for the geographic composition of the groups. We run SAMOVA v2.0 from k = 2 to k = 20 and each run was with 1,000 simulated annealing processes.
We used TCS v.1.21 (Clement et al., 2000) to represent the mutational changes between the sequences throughout the most parsimonious haplotype network and the genealogical relationships were visualized using PopArt v1.7.2 (Leigh and Bryant, 2015).
To further dissect the patterns of genetic diversity and the genetic structure of the WCC populations in the Iberian Peninsula, we defined three grouping strategies of the Data Set 3: (I) populations as independent units, (II) populations grouped in hydrogeographic areas, and (III) populations grouped in the phylogeographic areas determined by SAMOVA (Table 1). Due to the unequal number of the samples conforming each sampled population, we carried out the rarefaction of the data in the populations grouped in hydrogeographic areas and in the populations grouped by phylogeographic areas. For this, we selected randomly n∗ individuals, subsampled without replacement from the larger of the original samples, and equaled the size of the smaller original sample (n = n∗ = 4) (Magurran and McGill, 2011).
We performed two independent analyses for the two grouping structures (hydrogeographic areas and the phylogeographic areas), first for the raw data and then for the rarefied data. We estimated the number of polymorphic (segregating) sites (S), the number of haplotypes (H), the haplotype diversity (Hd), the average number of nucleotide differences (k) and the nucleotide diversity (π) using the program DNAsp v.5.10.01 (Librado and Rozas, 2009). We estimated the haplotypes frequencies and the genetic diversity indices (Tajima’s D and Fu’s Fs) with the software Arlequin v3.5.2.2 (Excoffier et al., 2005). The patterns of genetic variation with the analysis of the molecular variance (AMOVA) were analyzed in Arlequin v3.5.2.2 (Excoffier et al., 2005). Significance values (p < 0.05) were assessed by using 10,000 permutations.
Results
Phylogenetic Relationships
The phylogenetic analyses of the independent 16S and COI genes subsets (Data Set 1) provided congruent trees. The concatenated mtDNA fragments conforming Data Set 1 were divided in three partitions. First partition included the 12S rRNA and val-tRNA genes (155 pb) with a JC substitution model (Jukes and Cantor, 1969), a second partition included the 16S rRNA gene (1,162 pb) with a HKY + I + X substitution model (Hasegawa et al., 1985) and a third partition included the COI gene (1,151 pb) with a HKY + G + X substitution model (Hasegawa et al., 1985). The analyses (BI and ML) of the concatenated data set showed a clear differentiation between A. pallipes and A. italicus (Figure 1). Within A. italicus, sequences attributed to A. i. italicus, A. i. carinthiacus, and A. i. carsicus formed a well-supported Clade (Clade I). The remaining samples corresponding to A. i. meridionalis did not form a monophyletic group, as defined in Fratini et al. (2005) (Figure 1). The samples of A. i. italicus and A. i. carinthiacus from Austria, Italy, France, and the Iberian Peninsula grouped in a well-supported sub-clade, sister to the samples of A. i. carsicus (Figure 1).
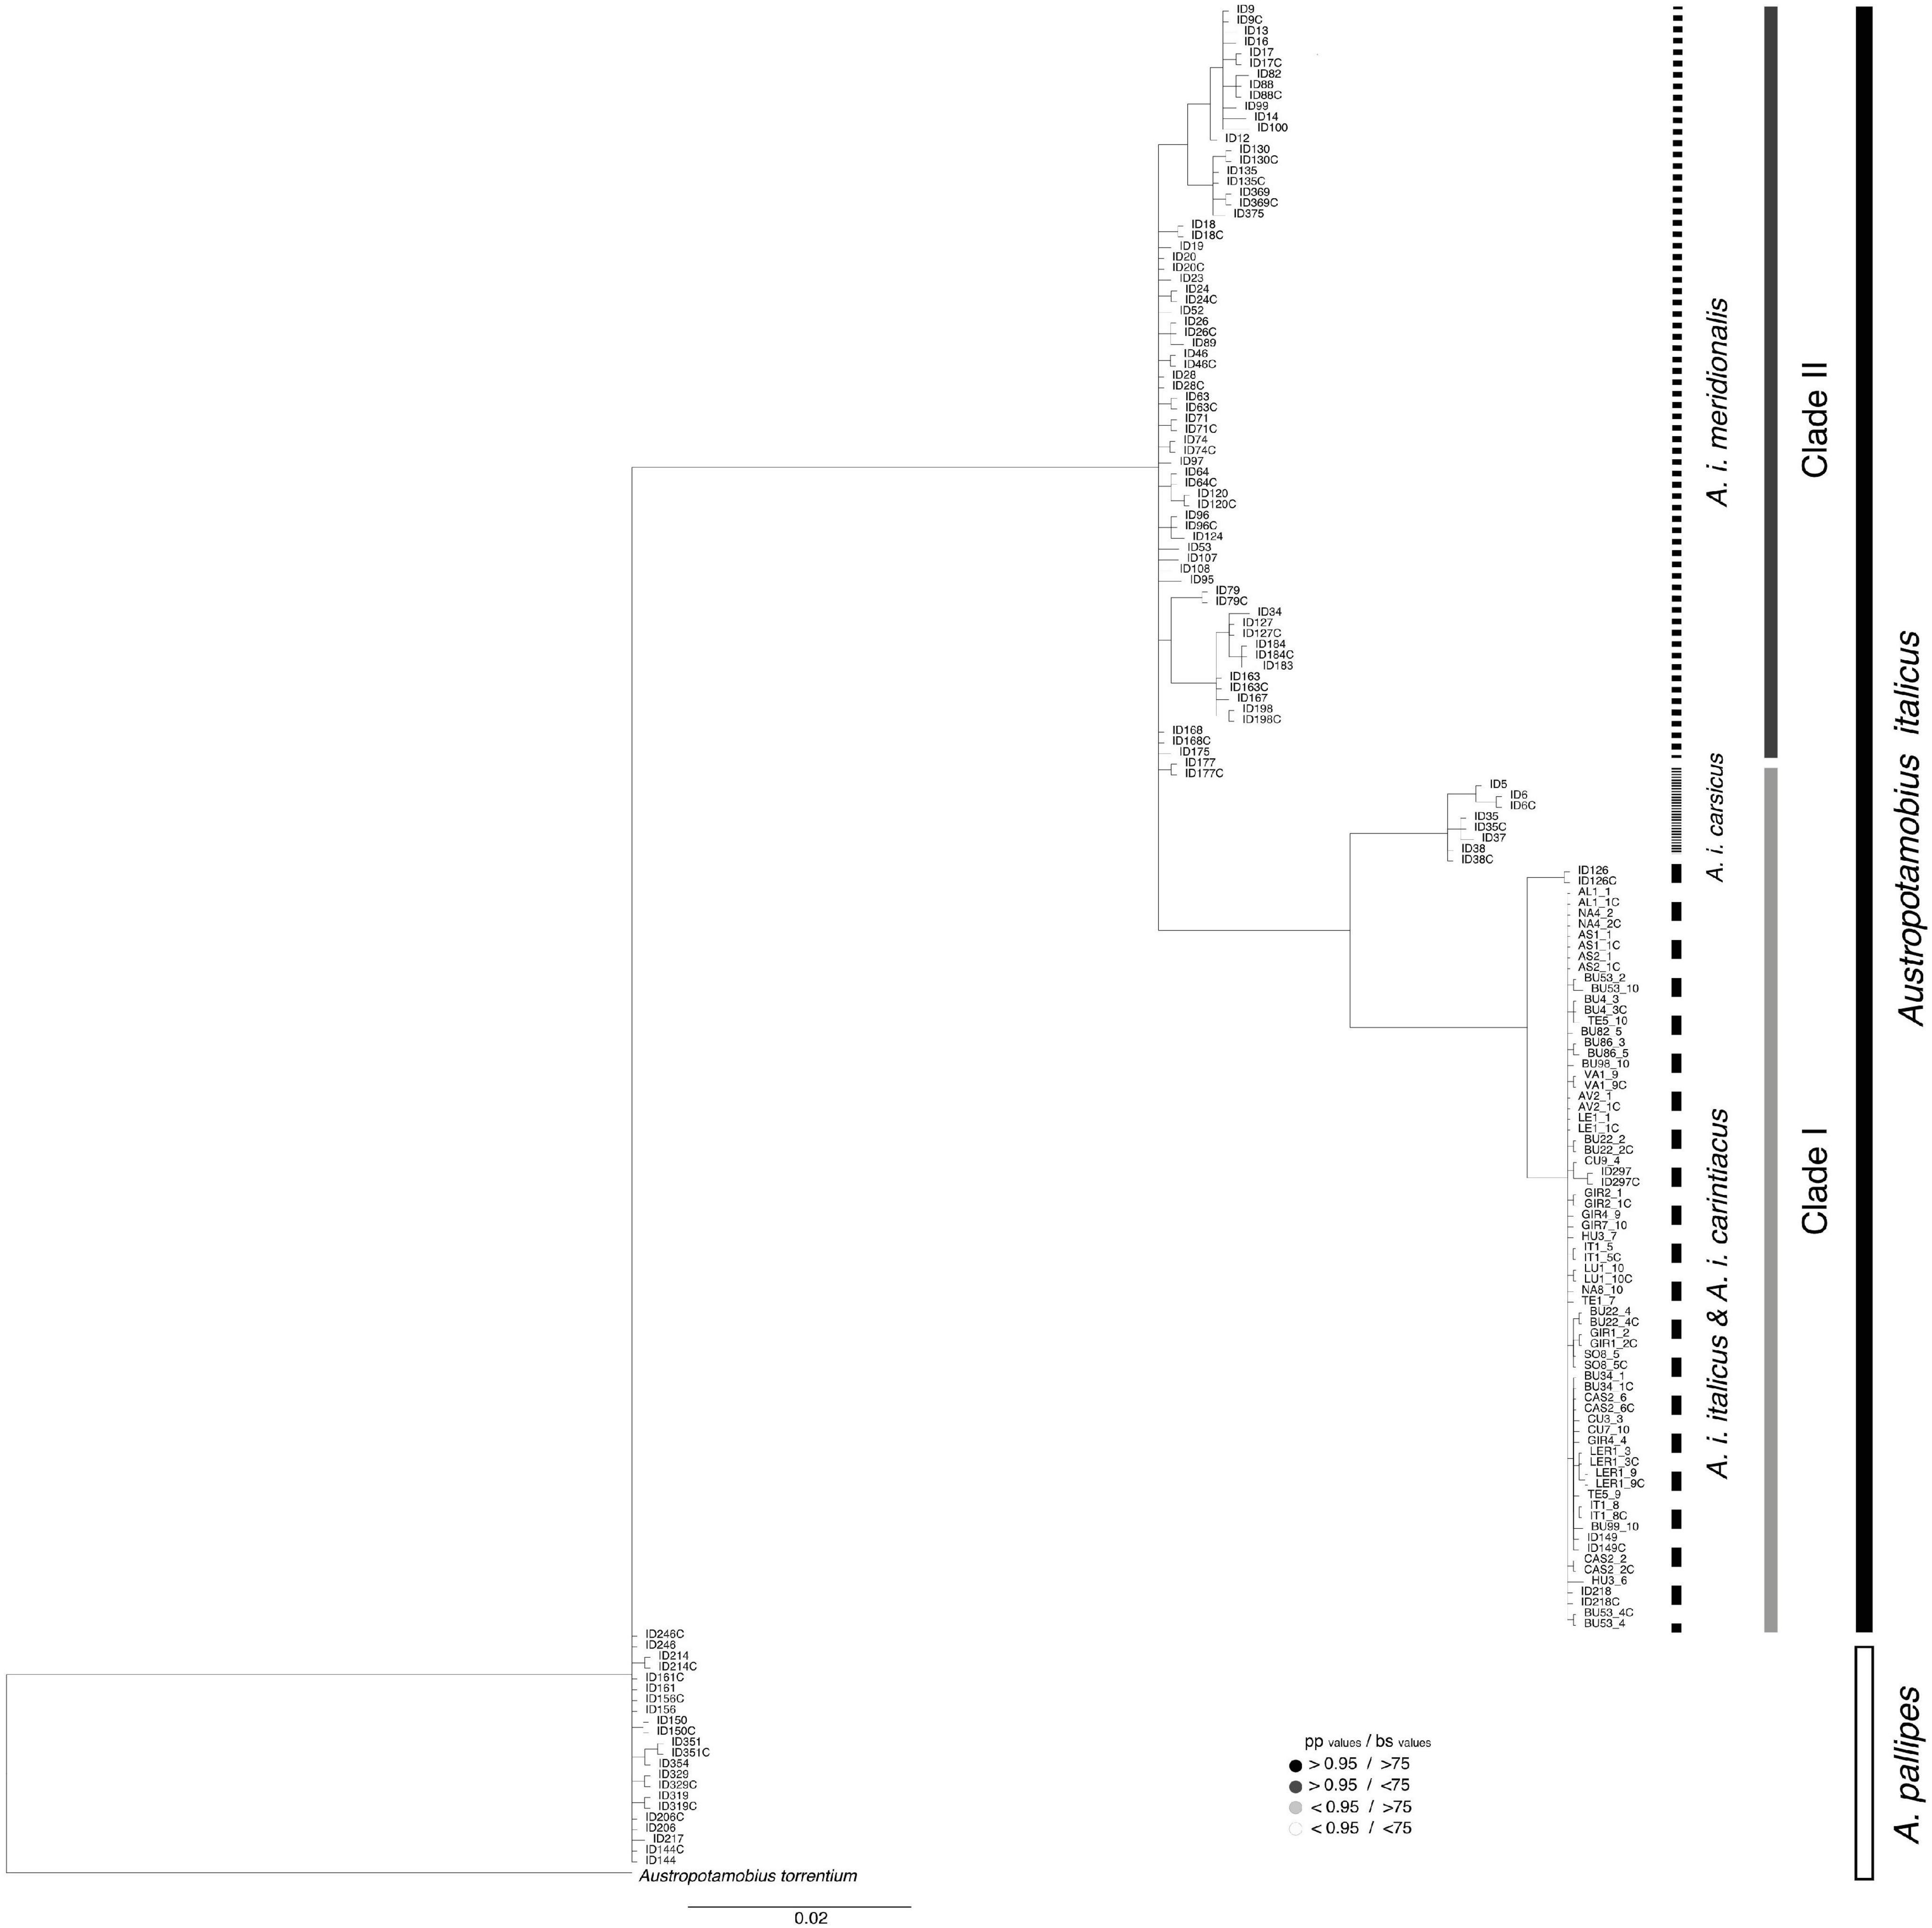
Figure 1. Bayesian inference analyses based on concatenated mitochondrial 16S rRNA and COI genes sequences from Data Set 1. The posterior probability values (pp values) are from Bayesian inference analysis and the bootstrap support values (bs values) from Maximum Likelihood. Nodes with black circles have pp values higher than 0.95 and bs higher than 75, nodes with dark gray circles have pp higher than 0.95 and bs lower than 75, nodes with light gray circles have pp lower than 0.95 and bs higher than 75, and nodes with white circles have pp lower than 0.95 and bs lower than 75. Scales bar for phylogenetic analysis indicates substitutions per site.
The analyses of the Data Set 2 showed that the independent analysis of the two subsets of 16S and COI genes provided congruent trees. PartitionFinder subdivided the concatenated Data Set 2 into three partitions. The first partition included 12S rRNA and val-tRNA genes (155 pb) with a JC substitution model (Jukes and Cantor, 1969), a second partition included the 16S rRNA gene (1,162 pb) with a HKY + G substitution model (Hasegawa et al., 1985), and a third partition included the COI gene (1,151 pb) with a HKY + G substitution model (Hasegawa et al., 1985).
The phylogenetic analyses (BI and ML) resulting from this concatenated dataset showed no clear relationships among Iberian A. i. italicus populations. Some samples grouped together with high support but sometimes with no clear geographic correspondence (Figure 2).
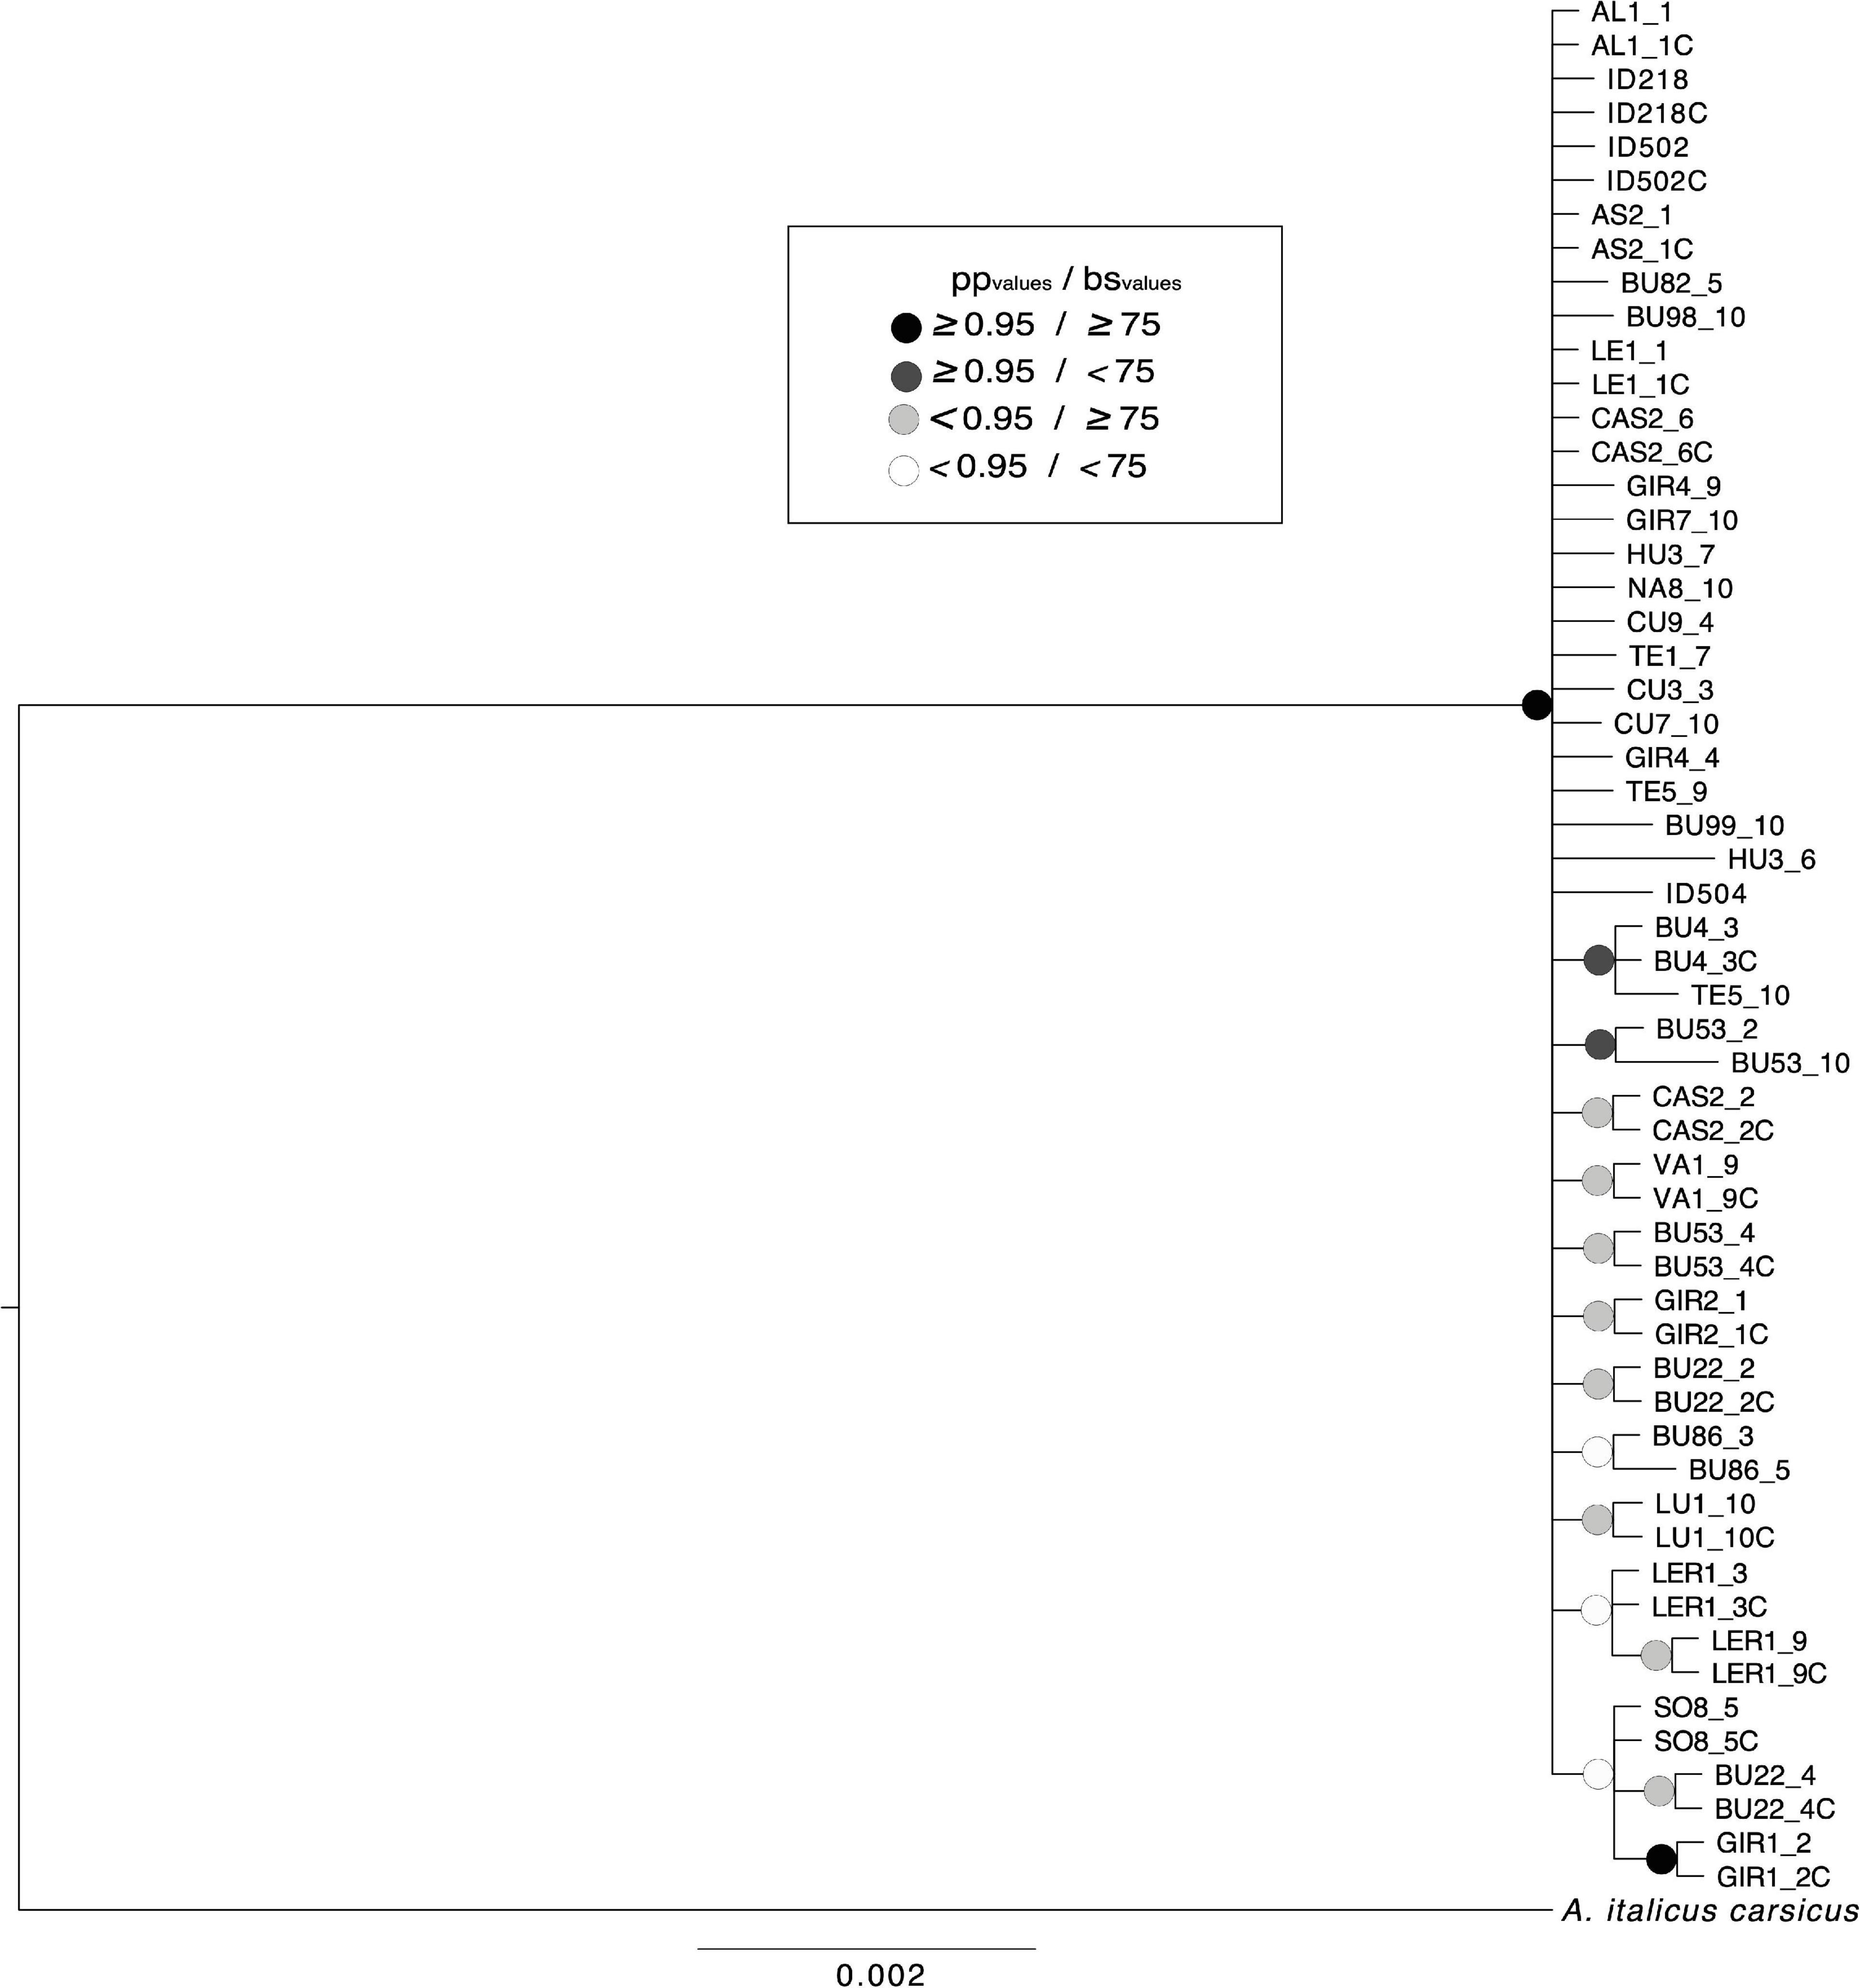
Figure 2. Bayesian inference analyses based on concatenated mitochondrial 16S rRNA and COI genes sequences from Data Set 2. The posterior probability values (pp values) are from Bayesian inference analysis and the bootstrap support values (bs values) from Maximum Likelihood. Nodes with black circles have pp values higher than 0.95 and bs higher than 75, nodes with dark gray circles have pp higher than 0.95 and bs lower than 75, nodes with light gray circles have pp lower than 0.95 and bs higher than 75, and nodes with white circles have pp lower than 0.95 and bs lower than 75. Scales bar for phylogenetic analysis indicates substitutions per site.
Genetic Diversity and Genetic Structure
The SAMOVA analysis resolved three main groups (K = 3) out of the 71 populations of WCC in the Iberian Peninsula: the Central-Eastern (Group 1), the North-Western Group (Group 2) and the North-Central Group (Group 3) (Figure 3), representing the Iberian populations with and without a geographical constraint (equal values for complete data and rarefied samples, FCT = FCT∗ = 0.73). Group 1 included 48 populations, Group 2 included 13, and Group 3 included 10 populations (Table 1).
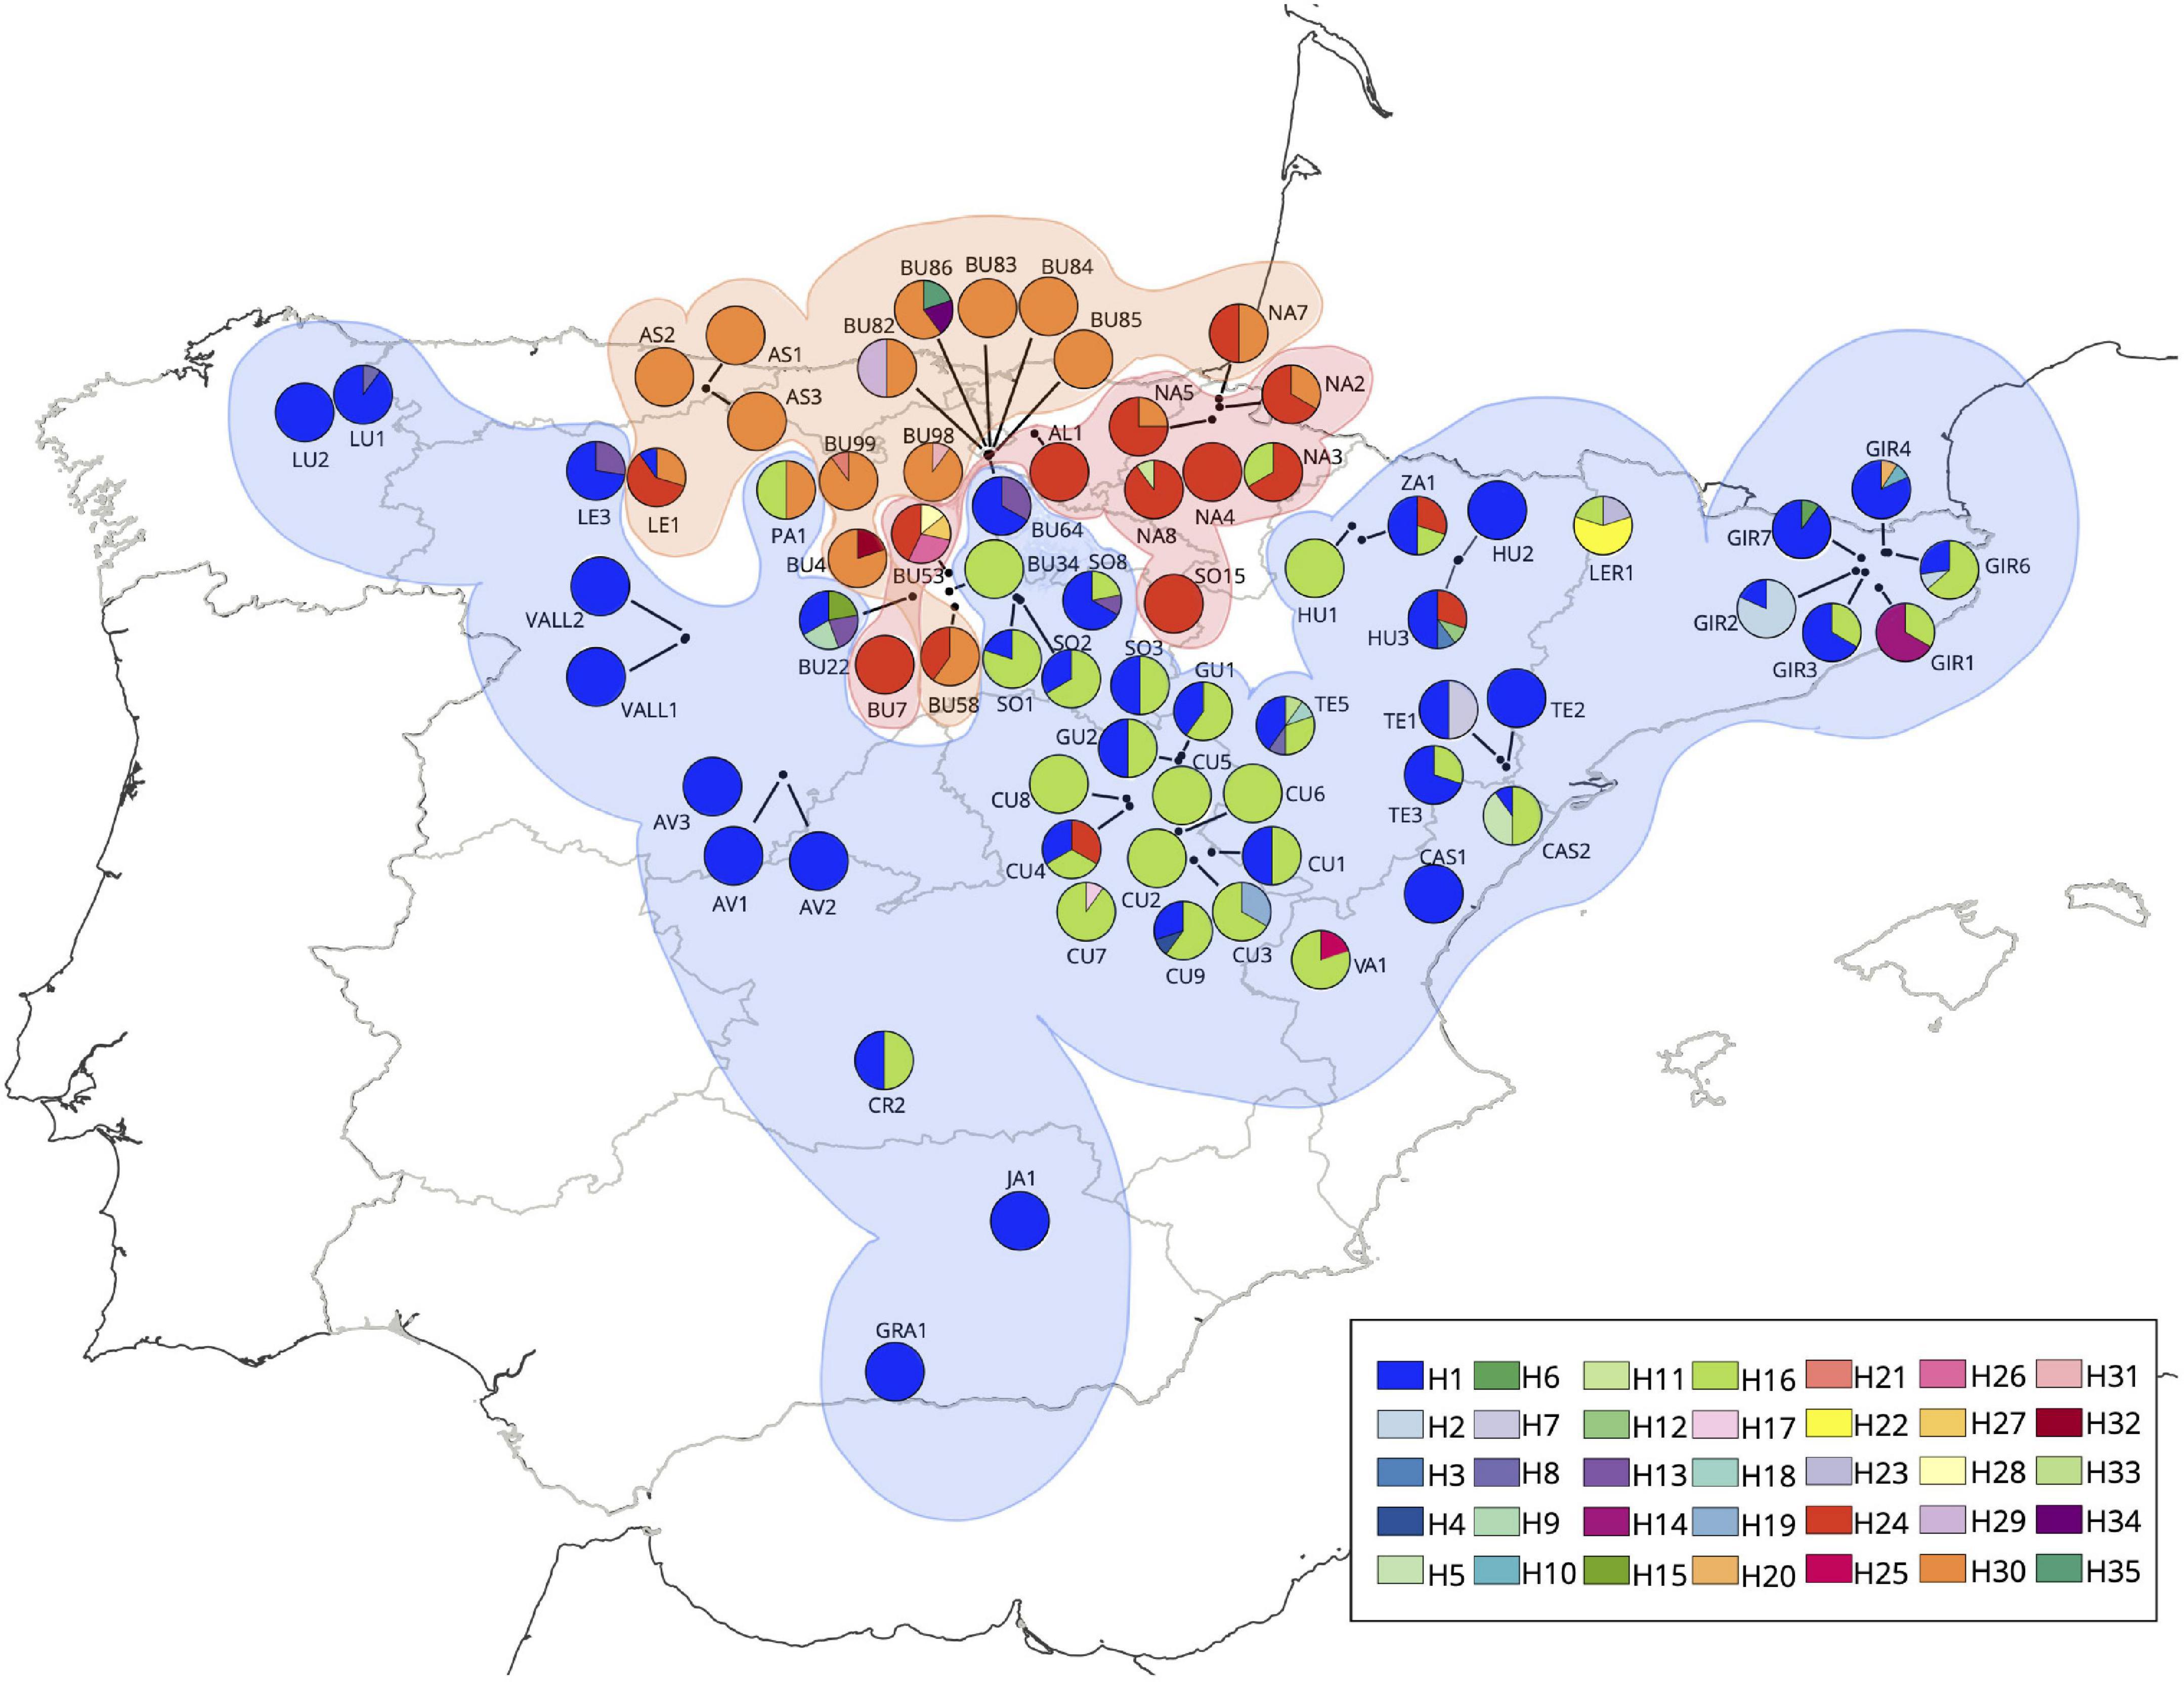
Figure 3. Phylogeographic structure and haplotypes detected in the white-clawed crayfish populations of the Iberian Peninsula. Location of the three SAMOVA main groups: Central-Eastern (Group 1 in color blue), North-Western Group (Group 2 in orange color), and North-Central Group (Group 3 in red color). The haplotype’s frequencies are determined by the relative proportion of the pie graph. Each chart of the legend represents a different haplotype based on concatenated mitochondrial 16S rRNA and COI genes sequences.
The most parsimonious haplotype network showed 35 haplotypes in the Iberian Peninsula (Figure 4). Four of them (H1, H16, H24, and H30) were the most represented in the area. The two haplotypes H1 and H16 covered the Center, South, East and the westernmost populations of the Iberian Peninsula (Figure 3) (Group1 defined by SAMOVA), haplotype H30 covered the North-Western of the Iberian Peninsula (Group2 defined by SAMOVA), and the haplotype H24 covered the North-Center of the Iberian Peninsula (Group3 defined by SAMOVA). We recovered six shared haplotypes (H1, H2, H13, H16, H24, and H30) among different populations, presenting medium-high frequencies, while the 29 remaining haplotypes appeared as unique from one specific population, conforming private haplotypes with low-medium frequencies (Table 2).
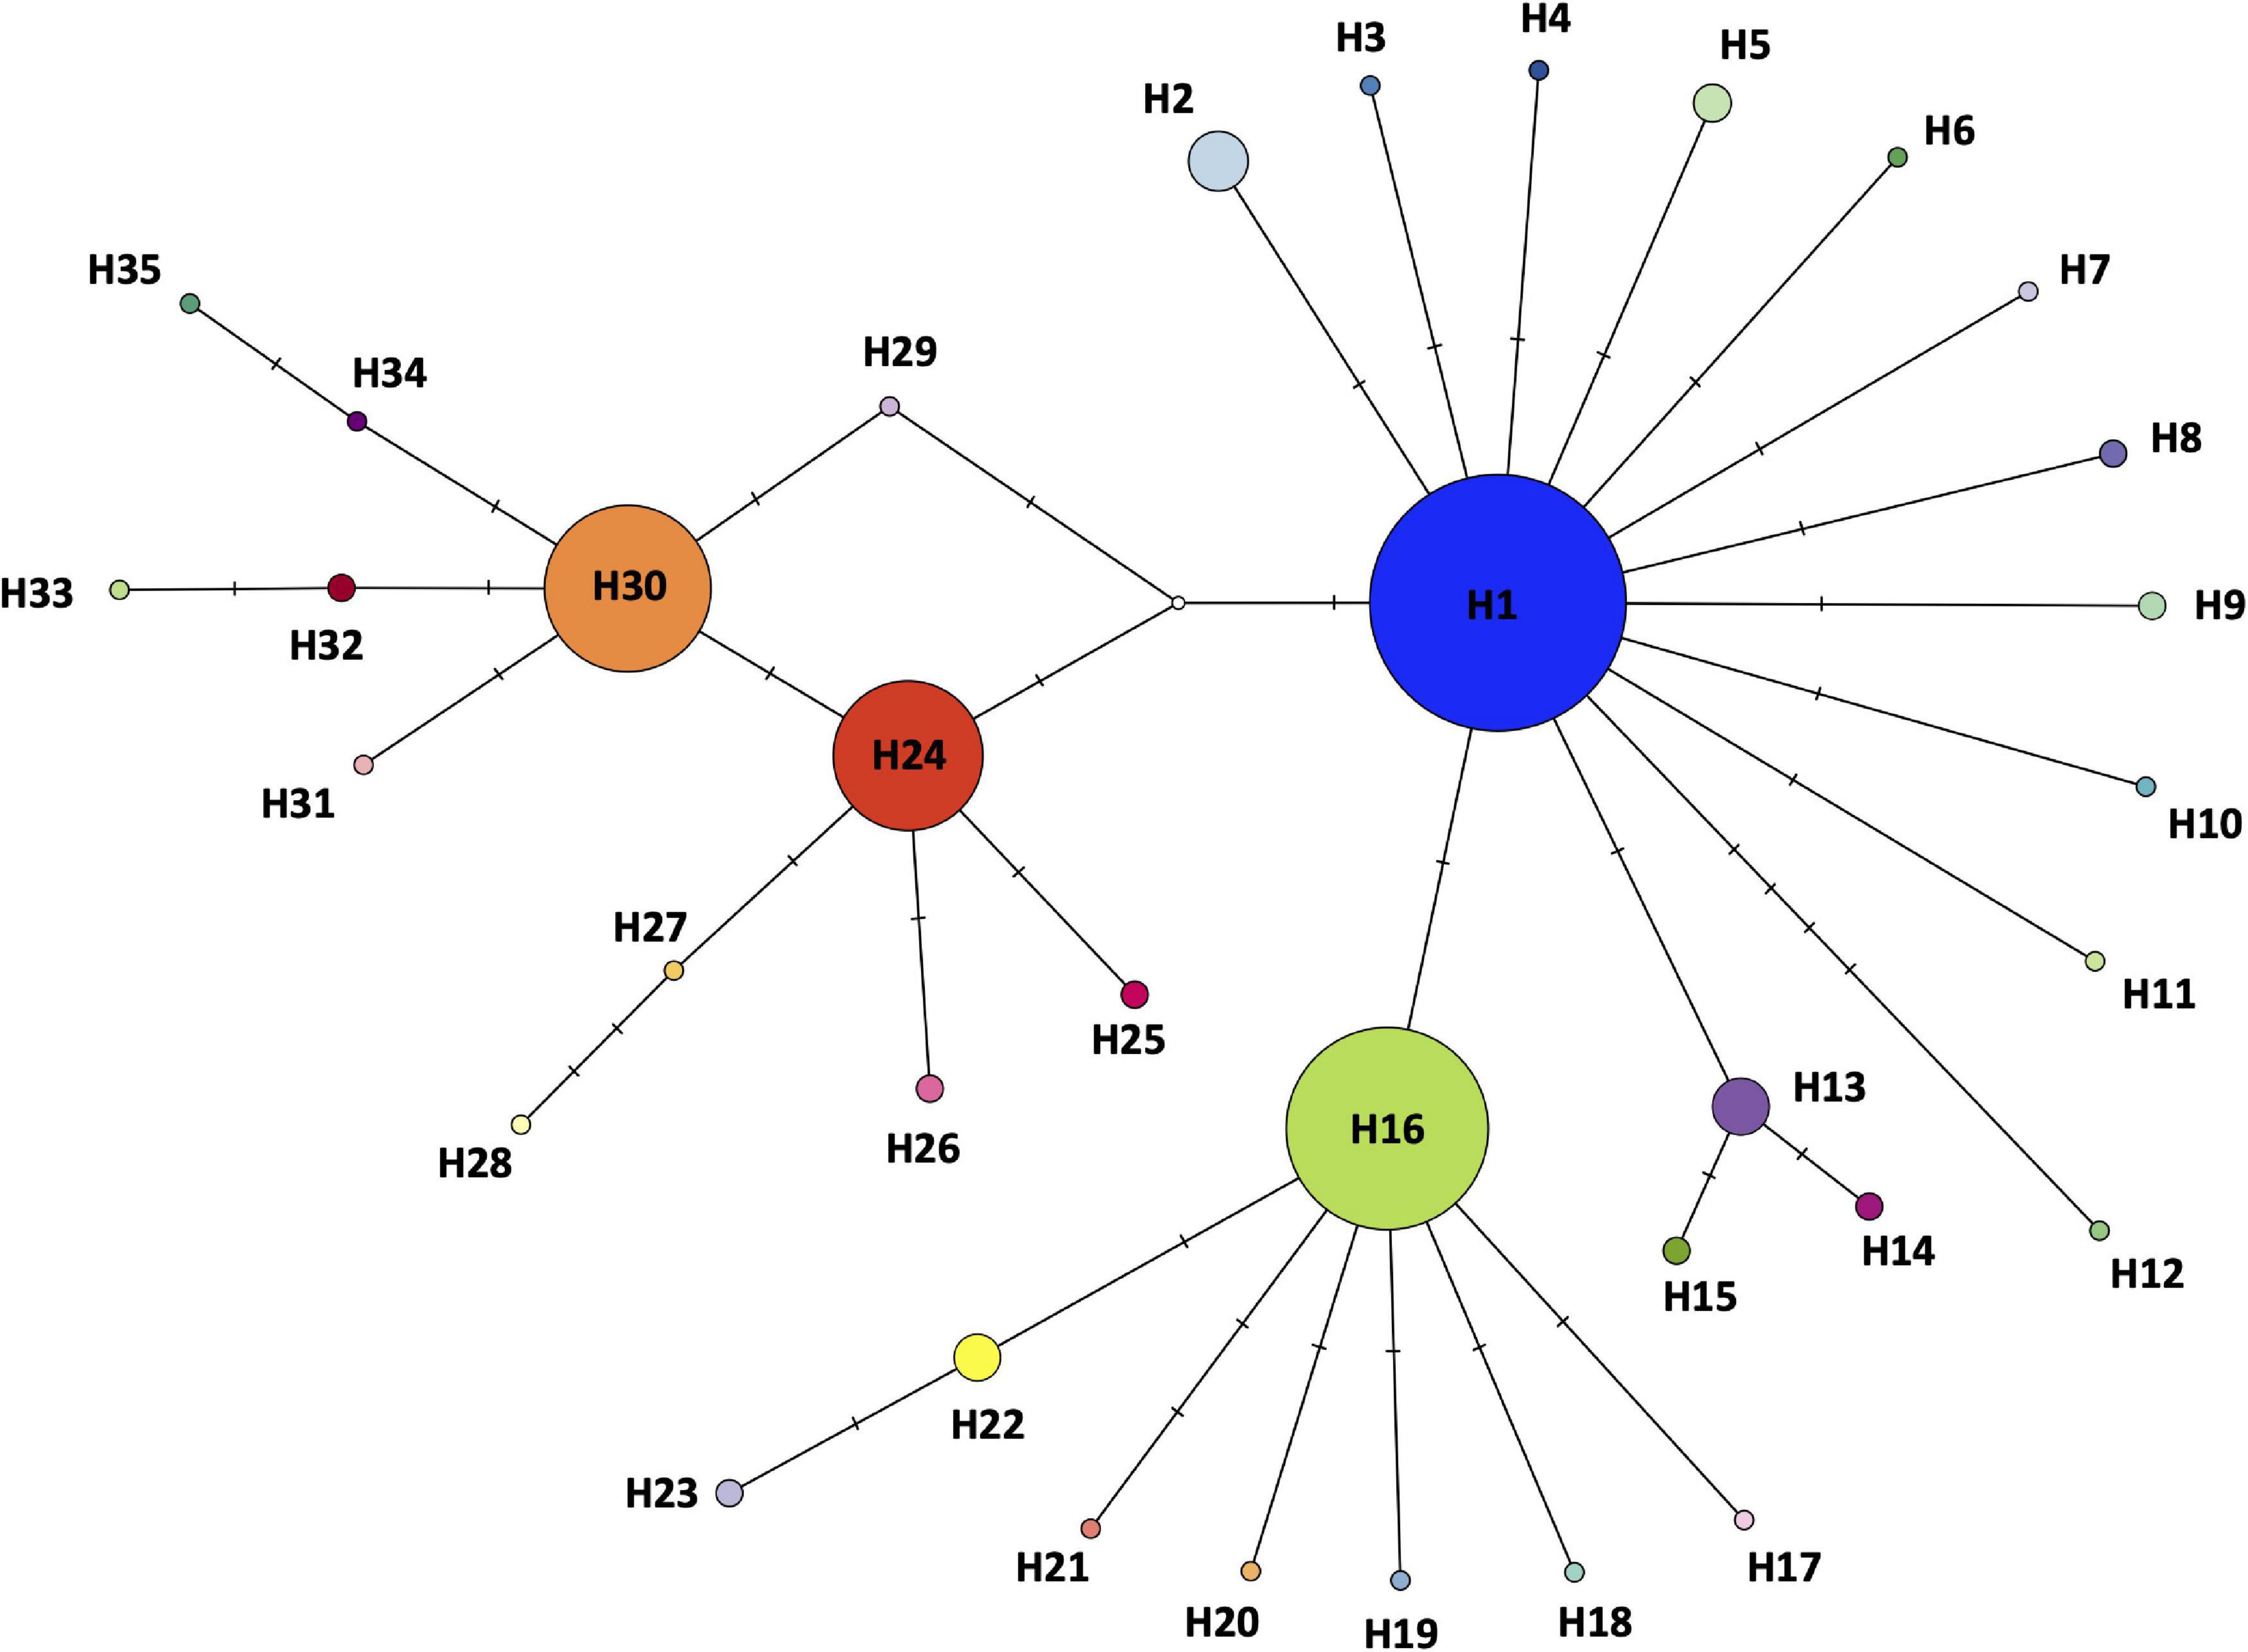
Figure 4. Haplotype network based on concatenated mitochondrial 16S rRNA and COI genes sequences, generated by statistical parsimony. The area of the circles is proportional to the number of specimens sharing haplotype. Mutation steps between haplotypes are shown as hatch marks (Supplementary Appendix 2).
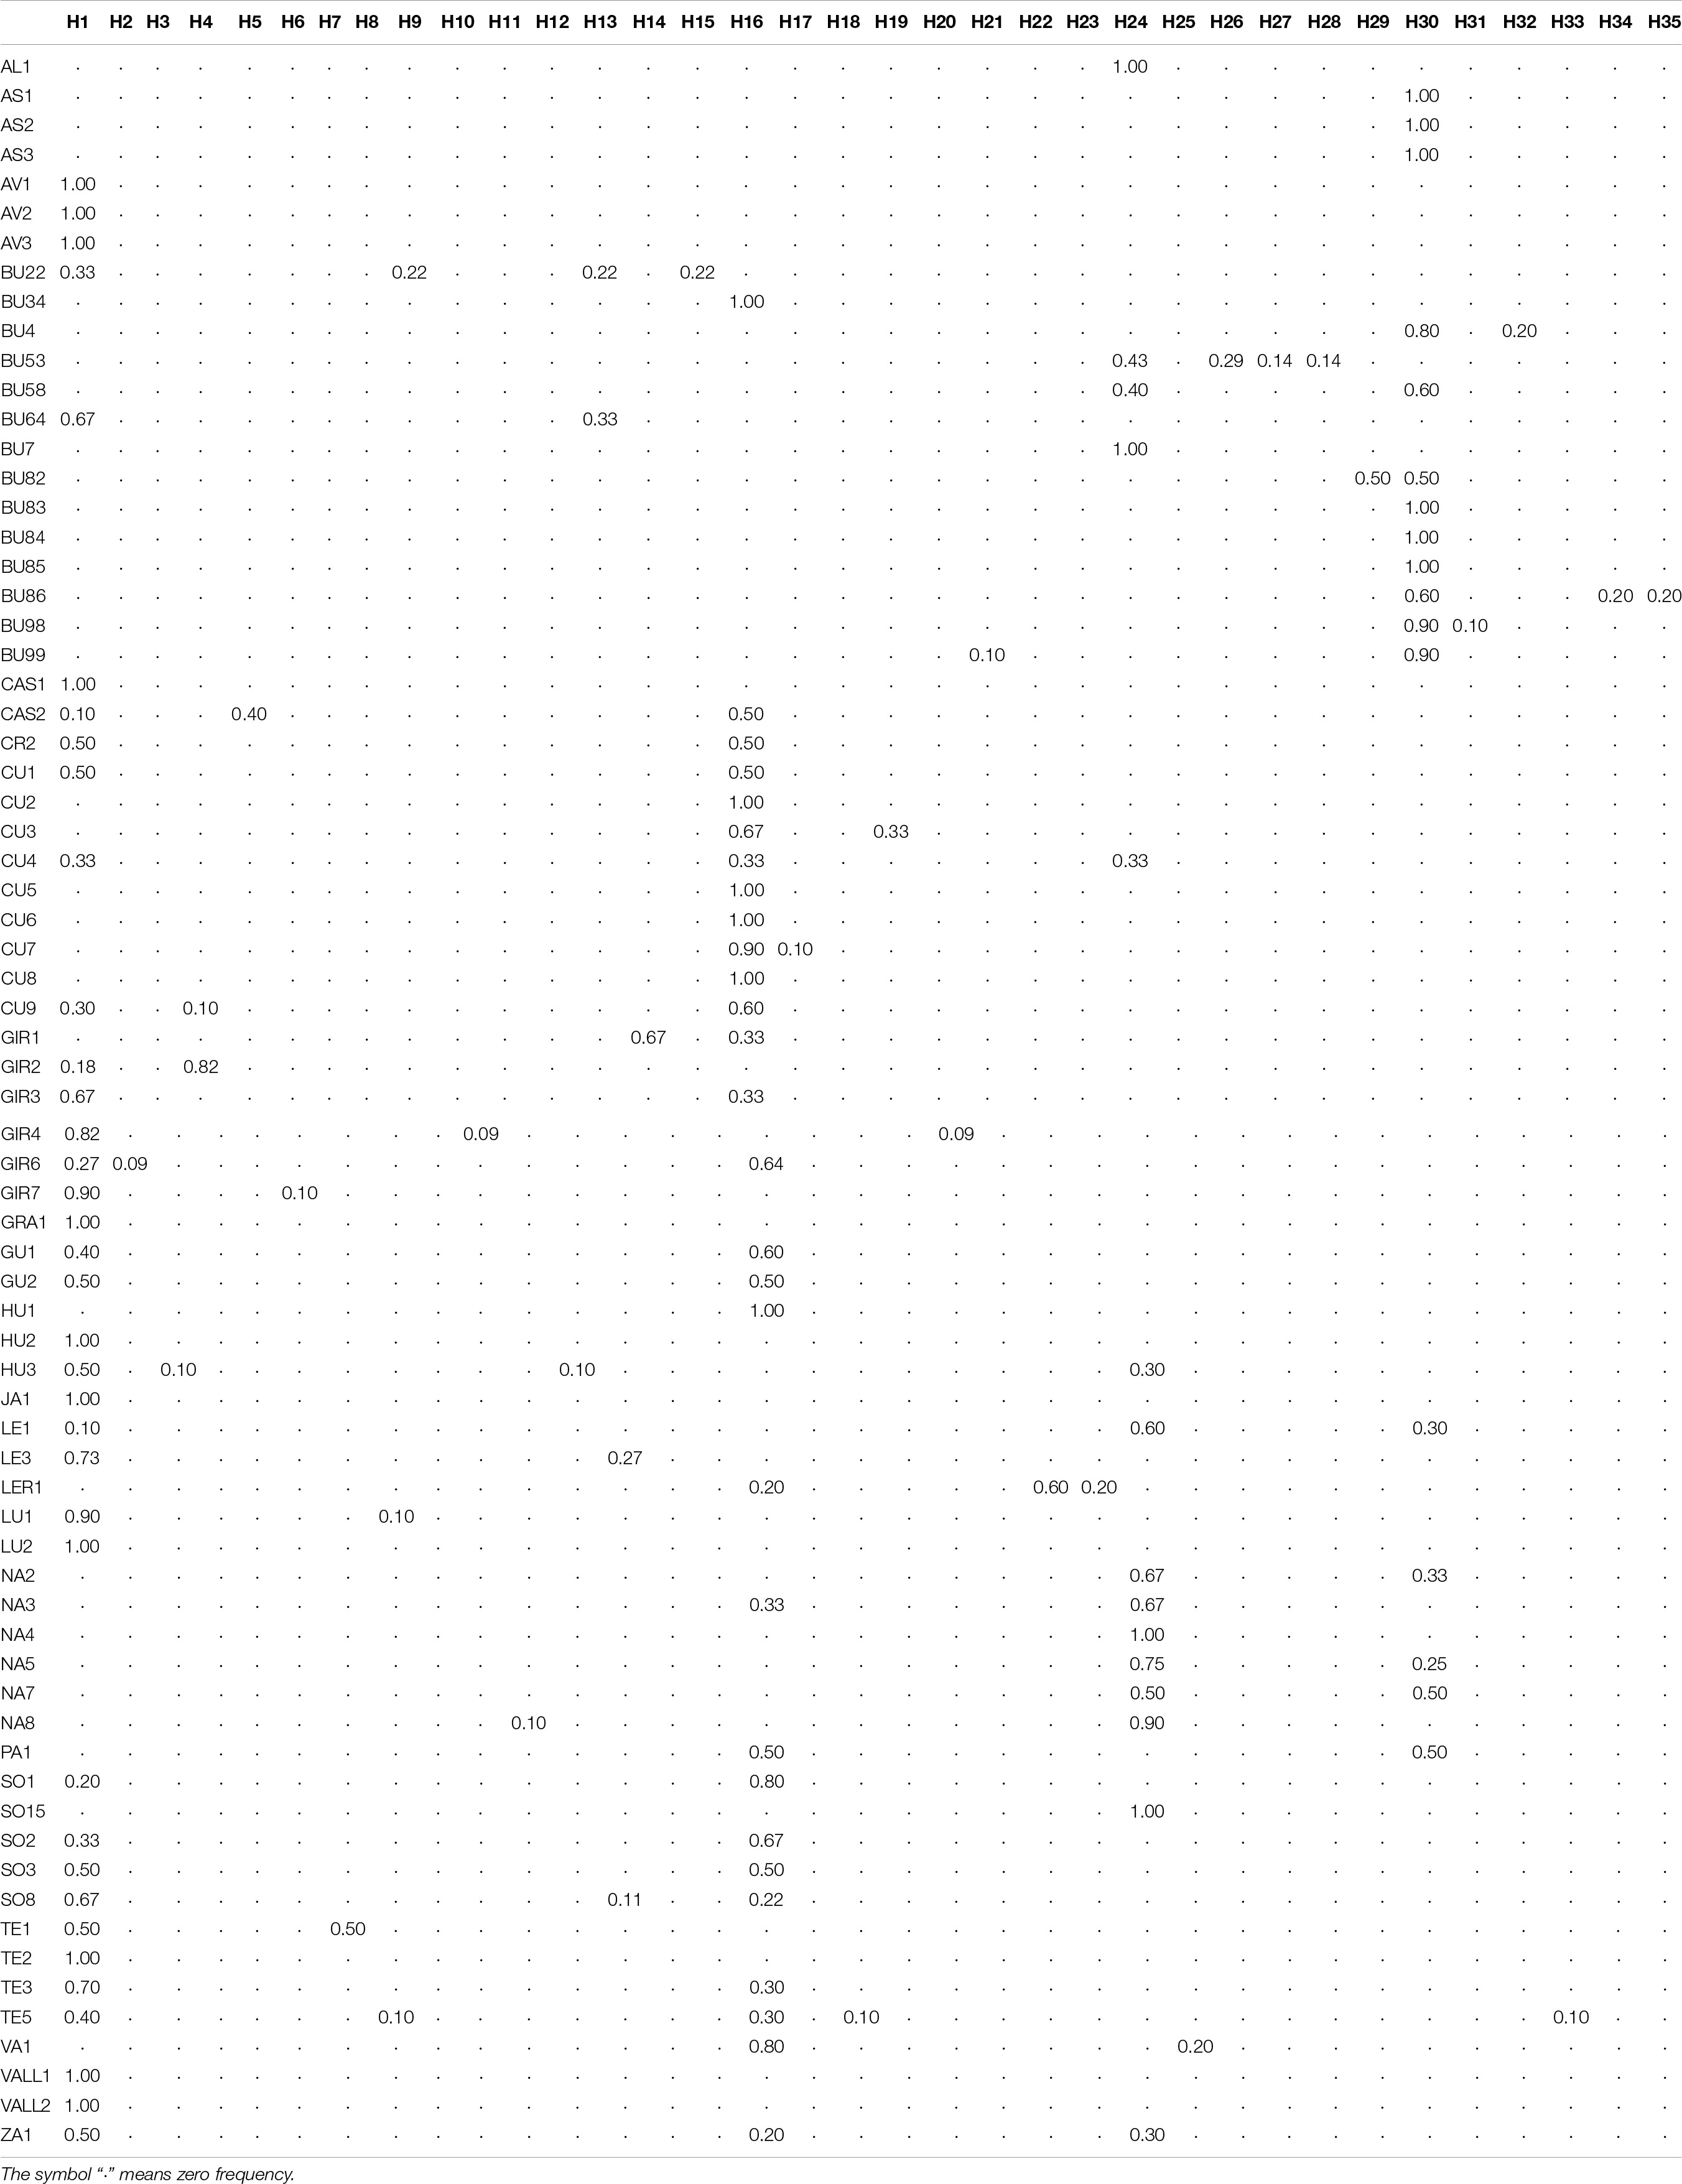
Table 2. Frequency of the haplotypes found in the 71 analyzed populations (the population’s code is detailed in Table 1).
The 71 Iberian WCC populations hosted 35 haplotypes, representing a noteworthy mean haplotype diversity (Hd = 0.775), but low nucleotide diversity (π = 0.00073). We found that 27 out of the 71 populations were monomorphic for one of four different haplotypes (H1, H16, H24, or H30). The highest number of haplotypes per population was found in TE5 with five haplotypes (H1, H8, H16, H18, and H33), followed by other three populations hosting four different haplotypes each: BU22 (H1, H9, H13, and H15), BU53 (H24, H26, H27, and H28), and HU3 (H1, H3, H12, and H24) (Table 1). These four populations hosted a high haplotype diversity (HdTE5 = 0.800; HdBU22 = 0.833; HdBU53 = 0.810, and HdHU3 = 0.711), and medium-high nucleotide diversity (πTE5 = 0.0008, πBU22 = 0.0005, πBU53 = 0.0006, and πHU3 = 0.0008) (Table 1).
Following the Iberian hydrogeographic river basins, we defined 10 hydrogeographic areas (Table 1). The results for the raw data set showed differences between the hydrogeographic areas, with the Ebro area standing out by hosting the largest number of haplotypes (18 out of 35 haplotypes). The Ebro river basin also presented the highest haplotype diversity (Hd = 0.803) and nucleotide diversity (π = 0.00082) (Table 3). Only two hydrogeographic areas (Guadalquivir and Sella) were monomorphic for two different haplotypes (H1 and H30, respectively) (Table 3). The rarefied data set for the 10 hydrogeographic areas included nine individuals per area (Table 3). There were again differences among the hydrogeographic areas, with the Ebro and Duero areas hosting five different haplotypes. Rarefied samples from the Ebro area hosted haplotypes H1, H30, H11, H16, and H22, and Duero hosted haplotypes H1, H9, H16, H24, and H30. Both presented the highest haplotype (HdEbro = 0.861 and HdDuero = 0.806) and nucleotide (πEbro = 0.001 and πDuero = 0.0007) diversities. Three hydrogeographic areas were monomorphic for two different haplotypes H1 for Guadalquivir and Miño areas, and H30 for Sella area (Table 3). Tajima’s D and Fu’s Fs were non-significant (p > 0.05) for the 10 hydrogeographic areas in both raw and rarefied data, indicating no evidence of recent demographic expansion within these grouping structures (Table 3).
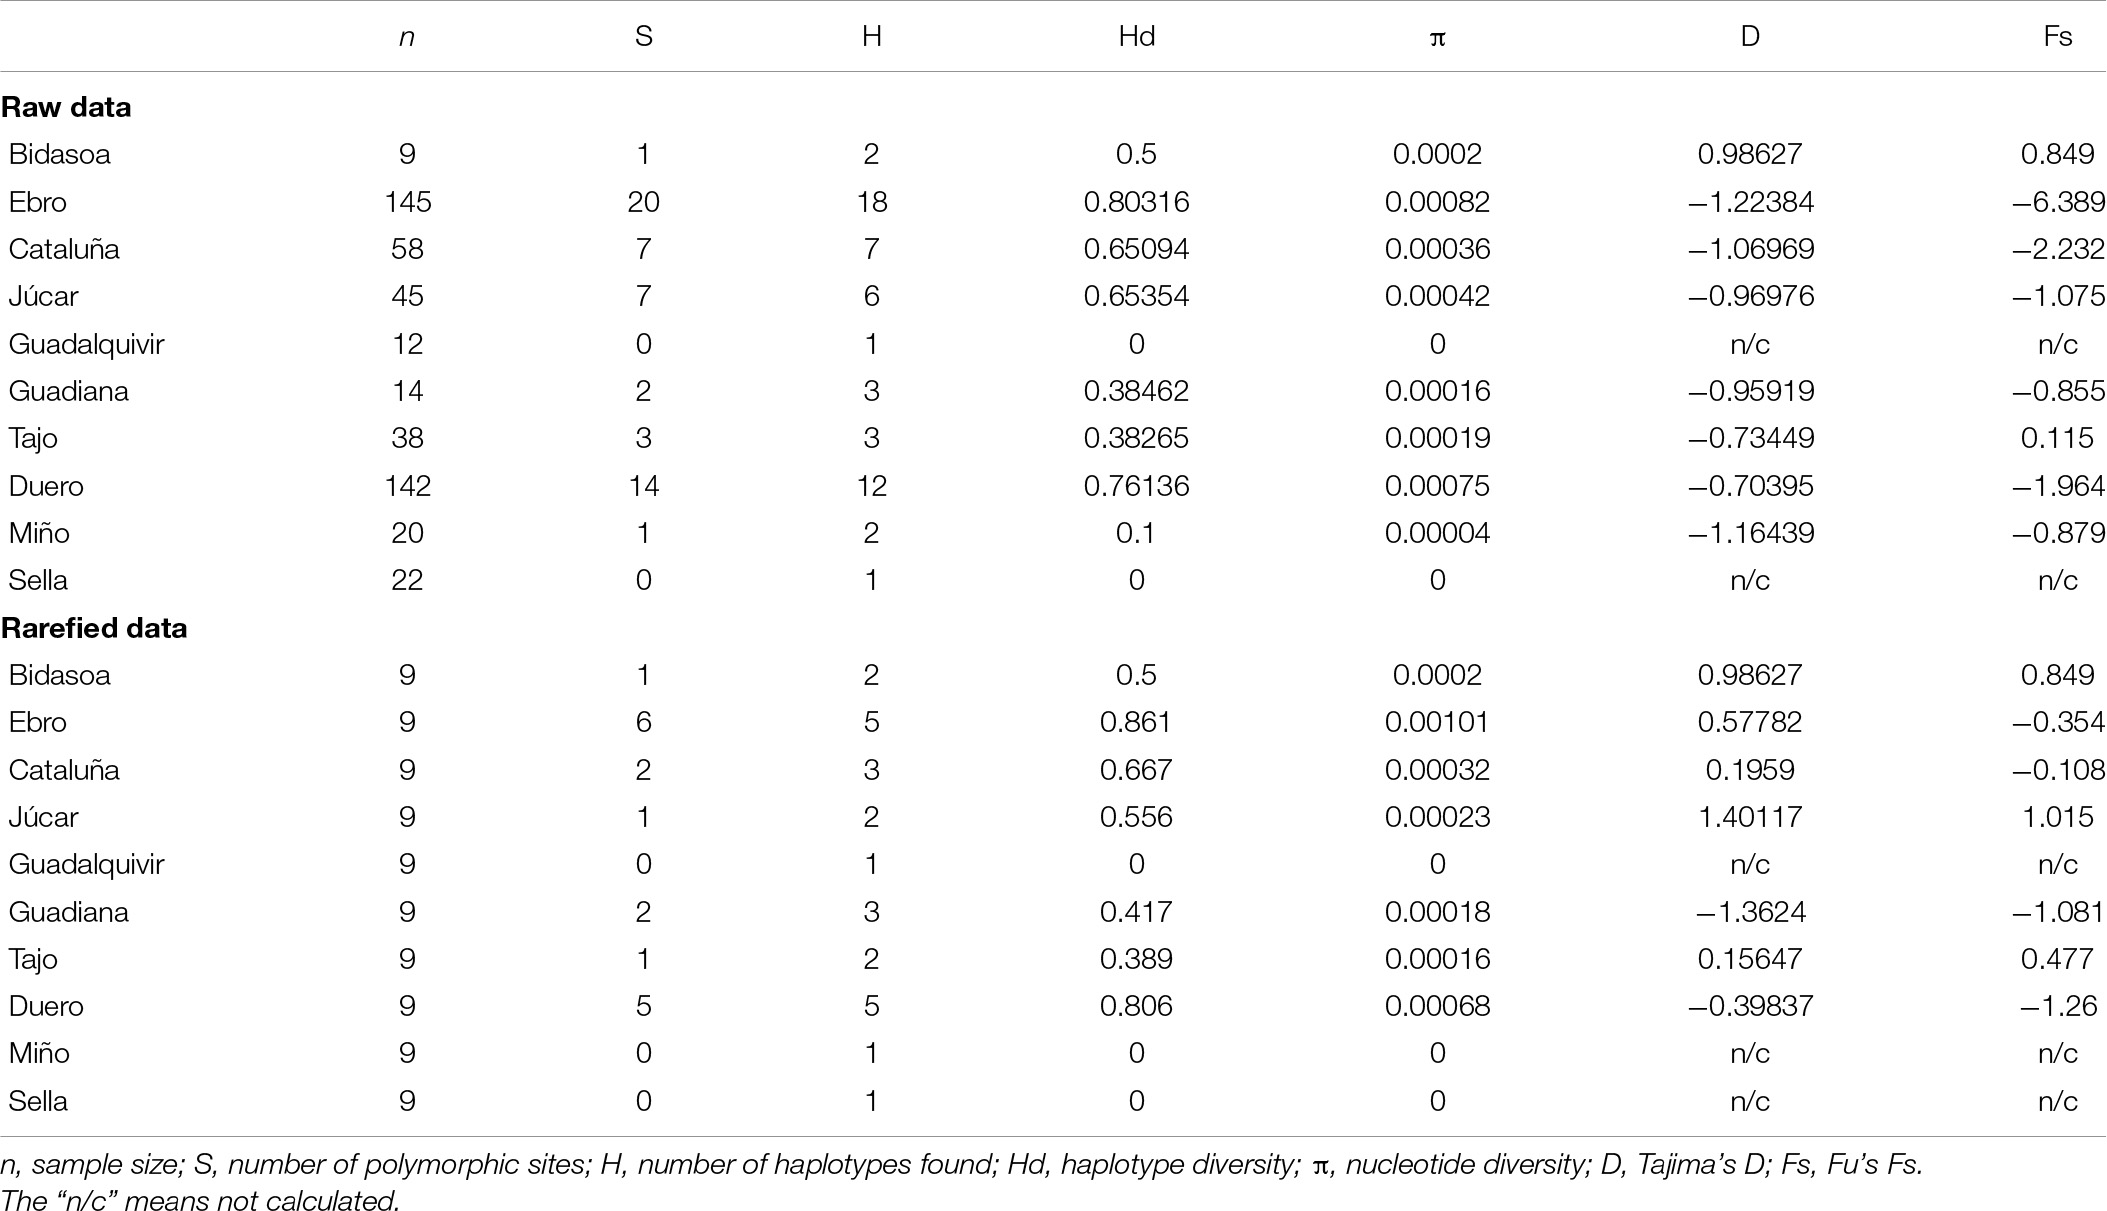
Table 3. Genetic diversity within white-clawed crayfish hydrogeographic catchments in the Iberian Peninsula for the raw and rarefied data.
Results of AMOVA analysis using the 10 hydrogeographic areas with the raw data suggested more genetic differentiation among populations within hydrogeographic areas (52.58% of variation, p < 0.0001) than between the hydrogeographic areas (20.46% of variation, p < 0.0001). The rarefied data suggested on the other hand more genetic differentiation between hydrogeographic areas (51.96% of variation, p < 0.0001), although they also showed high genetic differentiation among populations within hydrogeographic areas (31.08% of variation, p < 0.03). Fixation indices FST and FSC presented medium/high scores for the raw data (FST = 0.73032 and FSC = 0.66096) and rarefied data (FST = 0.83034 and FSC = 0.64684) showing visible genetic differentiation within populations and among populations within hydrogeographic areas. On the other hand, the fixation indices found no noteworthy differentiation among hydrogeographic areas, being bigger for the rarefied than for the raw data (FCT–RAW = 0.20456 and FCT–RAREFIED = 0.51959).
According to the third grouping structure, we defined three phylogeographic areas, one grouping most of the localities from the Center and East of the Iberian Peninsula (Group 1), and two in the North (Group 2 and Group 3) (Figure 3). The results for the raw data set showed differences among three phylogeographic areas, with the Group 1 hosting 28 out of 35 haplotypes [haplotype diversity (Hd) = 0.636, and nucleotide diversity (π) = 0.00038, and no monomorphic groups for any of the locations] (Table 4). The rarefied data set for each of the three phylogeographic areas included 62 individuals per basin (Table 4). None of the groups were monomorphic, and there were differences among them, with the Group 1 also hosting the largest set of haplotypes (9 out of a total of 18), with the highest haplotype (Hd = 0.646) and nucleotide (π = 0.00039) diversities. Values for Tajima’s D and Fu’s Fs were significant (p < 0.05) for the three phylogeographic areas for both raw and rarefied data, with the exception of Tajima’s D on rarefied data from Group 1. These significances indicated an evidence of recent demographic expansions within each of these three groups.
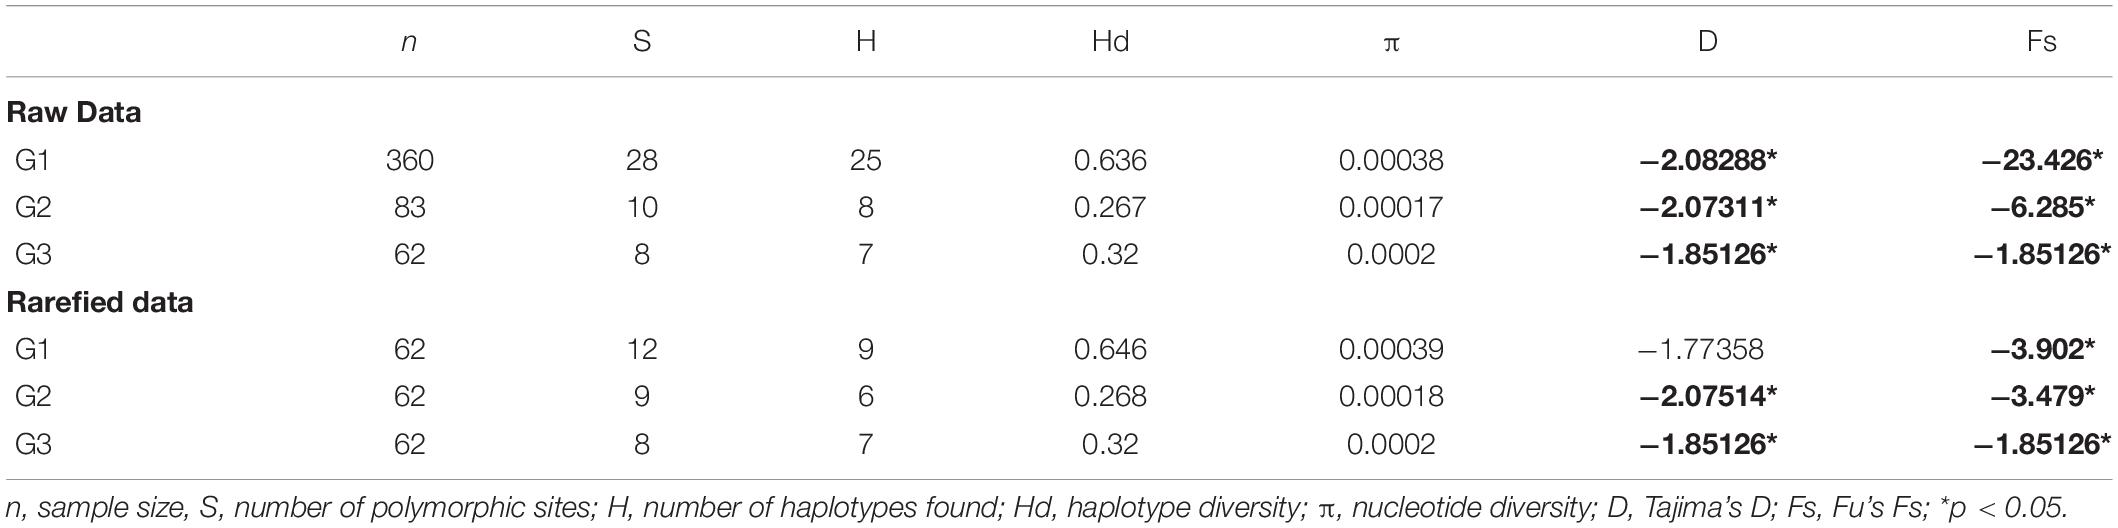
Table 4. Genetic diversity within white-clawed crayfish SAMOVA groups in the Iberian Peninsula for the raw and rarefied data.
Results of the AMOVA analysis using the three phylogeographic areas suggested more genetic differentiation among phylogeographic areas for both raw and rarefied data (73.01% of variation, p < 0.0001 for raw data, and 73.80% of variation, p < 0.0001 for rarefied data). Moreover, the variation within populations was noticeable (16.91% of variation, p < 0.0001 for raw data and 18.23% of variation, p < 0.0001 for rarefied data). Fixation indices differed, presenting FST high values for the raw data (FST = 0.83091) and rarefied data (FST = 0.81768), but lower FSC values for the raw data (FSC = 0.37358) and rarefied data (FSC = 0.30425), showing a visible genetic differentiation within populations but not among populations within three phylogeographic areas. On the other hand, the fixation indices found a statistically significant differentiation (p < 0.05) among the three phylogeographic areas for both raw and rarefied data (FCT–RAW = 0.73007 and FCT–RAREFIED = 0.73796).
Discussion
As far as we know, this work represents the most complete and updated approximation of the WCC genetic diversity in the Iberian Peninsula. The results obtained complete and confirm the historical scenario proposed by previous studies on the genetic diversity of the WCC (Pedraza-Lara et al., 2010; Jelić et al., 2016; Matallanas et al., 2016), but also reveal new patterns of genetic diversity and phylogeographic structure. The phylogeographic approach used here, which incorporates samples from previously unexplored areas, has allowed us to find a higher genetic variation in the WCC than previously reported and also identifies new private haplotypes in the Iberian Peninsula. Moreover, the results regarding the origin of the genetic diversity and its phylogeographic structure do not support the hypothesis of an introduction from Italy in the 17th century (Vedia and Miranda, 2013; Clavero et al., 2016), and, instead, strongly suggest a native origin of the WCC in the Iberian Peninsula.
Genetic variation found within Iberian WCC populations is strongly structured geographically. The results from this phylogenetic approach, also supports the scenario proposed by Pedraza-Lara et al. (2010) and Jelić et al. (2016) for the Iberian A. i. italicus populations within the European area. In these scenarios, the Iberian lineages grouped together with populations from Austria, Italy and South France. This group is closely related to the A. i. carsicus, which occurs in Croatia and Italy, and phylogenetically separated from the Central European WCC populations. Following these previous studies and the results in here, the existing genetic differentiation between Central and Southern Europe WCC populations would be of Pleistocenic/Holocenic origin, and might be related to the climate oscillations and glaciations, including the phylogeographic and demographic effects of the ice sheet presence during and after the Last Glacial Maximum (LGM) (Hewitt, 2000, 2004). The fact that Central regions of Europe were glaciated during the LGM led many species to remain isolated in the Southern glacial refugia, i.e., the Iberian, Italian, and Balkan Peninsulas. Besides the presence of the ice itself, the LGM also entailed drastic changes in temperature, droughts, desertification, and large drops in the sea levels changes, that might have shaped the range area in WCC. The distribution of A. i. italicus follows a Circum-Mediterranean distribution. This distribution is also found in other freshwater species (Perea et al., 2010) associated with the isolation in glacial refugia during the LGM, and/or with ancient paleogeography events. For instance, the Alps orogenesis during the late Miocene until the Pleistocene had isolated the Iberian Peninsula from Central Europe and prevented most Mediterranean freshwater species, such as the European cyprinids, to move northward (Zardoya and Doadrio, 1999; Perea et al., 2010).
The phylogenetic analyses for the Iberian WCC populations showed a basal polytomy, indicating non-solved phylogenetic relationships among them. Although some well-supported grouping are presented, more molecular markers would be necessary to identify evolutionary lineages and their relationships. These results agree with the previous assignation of Pedraza-Lara et al. (2010) and Matallanas et al. (2016) for the Iberian populations. On the other hand, we confirmed the utility of these mitochondrial markers that revealed variability patterns not found in previous studies (Toon et al., 2009). The combination of a greater sampling effort and the use of these two regions revealed a total of 35 haplotypes, 16 of which were new for the Iberian Peninsula, while Matallanas et al. (2016) found 19 haplotypes using the same 16S and COI genes.
In addition, we found a strong phylogeographic structure in the Iberian populations. Previous studies designated two phylogeographic areas, while we found three genetically and geographically differentiated areas. Thus, we found two areas in the North (North-Central and North-Western) represented by two main haplotypes, H24 and H30, respectively. This matches with the differentiation and structure found in other terrestrial and aquatic species, such as Salamandra salamandra (García-París et al., 2003), Ichthyosaura alpestris (Recuero et al., 2014) or Lissotriton helveticus (Recuero and García-París, 2011). During the LGM, strong range shifts and bottlenecks occurred and they probably played a key role in Iberian WCC populations. Although the Northern regions of the Iberian Peninsula were mostly covered with ice, glaciers remained confined within the mountain systems and did not reach the surrounding lowlands (Oliva et al., 2019). As a consequence, a number of unglaciated habitats are believed to have acted as refugia for several species (Gómez and Lunt, 2007). The identification of private haplotypes in this area could indicate that these WCC populations were geographically limited and isolated in these regions, as it occurred to other species (Hewitt, 2000). A significant postglacial expansion of these endemic haplotypes might have occurred from several populations during favorable climate periods (Hewitt, 2004). Moreover, the genetic results and the shape of the haplotype network indicated an evidence of recent demographic expansions within these two groups. These results are consistent with those of Matallanas et al. (2016), in which molecular estimations dated last WCC population expansion back to Pleistocene.
The third phylogeographic area that comprises Central-Eastern and the westernmost Iberian populations, suggested another expansion event. The evidences from the significant results obtained in the genetic diversity analysis, as well as the star-like haplotype network showed another demographic expansion, and also reflect the possibility of another LGM-refugium. The Central-Eastern area is also represented by two main haplotypes, H1 and H16. During the LGM, these populations could have persisted in Southern areas of the Iberian Peninsula in absence of geographical or climate barriers. As evidenced by the analyses and the samples studied, these two main haplotypes could represent ancestral haplotypes: H1 (the most frequent), and H16 (only separated by one mutational step from H1). Besides, the H1 has been found in other European populations (Jelić et al., 2016; Matallanas et al., 2016). The Central-Eastern area could have had an earlier expansion than that of the Northern areas, since this area was not covered by ice during the LGM and thus, in absence of barriers, crayfish could have expanded over long distances to some extent (Robinson et al., 2000), and a better climate would have favored it. However, the unequal sampling of the specimens within the studied populations seem to have favored higher frequencies of the H1 and H16 haplotypes, so this statement must be taken with caution. Furthermore, the low genetic diversity found within the WCC southern areas could be explained by the introduction of the North American crayfish species P. clarkii and P. leniusculus during the 1970s (Alonso et al., 2000; Martín-Torrijos et al., 2019). These North American crayfish are natural carriers of the crayfish plague pathogen A. astaci (Martín-Torrijos et al., 2021) and responsible for the decline of the Iberian WCC until nowadays. In particular, by the end of the 1990s the Southern WCC populations almost had disappeared in the Iberian Peninsula (Alonso et al., 2000; Martín-Torrijos et al., 2019).
The current genetic diversity found in Iberian Peninsula may have been shaped by the LGM, as suggested above and in previous studies. The extensive sampling of this study has allowed us to find the greatest haplotype and nucleotide diversities so far reported for the Iberian WCC populations (Matallanas et al., 2016). We should point out, however, that 27 populations were monomorphic. These monomorphic populations were represented by the four most common haplotypes (H1, H16, H24, and H30). This agrees with the strong phylogeographic structure found. In contrast, the most diverse phylogeographic area was the Central-Eastern. This contains populations highly diverse that are located in the provinces of Burgos, Teruel and Huesca. This high genetic variation found within these populations coincides with the historical records of dense populations of WCC described (Alonso et al., 2000). This abundance evidences the importance that crayfish fisheries used to have in local economies of rural Iberian areas. By 1964, Spanish legislation already had regulated the size, amount of crayfish and the fishing gear allowed for the fishing activities (Torre Cervigón and Rodríguez Marqués, 1964). This regulation might have helped to avoid the overexploitation of the resource, maintaining most of the genetic diversity that remains nowadays. Although recent human translocations might have influenced the current Iberian crayfish distribution, there is, still, a strong phylogeographic structure. During the past years, several authors have suggested that the origin of the Iberian populations might have been the result of an Italian crayfish translocation during the 17th century (Vedia and Miranda, 2013; Clavero et al., 2016). However, the results obtained in the present study show a greater genetic diversity than that described in previous studies, and indicate that is highly structured and difficult to attribute to a 17th century translocation from Italy. Therefore, our results support the native origin of the WCC in the Iberian Peninsula. Moreover, the rapid impact of the crayfish plague during the 1970s’ dramatically reduced the number of Iberian WCC populations in less than 2 years (Alonso et al., 2000). These massive declines might have extinguished highly diverse WCC populations, and what we actually come across is a small fraction of its original genetic diversity. In addition, the enormous extinctions due to the crayfish plague may have driven Iberian WCC populations to suffer inbreeding, bottlenecks and genetic drift. Currently, the difficulty of obtaining samples due to the threatened status of the WCC made us to use different number of individuals from each of the analyzed populations. The reduced number of samples obtained from some of the populations revealed the appearance of rare private haplotypes in low frequencies. These rare haplotypes may represent a reflect of the remaining biodiversity within WCC populations.
In addition, the delimited phylogeographic areas seem to explain better the genetic diversity of the Iberian WCC populations. The AMOVA analysis showed more genetic differentiation among the three phylogeographic areas and a slight genetic differentiation among populations within these areas. This suggests substantial gene flow among populations from the same phylogeographic areas. On the other hand, the reduced population sites, the geographical distribution, and the pressure over the remaining Iberian WCC populations by the continuous threat by crayfish plague, for instance, might be favoring their isolation and hindering the gene flow between them. Thus, the unique genetic diversity represented by private haplotypes, which is found in low frequencies, would remain in the same populations instead of being transferred to proximal populations.
Current populations are a remain of what Iberian WCC populations used to be. The massive extinction events that Iberian WCC have been suffering during the past 45 years due to the introduction of North American invasive crayfish carrying the crayfish plague (Martín-Torrijos et al., 2019), and intensive harvesting, might have had irreversible effects on the Iberian WCC genetic diversity. Thus, the majority of the ancient Iberian WCC genetic variation might be already extinct. The reduction of the genetic diversity, and consequently their adaptive potential (Boulding, 2008; Jump et al., 2009), could increase the species extinction risk. To preserve the maximum genetic diversity, we recommend that current conservation and management programs for the WCC in the Iberian Peninsula should consider the patterns of genetic diversity found in this study. Thus, we propose that the three phylogeographic areas revealed in this study should be considered as essential management units to preserve the genetic diversity that characterized them. Furthermore, conservation actions that include breeding and re-stocking programs should consider for each specific area not only the most common but also the private haplotypes. This will certainly help to preserve the unique genetic pool from the endangered Iberian WCC populations.
Data Availability Statement
The datasets presented in this study can be found in online repositories. The names of the repository/repositories and accession number(s) can be found in the article/Supplementary Material.
Author Contributions
LM-T contributed to the design, with the laboratory work, and wrote the manuscript. DB, ID, AM, and JD-U contributed to the supervision of the manuscript and wrote the manuscript. All authors contributed to the article and approved the submitted version.
Funding
We would like to acknowledge support of the publication fee by the CSIC Open Access Publication Support Initiative through its Unit of Information Resources for Research (URICI). JD-U was supported from Project CGL2016-80526-R of the Ministerio de Economía y Competitividad, Spain, and LM-T was supported LIFE MedWetRivers (LIFE11 NAT/ES/000699) and LIFE Potamo Fauna (LIFE12 NAT/ES/001091). This study was also supported by Gobierno de Navarra (20153614 and 20166383), Junta de Comunidades de Castilla-La Mancha (20153074 and 20166103), Gobierno de Aragón (20153608; 20171065 and 20171106), and La Agencia de Medio Ambiente y Agua de Andalucía (20091163).
Conflict of Interest
The authors declare that the research was conducted in the absence of any commercial or financial relationships that could be construed as a potential conflict of interest.
Publisher’s Note
All claims expressed in this article are solely those of the authors and do not necessarily represent those of their affiliated organizations, or those of the publisher, the editors and the reviewers. Any product that may be evaluated in this article, or claim that may be made by its manufacturer, is not guaranteed or endorsed by the publisher.
Acknowledgments
We would like to thank the assistance in providing us with crayfish samples and information to Jokin Larumbe (Gobierno de Navarra); Fernando Alonso and Javier Valenciano (Junta de Comunidades de Castilla-La Mancha), Sara Lapesa (Gobierno de Aragón), Joan Montserrat (Parque Natural La Garrotxa, Catalunya), Lluis Benejam (CEBCAT-La Balca S. L.), Antonio Pradillo (CCEDCV—EL PALMAR, Generalitat Valenciana), Juan María Herrero (Junta de Castilla y León), Jon Zulaika (Diputación de Gipuzkoa, País Vasco), Borja Nebot (Junta de Andalucía), and Javier Galindo (Agencia Medio Ambiente y Agua de Andalucía). We would also like to thank Marta Higuera and Emilio Cano from the Real Jardín Botánico–Consejo Superior de Investigaciones Científicas (RJB-CSIC) for their technical assistance.
Supplementary Material
The Supplementary Material for this article can be found online at: https://www.frontiersin.org/articles/10.3389/fevo.2021.669292/full#supplementary-material
References
Akhan, S., Bektas, Y., Berber, S., and Kalayci, G. (2014). Population structure and genetic analysis of narrow-clawed crayfish (Astacus leptodactylus) populations in Turkey. Genetica 142, 381–395. doi: 10.1007/s10709-014-9782-5
Aldabe, J., Esquizabel, J. I., Fernández, M. J., Iruzun, J. C., Mendia, F., Rueda, F., et al. (1991). Estudio de Distribución y Abundancia de Las Especies de Cangrejo Presentes En Ríos Navarros. Documento Interno Del Servicio de Medio Ambiente Del Gobierno de Navarra. Pamplona: Gobierno de Navarra.
Alonso, F., Temiño, C., and Diéguez-Uribeondo, J. (2000). Status of the white-clawed crayfish, Austropotamobius pallipes (Lereboullet, 1858), in Spain: distribution and legislation. Bull. Fr. Pêche piscic. 356, 31–53. doi: 10.1051/kmae:2000003
Beroiz, B., Callejas, C., Alonso, F., and Ochando, M. D. (2008). Genetic Structure of Spanish white-clawed crayfish (Austropotamobius pallipes) populations as determined by RAPD analysis: reasons for optimism. Aquat. Conserv. Mar. Freshw. Ecosyst. 18, 190–201. doi: 10.1002/aqc.829
Bláha, M., Uzhytchak, M., Bondarenko, V., and Policar, T. (2017). The least known European native crayfish Astacus pachypus (Rathke, 1837) revealed its phylogenetic position. Zool. Anz. 267, 151–154. doi: 10.1016/j.jcz.2017.03.001
Boulding, E. G. (2008). “Genetic diversity, adaptive potential, and population viability in changing environments,” in Fox conservation biology: evolution in action, ed. S. C. Carroll (New York: Oxford University Press), 199–219.
Chiesa, S., Scalici, M., Negrini, R., Gibertini, G., and Nonnis Marzano, F. (2011). Fine-scale genetic structure, phylogeny and systematics of threatened crayfish species complex. Mol. Phylogenet. Evol. 61, 1–11. doi: 10.1016/j.ympev.2011.03.031
Clavero, M., Nores, C., Kubersky-Piredda, S., and Centeno-Cuadros, A. (2016). Interdisciplinarity to reconstruct historical introductions: solving the status of cryptogenic crayfish. Biol. Rev. 91, 1036–1049. doi: 10.1111/brv.12205
Clement, M., Posada, D., and Crandall, K. A. (2000). TCS: a computer program to estimate gene genealogies. Mol. Ecol. 9, 1657–1659. doi: 10.1046/j.1365-294x.2000.01020.x
Crandall, K. A., and Fitzpatrick, J. F. (1996). Crayfish molecular systematics: using a combination of procedures to estimate phylogeny. Syst. Biol. 45, 1–26. doi: 10.1093/sysbio/45.1.1
Diéguez-Uribeondo, J., Royo, F., Souty-Grosset, C., Ropiquet, A., and Grandjean, F. (2008). Low genetic variability of the white-clawed crayfish in the Iberian Peninsula: its origin and management implications. Aquat. Conserv. Mar. Freshw. Ecosyst. 18, 19–31. doi: 10.1002/aqc.811
Dupanloup, I., Schneider, S., and Excoffier, L. (2002). A simulated annealing approach to define the genetic structure of populations. Mol. Ecol. 11, 2571–2581. doi: 10.1046/j.1365-294X.2002.01650.x
Excoffier, L., Laval, G., and Schneider, S. (2005). Arlequin (Version 3.0): An integrated software package for population genetics data analysis. Evol. Bioinform. Online 1:47.
Folmer, O., Black, M., Hoeh, W., Lutz, R., and Vrijenhoek, R. (1994). DNA primers for amplification of mitochondrial cytochrome oxidase subunit I from diverse metazoan invertebrates. Mol. Mar. Biol. Biotechnol. 3, 294–299.
Fratini, S., Zaccara, S., Barbaresi, S., Grandjean, F., Souty-Grosset, C., Crosa, G., et al. (2005). Phylogeography of the threatened crayfish (Genus Austropotamobius) in Italy: implications for its taxonomy and conservation. Heredity 94, 108–118. doi: 10.1038/sj.hdy.6800581
Füreder, L., Gherardi, F., Holdich, D., Reynolds, J., Sibley, P., and Souty-Grosset, C. (2010). Austropotamobius pallipes. The IUCN Red List of Threatened Species 2010: E.T2430A9438817. Available Online at: http://www.iucnredlist.org/details/2430/0 (accessed December 28, 2020).
García-París, M., Alcobendas, M., Buckley, D., and Wake, D. B. (2003). Dispersal of viviparity across contact zones in Iberian populations of fire salamanders (Salamandra) inferred from discordance of genetic and morphological traits. Evolution 57, 129–143. doi: 10.1111/j.0014-3820.2003.tb00221.x
Gómez, A., and Lunt, D. H. (2007). “Refugia within refugia: patterns of phylogeographic concordance in the Iberian Peninsula,” in Phylogeography of Southern European refugia: evolutionary perspectives on the origins and conservation of European biodiversity, eds S. Weiss and N. Ferrand (Dordrecht: Springer Netherlands), 155–188. doi: 10.1007/1-4020-4904-8_5
Gopurenko, D., Hughes, J. M., and Keenan, C. P. (1999). Mitochondrial DNA evidence for rapid colonisation of the Indo-West Pacific by the mudcrab Scylla serrata. Mar. Biol. 134, 227–233. doi: 10.1007/s002270050541
Grandjean, F., Bouchon, D., and Souty-Grosset, C. (2002). Systematic of the European endangered crayfish species Austropotamobius pallipes (Decapoda: Astacidae) with a re-examination of the status of Austropotamobius berndhauseri. J. Crust. Biol. 22, 677–681. doi: 10.1651/0278-0372(2002)022[0677:soteec]2.0.co;2
Grandjean, F., Gouin, N., Souty-Grosset, C., and Diéguez-Uribeondo, J. (2001). Drastic bottlenecks in the endangered crayfish species Austropotamobius pallipes in Spain and implications for its colonization history. Heredity 86, 431–438. doi: 10.1046/j.1365-2540.2001.00849.x
Grandjean, F., Harris, D. J., Souty-Grosset, C., and Crandall, K. A. (2000). Systematics of the European endangered crayfish species Austropotamobius pallipes (Decapoda: Astacidae). J. Crust. Biol. 20, 522–529. doi: 10.1651/0278-0372(2000)020[0522:soteec]2.0.co;2
Hasegawa, M., Kishino, H., and Yano, T. (1985). Dating of the human-ape splitting by a molecular clock of mitochondrial DNA. J. Mol. Evol. 22, 160–174. doi: 10.1007/bf02101694
Hewitt, G. M. (2000). The genetic legacy of the Quaternary ice ages. Nature 405, 907–913. doi: 10.1038/35016000
Hewitt, G. M. (2004). Genetic consequences of climatic oscillations in the Quaternary. Philos. Trans. R. Soc. Lond. 359, 183–195. doi: 10.1098/rstb.2003.1388
IUCN. (2021). The IUCN Red List of Threatened Species. Version 2021-1. Available Online at: https://www.iucnredlist.org (accessed July 28, 2021).
Jelić, M., Klobučar, G. I. V., Grandjean, F., Puillandre, N., Franjević, D., Futo, M., et al. (2016). Insights into the molecular phylogeny and historical biogeography of the white-clawed crayfish (Decapoda, Astacidae). Mol. Phylogenet. Evol. 103, 26–40. doi: 10.1016/j.ympev.2016.07.009
Jukes, T. H., and Cantor, C. R. (1969). “Evolution of Protein Molecules,” in Mammalian Protein Metabolism, ed. H. N. Munro (New York: Academic Press), 21–132. doi: 10.1016/b978-1-4832-3211-9.50009-7
Jump, A. S., Marchant, R., and Penuelas, J. (2009). Environmental change and the option value of genetic diversity. Trends Plant Sci. 14, 51–58. doi: 10.1016/j.tplants.2008.10.002
Jussila, J., Edsman, L., Maguire, I., Diéguez-Uribeondo, J., and Theissinger, K. (2021). Money kills native ecosystems: European crayfish as an example. Front. Ecol. Evol. 9:648495. doi: 10.3389/fevo.2021.648495
Katoh, K., Misawa, K., Kuma, K., and Miyata, T. (2002). MAFFT: A novel method for rapid multiple sequence alignment based on fast fourier transform. Nucleic Acids Res. 30, 3059–3066. doi: 10.1093/nar/gkf436
Kearse, M., Moir, R., Wilson, A., Stones-Havas, S., Cheung, M., Sturrock, S., et al. (2012). Geneious basic: an integrated and extendable desktop software platform for the organization and analysis of sequence data. Bioinformatics 28, 1647–1649. doi: 10.1093/bioinformatics/bts199
Lanfear, R., Frandsen, P. B., Wright, A. M., Senfeld, T., and Calcott, B. (2016). PartitionFinder 2: new methods for selecting partitioned models of evolution for molecular and morphological phylogenetic analyses. Mol. Biol. Evol. 34, 772–773. doi: 10.1093/molbev/msw260
Largiadèr, C. R., Herger, F., Lörtscher, M., and Scholl, A. (2000). Assessment of natural and artificial propagation of the white-clawed crayfish (Austropotamobius pallipes species complex) in the Alpine region with nuclear and mitochondrial markers. Mol. Ecol. 9, 25–37. doi: 10.1046/j.1365-294x.2000.00830.x
Leigh, J. W., and Bryant, D. (2015). POPART: full-feature software for haplotype network construction. Methods Ecol. Evol. 6, 1110–1116. doi: 10.1111/2041-210X.12410 doi: 10.1111/2041-210x.12410
Librado, P., and Rozas, J. (2009). DnaSP v5: a software for comprehensive analysis of DNA polymorphism data. Bioinformatics 25, 1451–1452. doi: 10.1093/bioinformatics/btp187
Lovrenčić, L., Bonassin, L., Boštjančić, L. L., Podnar, M., Jelić, M., Klobučar, G., et al. (2020). New insights into the genetic diversity of the stone crayfish: taxonomic and conservation implications. BMC Evol. Biol. 20:146. doi: 10.1186/s12862-020-01709-1
Magurran, A. E., and McGill, B. J. (2011). Biological diversity: frontiers in measurement and assessment. Oxford: Oxford University Press.
Martín-Torrijos, L., Kokko, H., Makkonen, J., Jussila, J., and Diéguez-Uribeondo, J. (2019). Mapping 15 years of crayfish plague in the Iberian Peninsula: The impact of two invasive species on the endangered native crayfish. PloS One 14:e0219223. doi: 10.1371/journal.pone.0219223
Martín-Torrijos, L., Martínez-Ríos, M., Casabella-Herrero, G., Adams, S. B., Jackson, C. R., and Diéguez-Uribeondo, J. (2021). Tracing the origin of the crayfish plague pathogen, Aphanomyces astaci, to the Southeastern United States. Sci. Rep. 11:9332. doi: 10.1038/s41598-021-88704-8
Matallanas, B., Ochando, M. D., Alonso, F., and Callejas, C. (2016). Update of genetic information for the white-clawed crayfish in Spain, with new insights into its population genetics and origin. Org. Divers. Evol. 16, 533–547. doi: 10.1007/s13127-016-0268-4
Matallanas, B., Ochando, M. D., Vivero, A., Beroiz, B., Alonso, F., and Callejas, C. (2011). Mitochondrial DNA variability in Spanish populations of A. italicus inferred from the analysis of a COI region. Knowl. Manag. Aquat. Ecosyst. 401:30. doi: 10.1051/kmae/2011052
Oliva, M., Palacios, D., Fernández-Fernández, J. M., Rodríguez-Rodríguez, L., García-Ruiz, J. M., Andrés, N., et al. (2019). Late quaternary glacial phases in the Iberian Peninsula. Earth Sci. Rev. 192, 564–600. doi: 10.1016/j.earscirev.2019.03.015
Pârvulescu, L. (2019). Introducing a new Austropotamobius crayfish species (Crustacea, Decapoda, Astacidae): A miocene endemism of the Apuseni Mountains, Romania. Zool. Anz. 279, 94–102. doi: 10.1016/j.jcz.2019.01.006
Pedraza-Lara, C., Alda, F., Carranza, S., and Doadrio, I. (2010). Mitochondrial DNA structure of the Iberian populations of the white-clawed crayfish, Austropotamobius italicus italicus (Faxon, 1914). Mol. Phylogenet. Evol. 57, 327–342. doi: 10.1016/j.ympev.2010.06.007
Perea, S., Böhme, M., Zupančič, P., Freyhof, J., Šanda, R., Özuluǧ, M., et al. (2010). Phylogenetic relationships and biogeographical patterns in circum-Mediterranean subfamily leuciscinae (Teleostei, Cyprinidae) inferred from both mitochondrial and nuclear data. BMC Evol. Biol. 10:265. doi: 10.1186/1471-2148-10-265
Rambaut, A. (2012). FigTree_v1.4.0. Available Online at: http://tree.bio.ed.ac.uk/software/figtree/
Rambaut, A., Suchard, M. A., Xie, D., and Drummond, A. J. (2014). Tracer v1.6. Available Online at: http://tree.bio.ed.ac.uk/software/tracer/
Recuero, E., Buckley, D., García-París, M., Arntzen, J. W., Cogalniceanu, D., and Martínez-Solano, I. (2014). Evolutionary history of Ichthyosaura alpestris (Caudata, Salamandridae) inferred from the combined analysis of nuclear and mitochondrial markers. Mol. Phylogenet. Evol. 81, 207–220. doi: 10.1016/j.ympev.2014.09.014
Recuero, E., and García-París, M. (2011). Evolutionary history of Lissotriton helveticus: multilocus assessment of ancestral vs. recent colonization of the Iberian Peninsula. Mol. Phylogenet. Evol. 60, 170–182. doi: 10.1016/j.ympev.2011.04.006
Robinson, C. A., Thom, T. J., and Lucas, M. C. (2000). Ranging behaviour of a large freshwater invertebrate, the white-clawed crayfish Austropotamobius pallipes. Freshw. Biol. 44, 509–521. doi: 10.1046/j.1365-2427.2000.00603.x
Ronquist, F., Teslenko, M., van der Mark, P., Ayres, D. L., Darling, A., Hohna, S., et al. (2012). MrBayes 3.2: efficient Bayesian phylogenetic inference and model choice across a large model space. Syst. Biol. 61, 539–542. doi: 10.1093/sysbio/sys029
Santucci, F., Iaconelli, M., Andreani, P., Cianchi, R., Nascetti, G., and Bullini, L. (1997). Allozyme diversity of european freshwater crayfish of the genus Austropotamobius. Bull. Fr. Pêche piscic. 347, 663–676. doi: 10.1051/kmae/1997045
Scalici, M., and Bravi, R. (2012). Solving alpha-diversity by morphological markers contributes to arranging the systematic status of a crayfish species complex (Crustacea, Decapoda). J. Zoolog. Syst. Evol. Res. 50, 89–98. doi: 10.1111/j.1439-0469.2011.00643.x
Schrimpf, A., Piscione, M., Cammaerts, R., Collas, M., Herman, D., Jung, A., et al. (2017). Genetic characterization of western European noble crayfish populations (Astacus astacus) for advanced conservation management strategies. Conserv. Genet. 18, 1299–1315. doi: 10.1007/s10592-017-0981-3
Schubart, C. D., and Huber, M. G. J. (2006). Genetic comparisons of German populations of the stone crayfish, Austropotamobius torrentium (Crustacea: Astacidae). Bull. Fr. Pêche Piscic. 380–381, 1019–1028. doi: 10.1051/kmae:2006008
Silvestro, D., and Michalak, I. (2012). RaxmlGUI: a graphical front-end for RAxML. Org. Divers. Evol. 12, 335–337. doi: 10.1007/s13127-011-0056-0
Stamatakis, A. (2014). Raxml version 8: a tool for phylogenetic analysis and post-analysis of large phylogenies. Bioinformatics 30, 1312–1313. doi: 10.1093/bioinformatics/btu033
Temiño, C. and Sáez-Royuela, M. (1998). Resumen de los Inventarios de Cangrejo Autóctono Austropotamobius Pallipes Realizados en la Provincia de Burgos Entre 1984 y 1997. Documento Interno del Servicio Territorial de Medio Ambiente de Burgos. Burgos: Junta de Castilla y León.
Toon, A., Finley, M., Staples, J., and Crandall, K. A. (2009). “Decapod phylogenetics and molecular evolution,” in Decapod Crustacean Phylogenetics (Crustacean Issues), eds J. W. Martin, K. A. Crandall, and D. L. Felder (Boca Raton: CRC Press), 15–29. doi: 10.1201/9781420092592-c2
Torre Cervigón, M., and Rodríguez Marqués, P. (1964). El cangrejo de río en España. Documento Interno del Servicio Nacional de Pesca Fluvial y Caza. Madrid: Ministerio de Agricultura.
Trontelj, P., Machino, Y., and Sket, B. (2005). Phylogenetic and phylogeographic relationships in the crayfish genus Austropotamobius inferred from mitochondrial COI gene sequences. Mol. Phylogenet. Evol. 34, 212–226. doi: 10.1016/j.ympev.2004.09.010
Vedia, I., and Miranda, R. (2013). Review of the state of knowledge of crayfish species in the Iberian Peninsula. Limnetica 32, 269–286. doi: 10.23818/limn.32.22
Keywords: Austropotamobius pallipes, mitochondrial 16S rRNA, mitochondrial COI, genetic diversity, phylogeographic structure, conservation
Citation: Martín-Torrijos L, Buckley D, Doadrio I, Machordom A and Diéguez-Uribeondo J (2021) Unraveling the Hidden Diversity of the Native White Claw Crayfish in the Iberian Peninsula. Front. Ecol. Evol. 9:669292. doi: 10.3389/fevo.2021.669292
Received: 18 February 2021; Accepted: 26 August 2021;
Published: 21 September 2021.
Edited by:
Leopold Füreder, University of Innsbruck, AustriaReviewed by:
Lucian Pârvulescu, West University of Timişoara, RomaniaElena Tricarico, University of Florence, Italy
Copyright © 2021 Martín-Torrijos, Buckley, Doadrio, Machordom and Diéguez-Uribeondo. This is an open-access article distributed under the terms of the Creative Commons Attribution License (CC BY). The use, distribution or reproduction in other forums is permitted, provided the original author(s) and the copyright owner(s) are credited and that the original publication in this journal is cited, in accordance with accepted academic practice. No use, distribution or reproduction is permitted which does not comply with these terms.
*Correspondence: Laura Martín-Torrijos, bG10b3JyaWpvc0ByamIuY3NpYy5lcw==