 Dawn M. Reding1*
 Susette Castañeda-Rico2,3,4
 Sabrina Shirazi2†
 Courtney A. Hofman2†
 Imogene A. Cancellare5
 Stacey L. Lance6Jeff Beringer7William R. Clark8
 Jesus E. Maldonado2,3
- 1Department of Biology, Luther College, Decorah, IA, United States
- 2Center for Conservation Genomics, Smithsonian Conservation Biology Institute, National Zoological Park, Washington, DC, United States
- 3Department of Biology, George Mason University, Fairfax, VA, United States
- 4Smithsonian-Mason School of Conservation, Front Royal, VA, United States
- 5Department of Entomology and Wildlife Ecology, University of Delaware, Newark, DE, United States
- 6Savannah River Ecology Laboratory, University of Georgia, Aiken, SC, United States
- 7Missouri Department of Conservation, Columbia, MO, United States
- 8Department of Ecology, Evolution, and Organismal Biology, Iowa State University, Ames, IA, United States
We examined phylogeographic structure in gray fox (Urocyon cinereoargenteus) across the United States to identify the location of secondary contact zone(s) between eastern and western lineages and investigate the possibility of additional cryptic intraspecific divergences. We generated and analyzed complete mitochondrial genome sequence data from 75 samples and partial control region mitochondrial DNA sequences from 378 samples to investigate levels of genetic diversity and structure through population- and individual-based analyses including estimates of divergence (FST and SAMOVA), median joining networks, and phylogenies. We used complete mitochondrial genomes to infer phylogenetic relationships and date divergence times of major lineages of Urocyon in the United States. Despite broad-scale sampling, we did not recover additional major lineages of Urocyon within the United States, but identified a deep east-west split (∼0.8 million years) with secondary contact at the Great Plains Suture Zone and confirmed the Channel Island fox (Urocyon littoralis) is nested within U. cinereoargenteus. Genetic diversity declined at northern latitudes in the eastern United States, a pattern concordant with post-glacial recolonization and range expansion. Beyond the east-west divergence, morphologically-based subspecies did not form monophyletic groups, though unique haplotypes were often geographically limited. Gray foxes in the United States displayed a deep, cryptic divergence suggesting taxonomic revision is needed. Secondary contact at a common phylogeographic break, the Great Plains Suture Zone, where environmental variables show a sharp cline, suggests ongoing evolutionary processes may reinforce this divergence. Follow-up study with nuclear markers should investigate whether hybridization is occurring along the suture zone and characterize contemporary population structure to help identify conservation units. Comparative work on other wide-ranging carnivores in the region should test whether similar evolutionary patterns and processes are occurring.
Introduction
Past climatic fluctuations have been a major force driving lineage differentiation and contributing to biodiversity patterns (Hewitt, 1996, 2000). Like many regions, North America experienced dramatic changes in climate as repeating cycles of glacial expansion and retreat occurred throughout the Quaternary Period (i.e., the past 2.6 million years). The resulting shifts in vegetation and food resources caused the distributions of temperate vertebrates to contract and expand, often leaving phylogeographic signatures of population decline, fragmentation, and divergence in isolated glacial refugia contrasted with growth, recolonization, and admixture during interglacial periods (Lessa et al., 2003; Hewitt, 2004). For habitat specialists or organisms with low vagility, these expansion-contraction cycles and intermittent biogeographic barriers set populations on divergent evolutionary trajectories that can be recognized today as separate species or subspecies (Stone et al., 2002; Johnson and Cicero, 2004; Kerhoulas and Arbogast, 2010; McDonough et al., 2020). In other cases, flexible ecological requirements and/or high vagility seem to have either prevented genetic structure from forming or largely erased the structure following contact and homogenization (Smith et al., 2011; Koblmüller et al., 2012; Kierepka and Latch, 2016). Yet recent studies have revealed cryptic phylogeographic structure in mobile taxa with broad, seemingly continuous distributions (Barton and Wisely, 2012; Harding and Dragoo, 2012; Reding et al., 2012; Goddard et al., 2015; Puckett et al., 2015), indicating species responses to past environmental change can be complex (Graham et al., 1996; Hofreiter and Stewart, 2009). Such cryptic genetic diversity presents a challenge for assessing and predicting the effects of past and future global climate change on biodiversity (Pauls et al., 2013), evaluating speciation hypotheses, understanding the relative roles of glacial vicariance and ongoing isolating mechanisms at secondary contact zones (Swenson, 2006), and directing conservation efforts to preserve evolutionarily significant units and thus the genetic legacy of species (Coates et al., 2018).
Although the magnitude and location of phylogeographic breaks vary depending on an organism’s degree of habitat specialization, dispersal ability, and potential for development of reproductive isolating barriers, comparative work has documented some geographic hot spots in North America where a variety of sister taxa meet at areas of secondary contact called suture zones (Remington, 1968; Swenson and Howard, 2004, 2005; Swenson, 2006; Rissler and Smith, 2010). The Great Plains Suture Zone, located around the 100th meridian in the central United States, is one of the strongly supported secondary contact zones, particularly for forest birds (Swenson and Howard, 2004, 2005; Swenson, 2006). Indeed, many avian genera include sister species pairs represented by eastern and western counterparts (Mengel, 1970; Rising, 1983; Lovette, 2005). Although debate has centered on whether this species-level diversification resulted primarily from Pleistocene vicariance (Johnson and Cicero, 2004; Weir and Schluter, 2004) or much earlier Pliocene events (Klicka and Zink, 1997; Zink et al., 2004; Barnosky, 2005), mounting evidence supports a role for Pleistocene events causing species-level divergence in many cases (Lovette, 2005; Peterson and Ammann, 2013; McDonough et al., 2020). A leading hypothesis for east-west divergences is that populations were separated into two or more disjunct Pleistocene forest refugia south of the glacial extent, an idea supported by climatic modeling of ecoregions (Hargrove and Hoffman, 2005) and ecological niche modeling of historical species distributions (Peterson and Ammann, 2013; Puckett et al., 2015; Loveless et al., 2016; Ferguson et al., 2017). These populations then diverged in allopatry, potentially with the eastern counterpart adapting to wetter and cooler environments and the western to drier and warmer environments (Rising, 1970, 1983; Webb and Bartlein, 1992; Swenson, 2006). Changing climatic conditions at the end of the Pleistocene (∼12,000 ybp) permitted refugia to expand into secondary contact, with exogenous (i.e., environmental) factors such as temperature (Rising, 1969; Swenson, 2006), precipitation (Moore and Price, 1993), and/or vegetation (Moore, 1977) gradients at the Great Plains likely playing pivotal roles in maintaining species boundaries along the hybrid zone, perhaps in combination with endogenous (i.e., genetic-based) factors (Bronson et al., 2003). Such a major biogeographic pattern should be common across diverse vertebrate taxa, but evidence for this phylogeographic break and species-level east-west divergence remains more equivocal for mammals (Barnosky, 2005). Particularly for generalist mammals, phylogeographic divergence is typically absent or shallow, and although east-west breaks have been found within mammalian species at the Great Plains (Reding et al., 2012), they may instead be located at physical barriers such as the Rocky Mountains Continental Divide (Rueness et al., 2003), or Mississippi River (Brant and Ortí, 2002; Cullingham et al., 2008; Barton and Wisely, 2012; Harding and Dragoo, 2012).
Recent genetic research involving the gray fox (Urocyon cinereoargenteus) has indicated populations in the western United States are surprisingly divergent from those in the eastern United States (Goddard et al., 2015; Hofman et al., 2015), though many gaps in our characterization of this pattern remain. Gray fox range across much of North America and into Central America and northern South America (Figure 1A; Hall, 1981). Generally associated with forest, woodland, and brushland, it is an opportunistic carnivore with a variable diet (small mammals, invertebrates, and fruits and other plant matter; Fritzell and Haroldson, 1982) and male-biased dispersal with recorded distances up to 135 km (Banfield, 1974). Across their range, 16 subspecies have been described primarily from body size, pelage color, and geographic differences; 7 subspecies of U. cinereoargenteus and the island fox endemic to the Channel Islands (U. littoralis) occur in the United States (Figure 1A; Hall, 1981). Gray foxes are legally harvested for fur throughout much of the range (Deems and Pursley, 1978). Despite the ecological and economic importance of gray fox, few studies have examined intraspecific genetic variation or evaluated genetic support for subspecies designations, with existing studies focused at local or regional scales (Bozarth et al., 2011; Goddard et al., 2015; Hofman et al., 2015). Bozarth et al. (2011) sequenced a portion of the mitochondrial DNA control region from gray fox from 15 states within the ranges of the 3 subspecies along the United States East Coast and found a lack of support for differentiation across this broad area, though the Northeast samples did show lower levels of genetic diversity indicative of recent range expansion. In mtDNA analyses focused on island foxes and mainland gray foxes in California, both Hofman et al. (2015) and Goddard et al. (2015) included a small number of gray fox samples from the eastern United States (Virginia and Georgia, respectively) for comparison and found (1) island foxes are nested within the gray fox phylogeny (i.e., gray fox is paraphyletic) and (2) eastern and western gray foxes show a deep divergence on par with that seen between some currently recognized species within the Canidae. However, in both of these studies, sampling was geographically limited and disjunct, making it uncertain where the suture zone lies and if additional cryptic structure may exist. In addition, sampling gaps and limited genetic sequence information also presents challenges for accurately estimating divergence time to identify whether the separation occurred during or prior to Pleistocene glaciation events. Using cytochrome b sequence data, Goddard et al. (2015) estimated a split time of approximately 500,000 ybp between the eastern and western lineages. Studies have shown that entire mitogenomes can sometimes call into question inferences made using short mitochondrial sequences (Knaus et al., 2011; Feutry et al., 2014; Hofman et al., 2015), so additional sequence data would help to clarify the date of this split.
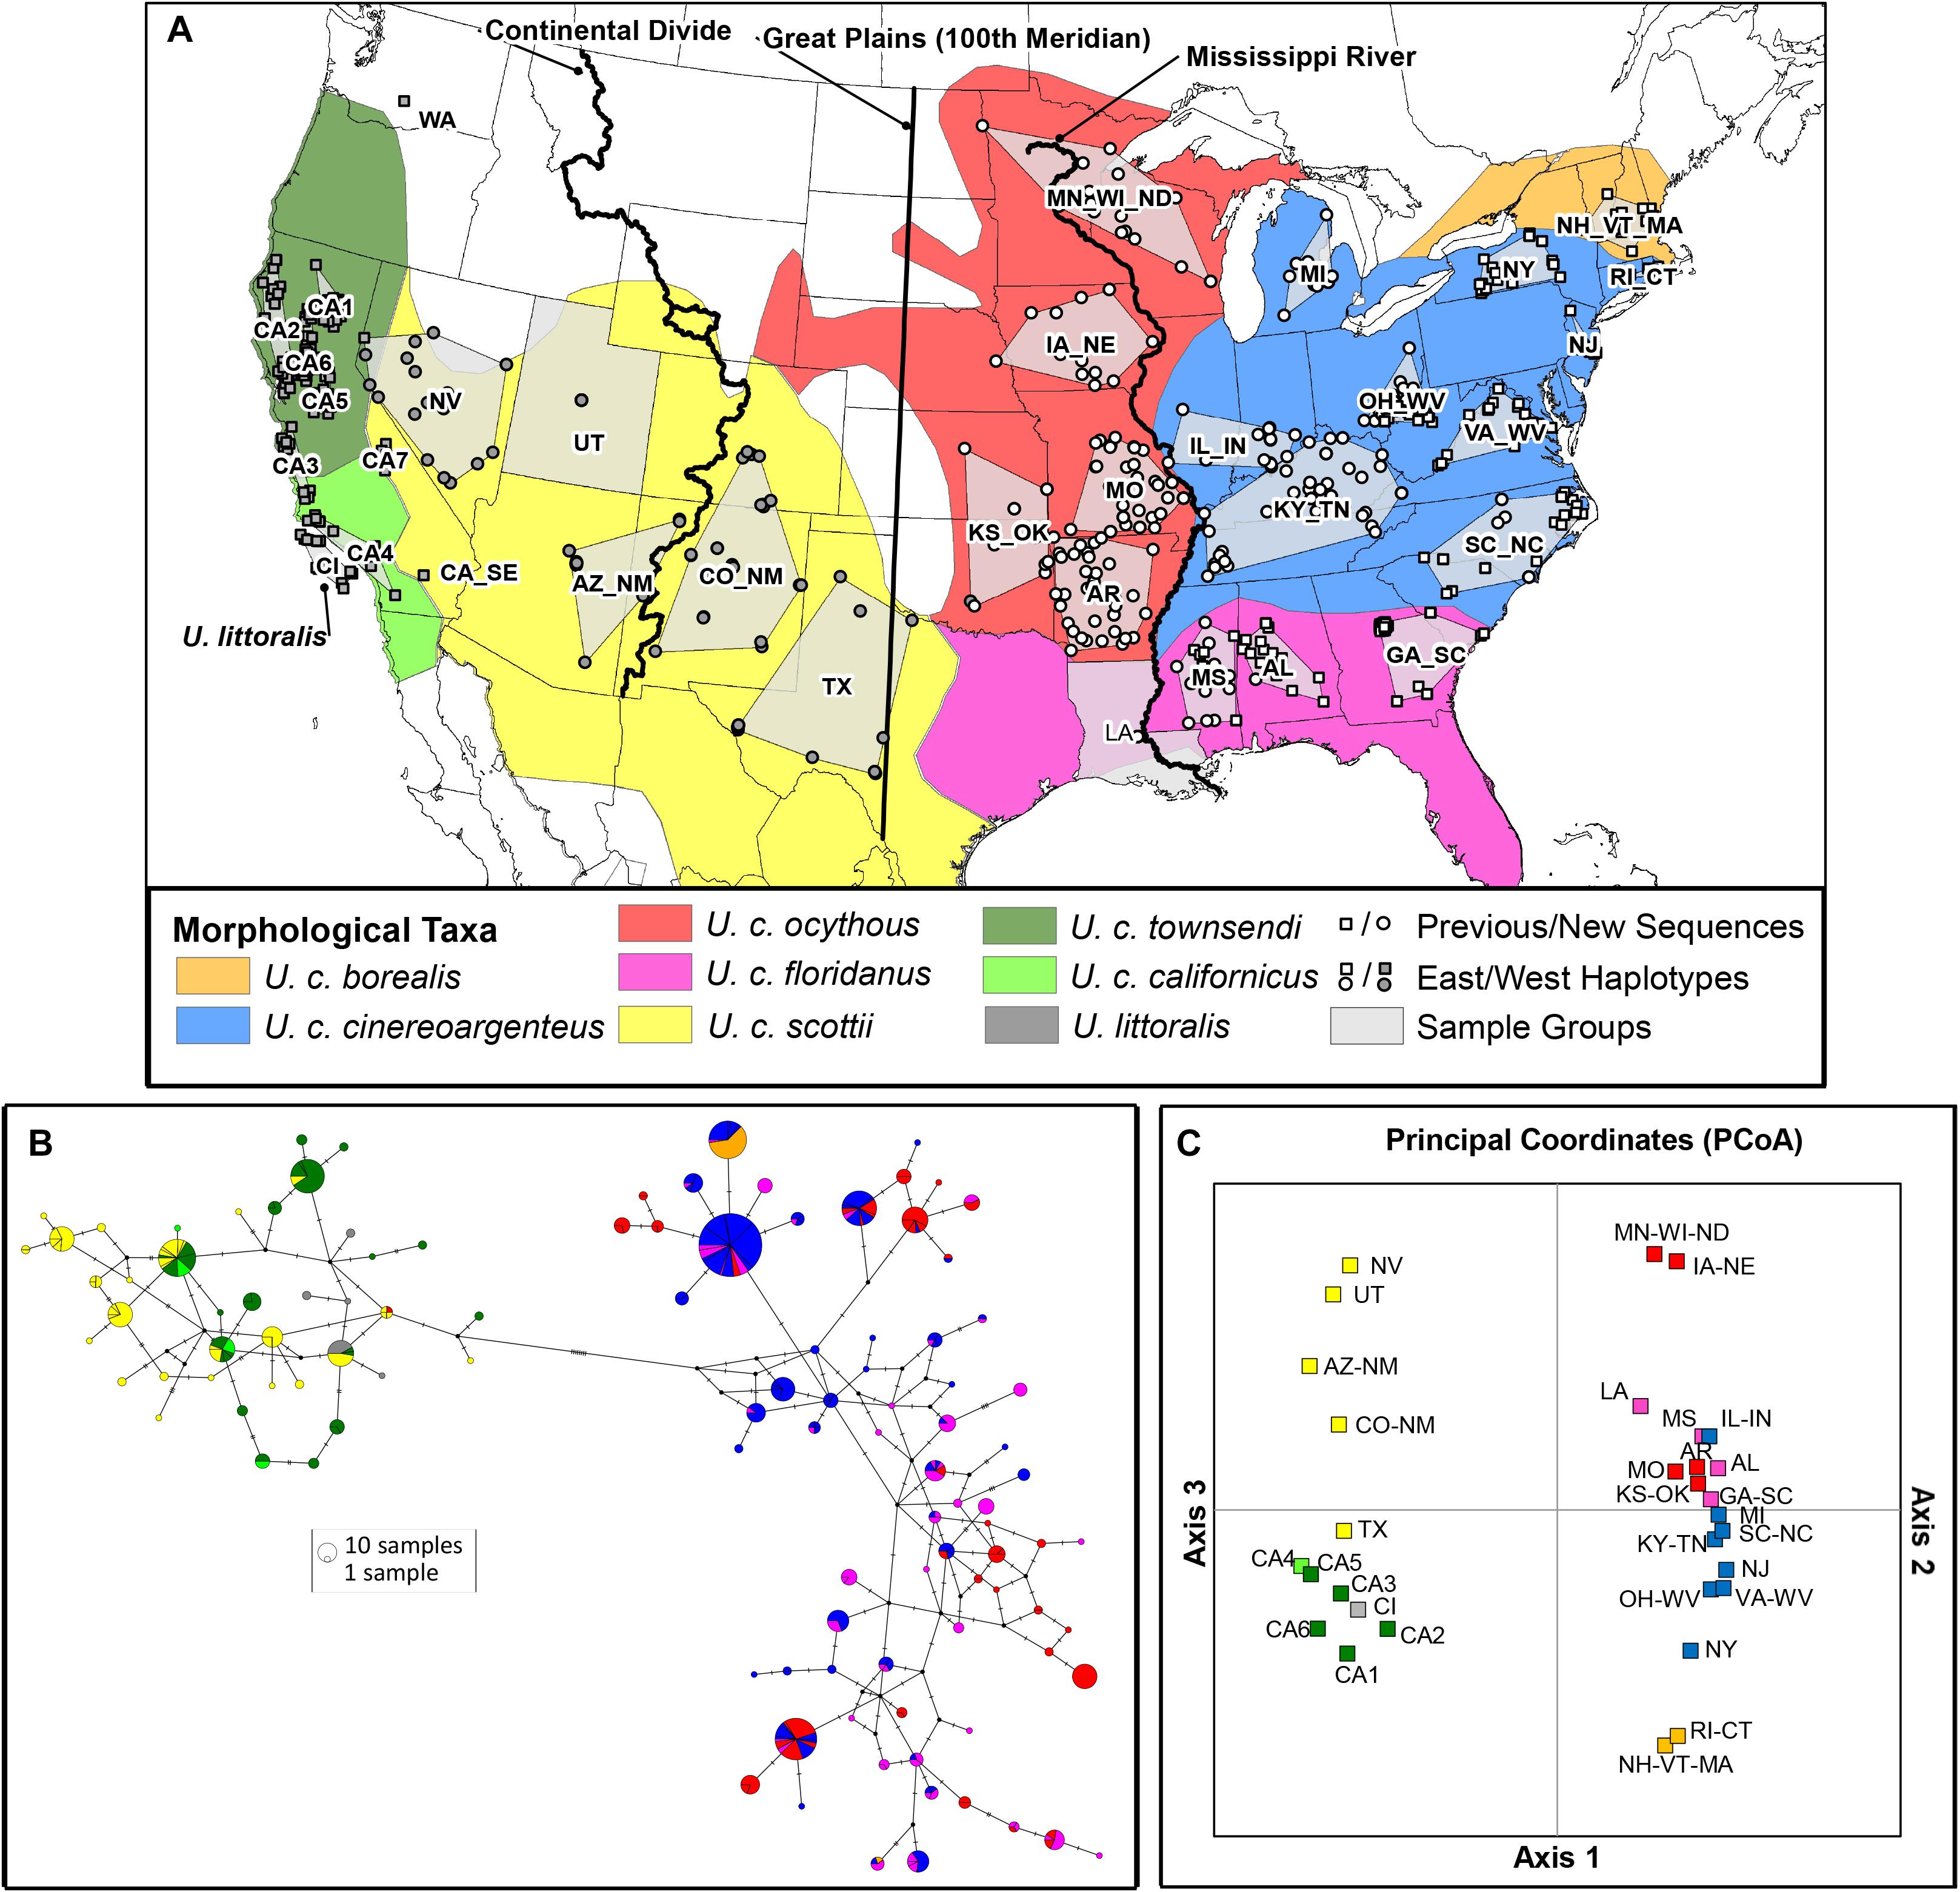
Figure 1. Analysis of 400 bp mtDNA control region sequence data from samples of gray fox (Urocyon spp.). (A) Map shows the ranges of 7 morphologically-based gray fox (U. cinereoargenteus) subspecies (Hall, 1981) and the island fox (U. littoralis); the locations of sample groups (n = 34) and samples (n = 781) used in the analysis, including newly generated sequences (circles), and previously published sequences (squares; Bozarth et al., 2011; Goddard et al., 2015; Hofman et al., 2015); and 3 possible locations of a hypothesized secondary contact zone between deeply divergent eastern and western gray fox lineages (Goddard et al., 2015). Samples are colored according to whether its haplotype fell into the East (white) or West (black) clade. (B) Median joining haplotype network. Each circle represents a unique haplotype, with size proportional to frequency, as well as a pie chart with color indicating the morphologically-based taxonomic assignment of the corresponding samples. Black circles reflect inferred haplotypes not present in the dataset, and hash marks on the lines connecting haplotypes represent the number of mutations separating them. A minimum of 13 steps separates East and West haplotypes. (C) Principal coordinates plot from population pairwise Fst (K2P-corrected) values, with sample groups colored according to morphologically-based taxa shown in the map. The first axis explained 47.8% of the variation and clearly divided western from eastern sample groups at the Great Plains, the second axis explained 11.3% of the variation and separated sample groups within the East (note only scores for East sample groups are shown since West sample groups had scores near 0 for the second axis), and the third axis explained 7.9% of the variation and separated sample groups within the West (note only scores for West sample groups are shown since East sample groups had scores near 0 for the third axis).
Identifying the location and strength of genetic boundaries in gray fox is relevant for the conservation and management of this species. In particular, a recent petition to list the prairie gray fox (U. c. ocythous; Figure 1A) under the Endangered Species Act has stimulated the United States Fish and Wildlife Service to initiate a status review to determine if listing is warranted (Department of the Interior, 2012). In the petition, Wade and Alton (2012) argued that the prairie gray fox has experienced dramatic declines in states like Iowa, Arkansas, Missouri, and Minnesota due to the loss of early successional habitats from intensified agriculture or forest maturation, competition with expanding coyote populations, and hunting/trapping pressure. It is unclear, however, how much the population has declined relative to historic abundance or whether the prairie gray fox is a genetically distinct segment of the contiguous gray fox range in the eastern United States. Recent studies of mammals have shown that genetic patterns often do not match previously described subspecies (Culver et al., 2000; Cullingham et al., 2008; Reding et al., 2012). Patterns of genetic variation, however, should be concordant with subspecific boundaries if morphologically-based subspecies are to be considered valid.
We aimed to characterize gray fox mtDNA phylogeographic structure across the United States to: (1) identify the location of suture zone(s) between eastern and western lineages and investigate the possibility of additional cryptic divergences; (2) verify the date of divergence between the eastern and western lineages through additional sampling and data from full mitogenomes, and (3) assess population genetic structure within these major maternal lineages to evaluate support for morphologically-described subspecies.
Materials and Methods
Sampling
We collected gray fox DNA samples in 2003–2017 from legally harvested and road-killed animals in 26 United States via assistance from state wildlife agencies and furharvesters (Figure 1A). Tissue sources included muscle, skin or dry pelt, and toe pad stored at room temperature in sterile vials filled with silica desiccant. We collected associated geographic location information for each sample, generally at least to the county level. We used DNeasy Blood and Tissue centrifugation kits (Qiagen, Valencia, CA, United States) to extract DNA from 387 samples, selected to provide broad geographic coverage (Supplementary Appendix 1).
mtDNA Control Region Sequencing and Analysis
To compare results with the eastern samples analyzed in Bozarth et al. (2011) and western samples from Goddard et al. (2015), we sequenced approximately the same ∼426–431 bp segment of the mtDNA control region using universal primers H16498 (CCTGAACTAGGAACCAGATG) and L15910 (GAATTCCCCGGTCTTGTAAACC; Kocher et al., 1989). We used 15 μL PCR reactions containing: 0.5 U IDProof High Fidelity DNA Polymerase (IDLabs, London, ON, Canada), 1X IDProof buffer containing 2 mM MgSO4, 0.2 mM dNTPs, 0.4 μM each primer, and 20 ng template DNA. Cycle conditions were: 95°C for 2 min, 30 cycles of 95°C for 30 s, 50°C for 30 s, 68°C for 30 s, followed by a final 10 min elongation at 68°C. We cleaned the PCR products using the ExoSAP method (Werle et al., 1994) and submitted them to the Iowa State University DNA Facility for cycle sequencing and analysis on an ABI 3730xl DNA Analyzer. Both directions were sequenced with the same primers used for PCR. We used Sequencher 5.2.3 (Gene Codes Corporation) to trim and align forward and reverse reads. We obtained full sequence coverage from 362 samples (including 7 samples containing 1 or more ambiguities), partial sequence coverage from 18 samples, and failed to obtain sequence data from 7 samples (Supplementary Appendix 1). Sequences are available in GenBank as accession numbers: MW597742 – MW598121.
In addition to the 380 sequences we generated, we downloaded from GenBank an additional 403 control region sequences (Supplementary Appendix 1): 229 samples with full sequence information from Bozarth et al. (2011), 134 samples from mainland (California and Georgia) gray fox from Goddard et al. (2015), as well as 26 mainland samples (25 California and 1 Virginia) and a single representative sample from each of the 14 Channel Island gray fox mitogenome haplotypes from Hofman et al. (2015). We aligned sequences using MAFFT in Geneious 10.0.71, trimmed to the same area analyzed in Goddard et al. (2015) resulting in a 408 bp alignment, and deleted an 8 bp region of homopolymer C to end with a 400 bp alignment. For downstream analyses, we included samples with at least 90% coverage (363 bp or more) of control region sequence, which resulted in omission of 2 of our sequenced samples. We ordered the remaining sequences (n = 781) with full sequences first, followed by sequences containing an ambiguity, and lastly partial sequences. We exported the aligned sequences from Geneious in FASTA format and manually replaced ambiguities with Ns. We used DnaSP 5.10.01 (Librado and Rozas, 2009) to export the data as a Roehl Data File with gaps/missing considered. Because it collapses ambiguous and missing data using the most common state found in the closest sequences, we then used Network 10.1 (Bandelt et al., 1999) to collapse sequences into unique haplotypes and to generate a median joining haplotype network. For improved visualization, we used PopART 1.7 (Leigh and Bryant, 2015) to draw a median joining network based on the haplotypes identified by Network.
To permit population-level analyses, we grouped samples into 34 a priori populations based on geographic proximity, state boundaries, biogeographic patterns, and population information from Bozarth et al. (2011) and Goddard et al. (2015; Figure 1A and Table 1). We used ArcGIS 10 (ESRI, Redlands, CA, United States) to calculate the geographic mean center of individuals assigned to each sample group, which we used as the spatial coordinates for the group. We used these sample groups and the unique haplotypes identified in Network (Supplementary Alignment 1) to generate Arlequin input files. We used Arlequin 3.5 (Excoffier and Lischer, 2010) to calculate population genetic diversity estimates (haplotype number, haplotype diversity, mean number of pairwise differences, and nucleotide diversity) and to examine population structure with pairwise FST and AMOVA. For these, we used the Kimura 2 parameter (K2P; Kimura, 1980) model with gamma = 0.948, since it was found to be the best model of sequence evolution with BIC criteria in jModeltest 2.1 (Darriba et al., 2012). Because the haplotype network revealed a clear separation between eastern and western United States samples (see section “Results”), we performed AMOVA with sample groups split into these two sets (East had 552 individuals in 19 sample groups; West had 229 individuals in 15 sample groups; Table 1). We used the REG procedure in SAS OnDemand (SAS Institute Inc., Cary, NC, United States) to perform a regression between diversity estimates and latitude of the mean center for each sample group, using sample size and area of the minimum convex polygon as covariates. We used GenAlEx 6.5 (Peakall and Smouse, 2006, 2012) to calculate geographic distance between sample groups and to perform a Mantel test (999 permutations) to test for a positive relationship between K2P-corrected genetic (FST/[1–FST]) and ln-transformed geographic distance, both overall and separately within the east and west sample groups. To see if additional substructure could be revealed within each region, we performed SAMOVA (Dupanloup et al., 2002) from K = 2–10 separately on East and West samples using 500 iterations and the same sequence model specified above. We also conducted a principal coordinates analysis (PCoA) on the Arlequin-generated pairwise FST values using GenAlEx 6.5. We removed three populations (WA, CA-SE, CA7) that had fewer than 10 individuals from the Mantel and regression analyses, SAMOVA, and PCoA.
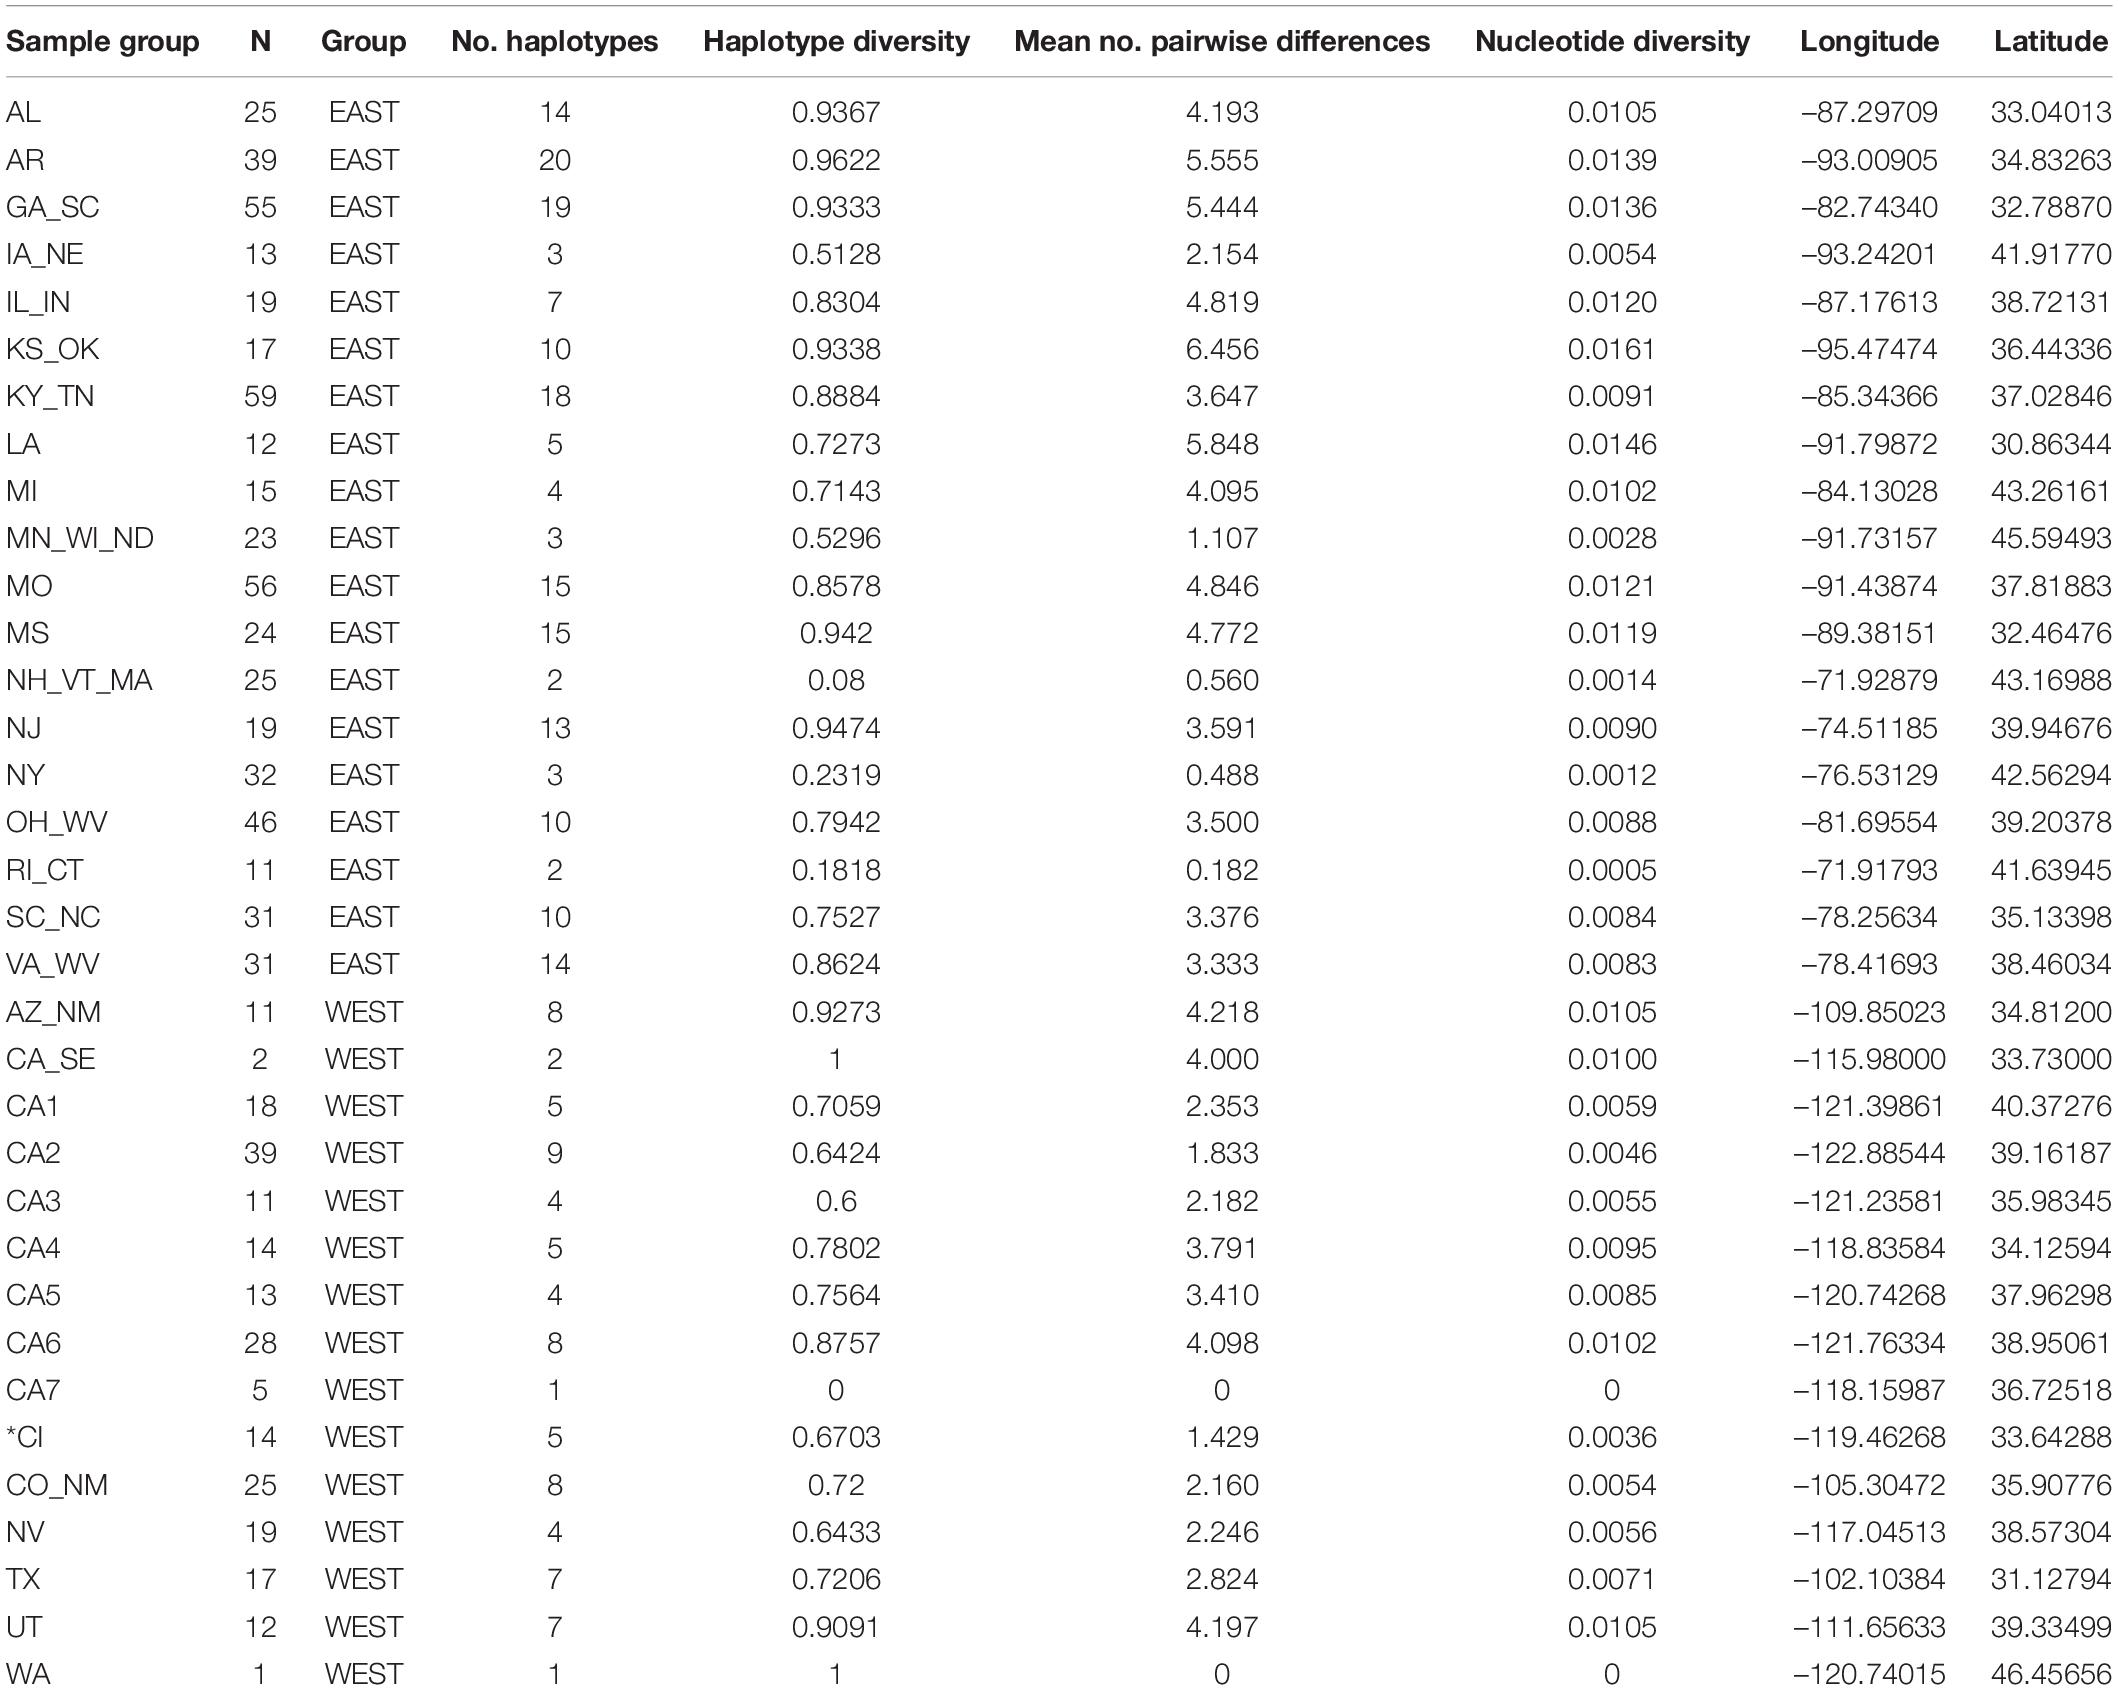
Table 1. Information and indicators of molecular diversity (400 bp mtDNA control region) for gray fox (Urocyon cinereoargenteus) sample groups, except *CI = Urocyon littoralis.
Mitogenome Sequencing and Analysis
We carried out sequence capture to generate complete mitogenomes from 67 of our samples as well as 28 samples original to the Bozarth et al. (2011) study (Supplementary Appendix 1). Captures were completed with samples pooled in groups of ∼6 libraries following MyBaits protocol v 3. Following capture, libraries were amplified 14 cycles. Pools were sequenced on five partial Illumina Miseq runs (2 × 150 bp) at the Smithsonian Institution Center for Conservation Genomics and one partial lane of a HiSeq (2 × 138 bp) at UCLA. We processed the combined reads from all runs using Prinseq-lite v. 0.20.4 for quality filtering (–min_len 20 –min_qual_mean 15) and mapped filtered reads to MVZ_206290 using the BWA mem algorithm. Duplicates were removed with Samtools v. 1.1 and the bam files were imported into Geneious v. 10.0.8. Consensus sequences were called in Geneious and all samples with less than 150 ambiguities including missing data (n = 75) were aligned with MAFFT v.1.36 as implemented in Geneious. The resulting alignment was visually inspected and indels were assessed by returning to the original bam alignment files. In one case (sample VT-101), a NUMT was identified and removed. Additionally, the genes were translated into amino acids and inspected for stop codons in Geneious. We used Network 10.1 to collapse the mitogenomes into unique haplotypes. Sequences are available in GenBank as accession numbers: MW599994 – MW600068. We then used PopART 1.7 to visualize a median joining network consisting of these 75 mitogenome samples with 40 published Urocyon mitogenomes from Hofman et al. (2015) that included all 26 U. cinereoargenteus mitogenomes (25 from California, 1 from Virginia) and a representative of each of the 14 unique U. littoralis mitogenome haplotypes (Figure 2A).
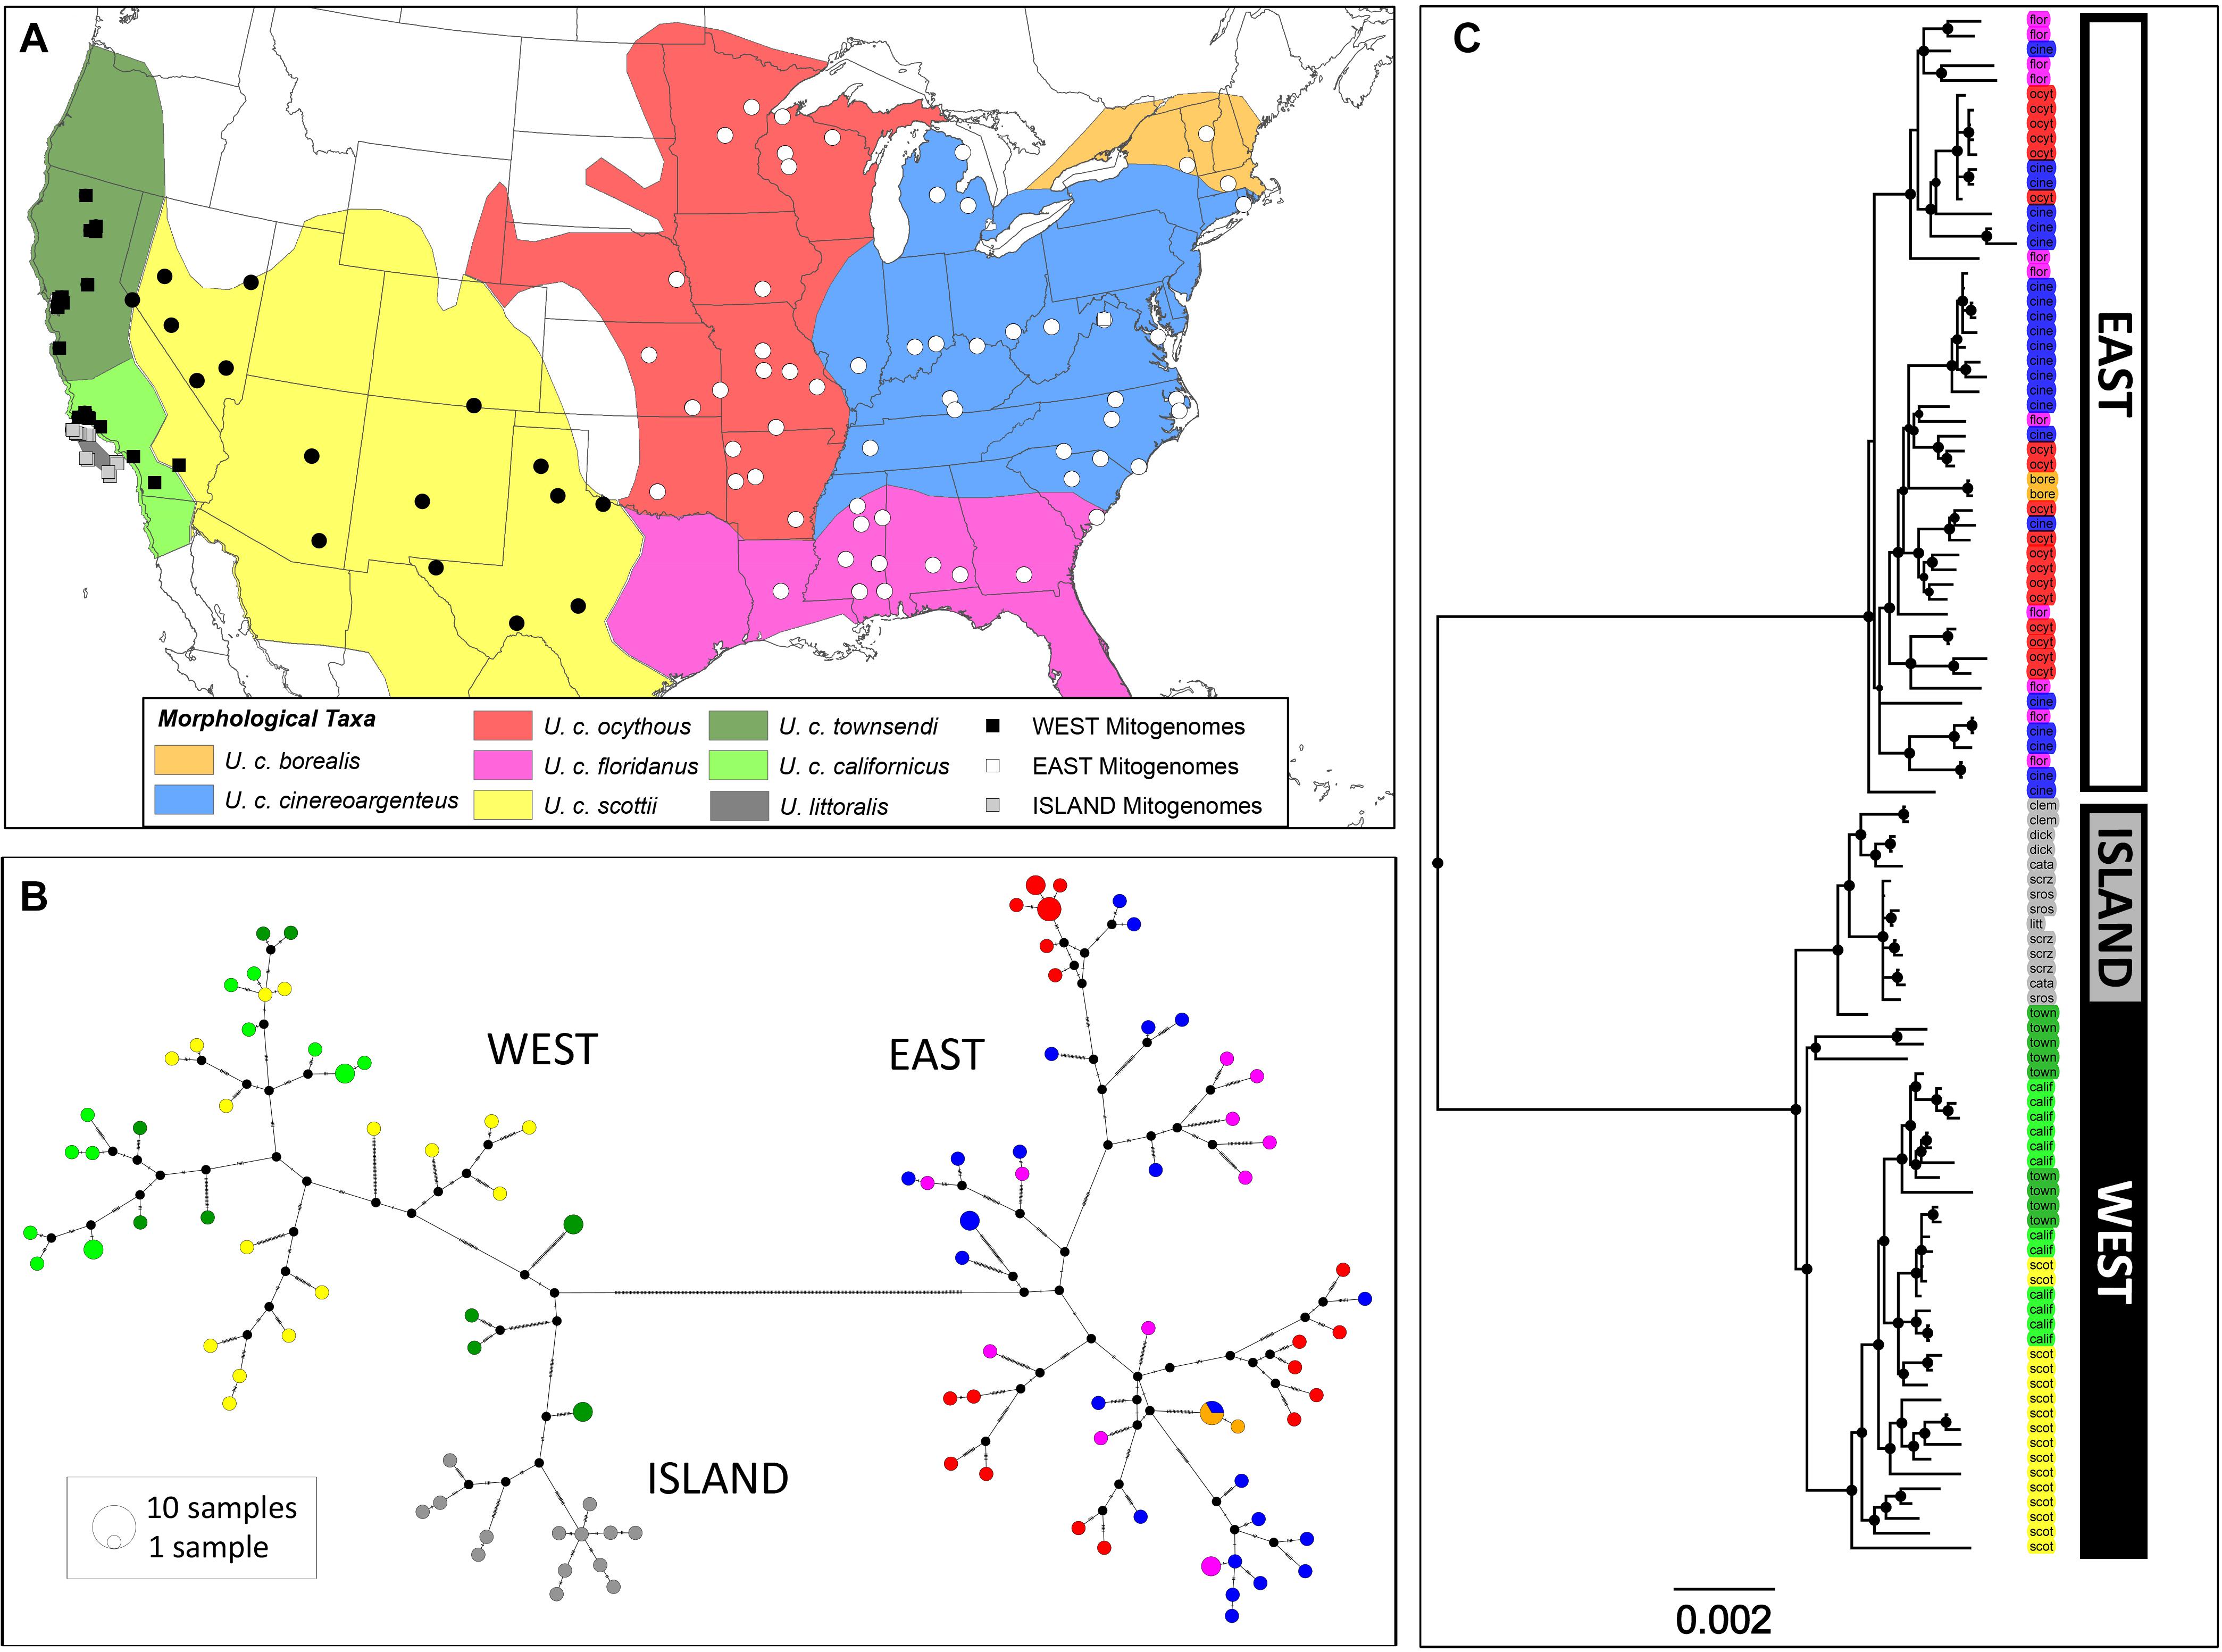
Figure 2. Phylogeographic patterns of United States distribution of Urocyon taxa based on mitogenome sequence data. (A) Map shows distributions of the morphologically-based Urocyon taxa and locations of mitogenome samples (n = 115) used in the analysis, including newly generated sequences (circles) and previously published sequences (squares). Samples are colored according to whether its mitogenome haplotype fell into the East (white), West (black), or Island (gray) clade. (B) Median joining network of mitogenomes from 115 samples, including newly sequenced U. cinereoargenteus samples (n = 75) and a subset of samples from Hofman et al. (2015) downloaded from GenBank (U. cinereoargenteus, n = 26; U. littoralis, n = 14). Each circle represents a unique haplotype, with size proportional to frequency, as well as a pie chart with color indicating the morphologically-based taxonomic assignment of the corresponding samples as shown in the map. Black circles reflect inferred haplotypes not present in the dataset, and hash marks on the lines connecting haplotypes represent the number of mutations separating them. A minimum of 286 steps separates East and West haplotypes. (C) Bayesian tree based on the analysis of 104 unique Urocyon mitogenome haplotypes and two outgroups (Vulpes vulpes and Canis latrans, removed for clarity). Nodal support for clades is depicted by the size of black circles, with most clades showing posterior probability values ≥0.99 (see Supplementary Figure 5 for precise values). Sample codes are colored to reflect the morphologically-based taxonomic assignment.
In phylogenetic analyses, we used an alignment consisting of 106 mitogenomes: 68 unique mitogenomes we recovered from our 75 U. cinereoargenteus assemblies; 36 unique published Urocyon mitogenomes from Hofman et al. (2015) which included 14 U. littoralis and 22 U. cinereoargenteus mitogenomes; and two outgroups from GenBank: Canis latrans (NC_008093.1) and Vulpes vulpes (NC_008434.1). We used Partition Finder 2.1.1 (Lanfear et al., 2016) to test model and partition selection using linked, corrected Akaike Information Criterion and greedy parameters. The Partition Finder analysis detected 25 partitions that we incorporated in phylogenetic reconstruction. We performed a Bayesian Inference analysis (BI) in MrBayes 3.2.6 (Huelsenbeck and Ronquist, 2001; Ronquist and Huelsenbeck, 2003) using 50,000,000 generations sampling every 1,000 generations. We visualized output parameters using Tracer v1.7.1 (Rambaut et al., 2018) to check for convergence between runs and we discarded the first 25% of the trees as burn-in. The final tree and support values were visualized using FigTree v1.4.4.
To estimate molecular dates of divergence, we used partial mitochondrial genomes (no D-loop included). The alignment (Supplementary Alignment 2) included 104 unique haplotypes of Urocyon and three outgroups from GenBank: Canis latrans (NC_008093.1), Vulpes vulpes (NC_008434.1), and Ursus americanus (NC_003426.1). We used BEAST v2.5.2 (Bouckaert et al., 2014) under an uncorrelated lognormal strict molecular clock model and the Yule speciation processes model with 25 partitions. We performed Bayesian Markov chain Monte Carlo searches to obtain the time to the most recent common ancestor for the main lineages. We sampled trees and divergence dates for all nodes every 10,000 iterations for 100,000,000 generations. Divergence time estimates were based on three fossil calibration points. The first was based on the early Pliocene Urocyon fossil dated to 5.33–2.558 million years ago [Ma; mean = 3.5 (in real space), stdev = 0.5; McKenna and Bell, 1997]. The second point was for the root age of Canidae (offset = 10 Ma, mean = 0.7 [12 Ma], stdev = 0.415 [14 Ma]), as used by Slater et al. (2012). The third point was for the split of U. cinereoargenteus and U. littoralis (offset = 0.007, mean [in real space] = 0.704 [0.5 Ma], stdev = 0.36 [1.2 Ma]), as used by Slater et al. (2012). We checked convergence statistics for effective sample sizes using Tracer v1.7.1 (Rambaut et al., 2018) and TreeAnnotator v2.5.2 (available in the BEAST package) to get a consensus tree with node height distribution after elimination of 25% of trees as burn-in. We visualized BEAST results using FigTree v1.4.4. Partition Finder, MrBayes and BEAST analyses were performed on the Smithsonian Institution High Performance Computer Cluster2.
Results
mtDNA Control Region
Among 781 individuals successfully sequenced or downloaded from Genbank, we identified 114 unique haplotypes, encompassing 63 substitutions and 2 indels observed at 61 polymorphic sites across the 400 bp control region segment. Overall, haplotype diversity = 0.961, nucleotide diversity = 0.0255, and mean number of pairwise differences = 10.181. At the population-level, all three diversity metrics decreased at northern latitudes in the East (P < 0.05), but there was no significant relationship in the West (P > 0.05; Figure 3, Supplementary Figure 1, and Table 1).
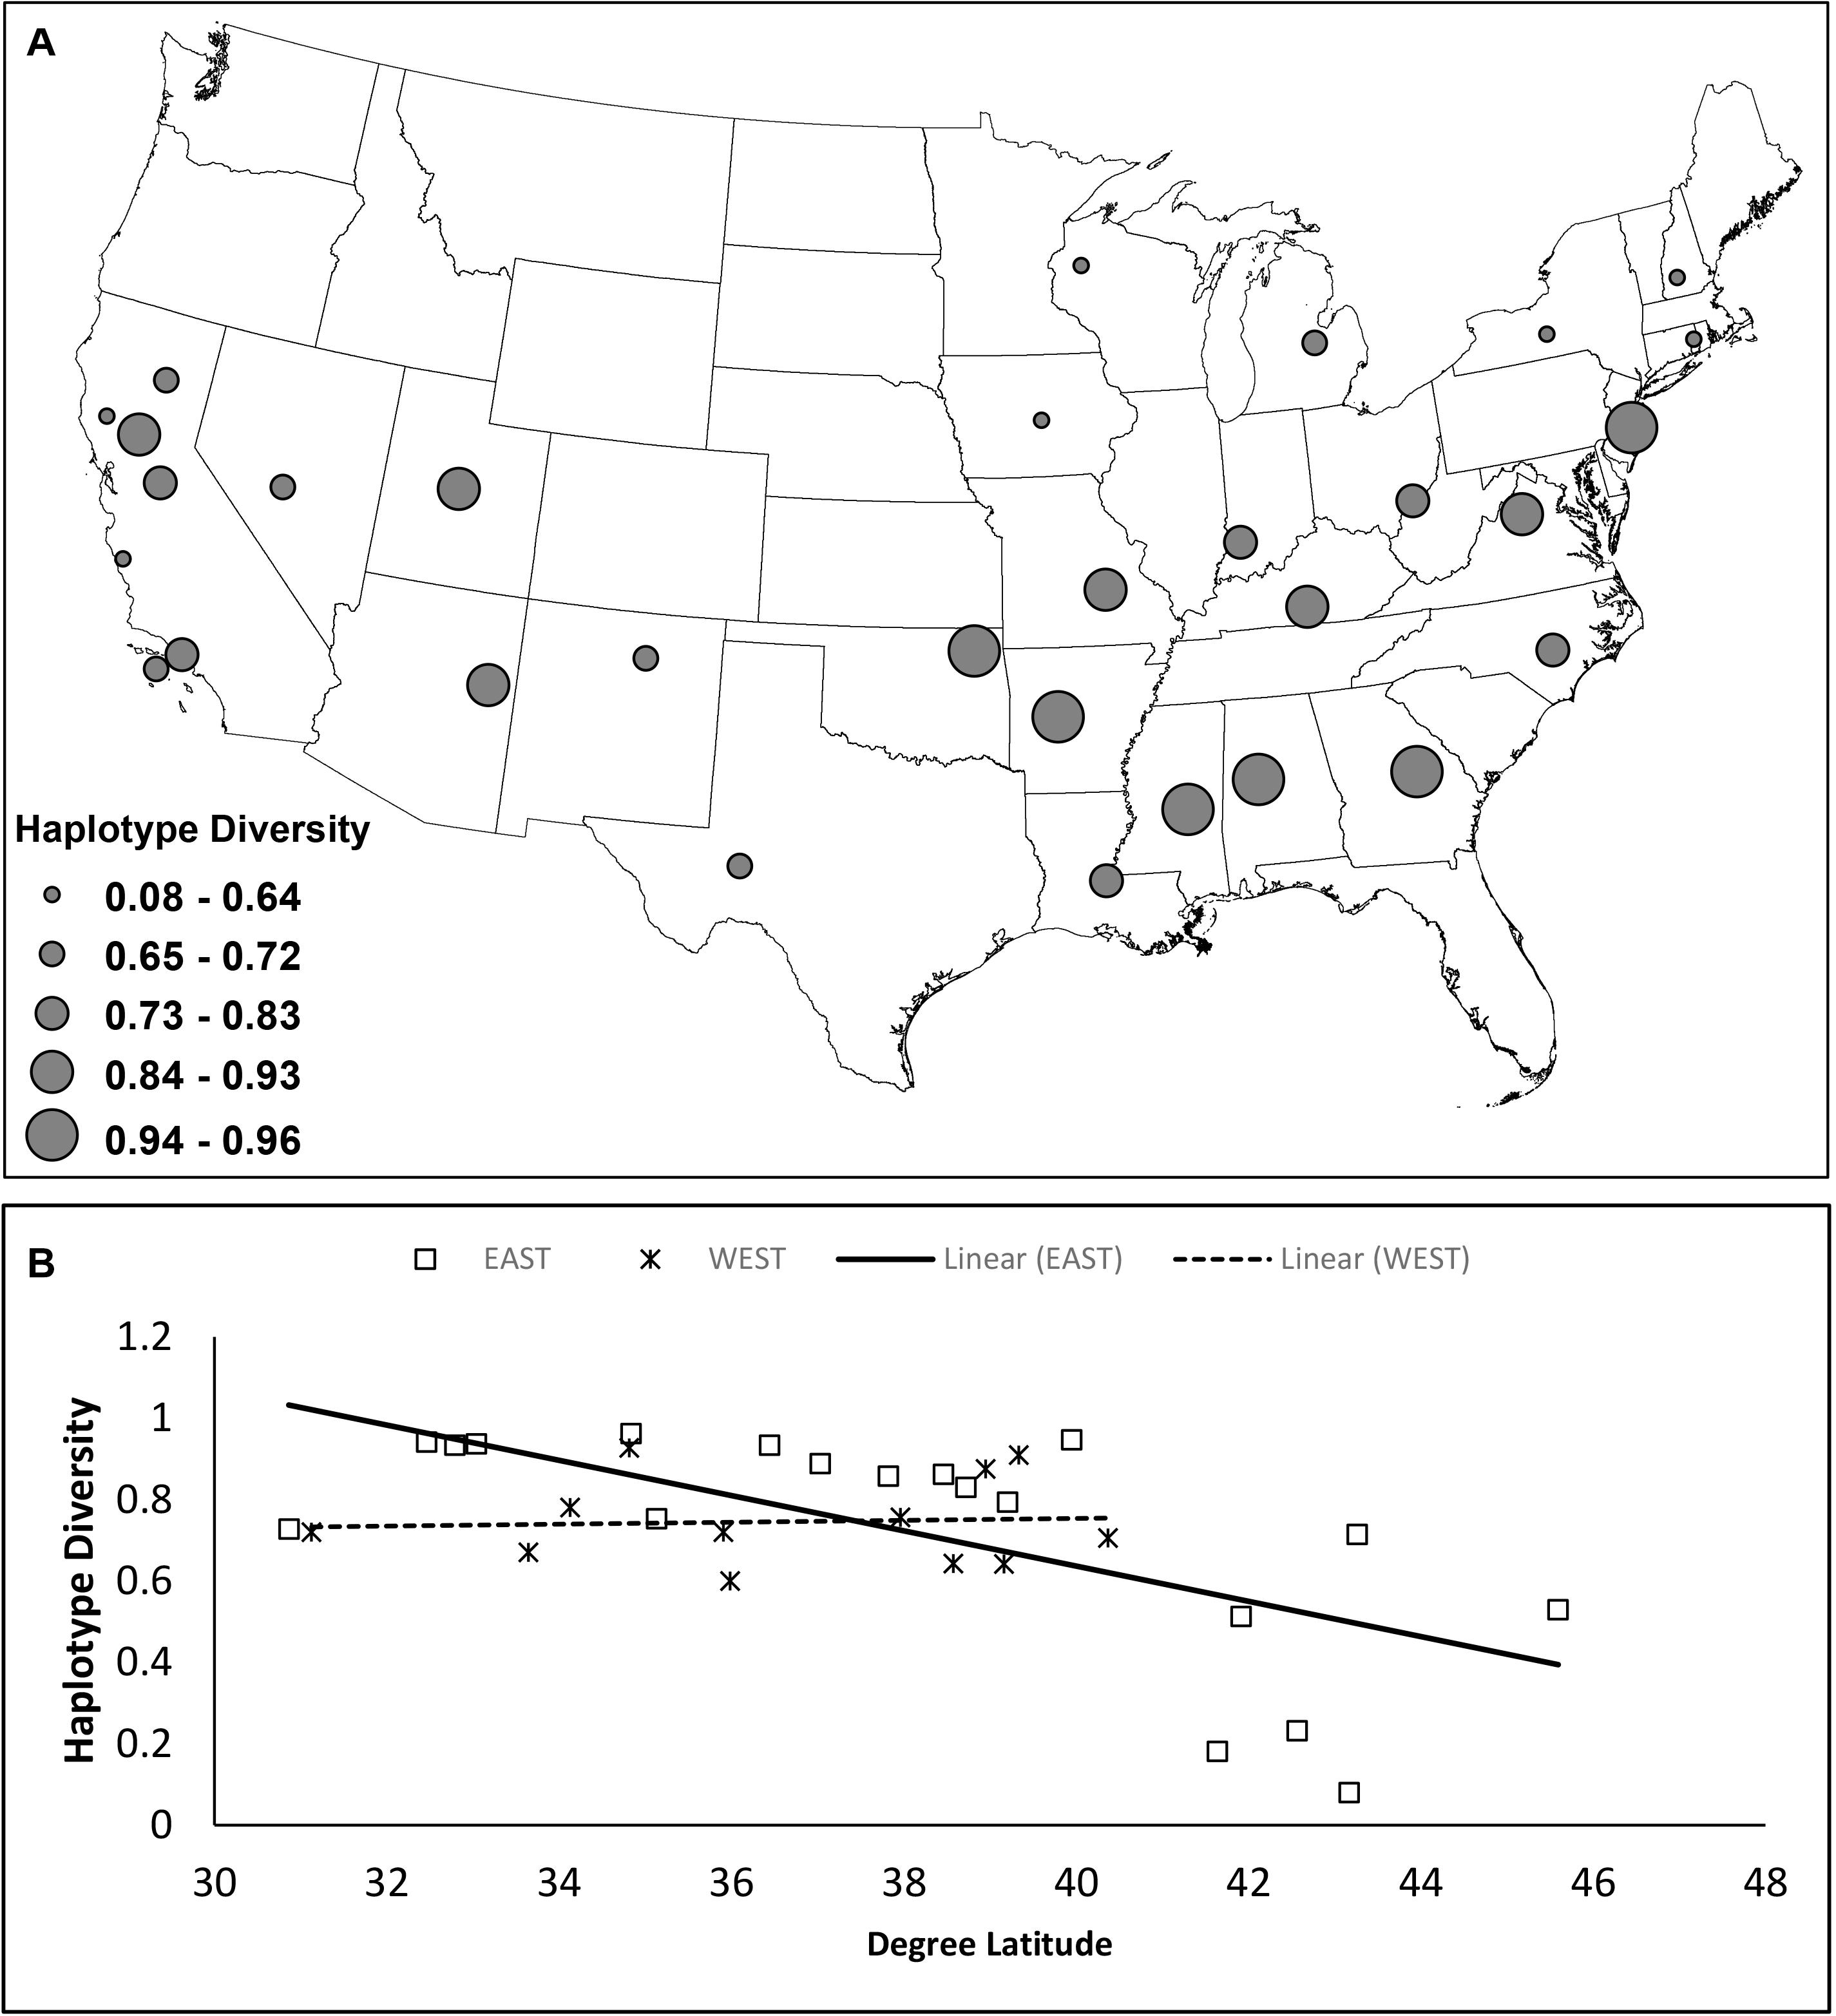
Figure 3. Estimates of haplotype diversity for 31 gray fox sample groups (n > 10) based on 400 bp of mtDNA control region. (A) Circles are located at the geographic mean center of each sample group and size reflects the quantile of the haplotype diversity value. (B) Linear regression of haplotype diversity by latitude for East and West sample groups.
The median-joining network (Figure 1B) strongly supported two highly diverged clades (East and West) separated at the Great Plains rather than the Mississippi River or Continental Divide (Figure 1A). Haplotypes from these two clades on the network are separated by at least 13 mutations (considering gaps). All individuals within sample groups had strictly East or West haplotypes with one exception: one sample in Oklahoma (KS-OK sample group) had a West haplotype when all others had East haplotypes (Figure 1A).
Estimates of pairwise FST values between the sample groups ranged from effectively 0 to 1, with the most differentiation occurring between East and West sample groups (Supplementary Figure 2). PCoA showed the first axis explained 47.8% of the variation and clearly divided West from East sample groups at the Great Plains (Figure 1C). The second axis explained 11.3% of the variation and separated sample groups in the East, with the lower-diversity northern populations in the Upper Midwest (MN-WI-ND, IA-NE) and New England (RI-CT, NH-VT-MA) clustering away from each other and the rest of the sample groups. The third axis explained 7.9% of the variation and separated sample groups in the West, with the interior sample groups clustering from those in California. Although there was a general pattern of geographic concordance, the sample groups did not clearly cluster by morphologically-defined subspecies (Figure 1C). Similarly, the AMOVA showed East and West sample groups were significantly differentiated (FCT = 0.741, P < 0.001). Results of the SAMOVA indicated that the grouping with the highest FCT value in the East differentiated the Upper Midwest (MN-WI-ND + IA-NE), New England (RI-CT + NH-VT-MA), LA, and all other sample groups (K = 4; FCT = 0.2738, P < 0.001; Supplementary Table 1 and Supplementary Figure 3). The pattern was more complicated in the West, where FCT values continued to incrementally increase with increasing K (Supplementary Figure 3). However, the largest increase in FCT occurred when moving to K = 4 (FCT = 0.3307, P < 0.001), which differentiated two interior groups ([CO_NM + TX] and [AZ_NM + NV + UT]), CA2, and all other California sample groups (Supplementary Table 1). The data demonstrated a significant pattern of isolation by distance overall (r = 0.376, P = 0.001), and within the East sample groups (r = 0.351, P = 0.001) but not the West sample groups (r = 0.175, P = 0.159; Supplementary Figure 4).
Mitogenomes
We identified 104 unique mitogenome haplotypes among 115 Urocyon samples. The median-joining network supported a clear east-west division, with a minimum of 286 steps (considering gaps) separating East (n = 53) and West (n = 51) haplotypes (Figure 2B). The island fox (U. littoralis) mitogenome haplotypes formed a unique cluster in the West and were not shared with any U. cinereoargenteus samples (in contrast to the control region haplotypes, Figure 1B), but overall, there was a lack of phylogeographic cohesiveness of morphologically-identified taxa (Figure 2B). Bayesian inference also strongly supported monophyletic East and West clades (BPP = 1), and a monophyletic clade (BPP = 1) of island foxes was nested within the West gray fox clade (Figure 2C). Although phylogeographic structure was somewhat more apparent within the West, with some subclades restricted to California and others more broadly distributed across the western interior (Supplementary Figure 5A), neither the West nor the East (Supplementary Figure 5B) showed support for geographically-restricted subclades consistent with recognized subspecies. The BEAST analysis estimated a mean divergence time of 0.796 Ma (95% HPD = 0.498–1.153 Ma) for the East and West lineages (Figure 4). Time to most recent common ancestor (TMRCA) for the East lineage was estimated at 0.132 Ma (95% HPD = 0.080–0.194), TMRCA for the West lineage was 0.180 Ma (95% HPD = 0.113–0.263 Ma), and TMRCA for the island fox was 0.087 Ma (95% HPD 0.053–0.125 Ma).
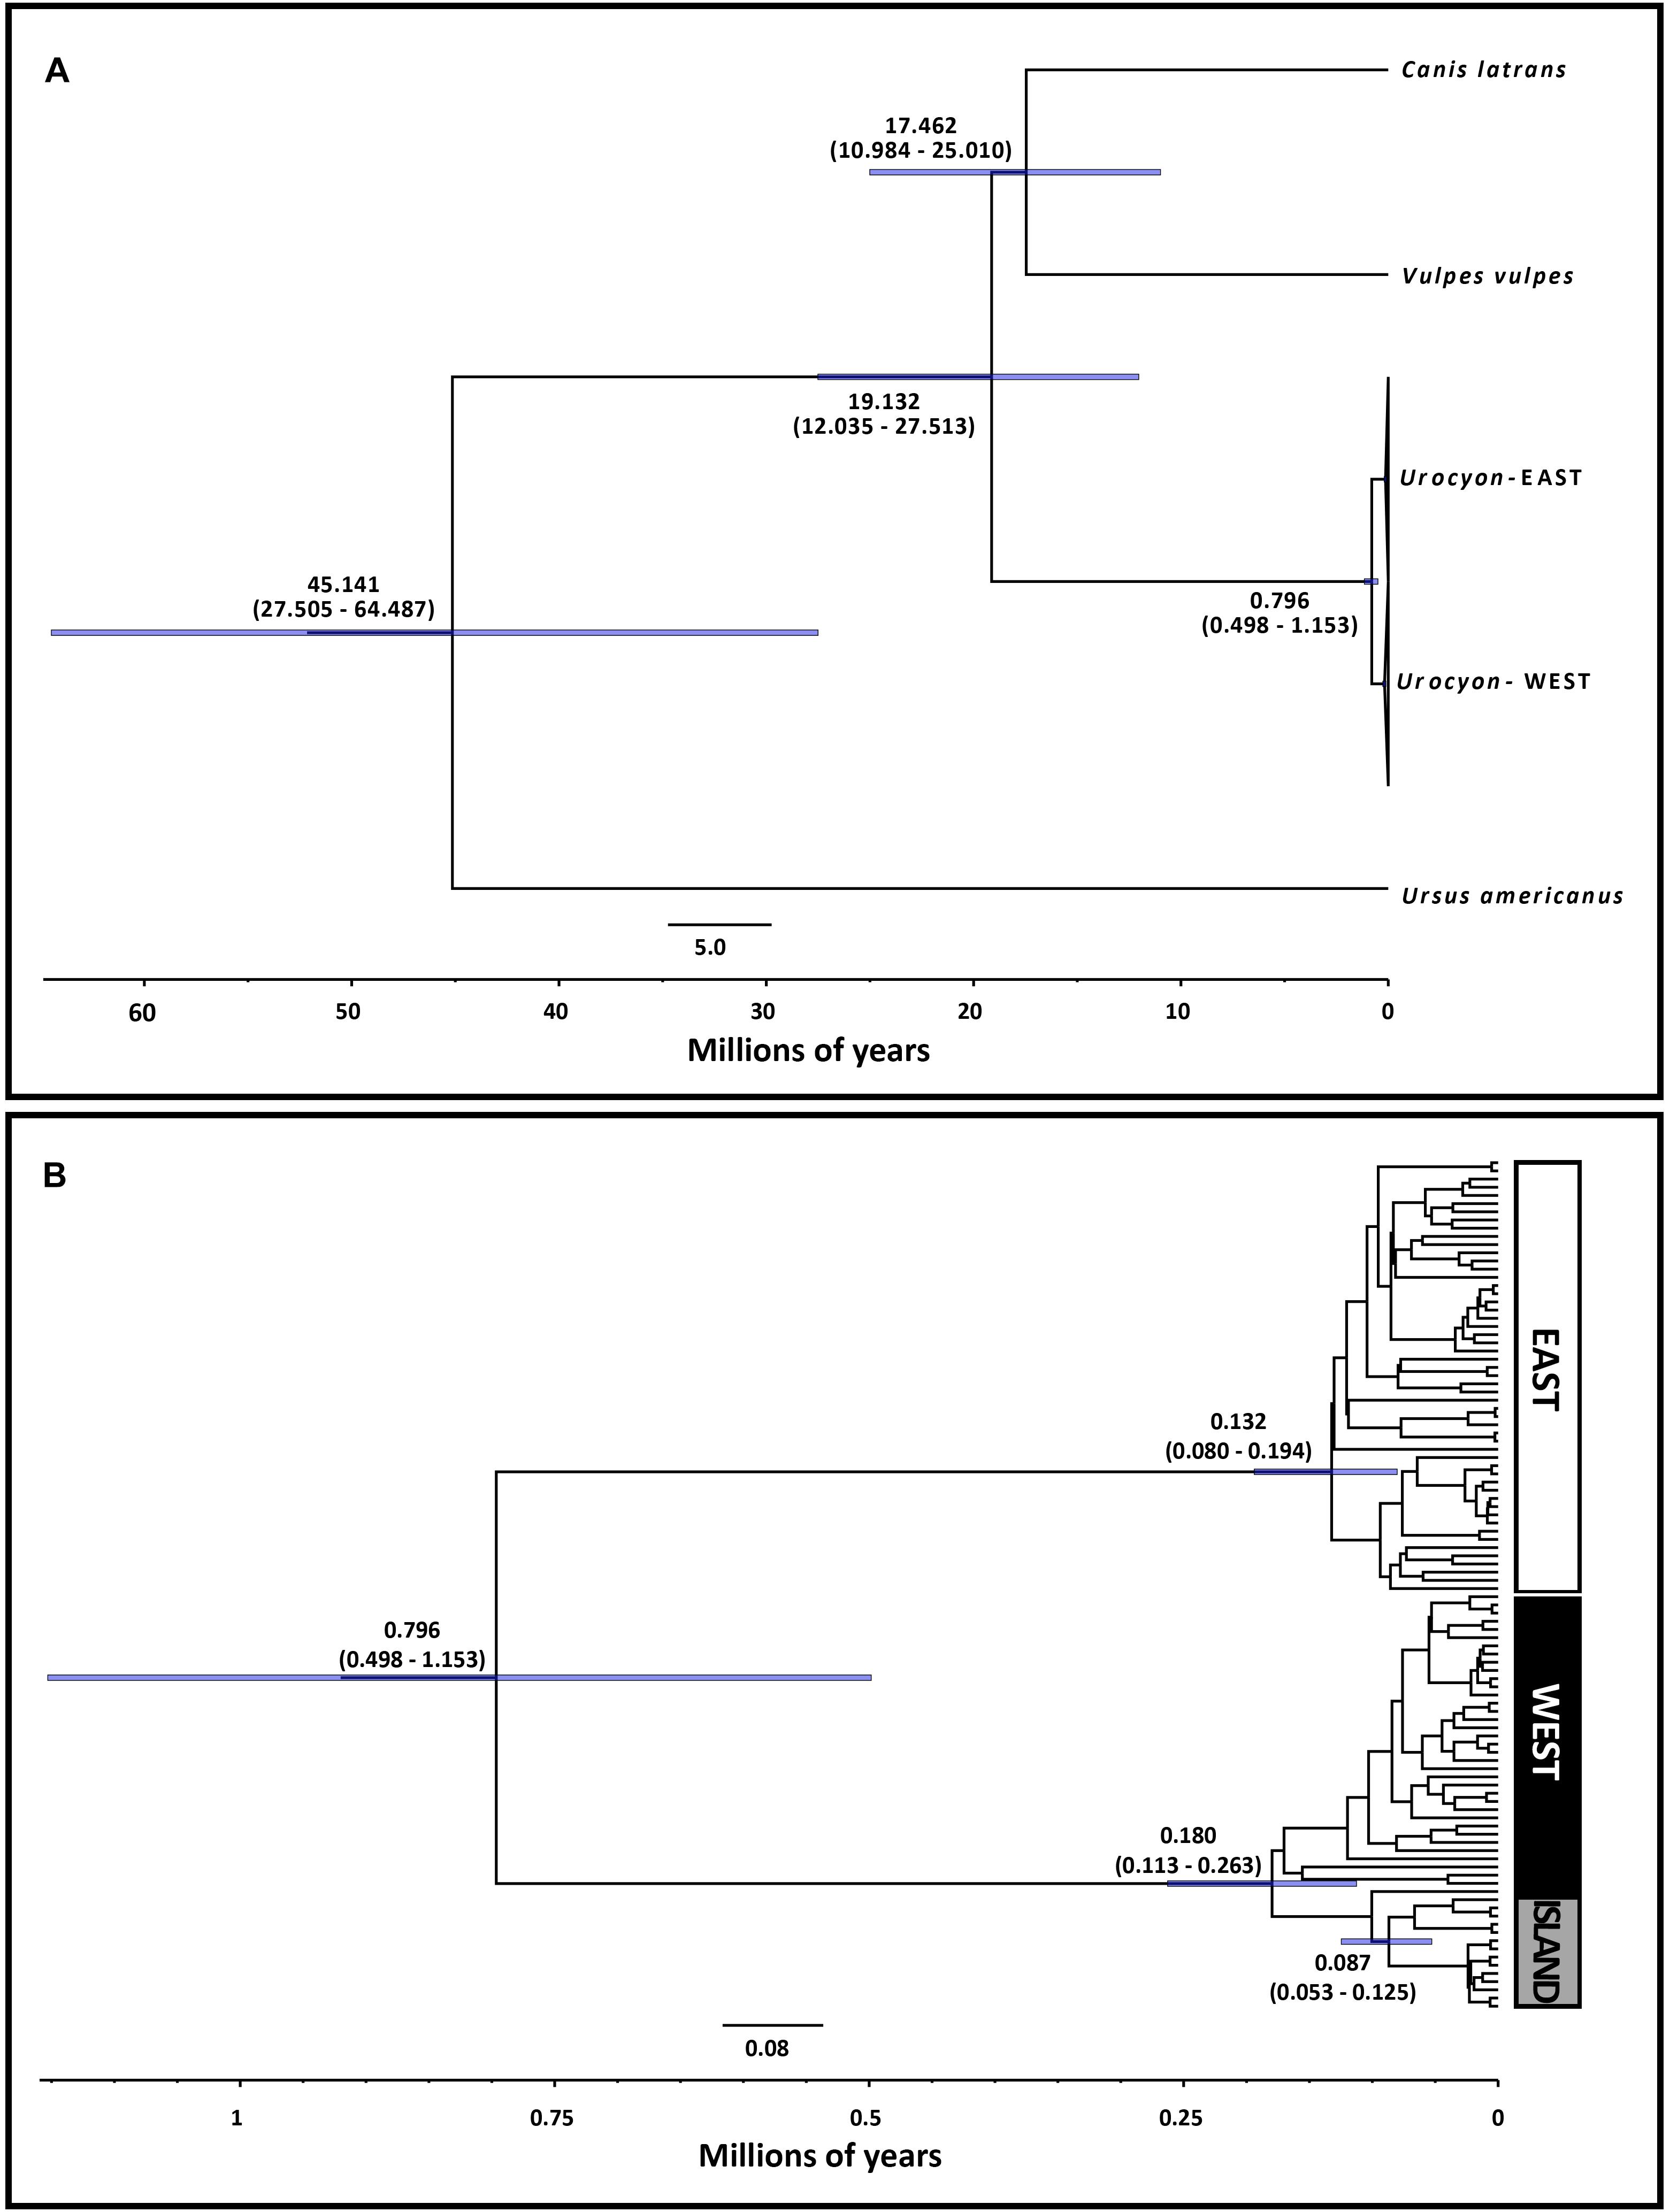
Figure 4. Estimated divergence time of eastern and western lineages of Urocyon based on BEAST analysis of mitochondrial genomes (D-loop omitted) for 104 Urocyon samples and 3 outgroups. (A) Full tree with East and West Urocyon clades collapsed and (B) Urocyon subtree. Blue bars on nodes and corresponding values in parentheses indicate the 95% highest probability density (HPD) interval for the mean time estimates.
Discussion
The control region and mitogenome data strongly support two major lineages of gray foxes in the United States: East and West clades that meet at the Great Plains. The pattern was consistently recovered in haplotype networks, phylogenetic reconstructions, and population-based analyses. These findings are concordant with the hypothesis of divergence in disjunct eastern and western North American forest refugia south of the ice sheets during glacial episodes. Phylogeographic support for eastern and western Pleistocene refugia has been reported in other North American carnivores, including American black bears (Ursus americanus, Wooding and Ward, 1997; Puckett et al., 2015), American and Pacific martens (Martes americanus and M. caurina, Stone et al., 2002), bobcats (Lynx rufus, Reding et al., 2012), red fox (Vulpes vulpes, Aubry et al., 2009), striped skunk (Mephitis mephitis, Barton and Wisely, 2012), spotted skunk (Spilogale spp., McDonough et al., 2020), and long-tailed weasel (Mustela frenata, Harding and Dragoo, 2012).
The Great Plains Suture Zone is recognized as a hotspot of secondary contact for diverse taxa (Swenson and Howard, 2004, 2005; Lovette, 2005; Swenson, 2006), but it is not as well-documented for wide-ranging carnivores. Many phylogeographic studies have focused on montane or boreal species, where the major divergence occurs between Pacific coastal and interior continental populations (e.g., V. vulpes, Aubry et al., 2009; M. caurina/americana, Stone et al., 2002; U. americanus, Wooding and Ward, 1997; Puckett et al., 2015), but with the latter sometimes showing shallow subdivision into eastern and western lineages at or west of the Great Lakes (Aubry et al., 2009; Pelletier et al., 2011; Puckett et al., 2015). Studies have also examined open habitat or grassland-associated species, which typically lack phylogeographic structure consistent with a single mid-continent Pleistocene refugium (e.g., black-footed ferret [Mustela nigripes], Wisely et al., 2008; American badger [Taxidea taxus], Kierepka and Latch, 2016; and coyote [Canis latrans], Koblmüller et al., 2012). Large carnivores such as the cougar (Puma concolor, Culver et al., 2000) and gray wolf (Canis lupus, Koblmüller et al., 2016) also lack phylogeographic structure due to recent (∼10 ka) recolonization of North America. Because they are often not of conservation concern, relatively few studies have examined continental patterns in common, temperate generalist and forest-associated carnivores, where a mid-continent phylogeographic break may be most likely (Barton and Wisely, 2012; Reding et al., 2012; McDonough et al., 2020).
Our study adds to a small but growing list of phylogeographic research on wide-ranging, common carnivores revealing east-west divergence. In gray fox, we found the location of secondary contact to center on the southern Great Plains (e.g., between western Texas and eastern Oklahoma). Bobcats show a nearly identical pattern, although the break is more diffuse and extends north into the northern Great Plains where bobcats are more common than gray fox (Reding et al., 2012). Divergence in the spotted skunk complex (Spilogale spp.) is also well characterized in the region, with the western lineage S. leucoparia inhabiting western Texas and S. interrupta in eastern Texas (McDonough et al., 2020). The Great Plains is also a region of admixture for southern and western lineages of striped skunk, though eastern lineages appear not to have expanded west of the Mississippi River drainage, a putative historical and contemporary geographic barrier (Barton and Wisely, 2012). Similarly, long-tailed weasels show diverged eastern and western lineages that appear to split at the Mississippi River (Harding and Dragoo, 2012). However, sampling gaps in the central United States lead to uncertainty in the location of secondary contact for these two species. Although all striped skunks sampled in Louisiana showed western haplotypes, consistent with a Mississippi River break, no samples were collected from areas just west of the river such as Arkansas, Missouri, Iowa, and Minnesota (Barton and Wisely, 2012). These states were also unsampled in long-tailed weasels, and eastern haplotypes were found in Louisiana and Texas, suggesting the break could exist farther west (Harding and Dragoo, 2012). Although we lacked samples from eastern Texas to pinpoint the precise location of secondary contact in gray foxes, all individuals sampled in states just west of the Mississippi River showed eastern haplotypes, providing no support for the Mississippi River as a major phylogeographic barrier in this species, unlike other carnivores (Cullingham et al., 2008; Barton and Wisely, 2012; Shaffer et al., 2018). Additional sampling and comparative work in the Great Plains region could help reveal concordant patterns in these and other carnivore species. For example, American mink (Neovison vison, García et al., 2017) and northern raccoon (Procyon lotor, Cullingham et al., 2008; Louppe et al., 2020) show promising trends of an east-west division.
Using mitogenomes, we estimated the divergence between eastern and western gray fox lineages to date to ∼0.8 Ma, a surprisingly deep division slightly older than the ∼0.5 Ma estimate reported by Goddard et al. (2015) based on mtDNA cytochrome b gene but still within the Pleistocene. For mobile carnivores, the east-west divergence is often shallow, typically dating to the Last Glacial Maximum at ∼23 ka (Aubry et al., 2009; Reding et al., 2012) or near the Penultimate Glacial Maximum at ∼140 ka (Puckett et al., 2015). Populations of species with high dispersal and flexible ecological requirements may have repeatedly expanded and interbred during interglacial periods when habitat was more connected, largely erasing signatures of divergence during earlier glacial extents (Barnosky, 2005). Compared to many carnivores, gray foxes have more intermediate dispersal distances (Whitmee and Orme, 2013), and with their unique tree-climbing behavior for foraging and predator avoidance, they are more strongly associated with forests (Fritzell and Haroldson, 1982). Fossils of U. cinereoargenteus are recorded at over 40 different Pleistocene sites in North America, predominantly in southwestern (e.g., California, Arizona, New Mexico, and Texas) and southeastern (Florida, Georgia, South Carolina, and Tennessee) United States (Kurtén and Anderson, 1980; Williams et al., 2018). Although records extend to Pennsylvania, Indiana, and Missouri, fossils appear absent from the Great Plains region prior to the Holocene (Williams et al., 2018), consistent with the area forming an ecological barrier for forest species (Mengel, 1970). Given the degree of divergence, eastern and western gray fox lineages have been isolated for multiple glacial-interglacial cycles. The timing is just shy of east-west divergence dates estimated for smaller carnivores such as spotted skunk and long-tailed weasel at around 1.5 and 2.2 Ma, respectively, (Harding and Dragoo, 2012; McDonough et al., 2020), which may warrant species-level recognition (McDonough et al., 2020). However, sampling of Urocyon taxa from across its range and the addition of nuclear markers will be needed to verify the divergence date estimated here.
In addition to the east-west divergence, Quaternary climate change influenced patterns of genetic diversity within each of these lineages. For example, low genetic diversity in northern areas in the East (e.g., Great Lakes and New England), where glacial ice persisted until ∼10–15 ka, is consistent with founder effects associated with rapid, recent recolonization (Hewitt, 1996). A similar pattern was seen with bobcats (Reding et al., 2012), indicating contemporary gene flow has not erased this pattern of recent expansion (Smith et al., 2011). Neither a pattern of declining diversity with increasing latitude, nor isolation by distance, was seen in the West. Such results may be indicative of a more complex scenario of multiple glacial refugia in the western United States, as indicated in studies of other carnivore taxa (Harding and Dragoo, 2012; Ferguson et al., 2017). To provide a more comprehensive view of the biogeography of Urocyon, additional sampling to cover the full range (e.g., from Mexico and Central and South America) of gray foxes will be needed, and ecological niche modeling could help reconstruct the locations of glacial refugia and recolonization routes (Puckett et al., 2015; Ferguson et al., 2017).
Our results provide some insight into the validity of current taxonomic classifications for Urocyon. Despite broad-scale sampling, we did not recover any additional, cryptic lineages of gray foxes in the United States. The east-west split does coincide with some noted phenotypic differences, with pelts from eastern foxes tending to be darker, duller, and less silvery (Obbard, 1987), and western forms generally having a more slender body with a longer tail and longer and more pointed ears (Mearns, 1891). As argued by Goddard et al. (2015), the divergence between eastern and western gray fox lineages is on par with some species-level distinctions in Canidae. Within the gray fox east-west lineages, we did not recover any clear phylogeographic structure besides a mitogenome monophyletic group of island foxes. Although the island fox is currently recognized as a separate species (U. littoralis), it is nested within the western gray fox lineage. A similar pattern occurs with the co-occurring island spotted skunk (Spilogale gracilis amphialus), which is considered a subspecies of the western spotted skunk (McDonough et al., 2020). Mitogenomes for the prairie gray fox (U. c. ocythous) showed no evidence of monophyly, but some haplotypes were present only in the Midwest and population-level analyses (PCoA and SAMOVA) tended to differentiate this subregion. Overall, haplotypes from major geographic regions and putative subspecies do not form discrete lineages, but structure within the eastern and western lineages is likely to be more recent and better characterized with nuclear markers. Our findings suggest taxonomic revision will be needed, and we recommend a comprehensive range-wide analysis considering phenotypic and molecular (mtDNA and nuclear markers) data to better inform pending conservation decisions (Department of the Interior, 2012).
The Great Plains may be a common but understudied phylogeographic break and zone of secondary contact in North American carnivores. If so, the finding has important implications for evaluating the importance of Pleistocene climate change as a driver of mammalian evolutionary divergence and speciation (Barnosky, 2005), informing conservation and management of biodiversity (Coates et al., 2018), and providing insight into the potential for recombination and spread of lineage-specific pathogens including zoonotic diseases (Dragoo et al., 2006; Barton and Wisely, 2012). Given the pattern we revealed with mtDNA, follow-up with nuclear markers would help with: (1) characterizing hybrid-zone structure and dynamics, including the extent and direction of admixture; (2) identifying genome regions potentially under divergent selection across the zone; and (3) evaluating population genetic structure within these two lineages. Furthermore, sampling from the gray fox range in Mexico and Central and South America will be necessary to fully understand biogeographic patterns and taxonomic classification of species and subspecies within the Urocyon genus. Finally, additional wide-ranging carnivore taxa such as long-tailed weasel, American mink, North American river otter (Lontra canadensis), and northern raccoon should be genetically sampled in the Great Plains region to examine broader support for a mammalian phylogeographic break at the Great Plains Suture Zone.
Data Availability Statement
The datasets presented in this study can be found in online repositories. The names of the repository/repositories and accession number(s) can be found below: NCBI GenBank; MW597742 – MW598121 and MW599994 – MW600068.
Ethics Statement
Ethical review and approval was not required for the animal study because data were derived from samples taken from legally-harvested or road-killed animals, or from previously published studies.
Author Contributions
DR, JB, WC, CH, and JM conceived and designed the study. DR, JB, SL, IC, and JM provided samples. DR, SS, and CH performed the laboratory work and sequence assemblies. DR performed the data analysis and SC-R performed the mitogenome phylogenetic and dating analyses. DR evaluated the results and drafted the manuscript together with CH, SC-R, and JM. DR and JM provided laboratory space for the project. All authors contributed to manuscript writing and approved it for publication.
Funding
This work was supported by Luther College, the Missouri Department of Conservation, Smithsonian Institution, and through grant ISF13-04 from the Iowa Science Foundation administered by the Iowa Academy of Science. This work was partially supported by the Department of Energy Office of Environmental Management under Award Number DE-EM0004391 to the University of Georgia Research Foundation.
Conflict of Interest
The authors declare that the research was conducted in the absence of any commercial or financial relationships that could be construed as a potential conflict of interest.
Acknowledgments
The project would not have been possible without the cooperation and support of many fur harvesters, fur buyers, state and federal agencies and biologists in collecting and donating samples and information (see Supplementary Appendix 1). We thank M. Oberfoell, T. May, J. Ash, B. Wollenzien, M. Crotty, J. Hadish, and L. Brondyke for assisting with DNA extractions and N. Rotzel McInerney for lab support at the Center for Conservation Genomics. We also thank F. Quintela and two reviewers for comments on an earlier draft.
Supplementary Material
The Supplementary Material for this article can be found online at: https://www.frontiersin.org/articles/10.3389/fevo.2021.666800/full#supplementary-material
Supplementary Figure 1 | Geographic pattern of nucleotide diversity for 31 Urocyon sample groups (n > 10) based on 400 bp of mtDNA control region. (A) Circles are located at the geographic mean center of each sample group and size reflects the quantile of the nucleotide diversity value. (B) Linear regression of nucleotide diversity by latitude for East and West sample groups.
Supplementary Figure 2 | Matrix of pairwise FST values (K2P-corrected) between Urocyon sample groups (n = 34) based on 400 bp of mtDNA control region.
Supplementary Figure 3 | Results of SAMOVA for (A) 19 East and (B) 12 West Urocyon sample groups (n > 10) based on 400 bp of mtDNA control region.
Supplementary Figure 4 | Relationship between pairwise geographic distance and genetic distance for East (n = 19) and West (n = 12) Urocyon sample groups based on 400 bp of mtDNA control region.
Supplementary Figure 5 | MrBayes subtrees for (A) West haplotypes and (B) East haplotypes based on the analysis of 104 unique Urocyon mitogenome haplotypes and two outgroups (Vulpes vulpes and Canis latrans, removed for clarity). Support for clades (BPP) is shown next to each node. Urocyon sample names reflect species (Uc = U. cinereoargenteus; Ul = U. littoralis), morphologically-based subspecies, location (state or island), and sample ID or GenBank accession number, and colors correspond to identified major clades. Maps show the ranges of morphologically-based subspecies, and the sampling locations of the mitogenomes are depicted as colored dots corresponding to major clade (as shown in the tree).
Supplementary Table 1 | Results of SAMOVA for 19 East and 12 West Urocyon sample groups (n > 10) based on 400 bp of mtDNA control region.
Supplementary Appendix 1 | An Excel file containing information about the samples used in this study.
Supplementary Alignment 1 | Fasta alignment file for mtDNA partial control region haplotypes.
Supplementary Alignment 2 | Fasta alignment file for mtDNA complete genome sequences (D-loop omitted) for BEAST analysis.
Footnotes
References
Aubry, K. B., Statham, M. J., Sacks, B. N., Perrine, J. D., and Wisely, S. M. (2009). Phylogeography of the North American red fox: vicariance in Pleistocene forest refugia. Mol. Ecol. 18, 2668–2686. doi: 10.1111/j.1365-294x.2009.04222.x
Bandelt, H.-J., Forster, P., and Röhl, A. (1999). Median-joining networks for inferring intraspecific phylogenies. Mol. Biol. Evol. 16, 37–48. doi: 10.1093/oxfordjournals.molbev.a026036
Barnosky, A. D. (2005). Effects of Quaternary climate change on speciation in mammals. J. Mamm. Evol. 12, 247–264. doi: 10.1007/s10914-005-4858-8
Barton, H. D., and Wisely, S. M. (2012). Phylogeography of striped skunks (Mephitis mephitis) in North America: pleistocene dispersal and contemporary population structure. J. Mamm. 93, 38–51. doi: 10.1644/10-mamm-a-270.1
Bouckaert, R., Heled, J., Kühnert, D., Vaughan, T., Wu, C.-H., Xie, D., et al. (2014). BEAST 2: a software platform for Bayesian evolutionary analysis. PLoS Comput. Biol. 10:e1003537. doi: 10.1371/journal.pcbi.1003537
Bozarth, C. A., Lance, S. L., Civitello, D. J., Glenn, J. L., and Maldonado, J. E. (2011). Phylogeography of the gray fox (Urocyon cinereoargenteus) in the eastern United States. J. Mamm. 92, 283–294. doi: 10.1644/10-mamm-a-141.1
Brant, S. V., and Ortí, G. (2002). Molecular phylogeny of short-tailed shrews, Blarina (Insectivora: Soricidae). Mol. Phylogenet. Evol. 22, 163–173. doi: 10.1006/mpev.2001.1057
Bronson, C. L., Grubb, T. C. Jr., and Braun, M. J. (2003). A test of the endogenous and exogenous selection hypotheses for the maintenance of a narrow avian hybrid zone. Evolution 57, 630–637. doi: 10.1111/j.0014-3820.2003.tb01554.x
Coates, D. J., Byrne, M., and Moritz, C. (2018). Genetic diversity and conservation units: dealing with the species-population continuum in the age of genomics. Front. Ecol. Evol. 6:165. doi: 10.3389/fevo.2018.00165
Cullingham, C. I., Kyle, C. J., Pond, B. A., and White, B. N. (2008). Genetic structure of racoons in eastern North America based on mtDNA: implications for subspecies designation and rabies disease dynamics. Can. J. Zool. 86, 947–958. doi: 10.1139/z08-072
Culver, M., Johnson, W. E., Pecon-Slattery, J., and O’Brien, S. J. (2000). Genomic ancestry of the American puma (Puma concolor). J. Hered. 91, 186–197. doi: 10.1093/jhered/91.3.186
Darriba, D., Taboada, G. L., Doallo, R., and Posada, D. (2012). jModelTest 2: more models, new heuristics and parallel computing. Nat. Methods 9:772. doi: 10.1038/nmeth.2109
Deems, E. F. Jr., and Pursley, D. (1978). North American Furbearers: Their Management, Research, and Harvest Status in 1976. Washington, DC: International Association of Fish and Wildlife Agencies.
Department of the Interior (2012). Endangered and threatened wildlife and plants; 90-day finding on a petition to list the prairie gray fox, the plains spotted skunk, and a distinct population segment of the Mearn’s eastern cottontail in east-central Illinois and western Indiana as endangered or threatened species. Federal Register. 77, 71759–71771.
Dragoo, J. W., Lackey, J. A., Moore, K. E., Lessa, E. P., Cook, J. A., and Yates, T. L. (2006). Phylogeography of the deer mouse (Peromyscus maniculatus) provides a predictive framework for research on hantaviruses. J. Gen. Virol. 87, 1997–2003. doi: 10.1099/vir.0.81576-0
Dupanloup, I., Schneider, S., and Excoffier, L. (2002). A simulated annealing approach to define the genetic structure of populations. Mol. Ecol. 11, 2571–2581. doi: 10.1046/j.1365-294x.2002.01650.x
Excoffier, L., and Lischer, H. E. L. (2010). Arlequin suite ver 3.5: a new series of programs to perform population genetics analyses under Linux and Windows. Mol. Ecol. Resour. 10, 564–567. doi: 10.1111/j.1755-0998.2010.02847.x
Ferguson, A. W., McDonough, M. M., Guerra, G. I., Rheude, M., Dragoo, J. W., Ammerman, L. K., et al. (2017). Phylogeography of a widespread small carnivore, the western spotted skunk (Spilogale gracilis) reveals temporally variable signatures of isolation across western North America. Ecol. Evol. 7, 4229–4240. doi: 10.1002/ece3.2931
Feutry, P., Kyne, P. M., Pillans, R. D., Chen, X., Naylor, G. J. P., and Grewe, P. M. (2014). Mitogenomics of the speartooth shark challenges ten years of control region sequencing. BMC Evol. Biol. 14:232. doi: 10.1186/s12862-014-0232-x
Fritzell, E. K., and Haroldson, K. J. (1982). Urocyon cinereoargenteus. Mammal. Spec. 189, 1–8. doi: 10.2307/3503957
García, K., Melero, Y., Palazón, S., Gosálbez, J., and Castersana, J. (2017). Spatial mixing of mitochondrial lineages and greater genetic diversity in some invasive populations of the American mink (Neovison vison) compared to native populations. Biol. Invasions 19, 2663–2673. doi: 10.1007/s10530-017-1475-4
Goddard, N. S., Statham, M. J., and Sacks, B. N. (2015). Mitochondrial analysis of the most basal canid reveals deep divergence between eastern and western North American gray foxes (Urocyon spp.) and ancient roots in Pleistocene California. PLoS One 10:e0136329. doi: 10.1371/journal.pone.0136329
Graham, R. W., Lundelius, E. L. Jr., Graham, M. A., Schroeder, E. K., and Toomey, R. S. III (1996). Spatial response of mammals to Late Quaternary environmental fluctuations. Science 272, 1601–1606. doi: 10.1126/science.272.5268.1601
Harding, L. E., and Dragoo, J. W. (2012). Out of the tropics: a phylogeographic history of the long-tailed weasel, Mustela frenata. J. Mamm. 93, 1178–1194. doi: 10.1644/11-mamm-a-280.1
Hargrove, W. W., and Hoffman, F. M. (2005). Potential of multivariate quantitative methods for delineation and visualization of ecoregions. Environ. Manage. 34(Suppl. 1), S39–S60.
Hewitt, G. M. (1996). Some genetic consequences of ice ages, and their role in divergence and speciation. Biol. J. Linn. Soc. 58, 247–276. doi: 10.1006/bijl.1996.0035
Hewitt, G. M. (2000). The genetic legacy of the Quaternary ice ages. Nature 405, 907–913. doi: 10.1038/35016000
Hewitt, G. M. (2004). Genetic consequences of climatic oscillations in the Quaternary. Philos. Trans. R. Soc. Lond. B 359, 183–195. doi: 10.1098/rstb.2003.1388
Hofman, C. A., Rick, T. C., Hawkins, M. T. R., Funk, W. C., Ralls, K., Boser, C. L., et al. (2015). Mitochondrial genomes suggest rapid evolution of dwarf California Channel Islands foxes (Urocyon littoralis). PLoS One 10:e0118240. doi: 10.1371/journal.pone.0118240
Hofreiter, M., and Stewart, J. (2009). Ecology change, range fluctuations and population dynamics during the Pleistocene. Curr. Biol. 19, R584–R594.
Huelsenbeck, J. P., and Ronquist, F. (2001). MRBAYES: Bayesian inference of phylogeny. Bioinformatics 17, 754–755. doi: 10.1093/bioinformatics/17.8.754
Johnson, N. K., and Cicero, C. (2004). New mitochondrial DNA data affirm the importance of Pleistocene speciation in North American birds. Evolution 58, 1122–1130. doi: 10.1554/03-283
Kerhoulas, N. J., and Arbogast, B. S. (2010). Molecular systematics and Pleistocene biogeography of Mesoamerican flying squirrels. J. Mamm. 91, 654–557. doi: 10.1644/09-mamm-a-260.1
Kierepka, E. M., and Latch, E. K. (2016). High gene flow in the American badger overrides habitat preferences and limits broadscale genetic structure. Mol. Ecol. 25, 6055–6076. doi: 10.1111/mec.13915
Kimura, M. (1980). A simple method for estimating evolutionary rates of base substitutions through comparative studies of nucleotide sequences. J. Mol. Evol. 16, 111–120. doi: 10.1007/bf01731581
Klicka, J., and Zink, R. M. (1997). The importance of recent Ice Ages in speciation: a failed paradigm. Science 277, 1666–1669. doi: 10.1126/science.277.5332.1666
Knaus, B. J., Cronn, R., Liston, A., Pilgrim, K., and Schwartz, M. K. (2011). Mitochondrial genome sequences illuminate maternal lineages of conservation concern in a rare carnivore. BMC Ecol. 11:10. doi: 10.1186/1472-6785-11-10
Koblmüller, S., Vilà, C., Lorente-Galdos, B., Dabad, M., Ramirez, O., Marques-Bonet, T., et al. (2016). Whole mitochondrial genomes illuminate ancient intercontinental dispersals of grey wolves (Canis lupus). J. Biogeogr. 43, 1728–1738. doi: 10.1111/jbi.12765
Koblmüller, S., Wayne, R. K., and Leonard, J. A. (2012). Impact of Quaternary climatic changes and interspecific competition on the demographic history of a highly mobile generalist carnivore, the coyote. Biol. Lett. 8, 644–647. doi: 10.1098/rsbl.2012.0162
Kocher, T. D., Thomas, W. K., Meyer, A., Edwards, S. V., Pääbo, S., Villablanca, F. X., et al. (1989). Dynamics of mitochondrial DNA evolution in animals: amplification and sequencing with conserved primers. Proc. Natl. Acad. Sci. U.S.A. 86, 6196–6200. doi: 10.1073/pnas.86.16.6196
Kurtén, B., and Anderson, E. (1980). Pleistocene Mammals of North America. New York: Columbia University Press.
Lanfear, R., Frandsen, P. B., Wright, A. M., Senfeld, T., and Calcott, B. (2016). PartitionFinder 2: new methods for selecting partitioned models of evolution for molecular and morphological phylogenetic analyses. Mol. Biol. Evol. 34, 772–773.
Leigh, J. W., and Bryant, D. (2015). POPART: full-feature software for haplotype network construction. Methods Ecol. Evol. 6, 1110–1116. doi: 10.1111/2041-210x.12410
Lessa, E. P., Cook, J. A., and Patton, J. L. (2003). Genetic footprints of demographic expansion in North America, but not Amazonia, during the Late Quaternary. Proc. Natl. Acad. Sci. U.S.A. 100, 10331–10334. doi: 10.1073/pnas.1730921100
Librado, P., and Rozas, J. (2009). DnaSP v5: a software for comprehensive analysis of DNA polymorphism data. Bioinformatics 25, 1451–1452. doi: 10.1093/bioinformatics/btp187
Louppe, V., Baron, J., Pons, J.-M., and Veron, G. (2020). New insights on the geographical origins of the Caribbean raccoons. J. Zool. Syst. Evol. Res. 00, 1–20.
Loveless, A. M., Reding, D. M., Kapfer, P. M., and Papeş, M. (2016). Combining ecological niche modelling and morphology to assess the range-wide population genetic structure of bobcats (Lynx rufus). Biol. J. Linn. Soc. 117, 842–857. doi: 10.1111/bij.12718
Lovette, I. J. (2005). Glacial cycles and the tempo of avian speciation. Trends Ecol. Evol. 20, 57–59. doi: 10.1016/j.tree.2004.11.011
McDonough, M. M., Ferguson, A. W., Dowler, R. C., Gompper, M. E., and Maldonado, J. E. (2020). Phylogenomic systematics of spotted skunks (Carnivora, Mephitidae, Spilogale): additional species diversity and Pleistocene climate change as a major driver of diversification. bioRxiv [Preprint]. doi: 10.1101/2020.10.23.353045
McKenna, M. C., and Bell, S. K. (1997). Classification of Mammals: Above the Species Level. New York, NY: Columbia University Press.
Mearns, E. A. (1891). Description of a new species of weasel, and a new subspecies of the gray fox, from Arizona. Bull. Am. Mus. Nat. Hist. 3, 234–238.
Mengel, R. M. (1970). “The North American Central Plains as an isolating agent in bird speciation,” in Pleistocene and Recent Environments of the Central Great Plains, eds W. Dort and Jr. J. K. Jones Jr. (Lawrence: The University Press of Kansas).
Moore, W. S. (1977). An evaluation of narrow hybrid zones in vertebrates. Q. Rev. Biol. 52, 263–277. doi: 10.1086/409995
Moore, W. S., and Price, J. T. (1993). “Nature of selection in the northern flicker hybrid zone and its implications for speciation theory,” in Hybrid Zones and the Evolutionary Process, ed. R. G. Harrison (Oxford: Oxford University Press), 196–225.
Obbard, M. E. (1987). “Fur grading and pelt identification,” in Wild Furbearer Management and Conservation in North America, eds M. Novak, J. A. Baker, M. E. Obbard, and B. Malloch (Ontario: Ontario Ministry of Natural Resources), 717–826.
Pauls, S. U., Nowak, C., Bálint, M., and Pfenninger, M. (2013). The impact of global climate change on genetic diversity within populations and species. Mol. Ecol. 22, 925–946. doi: 10.1111/mec.12152
Peakall, R., and Smouse, P. E. (2006). GENALEX 6: genetic analysis in Excel. Population genetic software for teaching and research. Mol. Ecol. Notes 6, 288–295. doi: 10.1111/j.1471-8286.2005.01155.x
Peakall, R., and Smouse, P. E. (2012). GenAlEx 6.5: genetic analysis in Excel. Population genetic software for teaching and research – an update. Bioinformatics 28, 2537–2539. doi: 10.1093/bioinformatics/bts460
Pelletier, A., Obbard, M. E., White, B. N., Doyle, C., and Kyle, C. J. (2011). Small-scale genetic structure of American black bears illustrates potential postglacial recolonization routes. J. Mammal. 92, 629–644. doi: 10.1644/10-mamm-a-212.1
Peterson, A. T., and Ammann, C. M. (2013). Global patterns of connectivity and isolation of populations of forest bird species in the late Pleistocene. Glob. Ecol. Biogeogr. 22, 596–606. doi: 10.1111/geb.12010
Puckett, E. E., Etter, P. D., Johnson, E. A., and Eggert, L. S. (2015). Phylogeographic analyses of American black bears (Ursus americanus) suggest four glacial refugia and complex patterns of postglacial admixture. Mol. Biol. Evol. 32, 2338–2350. doi: 10.1093/molbev/msv114
Rambaut, A., Drummond, A. J., Xie, D., Baele, G., and Suchard, M. A. (2018). Posterior summarization in Bayesian phylogenetics using Tracer 1.7. Syst. Biol. 67, 901–904. doi: 10.1093/sysbio/syy032
Reding, D. M., Bronikowski, A. M., Johnson, W. E., and Clark, W. R. (2012). Pleistocene and ecological effects on continental-scale genetic differentiation in the bobcat (Lynx rufus). Mol. Ecol. 21, 3078–3093. doi: 10.1111/j.1365-294x.2012.05595.x
Remington, C. L. (1968). “Suture-zones of hybrid interaction between recently joined biotas,” in Evolutionary Biology, eds T. Dobzhansky, M. K. Hecht, and W. C. Steer (New York, NY: Appleton-Century-Crofts), 321–428. doi: 10.1007/978-1-4684-8094-8_8
Rising, J. D. (1969). A comparison of metabolism and evaporative water loss of Baltimore and Bullock orioles. Comp. Biochem. Physiol. 31, 915–925. doi: 10.1016/0010-406x(69)91801-5
Rising, J. D. (1970). Morphological variation and evolution in some North American orioles. Syst. Zool. 19, 315–351. doi: 10.2307/2412275
Rising, J. D. (1983). The Great Plains hybrid zones. Curr. Ornith. 1, 131–157. doi: 10.1007/978-1-4615-6781-3_5
Rissler, L. J., and Smith, W. H. (2010). Mapping amphibian contact zones and phylogeographic break hotspots across the United States. Mol. Ecol. 19, 5404–5416. doi: 10.1111/j.1365-294x.2010.04879.x
Ronquist, F., and Huelsenbeck, J. P. (2003). MRBAYES 3: Bayesian phylogenetic inference under mixed models. Bioinformatics 19, 1572–1574. doi: 10.1093/bioinformatics/btg180
Rueness, E. K., Stenseth, N. C., and O’Donoghue, M. (2003). Ecological and genetic spatial structuring in the Canadian lynx. Nature 425, 69–72. doi: 10.1038/nature01942
Shaffer, A. A., Dowler, R. C., Perkins, J. C., Ferguson, A. W., McDonough, M. M., and Ammerman, L. K. (2018). Genetic variation in the eastern spotted skunk (Spilogale putorius) with emphasis on the plains spotted skunk (S. p. interrupta). J. Mammal. 99, 1237–1248. doi: 10.1093/jmammal/gyy098
Slater, G. J., Harmon, L. J., and Alfaro, M. E. (2012). Integrating fossils with molecular phylogenies improves inference of trait evolution. Evolution 66, 3931–3944. doi: 10.1111/j.1558-5646.2012.01723.x
Smith, B. T., Escalante, P., Hernández Baños, B. E., Navarro-Sigüenza, A. G., Rohwer, S., and Klicka, J. (2011). The role of historical and contemporary processes on phylogeographic structure and genetic diversity in the Northern Cardinal, Cardinalis cardinalis. BMC Evol. Biol. 11:136. doi: 10.1186/1471-2148-11-136
Stone, K. D., Flynn, R. W., and Cook, J. A. (2002). Post-glacial colonization of northwestern North America by the forest-associated American marten (Martes americana, Mammalia: Carnivora: Mustelidae). Mol. Ecol. 11, 2049–2063. doi: 10.1046/j.1365-294x.2002.01596.x
Swenson, N. G. (2006). GIS-based niche models reveal unifying climatic mechanisms that maintain the location of avian hybrid zones in a North American suture zone. J. Evol. Biol. 19, 717–725. doi: 10.1111/j.1420-9101.2005.01066.x
Swenson, N. G., and Howard, D. J. (2004). Do suture zones exist? Evolution 58, 2391–2397. doi: 10.1554/04-239
Swenson, N. G., and Howard, D. J. (2005). Clustering of contact zones, hybrid zones, and phylogeographic breaks in North America. Am. Nat. 166, 581–591. doi: 10.2307/3491217
Wade, D., and Alton, T. (2012). A Petition to List Three Grassland and Thicket (Early-Successional) Species as Threatened or Endangered Under Section 4 of the Endangered Species Act of 1973. Available Online at: http://www.fws.gov/midwest/es/soc/mammals/pdf/PetitionList4SppGrasslandThicket.pdf (accessed 3 January, 2013).
Webb, T. III, and Bartlein, P. J. (1992). Global changes during the last 3 million years: climatic controls and biotic responses. Annu. Rev. Ecol. Syst. 23, 141–173. doi: 10.1146/annurev.es.23.110192.001041
Weir, J., and Schluter, D. (2004). Ice sheets promote speciation in boreal birds. Proc. R. Soc. Lond. B 271, 1881–1887. doi: 10.1098/rspb.2004.2803
Werle, E., Schneider, C., Renner, M., Völker, M., and Fiehn, W. (1994). Convenient single-step, one tube purification of PCR products for direct sequencing. Nucleic Acids Res. 22, 4354–4355. doi: 10.1093/nar/22.20.4354
Whitmee, S., and Orme, C. D. L. (2013). Predicting dispersal distance in mammals: a trait-based approach. J. Anim. Ecol. 82, 211–221. doi: 10.1111/j.1365-2656.2012.02030.x
Williams, J. W., Grimm, E. G., Blois, J., Charles, D. F., Davis, E., Goring, S. J., et al. (2018). The Neotoma Paleoecology Database: a multi-proxy, international community-curated data resource. Quat. Res. 89, 156–177.
Wisely, S. M., Statham, M. J., and Fleischer, R. C. (2008). Pleistocene refugia and Holocene expansion of a grassland-dependent species, the black-footed ferret (Mustela nigripes). J. Mammal. 89, 87–96. doi: 10.1644/07-mamm-a-077.1
Wooding, S., and Ward, R. H. (1997). Phylogeography and Pleistocene evolution in the North American black bear. Mol. Biol. Evol. 14, 1096–1105. doi: 10.1093/oxfordjournals.molbev.a025719
Keywords: Great Plains Suture Zone, mammal, mitogenome, phylogeography, secondary contact, subspecies
Citation: Reding DM, Castañeda-Rico S, Shirazi S, Hofman CA, Cancellare IA, Lance SL, Beringer J, Clark WR and Maldonado JE (2021) Mitochondrial Genomes of the United States Distribution of Gray Fox (Urocyon cinereoargenteus) Reveal a Major Phylogeographic Break at the Great Plains Suture Zone. Front. Ecol. Evol. 9:666800. doi: 10.3389/fevo.2021.666800
Received: 11 February 2021; Accepted: 07 May 2021;
Published: 08 June 2021.
Edited by:
Fernando Marques Quintela, Taxa Mundi Institute, BrazilReviewed by:
Terrence C. Demos, Field Museum of Natural History, United StatesLigia Tchaicka, State University of Maranhão, Brazil
Copyright © 2021 Reding, Castañeda-Rico, Shirazi, Hofman, Cancellare, Lance, Beringer, and Clark. At least a portion of this work is authored by Jesus E. Maldonado on behalf of the U.S. Government and, as regards Dr. Maldonado and the U.S. Government are not subject to copyright protection in the United States. This is an open-access article distributed under the terms of the Creative Commons Attribution License (CC BY). The use, distribution or reproduction in other forums is permitted, provided the original author(s) and the copyright owner(s) are credited and that the original publication in this journal is cited, in accordance with accepted academic practice. No use, distribution or reproduction is permitted which does not comply with these terms.
*Correspondence: Dawn M. Reding, cmVkaWRhMDFAbHV0aGVyLmVkdQ==
†Present address: Sabrina Shirazi, Department of Ecology and Evolutionary Biology, University of California Santa Cruz, Santa Cruz, CA, United States; Courtney A. Hofman, Laboratories of Molecular Anthropology and Microbiome Research, University of Oklahoma, Norman, OK, United States; Department of Anthropology, University of Oklahoma, Norman, OK, United States