 John P. DeLong
 Stella F. Uiterwaal1
 Anthony I. Dell
94% of researchers rate our articles as excellent or good
Learn more about the work of our research integrity team to safeguard the quality of each article we publish.
Find out more
ORIGINAL RESEARCH article
Front. Ecol. Evol., 17 June 2021
Sec. Population, Community, and Ecosystem Dynamics
Volume 9 - 2021 | https://doi.org/10.3389/fevo.2021.649542
This article is part of the Research TopicNew Perspectives and Emerging Directions in Predator–Prey Functional Response Research: Hommage to C.S. Holling (1930–2019)View all 18 articles
Although average, species-level interaction strength plays a key role in driving population dynamics and community structure, predator-prey interactions occur among individuals. As a result, individual variation in foraging rates may play an important role in determining the effects of predator-prey interactions on communities. Such variation in foraging rates stems from individual variation in traits that influence the mechanistic components of the functional response, such as movements that determine encounters and behaviors such as decisions to attack. However, we still have little information about individual-level variation in functional responses or the traits that give rise to such variation. Here we combine a standard functional response experiment with wolf spiders foraging on fruit flies with a novel analysis to connect individual morphology, physiology, and movement to individual foraging performance. We found substantial variation in traits between males and females, but these were not clearly linked to the differences in the functional response between males and females. Contrary to expectations, we found no effect of body velocity, leg length, energetic state, or metabolic rate on foraging performance. Instead, we found that body mass interacted with body rotations (clockwise turns), such that larger spiders showed higher foraging performance when they turned more but the reverse was true for smaller spiders. Our results highlight the need to understand the apparent complexity of the links between the traits of individuals and the functional response.
Interaction strengths among consumer-resource pairs have far-reaching effects on population stability, community composition, and ecosystem services (Wootton and Emmerson, 2005; Jones and Post, 2013; Kalinkat et al., 2013; Gilbert et al., 2014). These interaction strengths depend on the abundances of interacting species but also are strongly tied to the per capita rate at which consumers forage for resources. Although mean foraging rates are a critical component of trophic interaction strengths (McCann et al., 1998; Novak and Wootton, 2010; Gilbert et al., 2014), variation in foraging rates among individuals within a species can alter community-level functions and properties (Schreiber et al., 2011; Gibert and DeLong, 2017). Our understanding of the causes of such individual variation in foraging rates, however, is limited.
Foraging is affected by many morphological, behavioral, and abiotic factors, but the rate of foraging is principally governed by the functional response (Holling, 1959; DeLong, 2021). The type II, saturating functional response typically describes the per capita rate of foraging of an individual consumer, fpc, as
where a is the space clearance rate (the space completely cleared of resources by a consumer per time), h is handling time (the reduction in searching time associated with a captured resource), and R is the abundance or density of the resource.
Generally, functional responses are measured on groups of foragers. Experiments typically incorporate multiple individuals both within trials (e.g., the use of multiple predators foraging simultaneously) and among trials (different individuals used for different trials). This approach provides an estimate of the mean functional response for the population, assuming that individuals chosen for the experiment are representative of the population. Estimating functional responses of individuals is possible but intensive. As of now, very few functional responses have been measured for individual consumers or even set up to reveal the effects of individual variation across groups with shared traits (e.g., age classes with similar body mass) (Spitze, 1985; Gergs and Ratte, 2009; McCoy et al., 2011; Schröder et al., 2016). Although new experimental methods have recently been developed to help estimate the functional responses of individuals (Coblentz and DeLong, 2020), here we use a traditional foraging trial approach but add a novel analysis to evaluate individual differences by assessing the residual foraging rate after accounting for the mean functional response.
Current research on individual variation in functional responses focuses on the parameters of the functional response. These parameters, however, are not traits themselves but emerge from the foraging process given a range of traits displayed by both consumer and resource individuals. In particular, the links between traits and the space clearance rate are reflected in an expression that captures the predation sequence. Predation events arise as encounters among consumer and resource individuals occur, consumers detect resources, consumers decide to attack resources, and finally, consumers successfully complete the attack (prey fail to escape) (Roberts et al., 2011; DeLong, 2021). Encounters then are proportional to the relative velocity of consumer and resource individuals, allowing us to write the space clearance rate in terms of the foraging sequence:
where d is the detection distance, pa is the probability of attack, ps is the probability of a success and is the root sum of squares velocity representing the relative velocity of the consumer and the resource (Aljetlawi et al., 2004; Pawar et al., 2012). Eq. 2 allows identification of hypotheses that link traits to individual differences in functional response parameters and therefore individual variation in foraging. In particular, movements should influence foraging through the relative velocity, motivation to forage through the probability of attack, and a variety of morphological traits should influence foraging through the ability to detect and capture prey (DeLong, 2021).
Similarly, handling time represents actions a consumer might take that cut into additional searching time. Morphological and physiological features also influence how long a consumer spends digesting prey, which is a potential component of handling time. Other traits that influence time requirements for digesting, or rest, will influence handling time, individual variation in foraging, and thus the effect of individual variation on interaction strengths.
For both handling time and space clearance rate, however, very few studies have evaluated either individual variation in the parameters themselves or in phenotypic traits that might be causally linked to the parameters. In one study, larger backswimmers (Notonecta maculata) detected water fleas (Daphnia magna) from farther away (an effect on d in Eq. 2) and encountered larger water fleas more often, suggesting that body size alters the predation sequence and leads to differences in individual foraging performance (Gergs and Ratte, 2009). Similarly, the space clearance rate of individual least killifish (Heterandria formosa) was positively correlated with predator body size, while handling time was negatively related to body size (Schröder et al., 2016). Other studies have shown that within-species variation occurs for different sexes (Walker and Rypstra, 2001; Ding-Xu et al., 2007; Dor et al., 2014), or if female, gravidity (Boswell and DeLong, 2019), indicating there may be many genetic, morphological, or physiological drivers of individual variation in functional responses. Although comparative studies broaden the conclusion that age and/or body size can influence the parameters of the functional response across species (Vucic-Pestic et al., 2010; Kalinkat et al., 2011; Rall et al., 2012; Li et al., 2018; Uiterwaal and DeLong, 2018, 2020), there exists little additional information about how individual trait variation leads to variation in foraging performance within species.
Here, we address this gap by evaluating the effects of movement, underlying metabolism, and morphology on the foraging performance of individual wolf spiders after accounting for the overall sex-specific functional response. We estimated the functional response of Schizocosa mccooki wolf spiders foraging on flightless Drosophila melanogaster using traditional functional response foraging trials. We then addressed hypotheses about how four sources of individual phenotypic variation (body mass, leg length, abdomen width, and resting metabolic rate) influence the functional response either directly or through behavior or other mechanisms (Figure 1). Each source of morphological or physiological variation has the potential to influence foraging in a few ways, through either effects on mechanisms altering space clearance rate or handling time directly or indirectly through metabolic rate. In most cases, the mechanisms are not observable during the course of a foraging trial, requiring us to take a paired approach. First, using automated video tracking (Dell et al., 2014), we were able to measure the movement of each spider, and thus test for links between traits, movement, and functional response residuals (hereafter residual foraging performance). This approach stems from the fact that movement strongly influences the rate of encounters, a critical step in the predation sequence. Second, for all other mechanisms, we test for links between phenotypic traits and residuals directly.
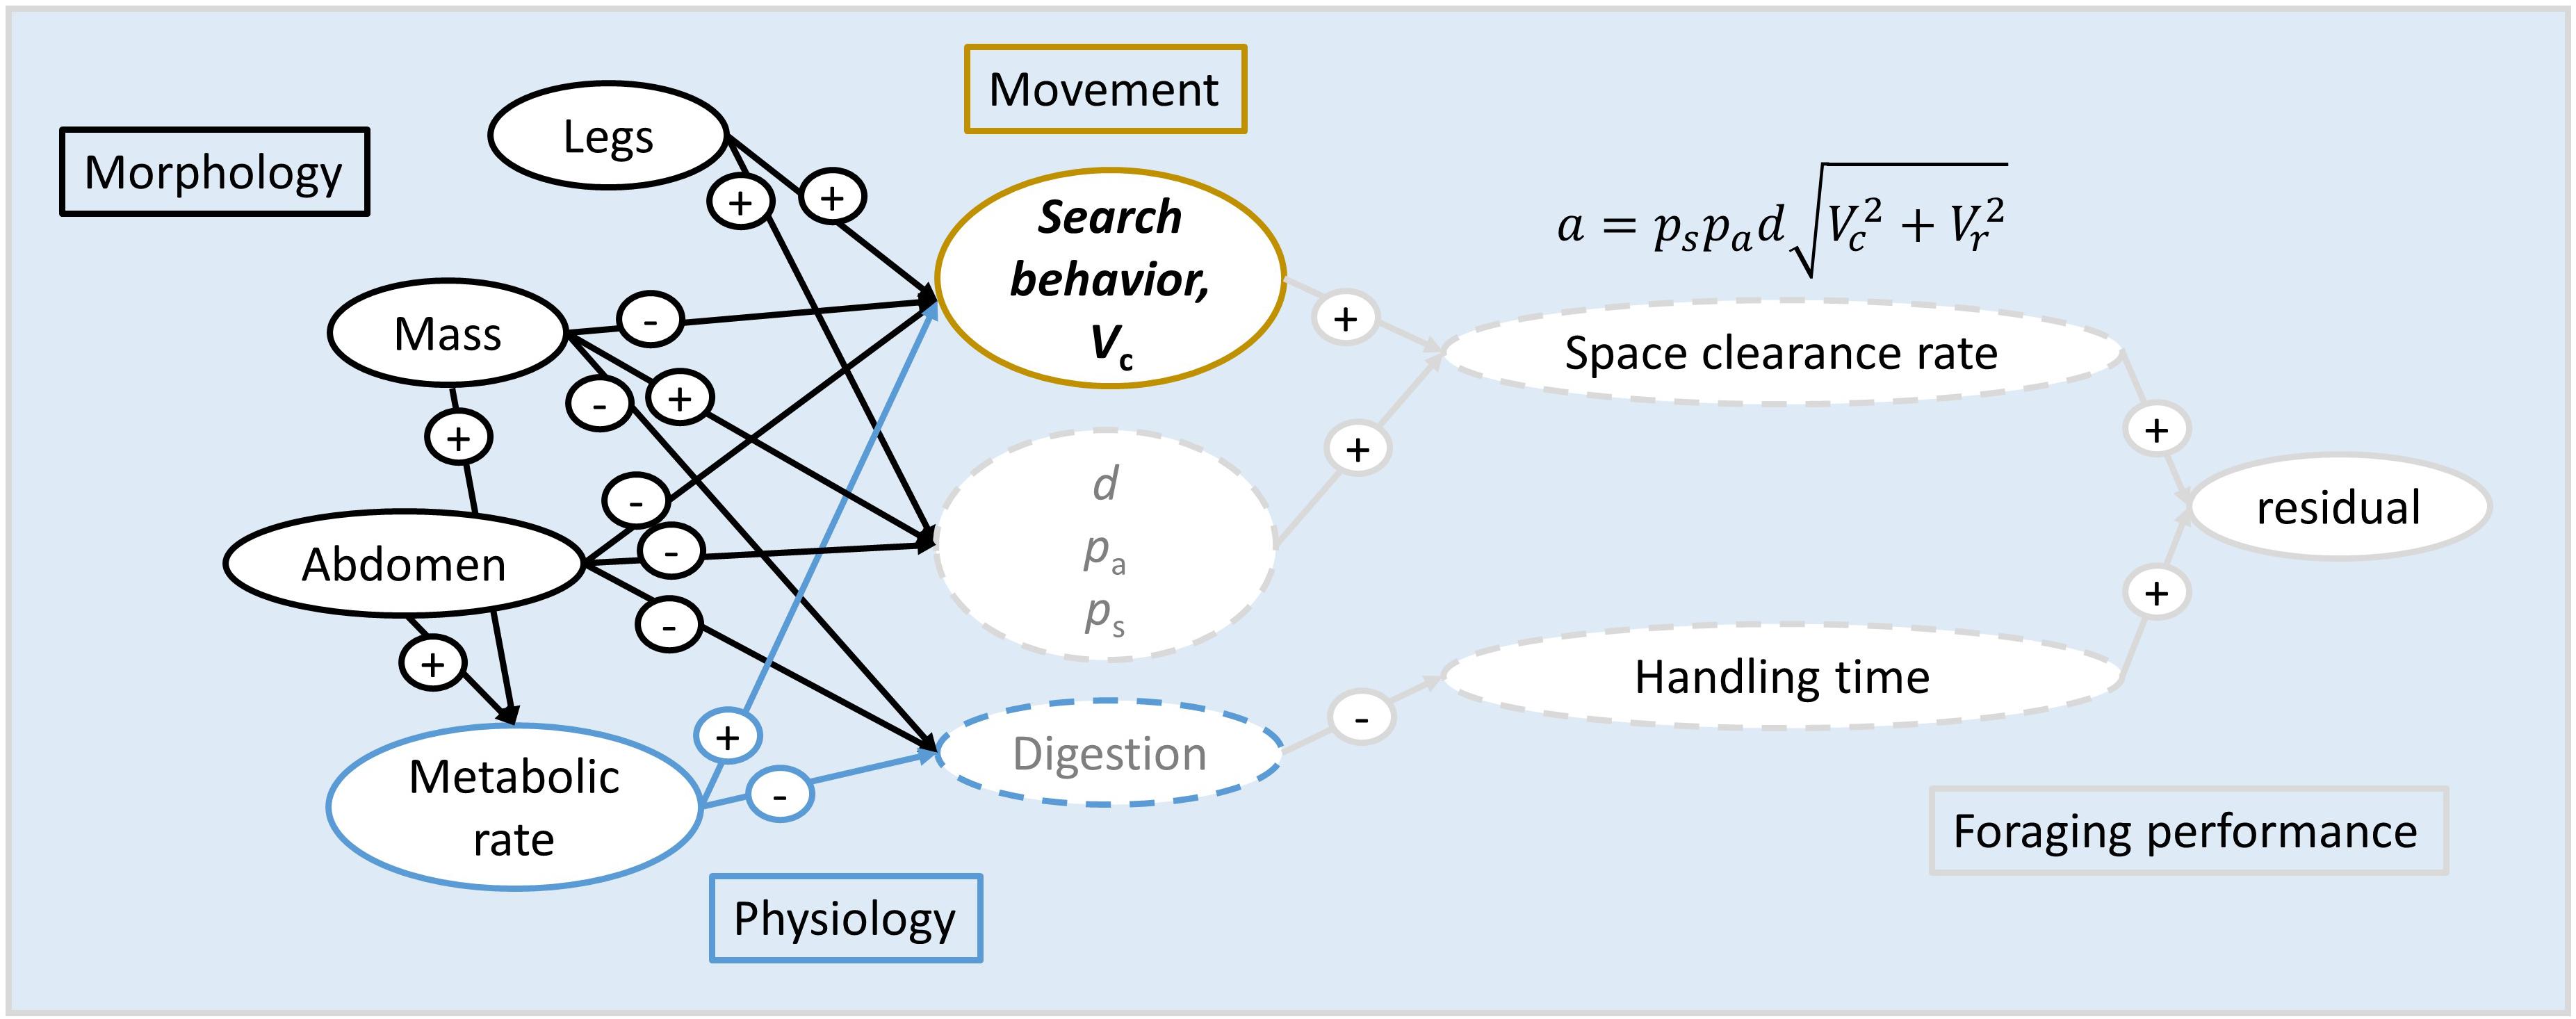
Figure 1. Conceptual map of linkages between morphological and physiological traits, movement, foraging mechanisms, functional response parameters, and residual foraging performance. Specifically, morphology (leg length, body mass, and abdomen width, all outlined in black) are expected to influence movements and the ability to detect, capture, and digest prey, thus impacting the mechanistic components of both space clearance rate (functional response parameter a) and handling time (functional response parameter h) in several ways. For example, long legs may increase velocity, as shown with the plus (+) sign. Physiology, such as metabolic rate (outlined in blue), should shorten digestion time (–) and increase power output (+), thus altering movement. Movement (outlined in gold) should then alter space clearance rate through effects on velocity and thus encounters. The mathematical breakdown of space clearance rate (Eq. 2 in the main text) shows how the probabilities of attack and success, detection distance, and velocity influence the functional response, thereby creating a mechanistic link between traits and foraging performance. In this study, we measured average space clearance rate and handling times, and evaluated the links between individual traits of morphology, physiology, and movement and residual foraging performance to identify the sources of intra-specific variation in functional responses. Solid outlines refer to traits we measured at the individual level, and dashed outlines refer to traits that we could not measure at the individual level. Traits written in black are measured; those in gray are traits we did not measure.
We hypothesized several specific links between phenotypic variables, movement, and functional response parameters. First, body mass is typically related to organism speed, acceleration, ability to detect and/or subdue prey, and interest in prey of particular sizes (Calder, 1996; McGill and Mittelbach, 2006; Gergs and Ratte, 2009; Vucic-Pestic et al., 2010; Hirt et al., 2017). Second, spider abdomens are flexible and expand with the intake of food (Anderson, 1974). The width of the abdomen is therefore a measure of recent foraging history and energetic state and may influence the motivation to search for additional prey (Charnov, 1976; Lyon et al., 2018). Third, leg length may be related to organism speed through biomechanical effects or ability to capture prey (Gibert et al., 2016). Fourth, resting metabolic rate may influence the speed of digestion, potential power output during search or attack, or the overall activity level of the spider (Boratyński et al., 2020).
We collected 28 male and 20 female S. mccooki from the grounds of Cedar Point Biological Station near Ogallala, Nebraska during June 2018. S. mccooki is nocturnally active, has a wide range in North America, and is commonly found in dry grassy habitats (Stratton and Lowrie, 1984), and we collected individuals from mowed and un-mowed patches of mixed-grass prairie within 100 m of Lake Ogallala. We housed spiders individually in plastic cups with loose-fitting lids for no more than 4 days before releasing them back to their collection area. We maintained spiders at c. 23°C on a diet of grasshoppers and chironomid midges (both ∼1 cm in length), also collected from fields in the study area, at and provided water through a small square of moistened paper towel. The light cycle was set by ambient light coming through windows. We determined the sex of spiders using the presence of an epigynum (female) or enlarged pedipalps (male), weighed all spiders in g using an electronic balance, and measured structural characteristics (width of abdomen and average length of the front legs in mm) via photographs of each spider against gridded backgrounds processed using ImageJ (Abramoff et al., 2004).
We measured the resting metabolic rate of each spider using methods from Uiterwaal and DeLong (2019), with most of these spiders having been used in this previous study. Because we held spiders for a few days before starting this experiment, we re-measured respiration rates of spiders used in both studies such that all metabolic rate measurements for this study were taken on the same day as the functional response experiments. We used a PreSens SDR respirometer (PreSens Precision Sensing, Regensburg, Germany) to measure change in oxygen concentration as a proxy for metabolic rate. For all trials, temperature and pressure were c. 23°C and 973 mbar, respectively. We placed spiders individually into 4-ml SensorVials (PreSens Precision Sensing) using cardstock funnels and tightened the caps securely to prevent gas exchange. We cleaned vials with water and a pipe cleaner brush and let them air dry in the dark for ∼48 h between uses. For every five simultaneous measurements, we also included a “blank” vial that contained only air. Aluminum foil wrapped around the vials created a dark environment for the spiders and ensured accurate readings by eliminating external light. For 1 h, the respirometer recorded oxygen levels (ppm) in each tube every 2 min. We discarded respiration data from the first 6 min of each oxygen trace to remove the effects of acclimation and system equilibration. We used ordinary least-squares regression to obtain a slope for the relationship between oxygen concentration and time. We subtracted the slope of the blank’s line of fit from that of each spider to calculate overall oxygen consumption in ppm min–1. To account for different amounts of air available to spiders of different sizes, we then subtracted each spider’s volume (estimated using its body mass and a density of 0.6 g/mL) from the vial volume (4 mL) to obtain the volume of air available to each spider (Uiterwaal and DeLong, 2019). We then converted oxygen consumption from ppm min–1 (g O2 L–1 min–1) to g O2 min–1 to obtain oxygen consumption rates comparable across spiders.
We conducted functional response experiments with flightless D. melanogaster as prey (purchased from Josh’s Frogs; 1). We ran trials after sunset indoors at room temperature (∼21°C) in 25 cm diameter circular arenas in the dark. We introduced spiders to the arenas under a cup for 15 min prior to the start of the trial. Trials lasted for 30 min, and we did not replace prey individuals as they were consumed. We used resource levels of 10, 20, 30, 40, and 50 individuals and replicated resource level treatments 9–10 times for a total of 48 trials. We starved spiders for ∼24 h prior to use in foraging trials and used each spider only once. The paper floors in the arenas were changed for every trial, limiting the potential for chemical cues to influence spider behavior. We video recorded each trial using GoPro Hero4+ Silver cameras (GoPro, San Mateo, CA, United States). We used EthoVision automated tracking software to track the movement of the spiders, from which we extracted measures of total distance traveled, average velocity, maximum acceleration, angular velocity, and number of clockwise rotations of the body, which we will call “body rotations.”
We fit the closed-form version of the Roger’s Random Predator equation (Royama, 1971; Rogers, 1972; Bolker, 2011) to the foraging data using non-linear least squares regression.
In Eq. 3, Re is the number of resources eaten, Ro is the number of prey offered, t is the time of the foraging trials, and a and h are still space clearance rate and handling time parameters, respectively. We chose this model after determining that a type III functional response (sigmoidal) was not appropriate. In short, we fit a model where the space clearance rate was a power function of prey density (i.e., the type III model had a = a0Rθ) and compared AICc values between type II and type III model types for males and females. This comparison showed that the type II model was a more appropriate choice than a type III model, because for both males and females, the ΔAICc was less than 2 between the two model types (AIC values for males: type II–103.31, type III–102.64; and for females: type II–68.01, type III–67.56).
After choosing to proceed with a type II model, we bootstrapped the data 100 times and fit male and female data separately to Eq. 3 to determine whether the functional response differed by sex. We used the natural log of the number of prey eaten to reduce heteroscedasticity at higher prey levels (Uszko et al., 2020). We tested for significant differences in parameters between sexes by taking all pairwise differences in estimated space clearance rate and handling times for each bootstrapped data set and asking whether the 95% confidence interval of those differences overlapped zero (DeLong, 2021). We calculated residuals for each spider by subtracting the observed number of flies consumed from the expected number given the functional response. This residual is thus a measure of foraging performance, that is, how well that individual did relative to the expectation of the predator population for that level of prey offered. Since we found a significant difference in handling time between males and females (see section “Results”), we used the sex-specific functional response to calculate expected foraging rates. We note that the residual foraging performance is not an individual-level estimate of functional response parameters.
Because sex is an important aspect of individual variation, we first tested for differences in all phenotypic and movement variables between sexes using two-tailed t-tests or generalized linear model with a Poisson distribution (for body rotations). We then used Pearson’s correlations to assess pairwise relationships among all variables. We found numerous correlations among the sets of morphological and movement variables, so we used Principle Components Analysis (PCA) to identify prominent axes of morphology and movement. We then tested whether the first principle component axis differed by sex using t-tests or influenced residual foraging performance using linear models with the fitlme command in Matlab v 2017a. We found only two traits that were directly linked to residual foraging performance: body mass and body rotations. We therefore included both of these predictors in a linear model with an interaction to assess their effect on residual foraging performance.
Spiders showed a typical saturating (type II) functional response to flies. Males showed a shallower functional response than females (Figure 2). This difference was not due to space clearance rate, for which confidence intervals broadly overlapped between males and females (Table 1). Instead, males had longer handling times than females, as indicated by the distribution of differences between all bootstrapped estimates of handling time for males and females crossing zero at the 97th percentile (i.e., p = 0.03; Supplementary Figure 1). The low average R2 for the model fits (0.54 for females and 0.15 for males) indicate considerable unexplained variation in foraging across individuals (Table 1).
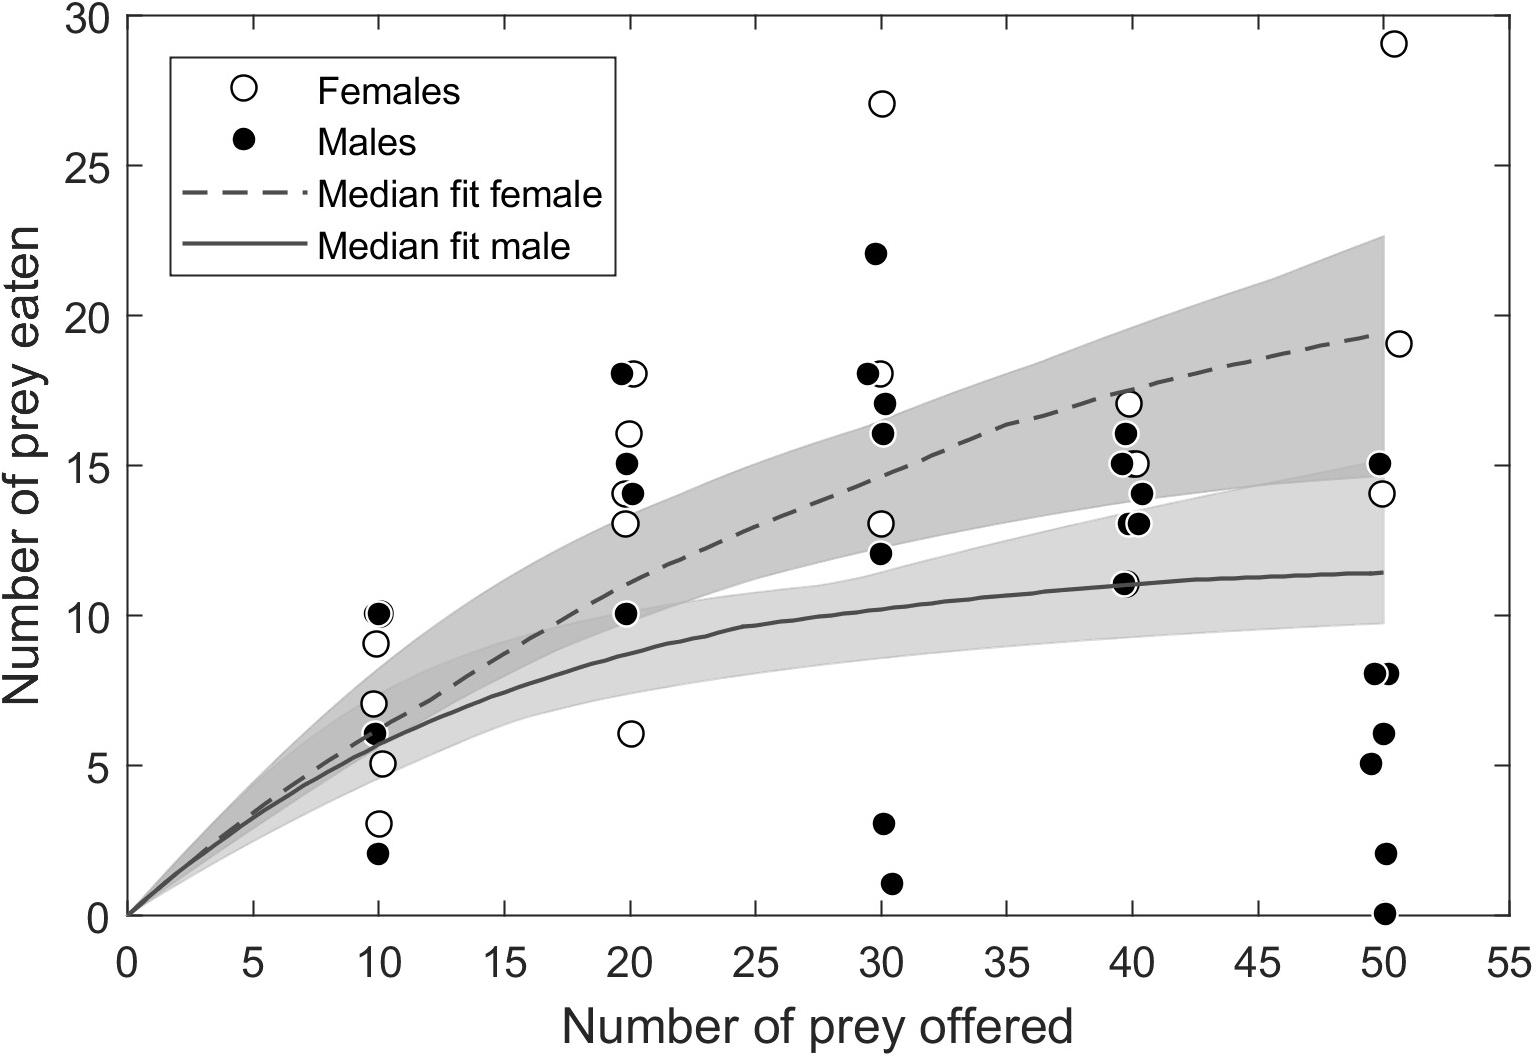
Figure 2. Functional responses of 28 male and 20 female Schizocosa mccooki wolf spiders foraging on flightless Drosophila melanogaster. The closed-form version of the Roger’s Random Predator equation (Eq. 3 in the main text) was fit to 100 bootstrapped data sets to generate a median fit (lines) and 95% confidence intervals. Differences among bootstrapped parameter estimates indicated that the shallower male curve was due to a higher handling time.
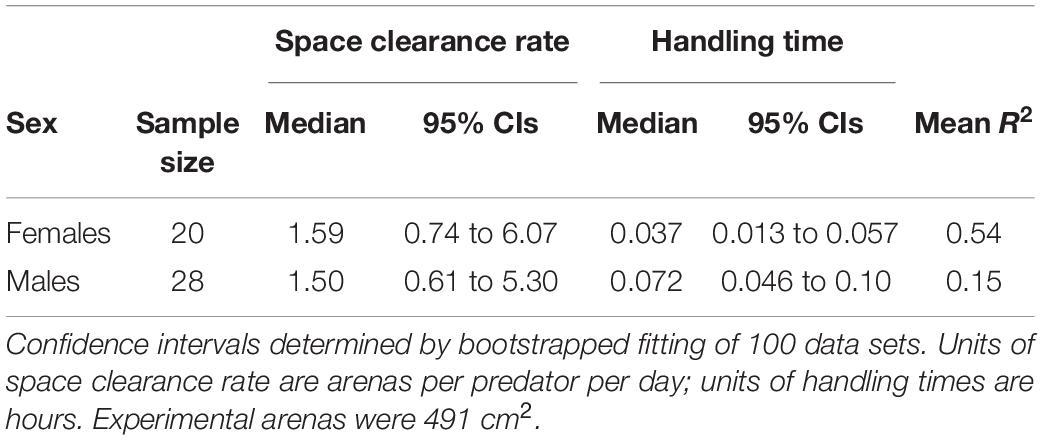
Table 1. Functional response parameters for male and female Schizocosa mccooki foraging on flightless Drosophila melanogaster.
Males and females differed in several phenotypic and movement traits (Figure 3). Males and females did not differ in body mass (t = −1.71, p = 0.094; Figure 3A), but males had longer legs (t = 3.25, p = 0.003; Figure 3B), and narrower abdomens (t = −3.93, p < 0.001; Figure 3C). Males and females did not differ in metabolic rate (t = −1.05, p = 0.30; Figure 3D), while males on average exhibited faster body velocity (t = 3.93, p < 0.001; Figure 3E), and lower angular velocity (t = −2.25, p = 0.03; Figure 3F). Males also spent more time spent moving (t = 4.19, p < 0.001; Figure 3G) and performed more body rotations (t = 7.34, p < 0.001; Figure 3H) than females.
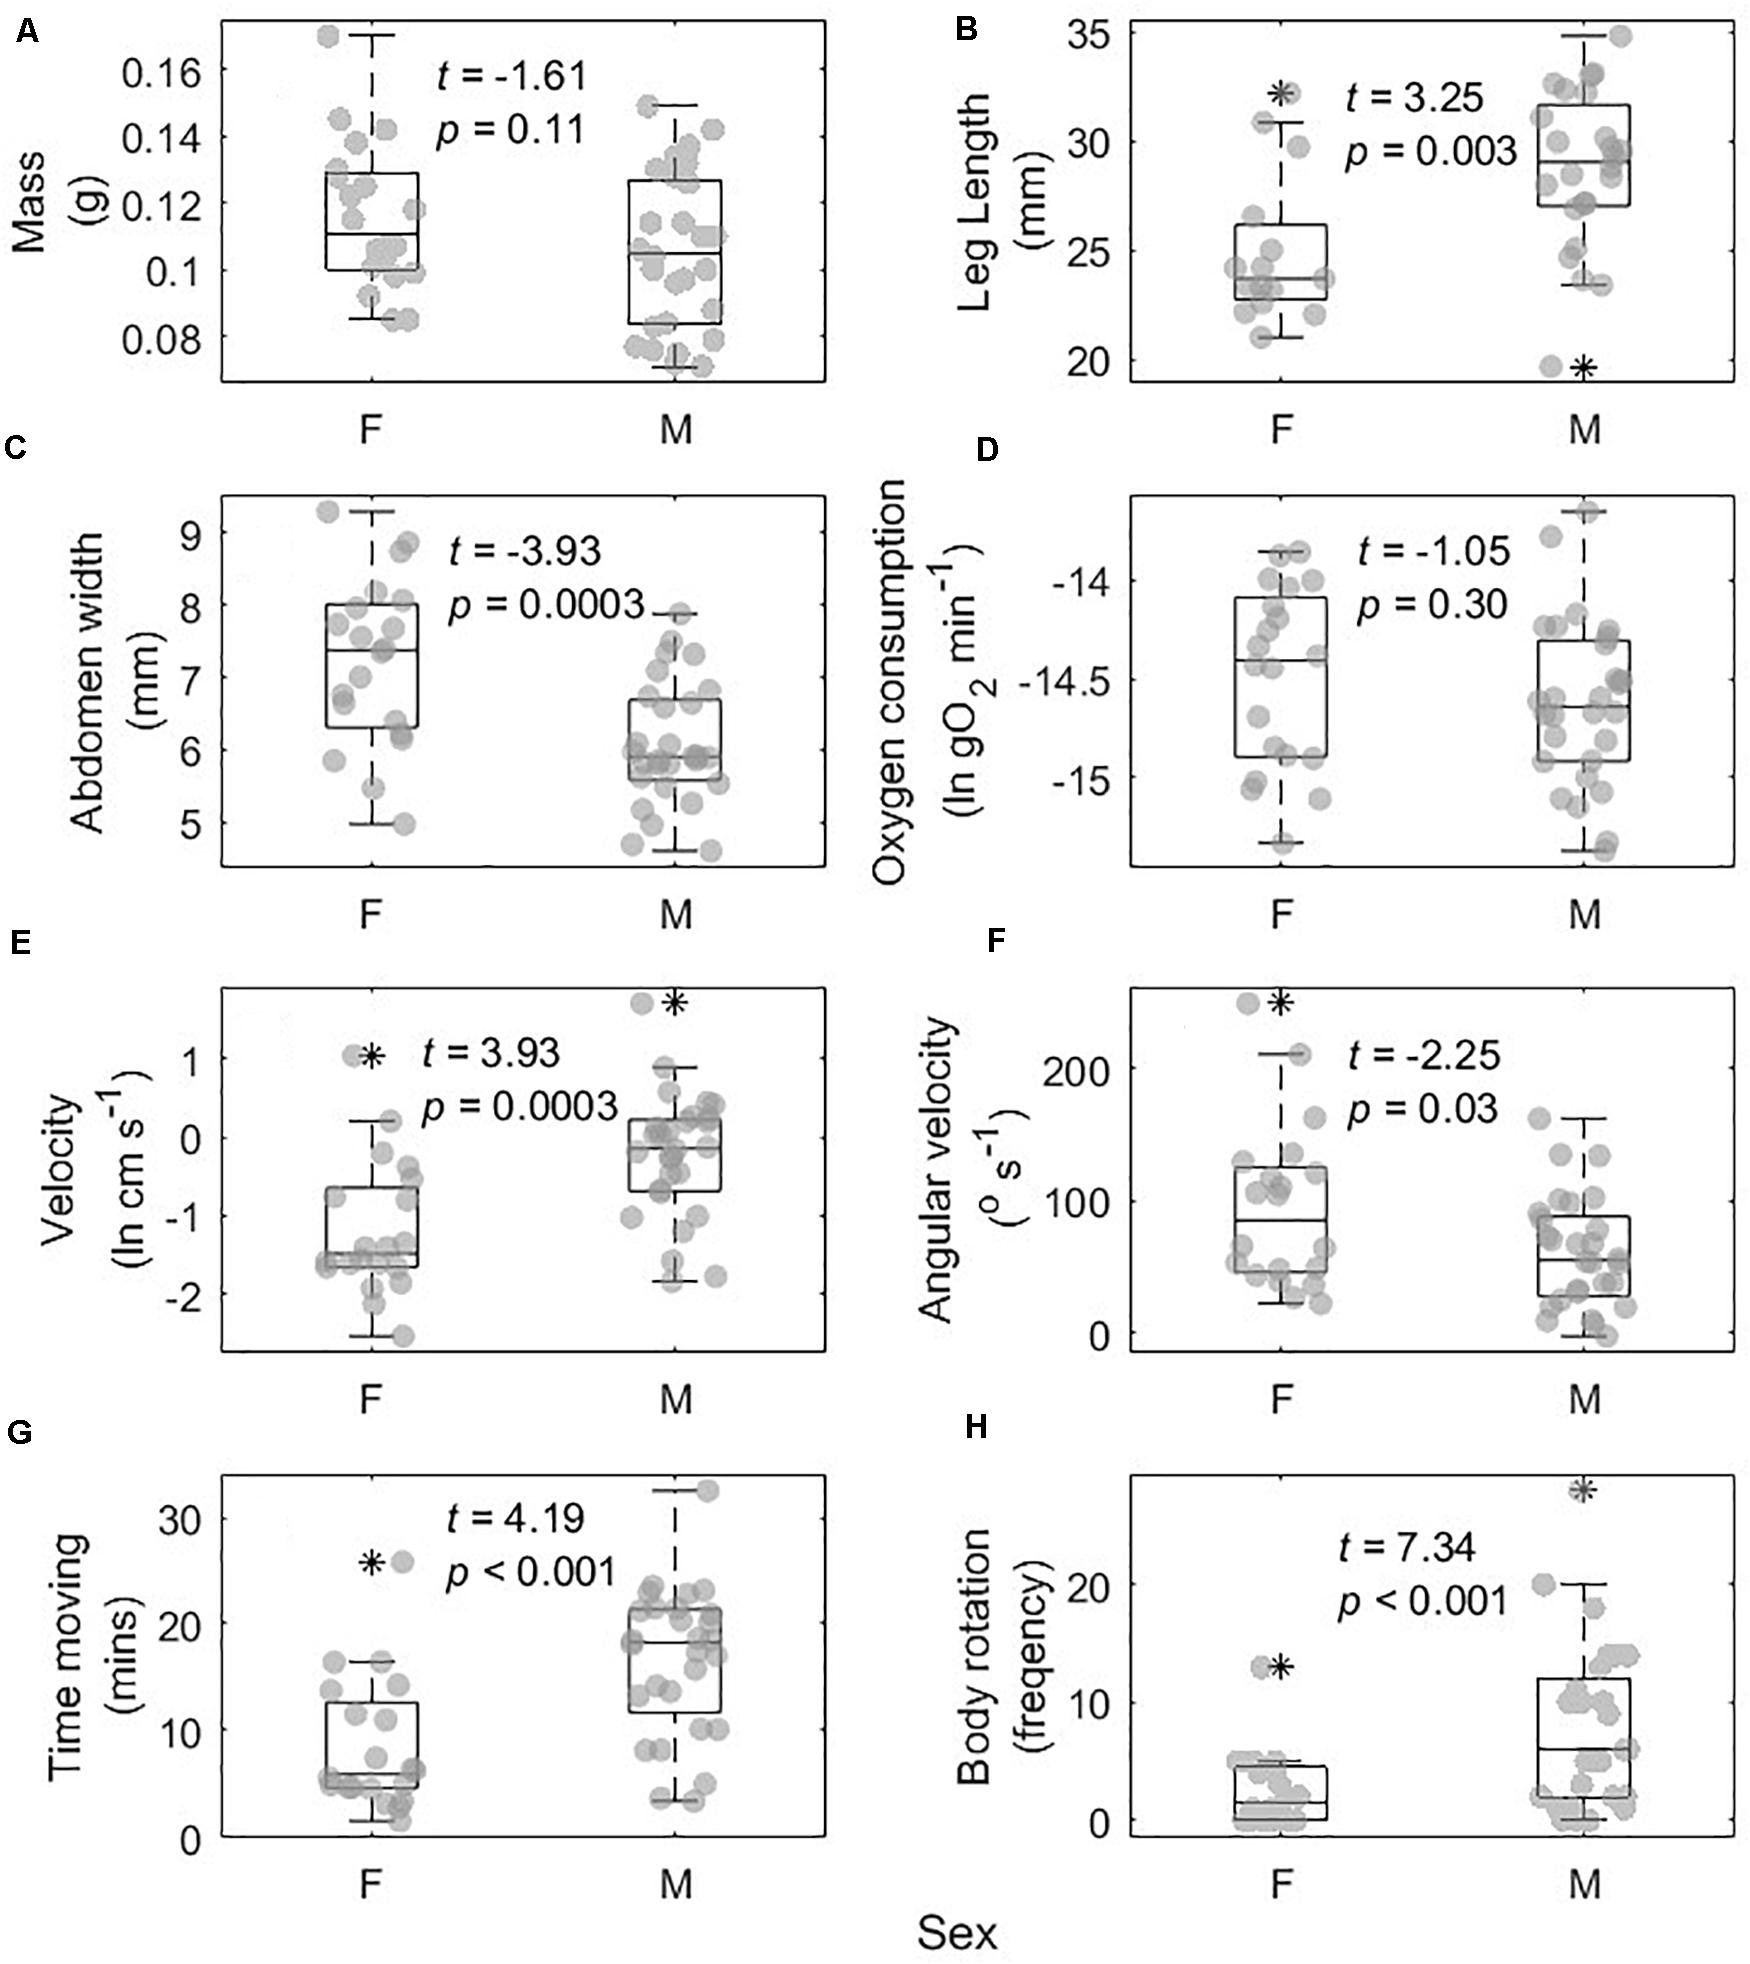
Figure 3. Differences in morphological, physiological, and movement traits between 20 male (M) and 28 female (F) Schizocosa mccooki wolf spiders. Traits were body mass (A), average leg length (B), abdomen width (C), oxygen consumption (D), average velocity (E), angular velocity (F), amount of time spent moving (G), and number of body rotations (H). Jittered raw data overlap box plots showing the median and inner 50% of the data.
There were numerous correlations among morphological and movement variables across spiders (Supplementary Figure 2). Given this, we used PCA to reduce the variables to a morphological axis and a movement axis. We conducted the first PCA using velocity, time spent moving, body rotations, and angular velocity, and the analysis returned one axis that explained 97.2% of the variance associated with movement. We conducted a second PCA using mass, leg length, oxygen consumption, and abdomen width, and the analysis returned a primary axis that explained 94.4% of the variance associated with morphology and physiology. The two primary axes were correlated with one another (r = −0.49, p = 0.0017) and differed by sex (movement: t = 2.29; p = 0.027, morphology: t = −3.29; p = 0.002) (Figure 4). Despite providing some broad characterization of individual spiders, these two primary morphological and movement axes showed no effect on residual foraging performance (movement PC1: t = 0.45; p = 0.65, morphology PC1: t = −0.35 p = 0.72). Combining terms in a linear model and including an interaction term did not alter this result.
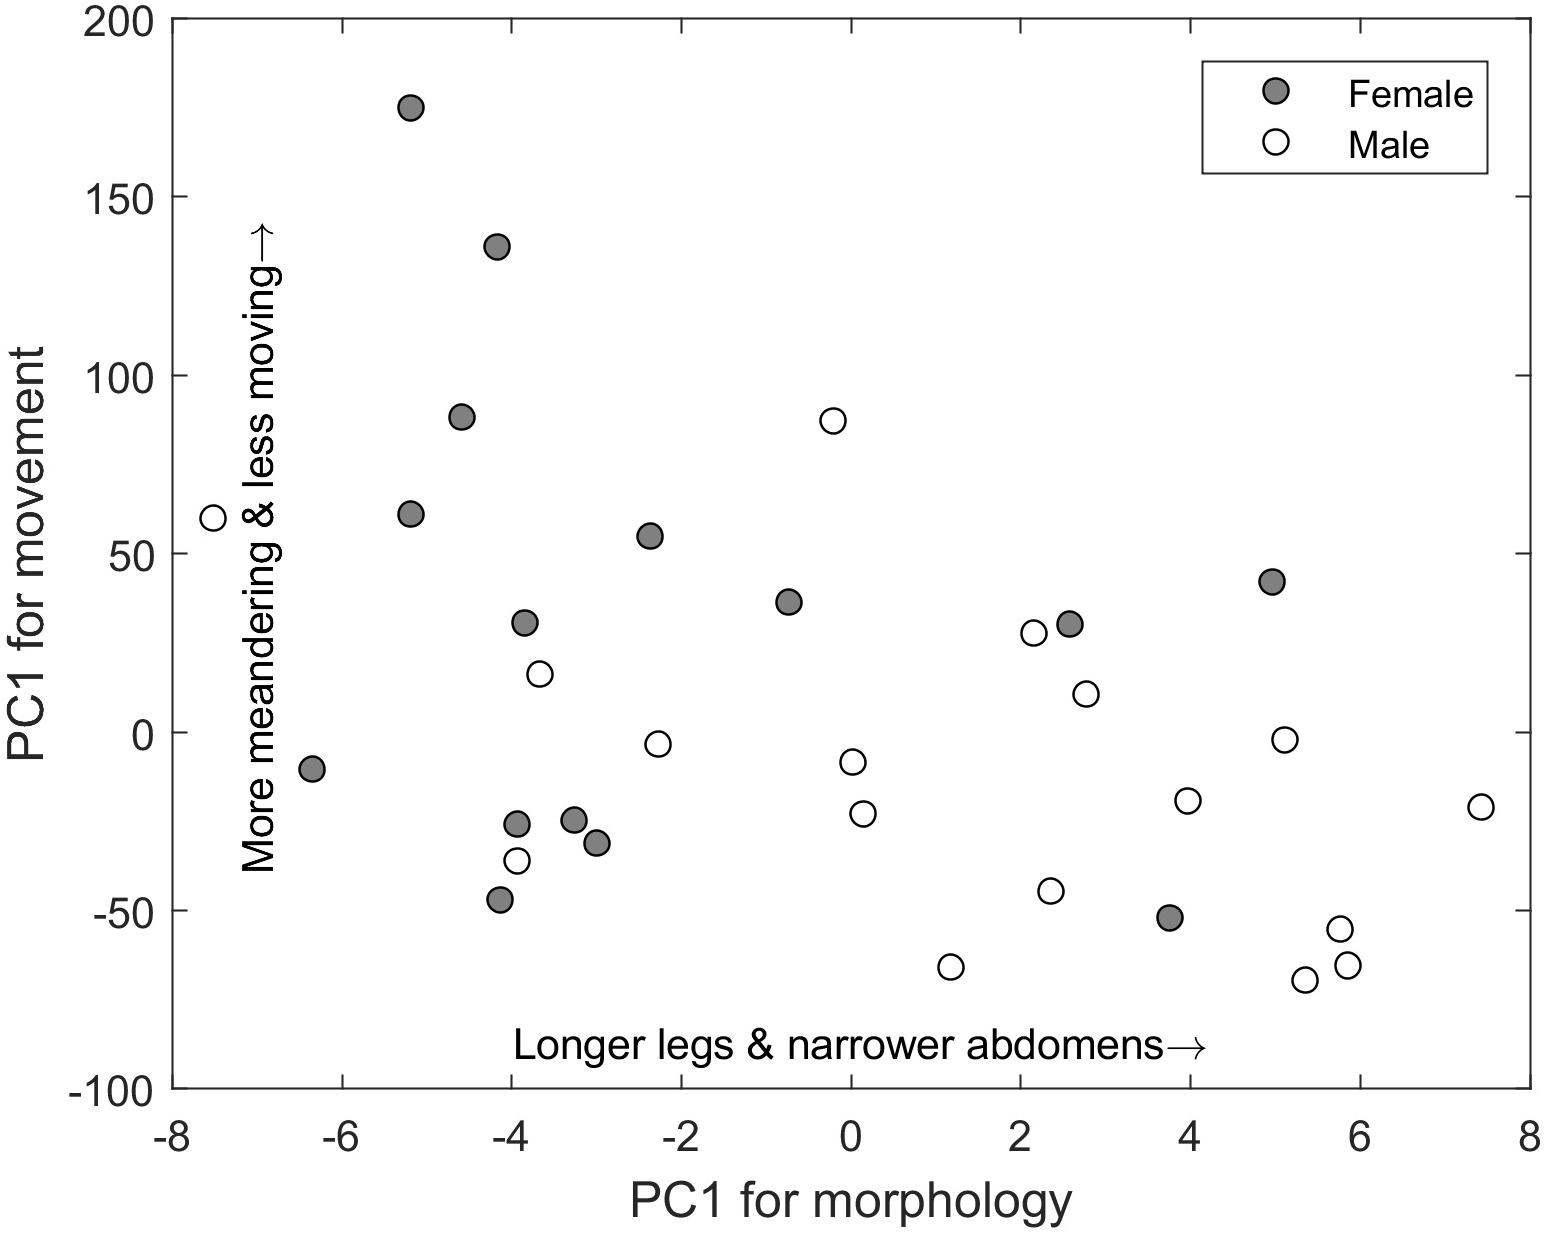
Figure 4. Relationship between the first principle components axis for a group of movement variables (y-axis) and a group of morphological and physiological variables (x-axis) of the wolf spider Schizocosa mccooki. These two principle components are correlated, generating a movement-morphology axis of traits. Males tend to occur along this continuum toward having longer legs and narrower abdomens and moving with less meandering but more movement overall.
Pairwise correlations suggested a positive effect of body mass and a negative effect of body rotations on residual foraging performance (Supplementary Figure 2). However, body mass and body rotations were also correlated (Supplementary Figure 1). We therefore used linear models with both terms and an interaction to assess their effect on residual foraging performance. We found that body mass had no main effect on residual foraging (t = −0.43; p = 0.67), body rotations increased residual foraging (t = 2.30; p = 0.026), but that the effect of body rotations switched from negative for small spiders to positive for spiders with larger mass (mass∗rotation interaction: t = 2.49; p = 0.017) (Figure 5).
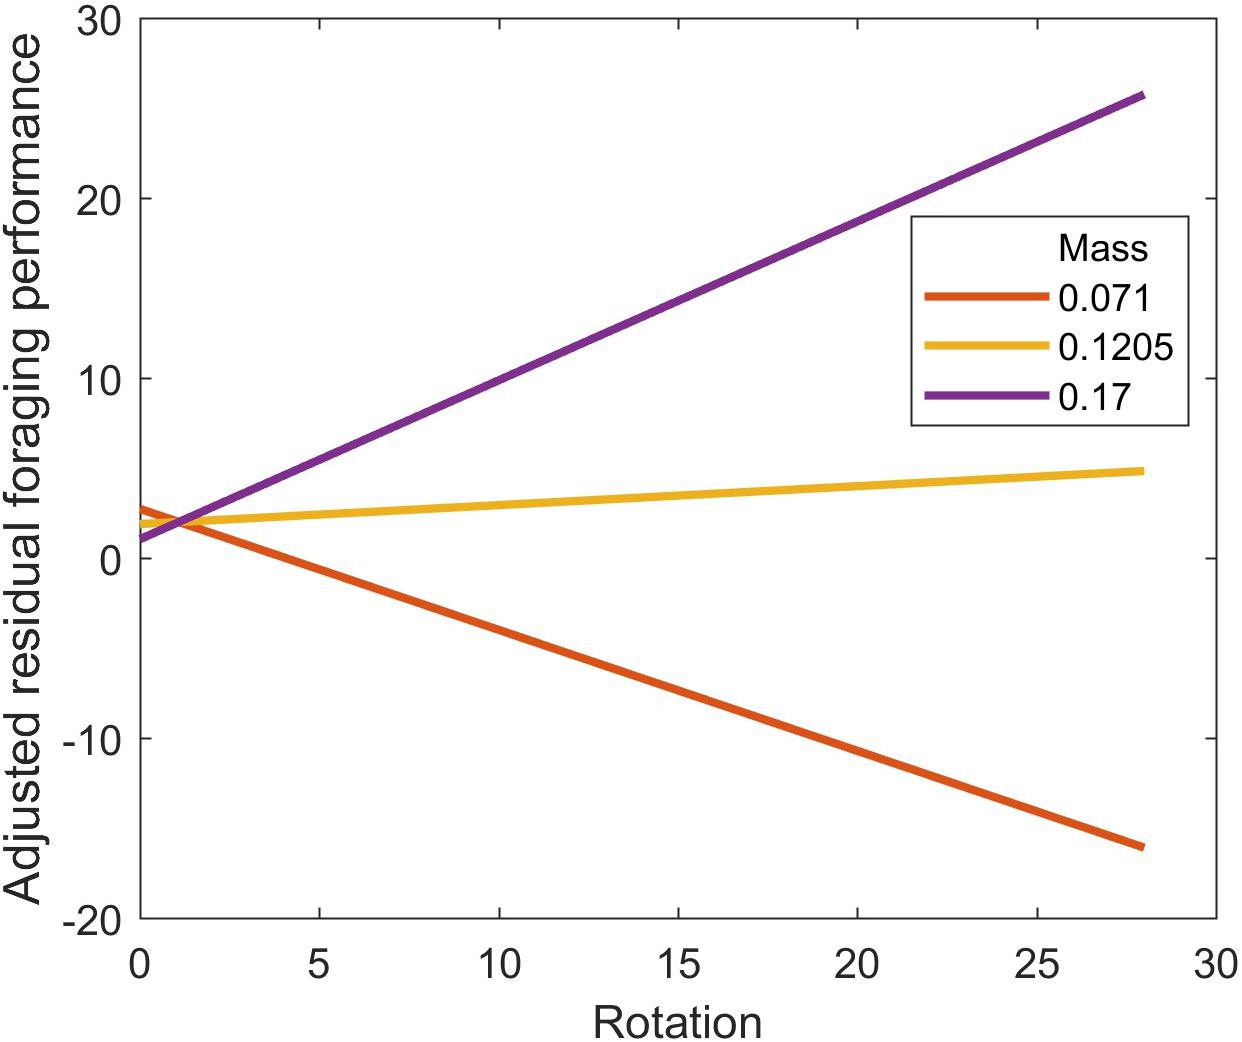
Figure 5. Interaction plot showing the effect of body rotations on residual foraging performance at three levels of body mass (g) for the wolf spider Schizocosa mccooki foraging on flightless Drosophila melanogaster. Residual foraging performance comes from the difference between the actual number of prey eaten and the expected amount eaten from a sex-specific functional response. The sex-specific functional response is shown in Figure 2 and was estimated by bootstrapped fits of the Roger’s Random Predator equation (Eq. 3 in the main text) to male and female data separately.
Understanding the phenotypic drivers of variation in individual foraging is essential for understanding how variation influences the properties of ecological systems. After all, predators do not simply vary in their functional responses – they vary in the traits that influence the mechanisms of foraging. We currently have a limited understanding of both individual variation in functional responses and how traits from morphology to behavior influence the parameters of the functional response (DeLong, 2021). Without this information, however, it is difficult to understand how predator and prey evolve via the fitness effects of predation as well as how traits influence the links among species and rates of energy flow through food webs. In this study, we addressed this knowledge gap by connecting individual traits to foraging performance. We evaluated how those traits altered the expected individual foraging, finding sets of traits that were linked to differences in the functional response by sex and how an unexpected trait – body rotations – influenced individual performance.
Male and female spiders differed in several morphological and movement traits (Figure 3). This covariation was summarized by PCA with spiders occurring along a gradient of males having longer legs and narrower abdomens, moving more, and turning more slowly (i.e., lower angular velocity) than females (Figure 4). Thus, spiders differed in several ways that could account for sex difference in the functional response. First, different patterns of movement, such as the body rotations and turning, could influence encounters with prey and thus the space clearance rate (Figure 1). However, space clearance rate did not differ between males and females. Thus, either these movements were unlinked to encounters or the net effect of several differences between males and females canceled out. This result is somewhat surprising, because in some Schizocosa wolf spiders, mature males are less likely to attack prey than mature females (Pesek et al., 2013), which should lead to a difference in space clearance rate (Eq. 2). In contrast, males had longer handling times, which could be related to lower extraction efficiency or their generally narrower abdomens, reflecting lower energetic conditions and spurring males to spend more time fully extracting energy from each prey. Although some morphological differences between males and females are sexually selected traits, such as ornamentation, these may not be linked to movement (Pesek et al., 2013), further suggesting that some morphologies that could be linked to foraging also have other functional consequences. One possibility is that some of these morphological and behavioral traits are more linked to mate seeking behavior than to foraging. For example, the movement of males may be geared more toward finding females than finding prey, and morphology differences could be linked to courtship behaviors engaged in by the male (Stratton and Lowrie, 1984).
The suites of traits differentiating males and females also did not relate to among-individual differences in residual foraging performance. This performance metric indicates a relative over- or under-performance of foraging for the individual reflecting individual variation in the functional response parameters. Only two traits were linked to this residual foraging performance: body mass and body rotations. We predicted that body mass would influence residual foraging performance through its effects on velocity or physiology, but neither velocity nor metabolic rate were linked to residual performance, indicating these were not the mechanisms linking body mass to foraging.
Body rotations reflects the number of times a spider turns, which in the arena would give the spider additional ability to detect potential prey at its location. Given their mostly forward-facing eyes, rotating their body would essentially increase the detection distance of the spider. Instead of generating an overall positive effect on foraging performance, however, body rotations interacted with body mass (Figure 5). For small spiders, increased body rotations reduced performance, while for large spiders, increased body rotations increased foraging performance. This outcome may be related to differences in the purpose of rotating among spiders. Given the substantial risk that smaller spiders face in being consumed by other spiders (Rypstra and Samu, 2005), it may be that smaller spiders used body rotations for vigilance, but the larger spiders used body rotations for finding prey. Also, given that spiders in poorer energetic condition (narrower abdomens) also rotated more, this could be one mechanism by which spiders acquired more food when hungry without expending much additional energy on moving (Lyon et al., 2018). Either way, this result shows that the key mechanism of being able to detect prey (d in Eq. 2) varies across individuals and is a potentially important source of individual variation in functional responses.
Our results indicate a far more complex landscape of individual variation in functional responses than generally appreciated. Here, individual variation due to sex occurred through handling time, while individual variation due to body rotations occurred presumably through space clearance rate. Despite the strong covariance among traits, these effects appeared to be somewhat independent. Given that individual variation alters the mean interaction strengths between predator and prey by the effects of non-linear averaging (Bolnick et al., 2011), how this plays out when individual variation is multidimensional is unclear. Individual variation in space clearance rate would generate an over-estimate of foraging, while individual variation in handling time would generate an under-estimate of foraging, potentially causing the effects to cancel out.
We expected movement to be more tightly linked to residual foraging performance. In particular, searching velocity is a key driver of predator-prey encounters. Relatively fast searching would therefore be expected to positively impact residual foraging performance. However, this was not the case. It could be that the movements displayed by the spiders represented a combination of searching and other activities, causing our measure of velocity to be a poor predictor of foraging. Similarly, spending additional time moving around would increase encounters, but again this behavior was not related to residual foraging performance, possibly for the same reasons. For example, movement of adult spiders may serve both foraging and mate-finding purposes (Fowler-Finn et al., 2013). Alternatively, spiders that viewed the foraging arenas as risky environments could have been seeking refuge or escape from the experiment rather than foraging. Furthermore, some types of movements linked to foraging may reflect multiple strategies, such as the dual slow/fast attack acceleration in Pardosa wolf spiders hunting wood crickets (Nemobius sylvestris), potentially hindering detection of a simple monotonic relationship between movement and functional outcome (Dangles et al., 2006). These results suggest some challenges in making the connection between traits and functional responses, as the behaviors observed may not be clearly ascribable to the predator’s actual objective at any given moment. Thus, an improved ability to identify movements with different objectives will be necessary to connect traits to the mechanisms of foraging.
Metabolic rate is thought to be an integrative measure of energy use and ecological interactions (Brown et al., 2004). For example, standard metabolic rate in Atlantic salmon (Salmo salar) influenced habitat choice and was related to resource access (Auer et al., 2020). We therefore expected to find links between oxygen consumption and morphology, movement, and foraging in this experiment. Indeed, both body mass and abdomen width are important predictors of metabolic rate in wolf spiders (Greenstone and Bennett, 1980; Uiterwaal and DeLong, 2019). And although there is increasing support for the idea that higher-powered, faster pace-of-life individuals (reflected in a higher metabolic rate) would show more movement and increased foraging (Boratyński et al., 2020), we did not find this to be the case. However, we measured resting metabolic rate, and it might be that maximal metabolic rate, or the metabolic scope (maximal/resting rates) would be a better proxy for a spider’s pace-of-life.
Functional responses are a crucial mediator of fitness for predators and their prey (DeLong, 2021). A high, steep functional response may benefit predators by enabling high foraging rates. Thus, phenotypes that lead to high space clearance rate or low handling times might be expected to be under selection for predators, and vice versa for prey. Our knowledge of how phenotypes are linked to functional response parameters, however, is limited, making it difficult to predict the evolution of foraging-linked traits among predator-prey pairs. A very small number of studies have investigated individual functional responses, and most of our knowledge about the link between traits and functional responses comes from cross-species-pair studies. Despite tremendous effort to estimate functional responses for pairwise interactions (Uiterwaal et al., 2018), the links between traits and foraging mechanisms that can generate individual variation in functional response parameters are still poorly understood. Our approach suggests both a way forward for connecting traits to functional responses and that there may be many complex and surprising trait-foraging links governing species interactions in food webs.
The raw data supporting the conclusions of this article will be made available by the authors, without undue reservation.
SU and AD conducted the experiment. JD wrote the initial draft. All authors conceived of the experiment, contributed to data analysis, and edited the manuscript.
This work was partly supported by the National Science Foundation Graduate Research Fellowship (grant DGE-1610400) to SU.
The authors declare that the research was conducted in the absence of any commercial or financial relationships that could be construed as a potential conflict of interest.
The Supplementary Material for this article can be found online at: https://www.frontiersin.org/articles/10.3389/fevo.2021.649542/full#supplementary-material
Supplementary Figure 1 | Differences in bootstrapped estimates of functional response parameters space clearance rate (A) and handling time (B). These differences are pairwise differences between all bootstrapped parameter estimates for male and female Schizocosa mccooki wolf spiders. The distribution of pairwise differences thus indicates the probability that the parameters differ between male and female. For space clearance rate, the mode of the differences is near zero, indicating no difference. For handling time, the distribution crosses zero at the 97th percentile, indicating that the parameters are different with p = 0.03.
Supplementary Figure 2 | Correlation matrix for traits, movement variables, and residual foraging performance across 48 Schizocosa mccooki wolf spiders. Numbers indicate Pearson’s correlation coefficient, indicated in red if significant (p < 0.05) and black otherwise, with a least squares regression line shown only for significant correlations. Variables are leg length (mm), body mass (g), abdomen width (mm), oxygen consumption (g O2 per min), velocity (cm per sec), time spent moving (min), angular velocity (degrees per sec), number of rotations (frequency), and residual foraging performance (prey consumed).
Abramoff, M. D., Magelhaes, P. J., and Ram, S. J. (2004). Image processing with ImageJ. Biophotonics Inter. 11, 36–42.
Aljetlawi, A. A., Sparrevik, E., and Leonardsson, K. (2004). Prey-predator size-dependent functional response: derivation and rescaling to the real world. J. Anim. Ecol. 73, 239–252. doi: 10.1111/j.0021-8790.2004.00800.x
Anderson, J. F. (1974). Responses to starvation in the spiders lycosa lenta hentz and filistata hibernalis (Hentz). Ecology 55, 576–585. doi: 10.2307/1935148
Auer, S. K., Bassar, R. D., Turek, D., Anderson, G. J., McKelvey, S., Armstrong, J. D., et al. (2020). Metabolic rate interacts with resource availability to determine individual variation in microhabitat use in the wild. Am. Nat. 196, 132–144. doi: 10.1086/709479
Bolnick, D. I., Amarasekare, P., Araújo, M. S., Bürger, R., Levine, J. M., Novak, M., et al. (2011). Why intraspecific trait variation matters in community ecology. Trends Ecol. Evol. 26, 183–192. doi: 10.1016/j.tree.2011.01.009
Boratyński, Z., Szyrmer, M., and Koteja, P. (2020). The metabolic performance predicts home range size of bank voles: a support for the behavioral–bioenergetics theory. Oecologia 193, 547–556. doi: 10.1007/s00442-020-04704-x
Boswell, M. E., and DeLong, J. P. (2019). Gravid Tetragnathid spiders show an increased functional response. Food Webs. 21:e00122. doi: 10.1016/j.fooweb.2019.e00122
Brown, J., Gillooly, J., Allen, A., Savage, V., and West, G. (2004). Toward a metabolic theory of ecology. Ecology 85, 1771–1789. doi: 10.1890/03-9000
Charnov, E. L. (1976). Optimal foraging: attack strategy of a mantid. Am. Nat. 110, 141–151. doi: 10.1086/283054
Coblentz, K. E., and DeLong, J. P. (2020). Estimating predator functional responses using the times between prey captures. bioRxiv [Preprint]. doi: 10.1101/2020.07.19.208686
Dangles, O., Ory, N., Steinmann, T., Christides, J.-P., and Casas, J. (2006). Spider’s attack versus cricket’s escape: velocity modes determine success. Anim. Behav. 72, 603–610. doi: 10.1016/j.anbehav.2005.11.018
Dell, A. I., Bender, J. A., Branson, K., Couzin, I. D., de Polavieja, G. G., Noldus, L. P. J. J., et al. (2014). Automated image-based tracking and its application in ecology. Trends Ecol. Evol. 29, 417–428. doi: 10.1016/j.tree.2014.05.004
DeLong, J. P. (2021). Predator Ecology: The Evolutionary Ecology of the Functional Response. Oxford: Oxford University Press.
Ding-Xu, L., Juan, T., and Zuo-Rui, S. (2007). Functional response of the predator Scolothrips takahashii to hawthorn spider mite, Tetranychus viennensis: effect of age and temperature. Biocontrol 52, 41–61. doi: 10.1007/s10526-006-9015-7
Dor, A., Valle-Mora, J., Rodríguez-Rodríguez, S. E., and Liedo, P. (2014). Predation of Anastrepha ludens (Diptera: Tephritidae) by Norops serranoi (Reptilia: Polychrotidae): functional response and evasion ability. Environ. Entomol. 43, 706–715. doi: 10.1603/en13281
Fowler-Finn, K. D., Rosenthal, M. F., and Hebets, E. A. (2013). Locomotor performance varies with adult phenotype in ornamented/non-ornamented wolf spiders. Ethology 119, 570–580. doi: 10.1111/eth.12096
Gergs, A., and Ratte, H. T. (2009). Predicting functional response and size selectivity of juvenile Notonecta maculata foraging on Daphnia magna. Ecol. Model. 220, 3331–3341. doi: 10.1016/j.ecolmodel.2009.08.012
Gibert, J. P., Chelini, M.-C., Rosenthal, M. F., and DeLong, J. P. (2016). Crossing regimes of temperature dependence in animal movement. Glob. Change Biol. 22, 1722–1736. doi: 10.1111/gcb.13245
Gibert, J. P., and DeLong, J. P. (2017). Phenotypic variation explains food web structural patterns. Proc. Natl. Acad. Sci. U.S.A. 114, 11187–11192. doi: 10.1073/pnas.1703864114
Gilbert, B., Tunney, T. D., McCann, K. S., DeLong, J. P., Vasseur, D. A., Savage, V., et al. (2014). A bioenergetic framework for the temperature dependence of trophic interactions. Ecol. Lett. 17, 902–914. doi: 10.1111/ele.12307
Greenstone, M. H., and Bennett, A. F. (1980). Foraging strategy and metabolic rate in spiders. Ecology 61, 1255–1259. doi: 10.2307/1936843
Hirt, M. R., Lauermann, T., Brose, U., Noldus, L. P. J. J., and Dell, A. I. (2017). The little things that run: a general scaling of invertebrate exploratory speed with body mass. Ecology 98, 2751–2757. doi: 10.1002/ecy.2006
Holling, C. S. (1959). The components of predation as revealed by a study of small-mammal predation of the European pine sawfly. Can. Entomol. 91, 293–320. doi: 10.4039/ent91293-5
Jones, A. W., and Post, D. M. (2013). Consumer interaction strength may limit the diversifying effect of intraspecific competition: a test in alewife (Alosa pseudoharengus). Am. Nat. 181, 815–826. doi: 10.1086/670197
Kalinkat, G., Rall, B. C., Vucic-Pestic, O., and Brose, U. (2011). The allometry of prey preferences. PLoS One 6:e25937. doi: 10.1371/journal.pone.0025937
Kalinkat, G., Schneider, F. D., Digel, C., Guill, C., Rall, B. C., and Brose, U. (2013). Body masses, functional responses and predator–prey stability. Ecol. Lett. 16, 1126–1134. doi: 10.1111/ele.12147
Li, Y., Rall, B. C., and Kalinkat, G. (2018). Experimental duration and predator satiation levels systematically affect functional response parameters. Oikos 127, 590–598. doi: 10.1111/oik.04479
Lyon, S. R., Sjulin, C. A., Sullivan, K. M., and DeLong, J. P. (2018). Condition-dependent foraging in the wolf spider Hogna baltimoriana. Food Webs 14, 5–8. doi: 10.1016/j.fooweb.2017.12.003
McCann, K., Hastings, A., and Huxel, G. R. (1998). Weak trophic interactions and the balance of nature. Nature 395, 794–798. doi: 10.1038/27427
McCoy, M. W., Bolker, B. M., Warkentin, K. M., and Vonesh, J. R. (2011). Predicting predation through prey ontogeny using size-dependent functional response models. Am. Nat. 177, 752–766. doi: 10.1086/659950
McGill, B. J., and Mittelbach, G. C. (2006). An allometric vision and motion model to predict prey encounter rates. Evol. Ecol. Res. 8, 691–701.
Novak, M., and Wootton, J. T. (2010). Using experimental indices to quantify the strength of species interactions. Oikos 119, 1057–1063. doi: 10.1111/j.1600-0706.2009.18147.x
Pawar, S., Dell, A. I., and Savage, V. M. (2012). Dimensionality of consumer search space drives trophic interaction strengths. Nature 486, 485–489. doi: 10.1038/nature11131
Pesek, M. F., Hebets, E. A., Sullivan-Beckers, L., and Fowler-Finn, K. D. (2013). Foreleg ornaments do not hinder foraging success in brush-legged wolf spiders. J. Insect. Behav. 26, 837–849. doi: 10.1007/s10905-013-9398-0
Rall, B. C., Brose, U., Hartvig, M., Kalinkat, G., Schwarzmüller, F., Vucic-Pestic, O., et al. (2012). Universal temperature and body-mass scaling of feeding rates. Phil. Trans. R. Soc. B Biol. Sci. 367, 2923–2934. doi: 10.1098/rstb.2012.0242
Roberts, E. C., Legrand, C., Steinke, M., and Wootton, E. C. (2011). Mechanisms underlying chemical interactions between predatory planktonic protists and their prey. J. Plankton Res. 33, 833–841. doi: 10.1093/plankt/fbr005
Rogers, D. (1972). Random search and insect population models. J. Anim. Ecol. 41, 369–383. doi: 10.2307/3474
Royama, T. (1971). A comparative study of models for predation and parasitism. Res. Popul. Ecol. 13, 1–91. doi: 10.1007/bf02511547
Rypstra, A. L., and Samu, F. (2005). Size dependent intraguild predation and cannibalism in coexisting wolf spiders (araneae, lycosidae). J. Arachnol. 33, 390–397. doi: 10.1636/ct05-10.1
Schreiber, S. J., Bürger, R., and Bolnick, D. I. (2011). The community effects of phenotypic and genetic variation within a predator population. Ecology 92, 1582–1593. doi: 10.1890/10-2071.1
Schröder, A., Kalinkat, G., and Arlinghaus, R. (2016). Individual variation in functional response parameters is explained by body size but not by behavioural types in a poeciliid fish. Oecologia 182, 1129–1140. doi: 10.1007/s00442-016-3701-7
Spitze, K. (1985). Functional response of an ambush predator: Chaoborus americanus predation on Daphnia pulex. Ecology 66, 938–949. doi: 10.2307/1940556
Stratton, G. E., and Lowrie, D. C. (1984). Courtship behavior and life cycle of the wolf spider Schizocosa mccooki (Araneae, Lycosidae). J. Arachnol. 12, 223–228.
Uiterwaal, S. F., and DeLong, J. P. (2018). Multiple factors, including arena size, shape the functional responses of ladybird beetles. J. Appl. Ecol. 55, 2429–2438. doi: 10.1111/1365-2664.13159
Uiterwaal, S. F., and DeLong, J. P. (2019). Body condition helps to explain metabolic rate variation in wolf spiders. Ecol. Entomol. 44, 659–664. doi: 10.1111/een.12741
Uiterwaal, S. F., and DeLong, J. P. (2020). Functional responses are maximized at intermediate temperatures. Ecology 101:e02975.
Uiterwaal, S. F., Lagerstrom, I. T., Lyon, S. R., and DeLong, J. P. (2018). Data paper: FoRAGE (Functional Responses from Around the Globe in all Ecosystems) database: a compilation of functional responses for consumers and parasitoids. bioRxiv [Preprint]. doi: 10.1101/503334
Uszko, W., Diehl, S., and Wickman, J. (2020). Fitting functional response surfaces to data: a best practice guide. Ecosphere 11:e03051.
Vucic-Pestic, O., Rall, B. C., Kalinkat, G., and Brose, U. (2010). Allometric functional response model: body masses constrain interaction strengths. J. Anim. Ecol. 79, 249–256. doi: 10.1111/j.1365-2656.2009.01622.x
Walker, S. E., and Rypstra, A. L. (2001). Sexual dimorphism in functional response and trophic morphology in Rabidosa rabida (Araneae: Lycosidae). Am. Midl. Nat. 146, 161–170. doi: 10.1674/0003-0031(2001)146[0161:sdifra]2.0.co;2
Keywords: functional response, individual variation, wolf spider, trait-based ecology, metabolic ecology
Citation: DeLong JP, Uiterwaal SF and Dell AI (2021) Trait-Based Variation in the Foraging Performance of Individuals. Front. Ecol. Evol. 9:649542. doi: 10.3389/fevo.2021.649542
Received: 05 January 2021; Accepted: 26 May 2021;
Published: 17 June 2021.
Edited by:
Dennis Murray, Trent University, CanadaCopyright © 2021 DeLong, Uiterwaal and Dell. This is an open-access article distributed under the terms of the Creative Commons Attribution License (CC BY). The use, distribution or reproduction in other forums is permitted, provided the original author(s) and the copyright owner(s) are credited and that the original publication in this journal is cited, in accordance with accepted academic practice. No use, distribution or reproduction is permitted which does not comply with these terms.
*Correspondence: John P. DeLong, anBkZWxvbmdAdW5sLmVkdQ==
Disclaimer: All claims expressed in this article are solely those of the authors and do not necessarily represent those of their affiliated organizations, or those of the publisher, the editors and the reviewers. Any product that may be evaluated in this article or claim that may be made by its manufacturer is not guaranteed or endorsed by the publisher.
Research integrity at Frontiers
Learn more about the work of our research integrity team to safeguard the quality of each article we publish.