 Roberto O. Chávez
 Verónica F. Briceño
 José A. Lastra
 Daniel Harris-Pascal3
 Sergio A. Estay
- 1Laboratorio de Geo-Información y Percepción Remota, Instituto de Geografía, Pontificia Universidad Católica de Valparaíso, Valparaíso, Chile
- 2Division of Ecology and Evolution, Research School of Biology, The Australian National University, Canberra, ACT, Australia
- 3ACT Government, Climate Change and Sustainability Division, Canberra, ACT, Australia
- 4Facultad de Ciencias, Instituto de Ciencias Ambientales y Evolutivas, Universidad Austral de Chile, Valdivia, Chile
- 5Facultad de Ciencias Biológicas, Center of Applied Ecology and Sustainability (CAPES), Pontificia Universidad Católica de Chile, Santiago, Chile
Mountain regions have experienced above-average warming in the 20th century and this trend is likely to continue. These accelerated temperature changes in alpine areas are causing reduced snowfall and changes in the timing of snowfall and melt. Snow is a critical component of alpine areas - it drives hibernation of animals, determines the length of the growing season for plants and the soil microbial composition. Thus, changes in snow patterns in mountain areas can have serious ecological consequences. Here we use 35 years of Landsat satellite images to study snow changes in the Mocho-Choshuenco Volcano in the Southern Andes of Chile. Landsat images have 30 m pixel resolution and a revisit period of 16 days. We calculated the total snow area in cloud-free Landsat scenes and the snow frequency per pixel, here called “snow persistence” for different periods and seasons. Permanent snow cover in summer was stable over a period of 30 years and decreased below 20 km2 from 2014 onward at middle elevations (1,530–2,000 m a.s.l.). This is confirmed by negative changes in snow persistence detected at the pixel level, concentrated in this altitudinal belt in summer and also in autumn. In winter and spring, negative changes in snow persistence are concentrated at lower elevations (1,200–1,530 m a.s.l.). Considering the snow persistence of the 1984–1990 period as a reference, the last period (2015–2019) is experiencing a −5.75 km2 reduction of permanent snow area (snow persistence > 95%) in summer, −8.75 km2 in autumn, −42.40 km2 in winter, and −18.23 km2 in spring. While permanent snow at the high elevational belt (>2,000 m a.s.l.) has not changed through the years, snow that used to be permanent in the middle elevational belt has become seasonal. In this study, we use a probabilistic snow persistence approach for identifying areas of snow reduction and potential changes in alpine vegetation. This approach permits a more efficient use of remote sensing data, increasing by three times the amount of usable scenes by including images with spatial gaps. Furthermore, we explore some ecological questions regarding alpine ecosystems that this method may help address in a global warming scenario.
Introduction
In addition to increasing average temperatures globally, climate change is also disrupting and altering seasonal patterns that drive ecosystem function (IPCC, 2021). There is growing evidence that the rate of warming is amplified at higher elevations, such that high-mountain environments experience more rapid changes in temperature than environments at lower elevations (Beniston et al., 1997). Indeed, mountain regions have been identified as having experienced above-average warming in the 20th century, a trend likely to continue (Beniston et al., 1997; Liu and Chen, 2000). These accelerated changes in alpine areas means that ecosystems are being impacted by both earlier snowmelt and reductions in snowfall. Seasonal snow makes up the largest portion of the cryosphere with up to 31% of the earth’s surface being covered by seasonal snow (Vaughan et al., 2013). However, globally snow cover has decreased by 10% compared with snow coverage in the late 1960’s (Walther et al., 2002) and since 1972 snow cover duration in the Northern hemisphere has been declining at a rate of 5 days/decade, attributable to earlier spring snowmelt (Choi et al., 2010). A recent global assessment of mountain regions reported that around 78% of the world’s mountain areas have experienced a snow cover decline between the 2000 and 2018 study period (Notarnicola, 2020).
Snow is a critical component of alpine areas. It drives hibernation of animals and determines the length of the growing season for plants. In addition, snow provides an insulating layer for plants and animals, protecting them from temperature extremes during winter (Callaghan et al., 2011; Pauli et al., 2013). Warming in alpine areas will not only reduce snowfall but also advance the timing of snowmelt. Ecologically, this timing is particularly important for the plants and animals that rely on the insulation provided by the snow to cope with freezing temperatures (Wipf et al., 2009; Callaghan et al., 2011; Pauli et al., 2013; Wheeler et al., 2014). Early snowmelt has been found to dramatically change soil microbial composition (Zinger et al., 2009), expose plants to freezing events they cannot tolerate (Bokhorst et al., 2009; Gerdol et al., 2013) and advance plant reproduction and growth (Lambert et al., 2010; Livensperger et al., 2016). Hence, a change in the time of the snowmelt, as well as a reduction in snowfall, can have significant consequences for high elevation ecosystems. Furthermore, snow cover and duration also influences lowland ecosystems, as the decrease in snow fall can decrease freshwater for downstream ecosystems. Snow water equivalent, a parameter that takes into account snow depth and density, has a direct influence on the hydrologic cycle and water supply in snowmelt-dominated regions (Barnett et al., 2005; Gan et al., 2013). Shrinkage of spring snow water equivalents over the last few decades has been reported for the Arctic region (Brown et al., 2010), East Europe (Bednorz, 2004), and the Northern Hemisphere (Brown, 2000; Brown and Robinson, 2011).
In spite of the crucial role played by snow in alpine areas, there are gaps in the knowledge as to how alpine snow is responding to a changing climate. It is still unclear whether all alpine areas will respond in a similar fashion or if differences exist between hemispheres, climate types, and environments. A search on the “Web of Science” with the keywords: snow, snow duration, mountains, climate change, and warming shows 60 studies ranging from 1999 till 2020 that specifically investigated how snow regimes were changing in alpine areas. Of these 60 studies, 39 were done in the Northern hemisphere, including 21 studies undertaken in Europe. In the Southern hemisphere, 21 studies were undertaken and 15 of these were based in South America (two of these studies also included North American sites), with 11 studies along the Andes Cordillera, particularly the Northern and Central Andes. Fourteen of these 21 Southern hemisphere studies used satellite images to quantify snow cover. Most of the South American studies describe glacier dynamics (Bodin et al., 2010; Durán-Alarcón et al., 2015), measure snow effects on albedo (Lhermitte et al., 2014) or validate methodologies to describe snow patterns (Soncini-Sessa and Volta, 2005). Surprisingly, only four studies focused particularly on the effect of climate change on snow accumulation (Masiokas et al., 2012; Migliavacca et al., 2015; López-Moreno et al., 2017; Notarnicola, 2020). The Andes Cordillera maintains both permanent and seasonal snowpack (Masiokas et al., 2020), with a seasonal snowpack coverage of approximately 61,000 km2 Saavedra et al., 2017). The seasonal snowmelt from the Andes provides the majority of the water required for human consumption, agriculture, industrial use, electricity generation, and aquifer recharge (Masiokas et al., 2006, 2012, 2020). Therefore, understanding how the snowpack duration in these mountains will be impacted by a changing climate is extremely important.
Given this, studies of the effects of climate change on snow cover and duration in the Andes are starting to emerge. Existing studies have mainly used data on snowfall and accumulation extracted from the closest weather stations. Thus, this kind of data does not consider spatial variation in snowfall or duration of snow, which is known to vary over a short spatial scale in the mountains. To overcome the spatial and temporal constraints imposed by the use of weather station data, remote sensing appears as a cost-efficient approach to measure and monitor snow cover systematically over large areas. The main limitations are the availability of cloud free images, especially when we want to study seasonal patterns. Besides measuring snow cover in cloud-free images, in this study, we used a per-pixel approach to take advantage of incomplete images due to cloud cover and other causes of data loss (e.g., the SLC instrument failure of the Landsat 7 ETM+ sensor). A similar approach was used by Macander et al. (2015) to study snow persistence in Alaska, although the classification algorithm they proposed returns maps of snow-free dates rather than snow persistence. Here we use Landsat satellite images from 1984 till 2019, including cloud free and incomplete scenes, to study the spatio-temporal changes in both snow cover and snow persistence in the Mocho-Choshuenco Volcano in the Southern Andes of Chile. Besides snow cover per date, traditionally studied from available cloud-free remote sensing data, here we propose to calculate a pixel based snow frequency measure per season (e.g., the number of times that a pixel is covered by snow considering the available satellite records), from now on called “snow persistence.” This provides robust snow persistence maps per season and per different time periods. Pixels showing snow persistence of 100% during the four seasons will show the areas with permanent snow cover. Changes in snow persistence, for example from one decade to the next one, can show a reduction of the area with permanent snow (less pixels with 100% snow persistence) or highlight the areas where the permanent snow changed to seasonal snow (e.g., 50 or 75% snow persistence) or ephemeral snow (e.g., <25%). In the present study, we derived two remote sensing metrics (snow cover area and snow persistence) to address the following questions regarding temporal variations in snow cover: Is the total area covered by snow changing through the years? What is the seasonality of the total snow cover in the volcano? and questions looking at the spatial and temporal variation in snow persistence: Are there temporal differences in snow seasonality at different elevational belts? What are the spatial patterns of snow persistence in the different seasons? Is there a reduction of snow persistence in the different seasons through the years? And finally, which elevational belts are changing the most in regard to snow persistence? We expect the total area covered by snow in this volcano to be reduced through the years as seen in other alpine areas around the world and we expect mid and low elevation belts to have a more pronounced reduction of snow persistence particularly in Spring and Autumn, indicating early snowmelt and late snowfall as has been predicted for alpine areas.
Materials and Methods
Study Area
We studied snow cover and its persistence through time in the Mocho-Choshuenco volcano complex, located in Los Ríos Region in the South of Chile (Figure 1). The Mocho-Choshuenco is an active stratovolcano compound located in Los Ríos Region, inside the Southern Chile Volcanic Zone (Rawson et al., 2015, 2016). The volcanic compound covers an area of 250 km2, an approximate volume of 100 km3 with a summit of 2,422 m a.s.l. (Moreno and Lara, 2007). Currently, the compound is 7th in the specific risk ranking developed by National Service of Geology and Mining of Chile. Most of the study area belongs to the Mocho-Choshuenco National Reserve under the administration of the Chilean National Forest Service CONAF. We selected the area above the treeline (above 1,200 m.a.s.l.) equivalent to the alpine area to analyse the snow duration. The alpine area in this volcano is dominated by shrubs such as Adesmia longipes, Escallonia alpina, Gaultheria poepigii, Ovidea andina, and Senecio chionophilus and grasses such as Anthoxanthun juncifolium, Festuca thermarum, and Poa obvallata. Toward higher elevations small perennial herbs like Nassauvia revoluta and Nassauvia lagascae sparsely inhabit the scoria (Teillier et al., 2012).
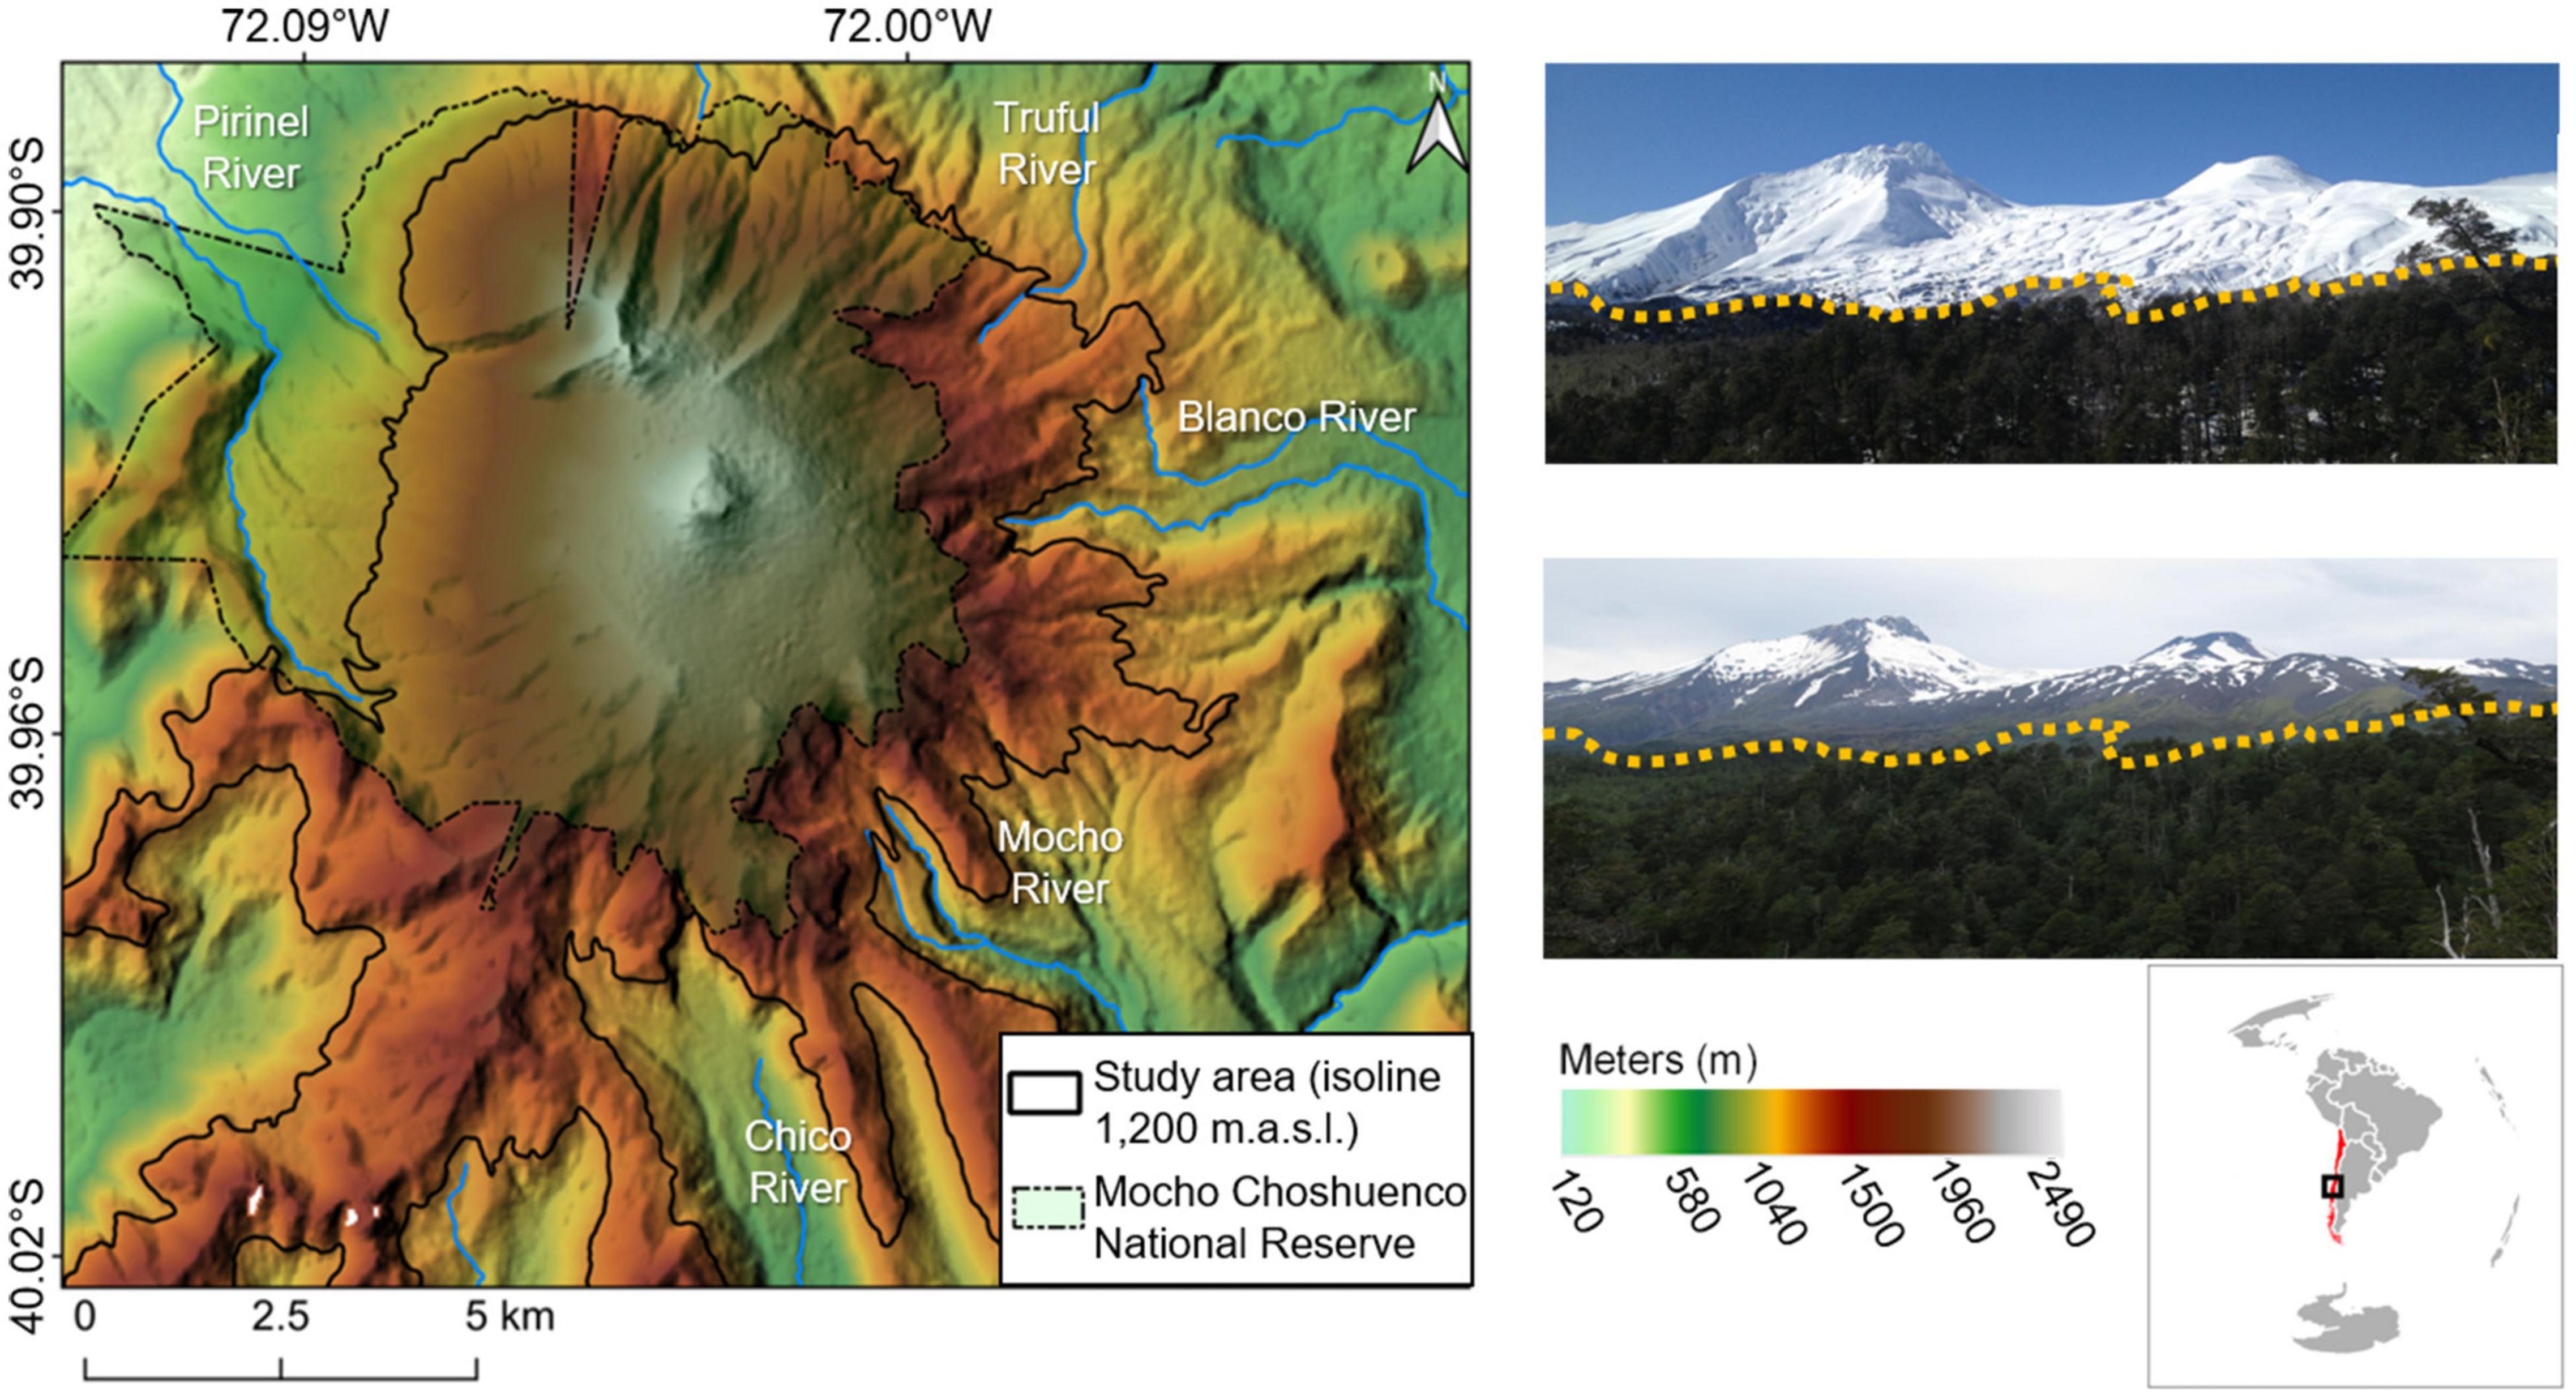
Figure 1. Study area comprising the alpine area above the tree-line of the Mocho Choshuenco volcano in Southern Chile, with a total area of 137 km2. The tree line (1,200 m.a.s.l.) is indicated in the pictures by dotted yellow lines.
Landsat Images Availability and Definition of Periods of Analysis
All available Landsat images, including Landsat 5, 7, and 8, were accessed and analyzed in the cloud using the Google Earth Engine capabilities (Gorelick et al., 2017). The specific code of this and other sections of the manuscript are available in this link.1 Specifically, we used the atmospherically corrected product Landsat Surface Reflectance Collection 1 Tier 1 corresponding to the highest radiometric and precision terrain quality. All Landsat scenes have 30 m pixel resolution. A total of 678 scenes from Path 232/233 and Row 88 were used, from which 23.5% of the scenes were completely cloud free and 76.5% were incomplete (with data gaps). Incomplete images are the result of partial cloud cover or sensor data loss, e.g., failure of the SLC instrument on Landsat 7 (Supplementary Material and Supplementary Figure 1). Cloud-free images were used for calculating total snow cover area per date of the study area and both cloud-free and incomplete images were used for snow persistence calculations which are applied on a pixel basis. Before 1998, Landsat data was scarce with a temporal gap of 7 years between 1990 and 1997 (Supplementary Material and Supplementary Figure 1A). From 1998 on, the dataset provides images consistently over time with 25–50 images per year, considering the revisit time of 16 days that each satellite has, but also that the different satellites overlapped in time, e. g., Landsat 5 and 7 between 1999 and 2013 and Landsat 7 and 8 between 2013 and 2020. Following the meteorological conditions of the South Hemisphere, there is a marked seasonality in data availability with a minimum of data during winter, particularly in June, due to increased cloud cover. In order to have sufficient data points for snow frequency calculations (snow persistence maps), we grouped the Landsat data by season: summer (Dec–Jan–Feb), autumn (Mar–Apr–May), winter (Jun–Jul–Aug), and spring (Sep–Oct–Nov) and by five periods of time: P1 (1984–1990), P2 (1998–2003), P3 (2004–2009), P4 (2010–2014), and P5 (2015–2019).
Total Snow Area Estimation and Validation Using the NDSI
Snow detection was automatically performed using the Normalized Difference Snow Index (NDSI) proposed by Dozier (1984) and the spectral bands of Landsat images, specifically the short-wave infrared (SWIR) and green (G) bands (Figure 2). This snow index has been widely used for snow detection in different regions of the world (Burns and Nolin, 2014; Zhang et al., 2019; Masiokas et al., 2020). The formula of the NDSI is given as follows:
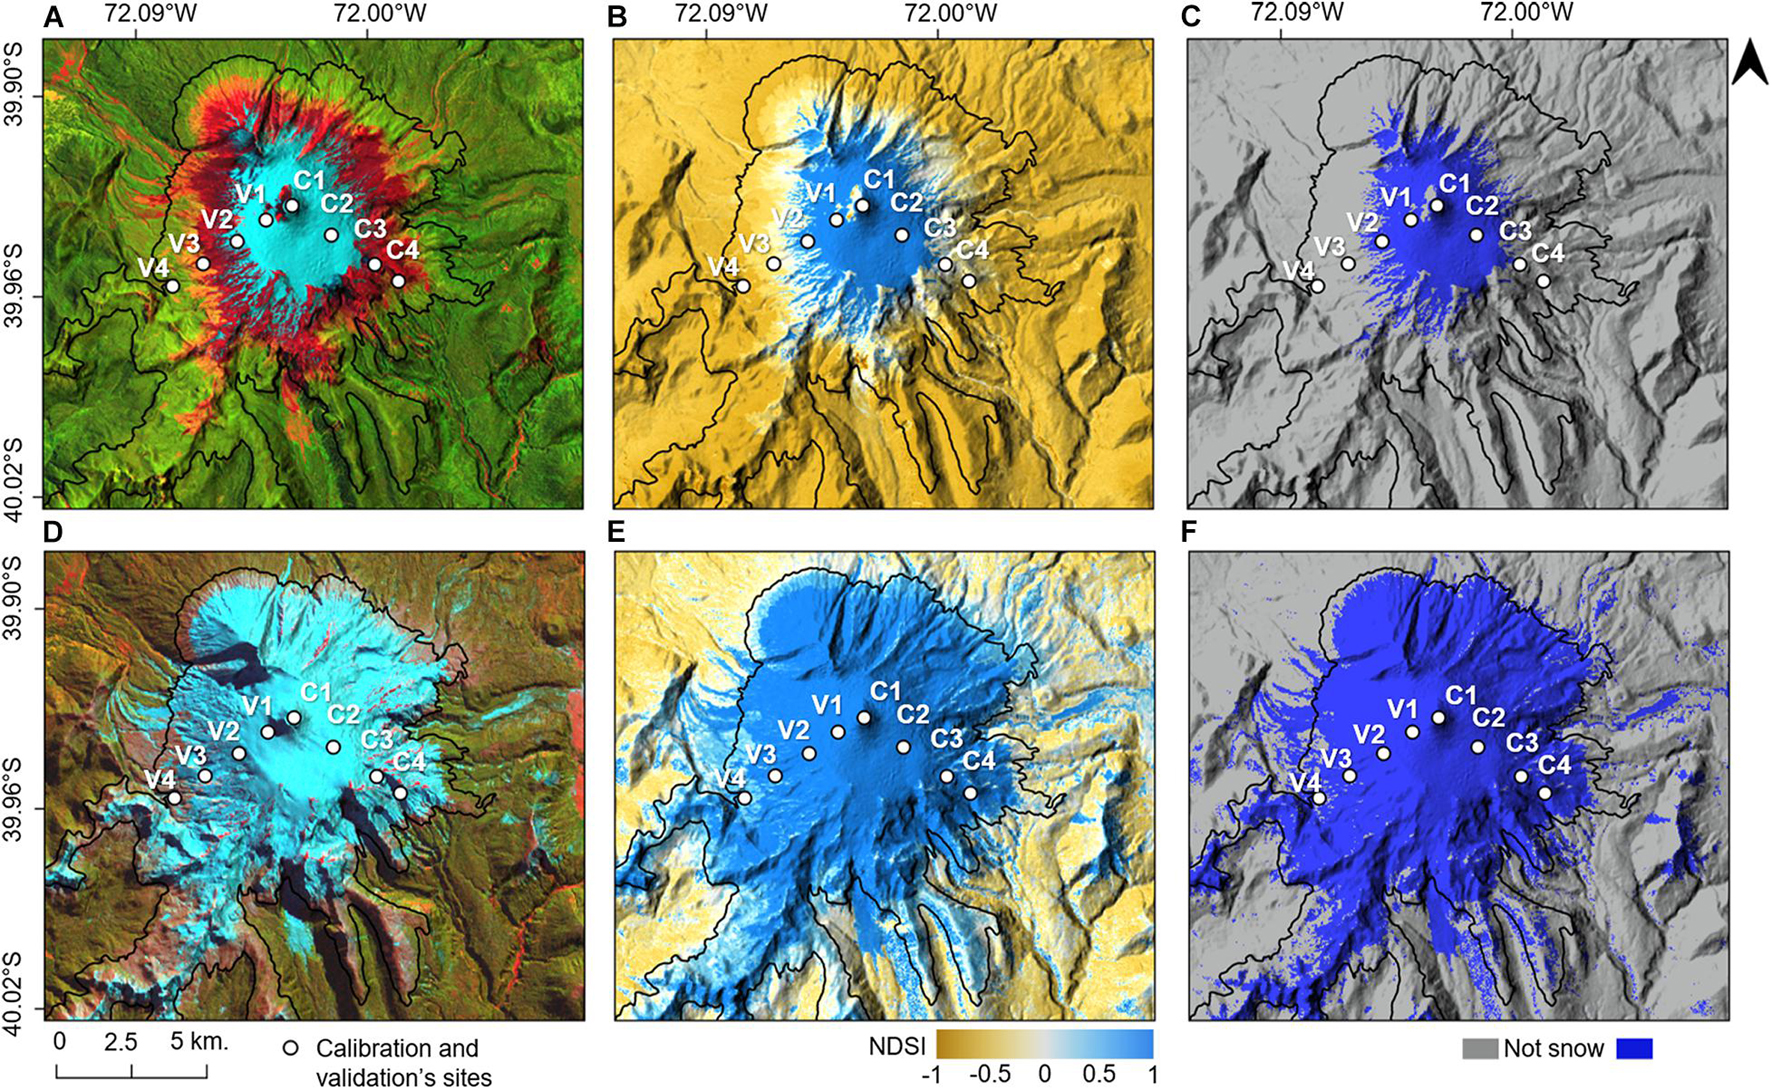
Figure 2. Snow detection approach using Landsat images. (A,D) correspond to a false color composition (SWIR-NIR-Red) of Landsat images, (B,E) are the Normalized Difference Snow Index (NDSI) images calculated from Landsat, and (C,F) are binary “snow” and “not-snow” images calculated using a fixed threshold. Upper panels (A–C) correspond to a Landsat image acquired in summer (23-01-2019) and (D–F) in winter (24-08-2006).
From all original Landsat images (Figures 2A–D), where the snow is already recognizable by simple visual inspection in different seasons (A: summer, D: winter), the NDSI images were retrieved (Figures 2B,E). To classify pixels as “snow” or “not-snow” several NDSI thresholds have been proposed (Figures 2C,F). In the literature, thresholds of 0.4 (or similar) have been used or recommended (Hall and Riggs, 2007; Sankey et al., 2015; Masiokas et al., 2020) but this threshold has shown large standard deviations across different areas (Härer et al., 2018). In this study, we carried out a calibration exercise to define a NDSI threshold for the Mocho-Choshuenco volcano and later a validation of the snow mapping exercise. To achieve this, we set two transects (Figure 2) in a gradient from permanent snow (top of the volcano) to ephemeral snow (downward the volcano). In the west–east transect we defined four calibration points (C1–C4) and in the east-west transect four validation points (V1–V4). Thus, we have 636 data points for NDSI threshold definition and 636 data points for an independent validation of the defined NDSI threshold. For each calibration point and for each of the 159 cloud-free Landsat images (Supplementary Material and Supplementary Figure 1), we visually inspected whether the corresponding pixel was “snow” or “not-snow” using a false color composition (SWIR-NIR-Red) of the original Landsat images (Figures 2B,E) supported by available Google Earth high spatial resolution images, especially in the transition between snow and not snow. With this database we were able to study the dynamic range of the NDSI in a gradient of permanent snow to ephemeral snow and across the seasons and years. By constructing boxplots of NDSI for pixels with “snow” and “not snow” of the four calibration points, we identified the optimal threshold to detect snow. Finally, we constructed a confusion matrix and calculated the overall accuracy of the defined NDSI threshold using the validation dataset. By using this NDSI threshold, binary snow and not-snow maps were constructed from which the total snow area per date was calculated (Figures 2C,F). Additionally, we constructed a confusion matrix of the snow flag included with the Landsat Surface Reflectance product level 2.0 to compare the results obtained from NDSI thresholding and the default Landsat snow flag. Visualizations of the annual cycle of total snow area for the entire volcano and also at three different elevational belts (1,200–1,530, 1,530–2,000, and >2,000 m a.s.l.) were constructed using kernel density estimations of the snow area – time space. For this purpose, we used the PhenKplot function from the “npphen” R function (Chávez et al., 2017).
Snow Persistence Modeling and Maps
As indicated in previous sections, cloud free satellite images are scarce at high latitudes and in mountainous areas, limiting remote sensing based assessments of snow cover dynamics. For example, in our study site, only 23% of the 678 Landsat images were cloud-free. To make use of incomplete satellite images (e.g., the 77% of our Landsat dataset) we use a complementary approach to total snow cover area calculation (Section “Total Snow Area Estimation and Validation Using the NDSI”) which we call “snow persistence”. Snow persistence is the probability of the presence of snow for a given pixel at a given day of the year (DOY) or through a time interval. Frequencies are calculated per pixel and per DOY based on all available Landsat data (cloud free and incomplete images) and can also be calculated for different periods of time (e.g., the five periods defined in this study, see Supplementary Material and Supplementary Figure 1). Based on the “snow”/“not-snow” binary images (Figures 2C,F) we extract for each pixel the time series of snow presence per date. In order to have more binary observations for the fitting process, the data can be aggregated by month or season. Then we fit a binomial generalized linear model to the “snow”/“not-snow” data per month or season.
Different from the study of Macander et al. (2015), where the classification algorithm returns the snow-free date per pixel, in this study, the response variable corresponds to the probability that a given pixel is covered by snow at a given date or time interval. Here we calculated snow persistence per season for the whole Landsat time series and also for the five periods of analysis. Pixels with snow persistence of 100% in summer, winter, autumn, and spring can be considered as permanent snow. Changes in snow persistence through time can demonstrate the potential impacts of climate change: e.g., areas where snow persistence in summer was 100% and now is 80% indicates permanent snow is becoming seasonal or ephemeral. Since this is calculated at a pixel basis, there is no need for complete cloud-free images and thus all valid pixels of all available satellite images can be used. We developed a function in R Core Team. (2020) to calculate snow persistence maps for the entire study area and also at three different elevational belts (1,200–1,530, 1,530–2,000, and >2,000 m a.s.l.) using the capabilities of the “raster” package (Hijmans, 2019) to handle large Landsat raster-stacks and also R capabilities to take advantage of multi-core processing. To evaluate the quality of the binomial GLM models, we calculate the Area Under the ROC Curve (AUC-ROC) per pixel. AUC values close to 0.5 means the classifier is no better than a random classifier, and values close to 1 means the classifier has a high quality performance. We finally constructed AUC-ROC maps per period, showing the spatial distribution of the model performances in terms of AUC-ROC grouped in four categories suggested by Hosmer et al. (2013) which are <0.7 (poor), 0.7–0.8 (acceptable), 0.8–0.9 (excellent), and 0.9–1.0 (outstanding).
Results
Total Snow Cover Area and Seasonality
The boxplots obtained from the calibration exercise showed that a threshold of NDSI of 0.5 maximizes classification accuracy (Supplementary Material and Supplementary Figure 2). Using this threshold to classify snow and not-snow for the validation dataset, we achieved an overall accuracy of 98.27% (Supplementary Material and Supplementary Table 1). The NDSI > 0.5 threshold showed higher overall accuracy than the default Landsat snow flag (98.27% against 90.88%) and lower omission error for the snow class (2.8% against 15%) (Supplementary Material and Supplementary Tables 1, 2). Hereafter, all calculations were performed using this threshold.
The total snow cover area of our study site during the 1986–2019 time frame is presented in Figure 3. This is the longest time series available in remote sensing records at this spatial scale (30 m). As expected, there is a strong seasonality in total snow cover with a total area reaching between 80 and 105 km2 in winter and a minimum and consistent area of about 18–20 km2 in summer. In Figure 3B, we show a kernel density estimation of the total snow area – DOY space using all annual cycles of snow area. This way, the long-term snow seasonality of the Mocho-Choshuenco volcano is deployed. The dark-red line shows the most likely snow area at different DOY’s along to its frequency distribution (colored area). From this figure, we observed that around DOY 150 (end of May) the snow starts to fall and there is a sharp increase in the area covered by snow, reaching its maximum by the end of the winter (August, about DOY 240). A wide range of total snow is observed at the peak of the winter season demonstrated by the broad frequency distribution around the most probable value of about 100 km2. In spring, the melting process begins and therefore this period has the most variation in snow cover through time. By the DOY 300 (end of October) the melting process ends and the total snow area goes down to about 40–30 km2, and keeps going down to the basal summer snow cover of 20 km2. This minimum area covered by snow in summer was relatively stable over 25 years until 2014 when it decreased and remained below 20 km2 until 2019 (basal red line in Figure 3A). Besides this decrease in the summer cover area, there is no other clear evidence of total snow area changes through time.
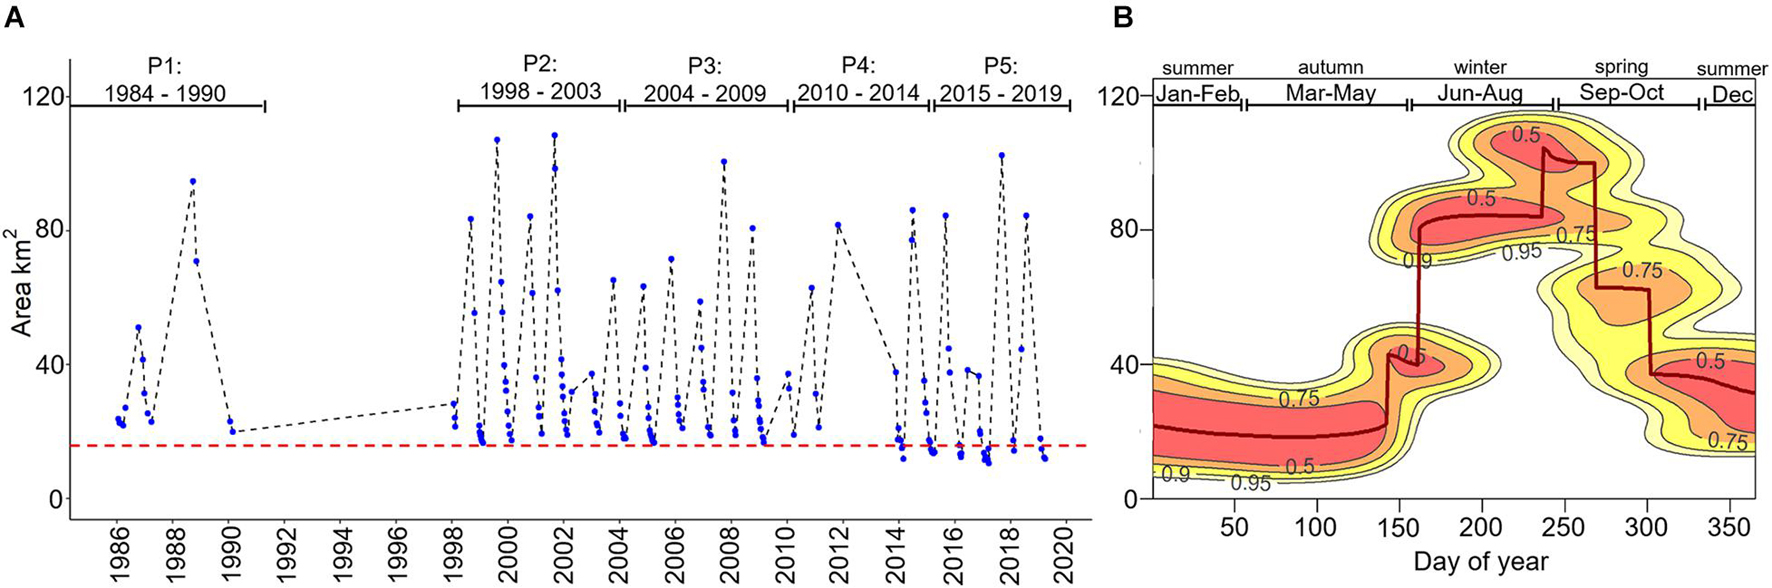
Figure 3. Total snow cover time series 1986–2019 (A) and seasonality (B) of the Mocho Choshuenco volcano based on 159 cloud-free Landsat images. Seasonality of total snow cover area was calculated using Gaussian kernel density estimations of the snow cover along the year based on all historical records. Red color in panel (B) indicates high frequency of a given snow cover at different days of the year and yellow color lower frequencies of snow cover areas. Summer is very stable and the area covered by snow is about 20 km2. The end of winter and the start of spring are the periods with larger snow cover, approximately 100 km2. Then the snow cover decreases gradually in spring till the basal 20 km2 of snow cover in summer. Note that from 2014 onward the lowest snow cover area is lower than the basal 20 km2 (red dotted line).
When we decomposed the total snow area time series into three different elevational belts (Figure 4), we observed clear seasonal variation in the area covered by snow at the low and middle elevations, but not at high elevation (>2,000 m a.s.l.). In the middle elevation, the snow area in winter remains more stable (about 40 km2) and for longer (about 170 days) compared with low elevation (40–55 km2 lasting about 100 days). From this Figure, we can see that the decrease in total snow area in the Mocho-Choshuenco volcano, starting in 2014, takes place mostly at middle elevations (Figure 4C).
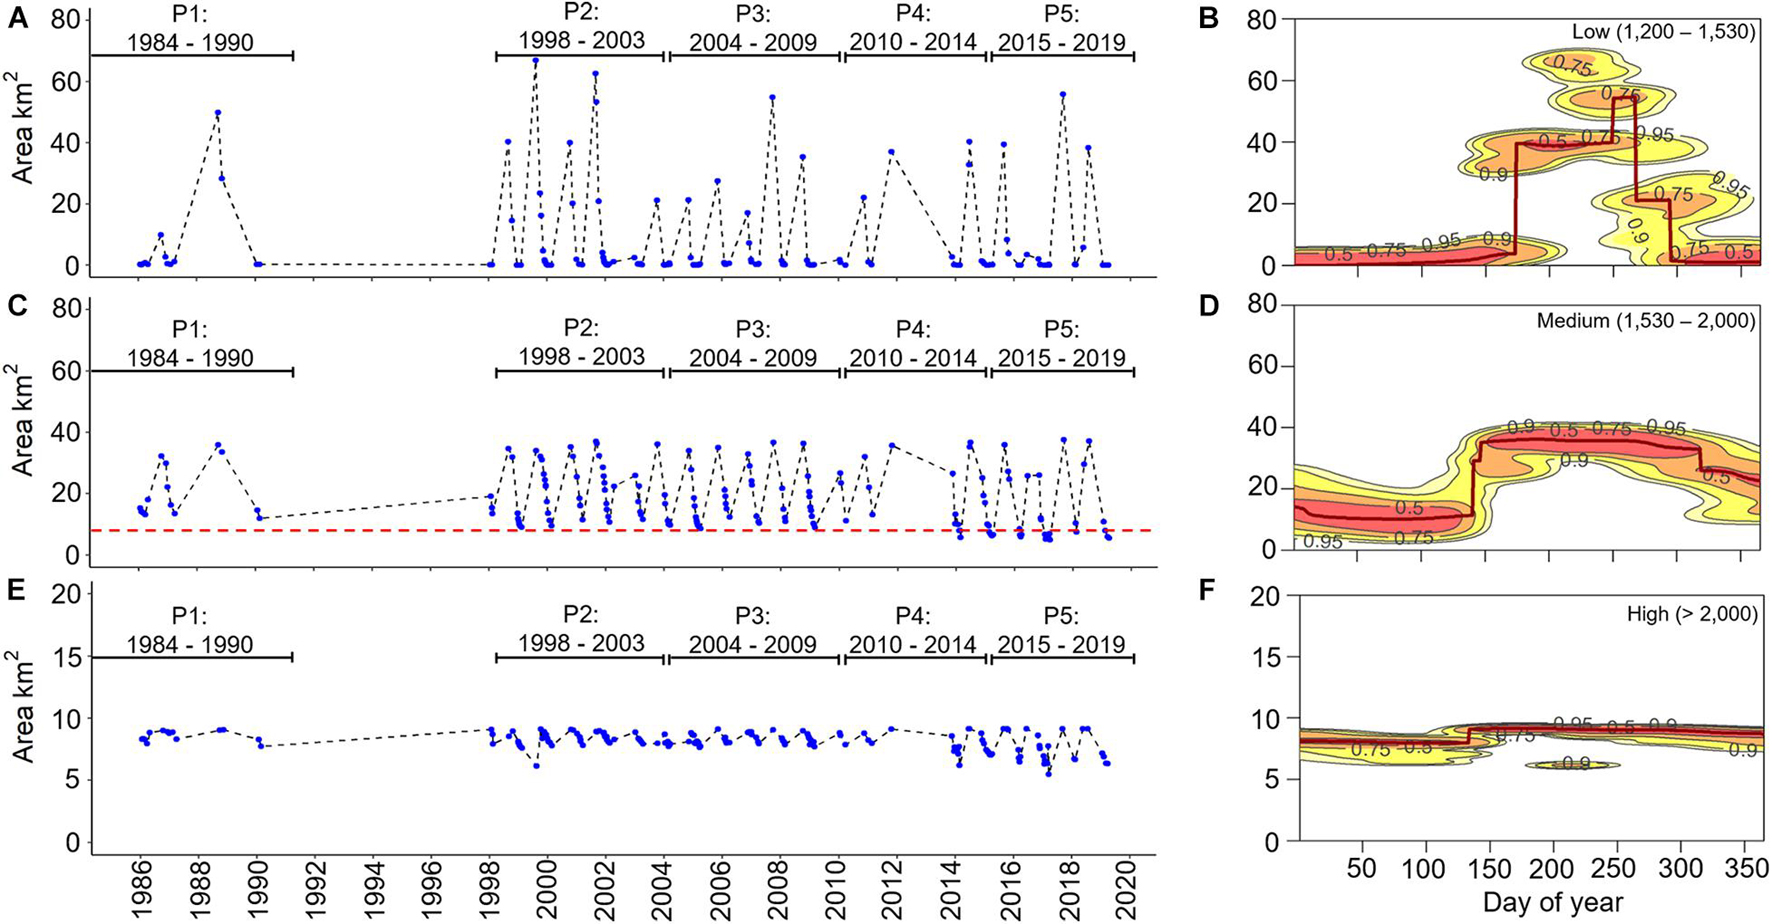
Figure 4. Total snow cover time series 1986–2019 (A,C,E) and seasonality (B,D,F) of the Mocho Choshuenco volcano at three different elevation belts where L, Low (1,200–1,530 m. a.s.l.); M, Medium (1,530–2,000 m. a.s.l.); and H, High (>2,000 m. a.s.l.). Note that from 2014 onward the lowest snow cover area is lower than the basal area only for the middle elevational belt (red dotted line).
Snow Persistence Spatio-Temporal Patterns
The AUC-ROC maps calculated for the five different periods (Supplementary Material and Supplementary Figure 3), show that the pixel based models used for snow persistence mapping present high efficiency for practically the entire study area. Supplementary Table 3 in the Supplementary Material, summarizes the area at different levels of model efficiency, showing that for the five periods less than 0.5% of the study area presented poor efficiency (AUC-ROC < 0.7). Furthermore, less than 5% of the study area presented “acceptable” efficiency for all periods while the categories “excellent” and “outstanding” were the most represented. Overall, these results suggest a good performance of the snow persistence modeling and mapping for all periods.
The snow persistence maps calculated with 29 years of Landsat data (678 satellite images) show distinctive spatial features for the four different seasons (Supplementary Material and Supplementary Figure 4). The area with highly persistent snow (i.e., snow persistence > 75%) is much larger in winter and spring than in summer and autumn. Consequently, the low elevational belt is snow-free in summer and autumn, while in the middle elevational belt, some areas remain with highly persistent snow, especially along the East–South slope of the volcano. During winter and spring this middle elevational belt is permanently covered by snow. Finally, the high elevational ring is covered by snow practically all year long, besides some specific areas with high slope near the crater and on the northern slope, which are snow-free during summer and autumn.
The total area with different snow persistence ranges observed for the five different periods at three elevational belts is presented in Figure 5 while the changes per period considering all elevational belts together is summarized in the Supplementary Material and Supplementary Figure 5. Pixels with snow persistence > 95% in summer can be considered as permanent snow and when setting the first period (with 20 km2) as a baseline, our results show that permanent snow area has decreased by 17% in period 2, then recovered 4% in period 3 with an accumulated decrease of 13%, then decreased again by 20% in period 4 to finally reach its minimum extent in the last period with 5.75 km2 (28% reduction). Temporal changes in autumn and spring are variable. In winter we observed a sustained reduction of the area with snow persistence > 95% in periods 2 (24%), 3 (56%), 4 (25%), and 5 (42%) with respect to period 1 (Figure 5, Supplementary Material, and SupplementaryFigure 5).
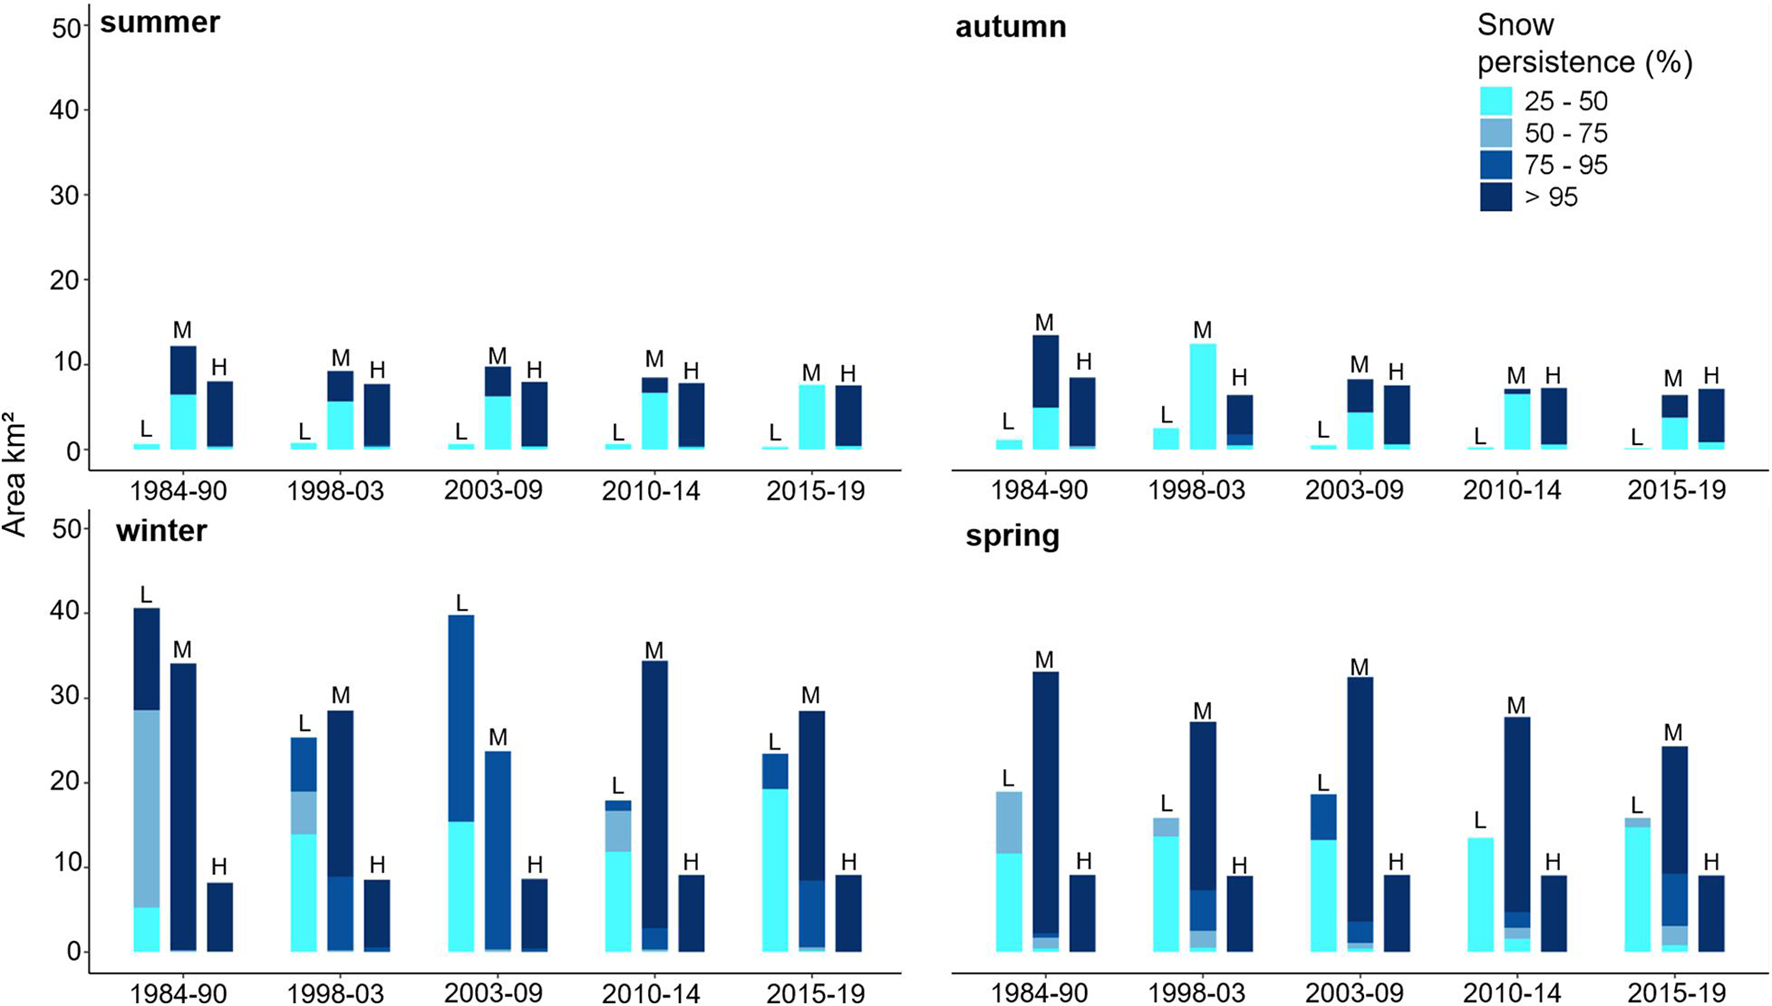
Figure 5. Area changes in snow persistence for different seasons and periods. Bars represent the different elevation belts where L, Low (1,200–1,530 m. a.s.l.); M, Medium (1,530–2,000 m. a.s.l.); and H, High (>2,000 m. a.s.l.).
When subtracting the snow persistence maps of the different periods from the map of period 1 (Figure 6), we can identify specific locations with a gain (light blue to blue colors) or a reduction (yellow to red colors) in snow persistence. Changes in snow persistence through the periods are seen for summer and autumn at the middle elevation belt (Figure 6). In spring and winter, the lower elevational belt is decreasing in snow persistence especially after 2010. The affected area in the middle elevation belt is smaller and less drastic than in autumn. Extreme changes in the persistence of snow are seen for low elevations in winter.
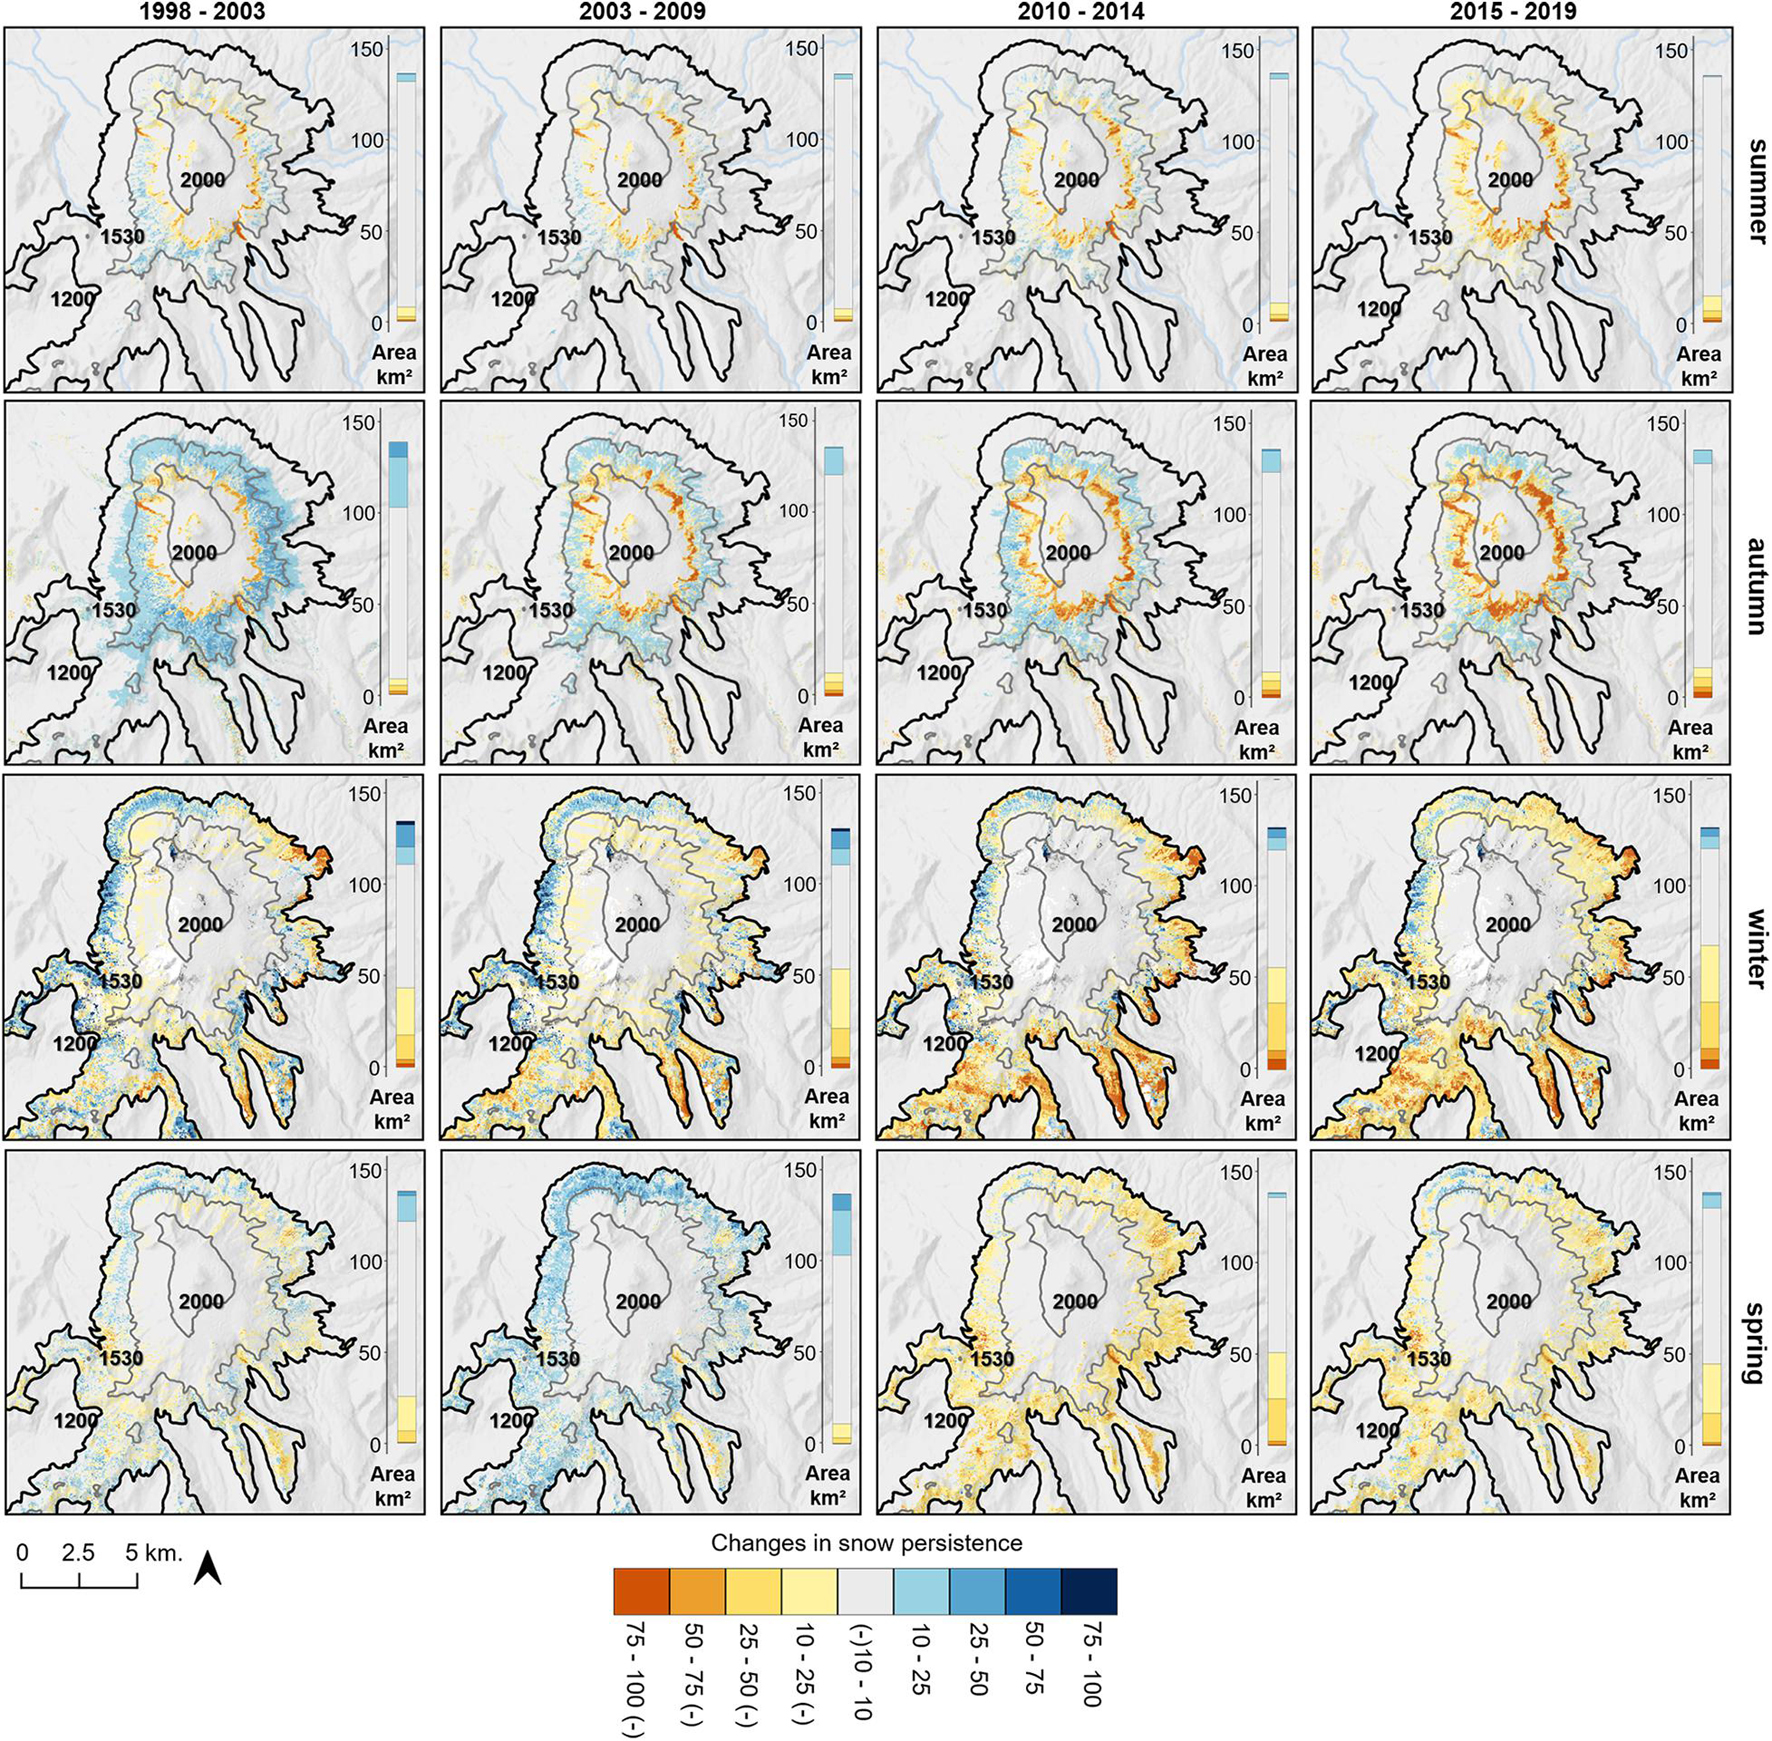
Figure 6. Changes in snow persistence for different periods (columns) and seasons (rows). Reference period (P1: 1984–1990).
Discussion
In this study, we have investigated the spatial and seasonal variation of snow cover and snow persistence in the Mocho-Choshuenco volcano in Southern Chile using a long record (35 years) of Landsat Satellite images. Snow cover in mountain areas has been traditionally assessed using remote sensing data and the NDSI from global (Notarnicola, 2020) to regional scale, e.g., the South American Andes (Masiokas et al., 2020), using MODIS products (250 m resolution), and to local scale (Burns and Nolin, 2014) using Landsat data (30 m resolution). Data loss is huge, since all images with a partial coverage of the study area have to be neglected. MODIS 8-day composites cope partially with this problem, but still for the 8 day temporal window the scene has to be complete in order to be used. In this manuscript, in addition to the traditional snow cover calculation, we introduced a different metric: seasonal snow persistence calculated at a pixel basis, allowing us to take full advantage of Landsat images both complete cloud-free (159 scenes) and incomplete scenes (519). Using this approach we can construct robust snow persistence change maps for different periods and across seasons with 326% more data than the traditional approach. The AUC-ROC maps for the five different periods showed a good performance of the snow persistence models for almost the entire study area with less than 0.5% of the study area presenting a “poor” performance (AUC-ROC < 0.7).
We have found a clear seasonal variation in snow cover and persistence for the whole area above the treeline, as well as across different elevational belts, with the low elevation belt being the most variable in terms of snow cover and persistence. Comparing across periods, the areas of high snow persistence (75–95 and >95%) are the most variable across periods. Indeed, a clear reduction of the area of high snow persistence is seen in summer (28% reduction in the period 2015–2019 with respect to the base period 1984–1990). Evidence of reduction of snow persistence was also found when comparing periods for the middle and low elevational belt. The middle elevational belt is decreasing in snow persistence in summer and autumn while a decrease in snow persistence in winter and spring is seen in the lowest elevational belt. In addition, we found that the minimum snow cover area is decreasing through the years, particularly in the middle elevation belt. Here we compare our findings with the ones found in other mountain areas. We explore the ecological relevance of our findings and highlight the advantages and constraints of this methodology. Finally we discuss the potential ecological questions that can be addressed with this method.
Contrasting Snow Seasonality Between Elevational Belts in the Mocho-Choshuenco Volcano
The kernel density estimation applied to the snow area along the year allows us to measure the long-term snow seasonality for the whole volcano and its temporal variation, given by the frequency distribution along the most expected snow area along the year. This non-parametric approach has been proposed and used to study vegetation phenology and disturbances (Chávez et al., 2019a,b,c; Decuyper et al., 2020) and it is a useful approximation to assess the seasonality of snow cover. The seasonality of the area covered by snow varies strikingly between elevational belts. The snow lasts approximately 70 days more in the middle elevation belt compared to the low elevation belt, this is a big difference in snow duration over short elevational scale, that accentuates the environmental differences between elevations. Mountains are usually viewed and studied in terms of the air temperature decreasing across the elevational gradient. However, snow decouples plants from air temperature and thus paradoxically, plants at lower elevations are exposed to colder temperatures than higher elevation ones. Considering the effects of climate change on the seasonality of snow duration is crucial to understanding how climate change will impact alpine vegetation.
Snow Cover and Persistence Reduction Through the Years in Mocho-Choshuenco Volcano
We have found evidence of snow cover and persistence reduction in the Mocho-Choshuenco volcano. Firstly, using all the snow free scenes, a decrease in the minimum area covered by snow can be seen since 2014 onward. This was also evident when studying the seasonality of the snow cover by elevational belts, with the middle elevational belt showing the decrease in minimum snow cover. The maps of difference in snow persistence per season also show a striking variation in the area of snow persistence. The middle elevational belt is decreasing in snow persistence in summer and autumn while a decrease in snow persistence in winter and spring is seen in the lowest elevational belt. The highest elevational belt is not experiencing any changes in snow persistence with the years. A range of studies have identified that the most rapid and consistent losses of snow, in terms of depth and duration, are mid-elevation areas (e.g., sub-alpine zone) and those with Mediterranean/maritime climates, where mean air temperatures are close to freezing (Brown and Mote, 2009; Steger et al., 2013). In the Tibetan Plateau, areas below 3,500 m a.s.l. experienced shorter snow cover duration in a 15 years study using MODIS (Wang et al., 2017). A review of the status of the European cryosphere found a general negative trend for snow depth and snow water equivalents below 2,000 m a.s.l. and no trend at higher elevations in the Alps (Beniston et al., 2018). For Western United States, Mote et al. (2018) found that 33% of the monitored sites showed a significant decline in snowpack, these changes occur mainly in spring and at milder elevations. Recently, a study looking at snow cover in mountains around the globe, found that 78% of the global mountains are undergoing a decline in snow cover duration of up to 43 days and a decrease of snow cover area up to 13%. In this study, the area of the Andes mountains considered (between 42°S and 29°S) exhibited the most drastic change in snow cover, with a decrease of snow cover duration of −26.6 days between 2,500 and 4,000 m a.s.l. (Notarnicola, 2020), similar results were found by Saavedra et al. (2018) and Malmros et al. (2018). Our results show reductions on snow persistence in every season. Indeed, besides spring, the area with snow persistence > 75% is the lowest in the last of the five periods, and excluding winter, the area with snow persistence > 95% is also the lowest in the last period. The effects of a reduction in snow persistence on alpine vegetation at different elevations and for different seasons is of critical relevance if we are to make predictions of the effects of climate change on alpine ecosystems.
Climate predictions for the Andes are extremely complex, due to the sharp vertical rise of the Andes and the length of the Cordillera covering several climatic regions and the influences of additional climate systems including El Niño patterns (Kohler and Maselli, 2009). Therefore, studies on changes in snow persistence here need to encompass several sites across this mountain chain and, for example, findings on the Southern Andes cannot be extrapolated to what might occur in the tropical, Mediterranean or Patagonian Andes. Studies covering most of the climatic regions of the mountain range are needed to understand the local effects of climate change or climate systems on snow persistence in the Andes.
Potential Ecological Effects of Reduction of Snow Persistence
There is clear evidence that snow duration is changing in mountains worldwide, however, the question of how plants will respond to changes in snow conditions is still unclear and most of the studies looking at the ecological responses to variation in seasonal snow cover are done in the northern hemisphere (Slatyer et al., 2021). Advanced snowmelt could potentially increase plant fitness by prolonging the growth period and hence increasing resource allocation to seed production (Galen and Stanton, 1993). However, there is increasing evidence that early snowmelt also increases the risk of frost damage in adult life stages. We already know that naturally occurring warm spells and early snowmelt increase the mortality of flower buds due to frost damage (Molau, 1993; Inouye, 2008; Lambert et al., 2010). Further, experimental snow reduction and advancing snowmelt have been linked to reductions in biomass and fruit production, again resulting from frost damage (Gerdol et al., 2013). The effects of reduced snow persistence will depend on the season and elevation where this reduction occurs, with perhaps more detrimental effects for winter and for mid and high elevations areas where plants are acclimated to late snowmelt. Therefore, methods that allow us to look at the spatial and temporal variation in snow persistence are extremely relevant.
Snow duration determines species composition in the mountains, therefore, changes in snow conditions could promote changes in species composition and modify the dominant plant life-form (e.g., Hagedorn et al., 2014; Elliott and Petruccelli, 2018), and even impact on other trophic levels (Roland et al., 2021). In addition, a potential slow upward colonization of shrubs over areas currently occupied by perennial herbs might occur as a consequence of early snow melt in these areas. A second potential effect could be observed in the distribution of the species along the elevational gradient. In several alpine environments it has been observed a significant change in the optimal elevation of the plant species distribution. Similar changes have been observed in Western Europe (Lenoir et al., 2008). In these cases, elevational changes in the maximum value for some fitness metrics (e.g., seed production, seed germination, and growth, etc.) could be expected. The effects of early snow melt on plant fitness in alpine areas requires urgent assessment to provide key information for the conservation of these environments. Using this methodology we have found reduction of snow duration at a temporal and spatial scale in the Mocho-Choshuenco volcano. This method could be used to study the influence of snow duration on plant reproduction, phenology, seed germination, species persistence, and stress tolerance in environments where snow is a major feature. In addition, this methodology can be used to find priority areas for conservation in the mountains, such as areas where a strong pattern of snow reduction is seen or areas where plant species exist without significant potential for adaptation.
Advantages and Disadvantages of Seasonal Snow Persistence Calculations
We have already highlighted that our approach to the study of snow persistence optimizes the use of remote sensing data, including scenes with spatio-temporal gaps due to cloud cover or sensor malfunction. It can be applied to different remote sensing data such as MODIS snow products (250 m), Landsat (30 m), or Sentinel 2AB data (20 m). In this case, we were able to use three times more Landsat data than a traditional cloud-free based assessment. This allowed us to provide a robust description of snow spatio-temporal patterns and changes even for the cloudy Seasons. The main limitation of this approach is that it does not allow monitoring of snow cover on a short-term temporal basis, since several observations are needed to calculate a robust snow persistence. For example, it is difficult to calculate snow persistence on a monthly basis instead of seasonal as we did here, especially during cloudy seasons. Additionally, we advise to use this methodology for areas above the treeline (i.e., alpine areas), given that taller vegetation below the treeline will likely interfere with the snow visualization. In this study, we took careful consideration of this limitation when defining our study area: above the treeline (1,200 m.a.s.l.). Snow duration studies in the field are extremely laborious and of short span. We hope this methodology helps to understand how climate change is affecting snow cover and persistence patterns worldwide, especially for cloudy areas or seasons with patchy satellite data, and the ecological consequences of it.
Data Availability Statement
The data and scripts supporting the conclusions of this article are made available by the authors in this link https://github.com/JoseLastra/Frontiers_paper, without undue reservation.
Author Contributions
RC and VB conceived the research article. RC, SE, and JL developed the R code for the remote sensing analyses. RC, VB, SE, and DH-P prepared and edited the manuscript. JL and RC conceived and prepared the figures. All authors have revised and approved the manuscript.
Funding
VB was funded by PAI-Conicyt 82140011. RC was funded by FONDECYT iniciación N°11171046 and FONDECYT regular N°1211924. SE was funded by CAPES ANID PIA/BASAL FB0002.
Conflict of Interest
The authors declare that the research was conducted in the absence of any commercial or financial relationships that could be construed as a potential conflict of interest.
Publisher’s Note
All claims expressed in this article are solely those of the authors and do not necessarily represent those of their affiliated organizations, or those of the publisher, the editors and the reviewers. Any product that may be evaluated in this article, or claim that may be made by its manufacturer, is not guaranteed or endorsed by the publisher.
Supplementary Material
The Supplementary Material for this article can be found online at: https://www.frontiersin.org/articles/10.3389/fevo.2021.643850/full#supplementary-material
Footnotes
References
Barnett, T. P., Adam, J. C., and Lettenmaier, D. P. (2005). Potential impacts of a warming climate on water availability in snow-dominated regions. Nature 438, 303–309. doi: 10.1038/nature04141
Bednorz, E. (2004). Snow cover in eastern Europe in relation to temperature, precipitation and circulation. Int. J. Climatol. 24, 591–601. doi: 10.1002/joc.1014
Beniston, M., Diaz, H., and Bradley, R. (1997). Climatic change at high elevation sites: an overview. Clim. Change 36, 233–251.
Beniston, M., Farinotti, D., Stoffel, M., Andreassen, L. M., Coppola, E., Eckert, N., et al. (2018). The European mountain cryosphere: a review of its current state, trends, and future challenges. Cryosphere 12, 759–794. doi: 10.5194/tc-12-759-2018
Bodin, X., Rojas, F., and Brenning, A. (2010). Status and evolution of the cryosphere in the Andes of Santiago (Chile, 33.5°S.). Geomorphology 118, 453–464. doi: 10.1016/j.geomorph.2010.02.016
Bokhorst, S. F., Bjerke, J. W., Tømmervik, H., Callaghan, T. V., and Phoenix, G. K. (2009). Winter warming events damage sub-Arctic vegetation: consistent evidence from an experimental manipulation and a natural event. J. Ecol. 97, 1408–1415. doi: 10.1111/j.1365-2745.2009.01554.x
Brown, R., Derksen, C., and Wang, L. (2010). A multi-data set analysis of variability and change in Arctic spring snow cover extent, 1967–2008. J. Geophys. Res. Atmos. 115:D16111.
Brown, R. D. (2000). Northern hemisphere snow cover variability and change, 1915–97. J. Clim. 13, 2339–2355. doi: 10.1175/1520-0442(2000)013<2339:nhscva>2.0.co;2
Brown, R. D., and Mote, P. W. (2009). The response of Northern hemisphere snow cover to a changing climate. J. Clim. 22, 2124–2145. doi: 10.1175/2008jcli2665.1
Brown, R. D., and Robinson, D. A. (2011). Northern hemisphere spring snow cover variability and change over 1922–2010 including an assessment of uncertainty. Cryosphere 5, 219–229. doi: 10.5194/tc-5-219-2011
Burns, P., and Nolin, A. (2014). Using atmospherically-corrected landsat imagery to measure glacier area change in the Cordillera Blanca, Peru from 1987 to 2010. Remote Sens. Environ. 140, 165–178. doi: 10.1016/j.rse.2013.08.026
Callaghan, T., Johansson, M., Brown, R., Groisman, P., Labba, N., Radionov, V., et al. (2011). Multiple effects of changes in arctic snow cover. AMBIO 40, 32–45.
Chávez, R. O., Christie, D. A., Olea, M., and Anderson, T. G. (2019a). A Multiscale productivity assessment of high andean peatlands across the chilean altiplano using 31 years of landsat imagery. Remote Sens. 11:2955. doi: 10.3390/rs11242955
Chávez, R. O., Estay, S. A., and Riquelme, C. G. (2017). npphen. An R Package for Estimating Annual Phenological Cycle. R Package Version 1.1-0. Available online at: https://CRAN.R-project.org/package=npphen (accessed August 31, 2017).
Chávez, R. O., Moreira-Muñoz, A., Galleguillos, M., Olea, M., Aguayo, J., Latín, A., et al. (2019b). GIMMS NDVI time series reveal the extent, duration, and intensity of “blooming desert” events in the hyper-arid Atacama desert, Northern chile. Int. J. Appl. Earth Obs. Geoinf. 76, 193–203. doi: 10.1016/j.jag.2018.11.013
Chávez, R. O., Rocco, R., Gutiérrez, ÁG., Dörner, M., and Estay, S. A. (2019c). A self-calibrated non-parametric time series analysis approach for assessing insect defoliation of broad-leaved deciduous Nothofagus pumilio forests. Remote Sens. 11:204. doi: 10.3390/rs11020204
Choi, G., Robinson, D. A., and Kang, S. (2010). Changing northern hemisphere snow seasons. J. Clim. 23, 5305–5310. doi: 10.1175/2010jcli3644.1
Decuyper, M., Chávez, R. O., Èufar, K., Estay, S. A., Clevers, J. G. P. W., Prislan, P., et al. (2020). Spatio-temporal assessment of beech growth in relation to climate extremes in Slovenia – An integrated approach using remote sensing and tree-ring data. Agric. For. Meteorol. 287:107925. doi: 10.1016/j.agrformet.2020.107925
Dozier, J. (1984). Snow reflectance from LANDSAT-4 thematic mapper. IEEE Trans. Geosci. Remote Sens. 22, 323–328. doi: 10.1109/tgrs.1984.350628
Durán-Alarcón, C., Gevaert, C. M., Mattar, C., Jiménez-Muñoz, J. C., Pasapera-Gonzales, J. J., Sobrino, J. A., et al. (2015). Recent trends on glacier area retreat over the group of Nevados Caullaraju-Pastoruri (Cordillera Blanca, Peru) using landsat imagery. J. South Am. Earth Sci. 59, 19–26. doi: 10.1016/j.jsames.2015.01.006
Elliott, G. P., and Petruccelli, C. A. (2018). “Tree recruitment at the treeline across the continental divide in the Northern Rocky Mountains, USA: the role of spring snow and autumn climate. Plant Ecol. Divers. 11, 319–333. doi: 10.1080/17550874.2018.1487475
Galen, C., and Stanton, M. L. (1993). Short-term responses of alpine buttercups to experimental manipulations of growing season length. Ecology 74, 1052–1058. doi: 10.2307/1940475
Gan, T. Y., Barry, R. G., Gizaw, M., Gobena, A., and Balaji, R. (2013). Changes in North American snowpacks for 1979–2007 detected from the snow water equivalent data of SMMR and SSM/I passive microwave and related climatic factors. J. Geophys. Res. Atmos. 118, 7682–7697. doi: 10.1002/jgrd.50507
Gerdol, R., Siffi, C., Iacumin, P., Gualmini, M., and Tomaselli, M. (2013). Advanced snowmelt affects vegetative growth and sexual reproduction of Vaccinium myrtillus in a sub-alpine heath. J. Veg. Sci. 24, 569–579. doi: 10.1111/j.1654-1103.2012.01472.x
Gorelick, N., Hancher, M., Dixon, M., Ilyushchenko, S., Thau, D., and Moore, R. (2017). Google earth engine: planetary-scale geospatial analysis for everyone. Remote Sens. Environ. 202, 18–27. doi: 10.1016/j.rse.2017.06.031
Hagedorn, F., Shiyatov, S. G., Mazepa, V. S., Devi, N. M., Grigor’ev, A. A., Bartysh, A. A., et al. (2014). Treeline advances along the urals mountain range–driven by improved winter conditions? Glob. Change Biol. 20, 3530–3543. doi: 10.1111/gcb.12613
Hall, D. K., and Riggs, G. A. (2007). Accuracy assessment of the MODIS snow products. Hydrol. Processes 21, 1534–1547. doi: 10.1002/hyp.6715
Härer, S., Bernhardt, M., Siebers, M., and Schulz, K. (2018). On the need for a time- and location-dependent estimation of the NDSI threshold value for reducing existing uncertainties in snow cover maps at different scales. Cryosphere 12, 1629–1642. doi: 10.5194/tc-12-1629-2018
Hijmans, R. J. (2019). raster: Geographic Data Analysis and Modeling. R package version 2.9-23. Available online at: https://CRAN.R-project.org/package=raster (accessed June 18, 2021).
Hosmer, D. W. Jr., Lemeshow, S., and Sturdivant, R. X. (2013). Applied Logistic Regression, Vol. 398. Hoboken, NJ: John Wiley & Sons.
Inouye, D. W. (2008). Effects of climte change on phenology, frost damage and floral abundance of montane wildflowers. Ecology 82, 353–362. doi: 10.1890/06-2128.1
IPCC. (2021). “Summary for policymakers,” in Climate Change 2021: The Physical Science Basis. Contribution of Working Group I to the Sixth Assessment Report of the Intergovernmental Panel on Climate Change, eds V. Masson-Delmotte, P. Zhai, A. Pirani, S. L. Connors, C. Péan, S. Berger, et al. (Cambridge: Cambridge University Press).
Kohler, T., and Maselli, D. (2009). Mountains and Climate Change- From Understanding to Action. Bern: Centre for Development and Environment (CDE).
Lambert, A. M., Miller-Rushing, A. J., and Inouye, D. W. (2010). Changes in snowmelt date and summer precipitation affect the flowering phenology of Erythronium grandiflorum (glacier lily; Liliaceae). Am. J. Bot. 97, 1431–1437. doi: 10.3732/ajb.1000095
Lenoir, J., Gégout, J. C., Marquet, P. A., De Ruffray, P., and Brisse, H. (2008). A significant upward shift in plant species optimum elevation during the 20th century. Science 320, 1768–1771. doi: 10.1126/science.1156831
Lhermitte, S., Abermann, J., and Kinnard, C. (2014). Albedo over rough snow and ice surfaces. Cryosphere 8, 1069–1086. doi: 10.5194/tc-8-1069-2014
Liu, X., and Chen, B. (2000). Climatic warming in the Tibetan Plateau during recent decades. Int. J. Climatol. 20, 1729–1742. doi: 10.1002/1097-0088(20001130)20:14<1729::aid-joc556>3.0.co;2-y
Livensperger, C., Steltzer, H., Darrouzet-Nardi, A., Sullivan, P. F., Wallenstein, M., and Weintraub, M. N. (2016). Earlier snowmelt and warming lead to earlier but not necessarily more plant growth. AoB Plants 8:lw021.
López-Moreno, J. I., Gascoin, S., Herrero, J., Sproles, E. A., Pons, M., Alonso-González, E., et al. (2017). Different sensitivities of snowpacks to warming in Mediterranean climate mountain areas. Environ. Res. Lett. 12:074006. doi: 10.1088/1748-9326/aa70cb
Macander, M. J., Swingley, C. S., Joly, K., and Raynolds, M. K. (2015). Landsat-based snow persistence map for northwest Alaska. Remote Sens. Environ. 163, 23–31. doi: 10.1016/j.rse.2015.02.028
Malmros, J. K., Mernild, S. H., Wilson, R., Tagesson, T., and Fensholt, R. (2018). Snow cover and snow albedo changes in the central Andes of chile and Argentina from daily MODIS observations (2000–2016). Remote Sens. Environ. 209, 240–252. doi: 10.1016/j.rse.2018.02.072
Masiokas, M. H., Rabatel, A., Rivera, A., Ruiz, L., Pitte, P., Ceballos, J. L., et al. (2020). A review of the current state and recent changes of the Andean Cryosphere. Front. Earth Sci. 8:99. doi: 10.3389/feart.2020.00099
Masiokas, M. H., Villalba, R., Christie, D. A., Betman, E., Luckman, B. H., Le Quesne, C. et al. (2012). Snowpack variations since AD 1150 in the Andes of Chile and Argentina (30°–37°S) inferred from rainfall, tree-ring and documentary records. J. Geophys. Res. Atmos. 117:D05112. doi: 10.1029/2011JD016748
Masiokas, M. H., Villalba, R., Luckman, B. H., Quesne, C. L., and Aravena, J. C. (2006). Snowpack variations in the central Andes of Argentina and Chile, 1951–2005: large-scale atmospheric influences and implications for water resources in the region. J. Clim. 19, 6334–6352. doi: 10.1175/jcli3969.1
Migliavacca, F., Confortola, G., Soncini, A., Senese, A., Diolaiuti, G. A., Smiraglia, C., et al. (2015). Hydrology and potential climate changes in the Rio Maipo (Chile). Geogr. Fis. e Din. Quat. 38, 155–168.
Molau, U. (1993). Relationships between flowering phenology and life history strategies in Tundra Plants. Arct. Alp. Res. 25, 391–402. doi: 10.2307/1551922
Moreno, H., and Lara, L. (2007). Geología Del Complejo Volcánico Mocho-Choshuenco, Región de LOS Ríos. Carta Geológica de Chile, Serie Geología Básica, (107), Vol. 27. Santiago de Chile: Ediciones del Servicio Nacional de Geología y Minería.
Mote, P. W., Li, S., Lettenmaier, D. P., Xiao, M., and Engel, R. (2018). Dramatic declines in snowpack in the western US. NPJ Clim. Atmos. Sci. 1:2.
Notarnicola, C. (2020). Hotspots of snow cover changes in global mountain regions over 2000–2018. Remote Sens. Environ. 243:111781. doi: 10.1016/j.rse.2020.111781
Pauli, J. N., Zuckerberg, B., Whiteman, J. P., and Porter, W. (2013). The subnivium: a deteriorating seasonal refugium. Front. Ecol. Environ. 11:260–267. doi: 10.1890/120222
R Core Team. (2020). R: A Language and Environment for Statistical Computing. Vienna: R Foundation for Statistical Computing.
Rawson, H., Naranjo, J. A., Smith, V. C., Fontijn, K., Pyle, D. M., Mather, T. A., et al. (2015). The frequency and magnitude of post-glacial explosive eruptions at Volcán Mocho-Choshuenco, southern Chile. J. Volcanol. Geotherm. Res. 299, 103–129. doi: 10.1016/j.jvolgeores.2015.04.003
Rawson, H., Pyle, D. M., Mather, T. A., Smith, V. C., Fontijn, K., Lachowycz, S. M., et al. (2016). The magmatic and eruptive response of arc volcanoes to deglaciation: insights from southern Chile. Geology 44, 251–254. doi: 10.1130/g37504.1
Roland, J., Filazzola, A., and Matter, S. F. (2021). Spatial variation in early-winter snow cover determines local dynamics in a network of alpine butterfly populations. Ecography 44, 334–343. doi: 10.1111/ecog.05407
Saavedra, F. A., Kampf, S. K., Fassnacht, S. R., and Sibold, J. S. (2017). A snow climatology of the Andes Mountains from MODIS snow cover data. Int. J. Climatol. 37, 1526–1539. doi: 10.1002/joc.4795
Saavedra, F. A., Kampf, S. K., Fassnacht, S. R., and Sibold, J. S. (2018). Changes in Andes snow cover from MODIS data, 2000–2016. Cryosphere 12, 1027–1046. doi: 10.5194/tc-12-1027-2018
Sankey, T., Donald, J., McVay, J., Ashley, M., O’Donnell, F., Lopez, S. M., et al. (2015). Multi-scale analysis of snow dynamics at the southern margin of the North American continental snow distribution. Remote Sens. Environ. 169, 307–319. doi: 10.1016/j.rse.2015.08.028
Slatyer, R. A., Umbers, K. D. L., and Arnold, P. A. (2021). Ecological responses to variation in seasonal snow cover. Conserv. Biol. doi: 10.1111/cobi.13727 [Epub ahead of print].
Soncini-Sessa, R., and Volta, M. (2005). One-year-long runoff forecast by a single snowpack evaluation. Hydrol. Process. 19, 1419–1430. doi: 10.1002/hyp.5580
Steger, C., Kotlarski, S., Jonas, T., and Schär, C. (2013). Alpine snow cover in a changing climate: a regional climate model perspective. Clim. Dyn. 41, 735–754. doi: 10.1007/s00382-012-1545-3
Teillier, S., Macaya-Berti, J., Bonnemaison, C., and Marticorena, A. (2012). Contribución al conocimiento de la flora vascular de la Reserva Biológica Huilo Huilo, Región de Los Ríos, Chile. Gayana. Bot. 70, 195–235. doi: 10.4067/s0717-66432013000200003
Vaughan, D. G., Comiso, J., Allison, I., Carrasco, J., Kaser, G., Kwok, R., et al. (2013). Observations: Cryosphere. Climate change 2013: The Physical Science Basis. Contribution of Working Group I to the Fifth Assessment Report of the Intergovernmental Panel on Climate Change. Cambridge: Cambridge University Press.
Walther, G.-R., Post, E., Convey, P., Menzel, A., Parmesan, C., Beebee, T. J. C., et al. (2002). Ecological responses to recent climate change. Nature 416, 389–395.
Wang, X., Wu, C., Wang, H., Gonsamo, A., and Liu, Z. (2017). No evidence of widespread decline of snow cover on the Tibetan Plateau over 2000–2015. Sci. Rep. 7:14645.
Wheeler, J. A., Hoch, G., Cortés, A. J., Sedlacek, J., Wipf, S., and Rixen, C. (2014). Increased spring freezing vulnerability for alpine shrubs under early snowmelt. Oecologia 175, 1–11.
Wipf, S., Stoeckli, V., and Bebi, P. (2009). Winter climate change in alpine tundra: plant responses to changes in snow depth and snowmelt timing. Clim. Change 94, 105–121. doi: 10.1007/s10584-009-9546-x
Zhang, H., Zhang, F., Zhang, G., Che, T., Yan, W., Ye, M., et al. (2019). Ground-based evaluation of MODIS snow cover product V6 across China: implications for the selection of NDSI threshold. Sci. Total Environ. 651, 2712–2726. doi: 10.1016/j.scitotenv.2018.10.128
Keywords: Andes (South America), remote sensing, global warming, alpine plants, npphen
Citation: Chávez RO, Briceño VF, Lastra JA, Harris-Pascal D and Estay SA (2021) Snow Cover and Snow Persistence Changes in the Mocho-Choshuenco Volcano (Southern Chile) Derived From 35 Years of Landsat Satellite Images. Front. Ecol. Evol. 9:643850. doi: 10.3389/fevo.2021.643850
Received: 18 December 2020; Accepted: 19 August 2021;
Published: 16 September 2021.
Edited by:
Jairo Patiño, University of La Laguna, SpainReviewed by:
María J. Polo, University of Córdoba, SpainSimon Gascoin, UMR 5126 Centre d’Études Spatiales de la Biosphère (CESBIO), France
Copyright © 2021 Chávez, Briceño, Lastra, Harris-Pascal and Estay. This is an open-access article distributed under the terms of the Creative Commons Attribution License (CC BY). The use, distribution or reproduction in other forums is permitted, provided the original author(s) and the copyright owner(s) are credited and that the original publication in this journal is cited, in accordance with accepted academic practice. No use, distribution or reproduction is permitted which does not comply with these terms.
*Correspondence: Roberto O. Chávez, cm9iZXJ0by5jaGF2ZXpAcHVjdi5jbA==