 Athanasios S. Kallimanis*
 Maria Lazarina
 Mariana A. Tsianou
 Aristi Andrikou-Charitidou
 Stefanos Sgardelis
- Department of Ecology, Aristotle University of Thessaloniki, Thessaloniki, Greece
Phylogenetic diversity aims to quantify the evolutionary relatedness among the species comprising a community, using the phylogenetic tree as the metric of the evolutionary relationships. Could these measures unveil the evolutionary history of an area? For example, in a speciation hotspot (biodiversity cradle), we intuitively expect that the species in the community will be more phylogenetically clustered than randomly expected. Here, using a theoretical simulation model, we estimate the ability of phylogenetic metrics of current diversity to detect speciation history. We found that, in the absence of dispersal, if the incipient species do not coexist in the region of speciation (as expected under allopatric speciation), there was no clear phylogenetic clustering and phylogenetic diversity failed to detect speciation history. But if the incipient species coexisted (sympatric speciation), metrics such as standardized effect size of Faith’s Phylogenetic Diversity (PD) and of Mean Nearest Taxon Distance (MNTD) were able to identify areas of high speciation, while Mean Pairwise Distance (MPD) was a poor indicator. PD systematically outperformed MNTD. Dispersal was a game-changer. It allowed species to expand their range, colonize areas, and led to the coexistence of the incipient species originating from a common ancestor. If speciation gradient was spatially contiguous, dispersal strengthened the associations between phylogenetic clustering and speciation history. In the case of spatially random speciation, dispersal blurred the signal with phylogenetic clustering occurring in areas of low or no speciation. Our results imply that phylogenetic clustering is an indicator of speciation history only under certain conditions.
Introduction
Phylogenetic diversity is a facet of biodiversity that is worthy of investigation as it incorporates evolutionary history in community analyses (Webb, 2000; Mazel et al., 2016). Phylogenetic diversity of natural communities has been used to illuminate the processes governing the assembly and coexistence of species in ecological communities (Webb, 2000; Hardy and Senterre, 2007) based on the debated assumption that phylogenetic relatedness reflects ecological similarity (Tucker et al., 2018). Phylogenetic diversity has been used as a tool in the selection of conservation targets and designation of protected areas since the 1990s (Faith, 1992; Mazel et al., 2017). This led to the development of spatial phylogenetics, with a line of research focusing on identifying centers of endemism and distinguishing between neo- and paleo-endemism (Mishler et al., 2014; Kougioumoutzis et al., 2021). This approach led to the use of phylogenetic diversity measures to infer biodiversity cradles (areas where species diversify into new species often neo-endemics) and museums (areas where species persist over a long-term evolutionary time) (Dagallier et al., 2020). Despite the intuitive appeal of this approach, the reliability of current phylogenetic diversity data to identify such historic signal of speciation in areas has received limited attention, with studies focusing mainly on the structure of phylogenetic tree (Mazel et al., 2016; Eme et al., 2020), while the factors that affect the efficiency of this surrogacy have not received critical evaluation.
Here, we aim to test if current phylogenetic diversity can detect speciation history of a region. In simpler terms, is there an association between phylogenetic clustering of the present and a community’s history of speciation events? Speciation is difficult (if not impossible) to be examined empirically, since it occurs over evolutionary time frames and many other variables impact the phenomenon in complex ways. Therefore, we developed a theoretical simulation model to test if there is a relationship between phylogenetic diversity indices and history of speciation events, and if so to quantify the relative efficiency of different phylogenetic diversity indices (reflecting either the total phylogenetic history of the area or the species evolutionary pairwise distance). Since phylogenetic diversity and species richness are closely linked, we examined not the indices per se but their Standardized Effect Sizes, i.e., their deviation from random expectations given the species richness, indicating phylogenetic clustering. We simulated speciation, local extinction and dispersal in a theoretical model, to assess how different processes (like dispersal and local extinctions) affect the ability of phylogenetic diversity to detect speciation history. Our study focused on how these processes shape the spatial patterns of phylogenetic diversity.
Methods
The Model
We developed a simple theoretical model simulating the processes of speciation, local extinctions, and dispersal to explore the relationship between speciation and phylogenetic diversity after 300 time steps. The model was employed to a hypothetical one-dimensional landscape, consisting of 90 cells. Cells were divided into three groups with different speciation rate reflecting a “gradient speciation landscape”: (i) high speciation rate (first 30 cells), where two speciation events occurred in one randomly selected cell per time step, i.e., 20 events per cell after 300 time steps on average, (ii) low speciation rate (next 30 cells), where one speciation events occurred in a randomly selected cell, i.e., 10 events per cell after 300 time steps on average, and (iii) no speciation (last 30 cells). Speciation was spatially autocorrelated. Note that due to stochasticity, the number of speciation events varied among the cells of each group. In this landscape, we ran different sets of simulations by varying initial local species richness, size of the initial species pool, local extinction rate, and dispersal. For simplicity, we examined each variable independently keeping the values of the remaining variables fixed (50 repetitions per set). We also examined the case of “random speciation hotspots” where we had 30 cells of high speciation, 30 cells of low speciation and 30 cells of no speciation, but the spatial arrangements of these cells were random, i.e., the speciation level of a cell provided no information about the speciation level of its neighbors.
In the first step, we generated a random coalescent phylogenetic tree, using rcoal function of package ape (Paradis, 2012). Pilot studies showed that using different models for generating random phylogenetic trees influenced our results quantitatively but not qualitatively, possibly because our analysis did not focus on the structure of the phylogenetic tree but on the spatial patterns of phylogenetic diversity (Supplementary Material). From the initial tree we estimated the minimum branch length, and at each time step we added one fifth of this length to the branch length of all tips of our tree. All the species in the initial tree defined as the original species pool were randomly assigned to cells (local species richness), considering that all species were represented with equal probability and all cells were equally probable to host a species. In the simulations exploring the effect of the species pool size, total species richness ranged from 100 up to 1,600 species, and when fixed, the value was set to 400 species. The initial local species richness was a fraction of the original species pool and ranged between 20 and 200 species (default value = 40). All cells started off with similar number of species, and similar levels of phylogenetic diversity. Each species consisted of a number of local populations (i.e., the species presence in the different cells). All processes were simulated to operate at the local scale, i.e., speciation, extinction and dispersal affected these local populations.
The focus of our simulation is the spatial patterns of speciation and how they are reflected in the spatial patterns of phylogenetic diversity. Following the generation of the phylogenetic tree and assembly of local communities of similar levels of phylogenetic and taxonomic diversity, we simulated random speciation events by selecting one of the species in a cell and adding a new tip in the existing one of the tree with the bind.tip function of package phytools (Revell, 2012). The probability of each species in the cell to be selected was equal. In other words, as the local species richness increases the probability for a given species to undergo speciation decreases. These events occurred in a cell, but the tree was the same for all cells. Based on the classic definition, allopatric speciation corresponds to the isolation of two initial populations belonging to the same ancestral species, given that isolation is long enough to ensure reproductive isolation, results in the emergence of two new incipient species with disjunct distributions (Mayr, 1942; Gavrilets, 2003; Harrison, 2012). In our simulations, we considered as the “allopatric” speciation mode the case where isolation of a local population in one cell led to a speciation event where one of the incipient species was found in that cell while the other incipient species was found only outside that cell. The “allopatric” mode of speciation can occur effectively, only when the ancestral species occurred in at least two distinct cells. Sympatric speciation is “speciation without geographic isolation” (Mayr, 1942). Here, we considered as “sympatric” speciation mode the case when both new incipient species occurred in the cell where the speciation event took place, with the one incipient species occurring only there and the other occurring throughout the ancestral species’ extent.
Local extinction was defined as the probability of a local population to go extinct, i.e., the presence of the species in other cells was not affected by the local extinction event. At each time step, all local populations faced the same probability of extinction. Therefore, species present in many cells had lower probability to go extinct from the entire landscape than species present in only few cells. We simulated a range of local extinction probability values from 0.05% up to 1% (default value = 0.1%).
Similarly, dispersal was simulated as a local scale phenomenon. At each time step, each local population may disperse to one of its adjacent cells with a probability that was equal for all species and set at 5%. We tested other dispersal rates (5, 10, 15, and 20% probability that a local population will disperse to an adjacent cell), but the results were only regarding the role of the spatial pattern of speciation hotspots (i.e., “gradient speciation landscape” vs “random speciation hotspots”). Given that our hypothetical landscape is a torus, there was no effect of the margins. Dispersal probability equal to zero represented the case of no dispersal, in which at least one of the new incipient species was local endemic of the region where they appeared.
After 300 time steps, we pruned the phylogenetic tree to remove the extinct from the landscape species, and for each cell we estimated three phylogenetic diversity indices quantifying different facets of phylogenetic diversity: Faith’s (1992) phylogenetic diversity metric (PD), mean pairwise distance (MPD), and mean nearest taxon distance (MNTD). Faith’s (1992) PD reflects the cumulative evolutionary history of all species in a community, and was calculated as the sum of the branch lengths of a phylogenetic tree connecting species of each cell. MPD is a divergence index defined as the mean pairwise phylogenetic distance of all species of each cell (Webb, 2000). The MNTD quantifies the phylogenetic distance to the nearest relative of each species in the community (Webb, 2000). Given that the phylogenetic diversity indices are correlated to species richness (Tucker et al., 2018), we estimated the Standardized Effect Size (SES) of all indices using the null model taxa.labels that shuffles the location of each species in the phylogenetic tree retaining the community structure (199 runs). In our null models, if a certain species was not present at any cell at time step 300, it was removed from the phylogenetic tree and the relevant branch lengths were not used to compute the Standardized Effect Sizes. The calculations were performed with the picante package (Kembel et al., 2010).
Analysis
We evaluated the ability of phylogenetic diversity indices at time step 300 to reflect the speciation history by exploring the relationship between the SES of phylogenetic indices and the number of the speciation events that occurred in each cell with linear model analysis. The species richness in each cell is the product of speciation, extinction and dispersal, but we were interested in quantifying the ability of the index to detect speciation history of each cell. The indices’ efficiency was quantified by the goodness of fit of the linear model coefficient of determination (R2). We considered that the index did not detect speciation events in the case of non-significant relationship. To estimate the importance of the different factors in shaping the efficiency of each index we used linear regression with the index efficiency as dependent variable and the value of the different factors as independent when all other factors were fixed to their default values.
Results
In the absence of dispersal, the standardized effect sizes of phylogenetic diversity indices PD and MNTD detected the speciation hotspots when speciation was simulated as “sympatric” (Figure 1; for PD p < 0.0001, R2 = 0.67; for MNTD p < 0.0001, R2 = 0.57; and for MPD p = 0.18, R2 < 0.01), while they failed to detect the speciation signal in the case of “allopatric” speciation (Figure 2 left column). Among the three indices analyzed, the SES of PD systematically outperformed the SES of MNTD, whereas SES of MPD was weaker and tended to give insignificant associations. Therefore, we will focus our results on the SES of PD and of MNTD.
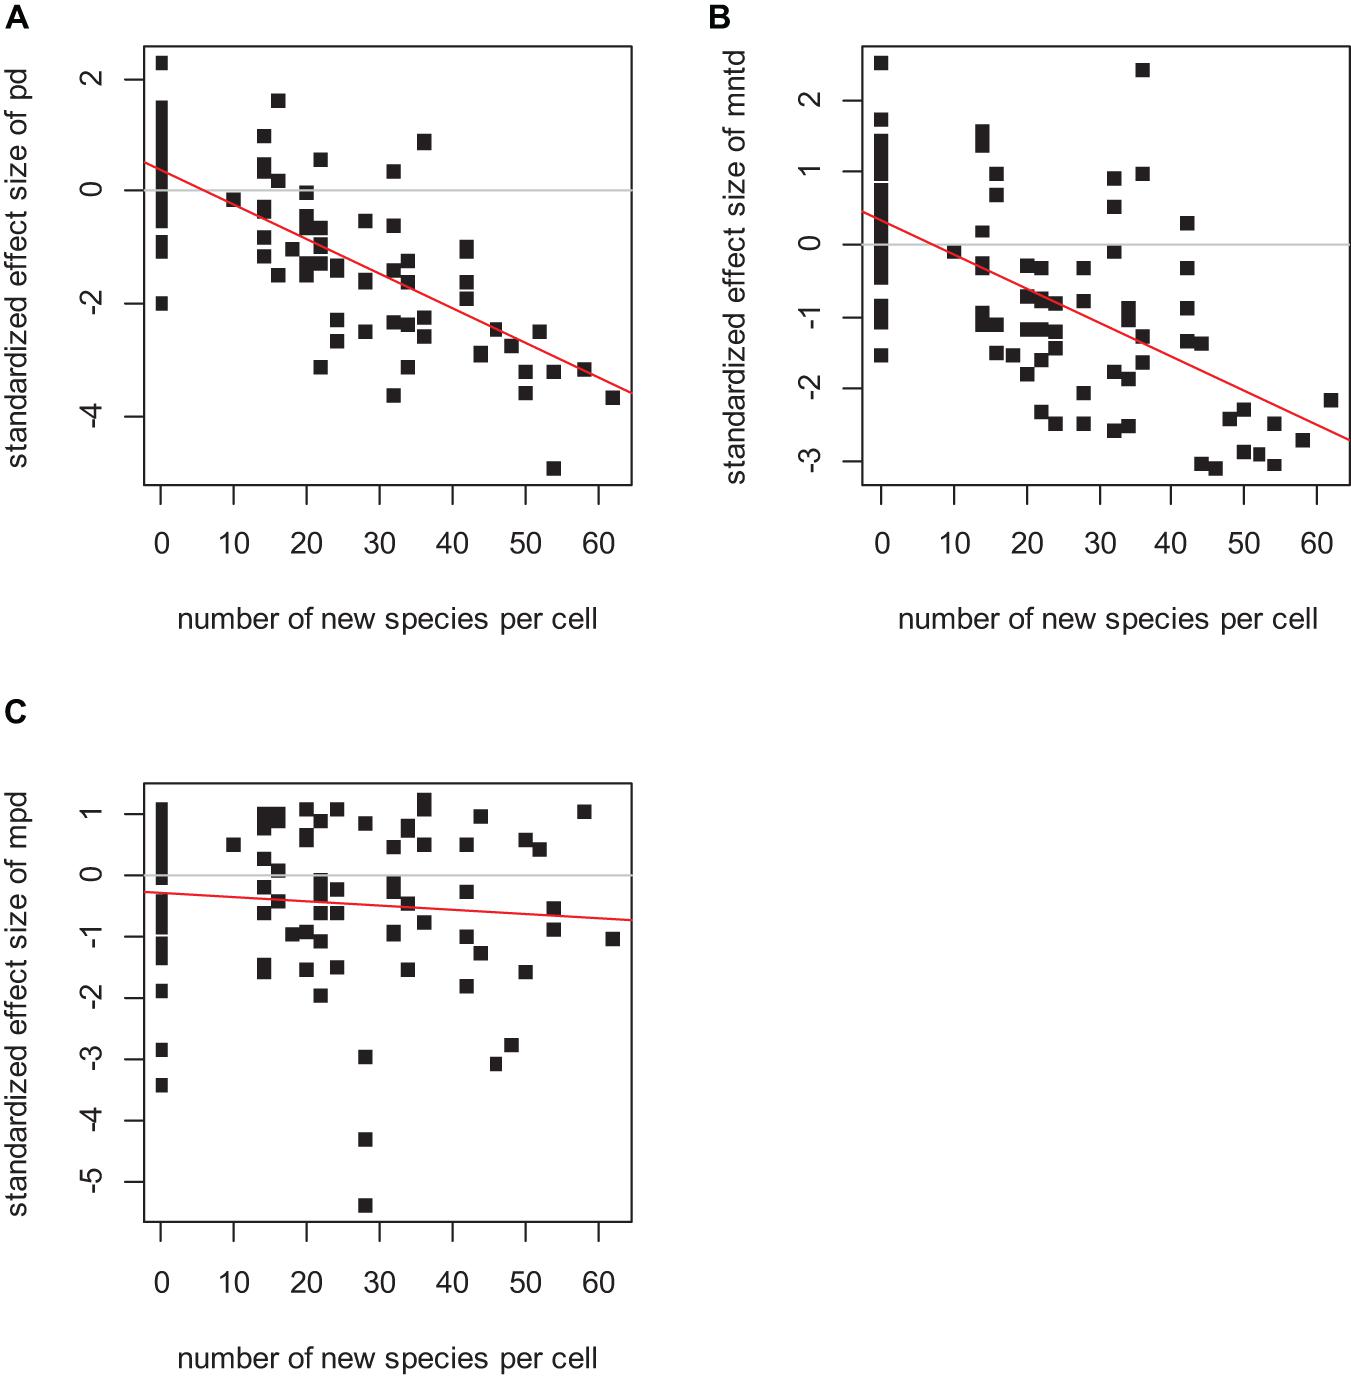
Figure 1. The relationship between the standardized effect size of PD (A), MNTD (B), and MPD (C) and the number of speciation events per cell. The linear regression was significant in the case of the standardized effect size of PD (p < 0.0001, R2 = 0.67), and of MNTD (p < 0.0001, R2 = 0.57), but not significant in the case of MPD (p = 0.18, R2 < 0.01). Initial species pool 400 species, initial local species richness 40 species, local population extinction probability 0.1%, no dispersal and sympatric speciation mode.
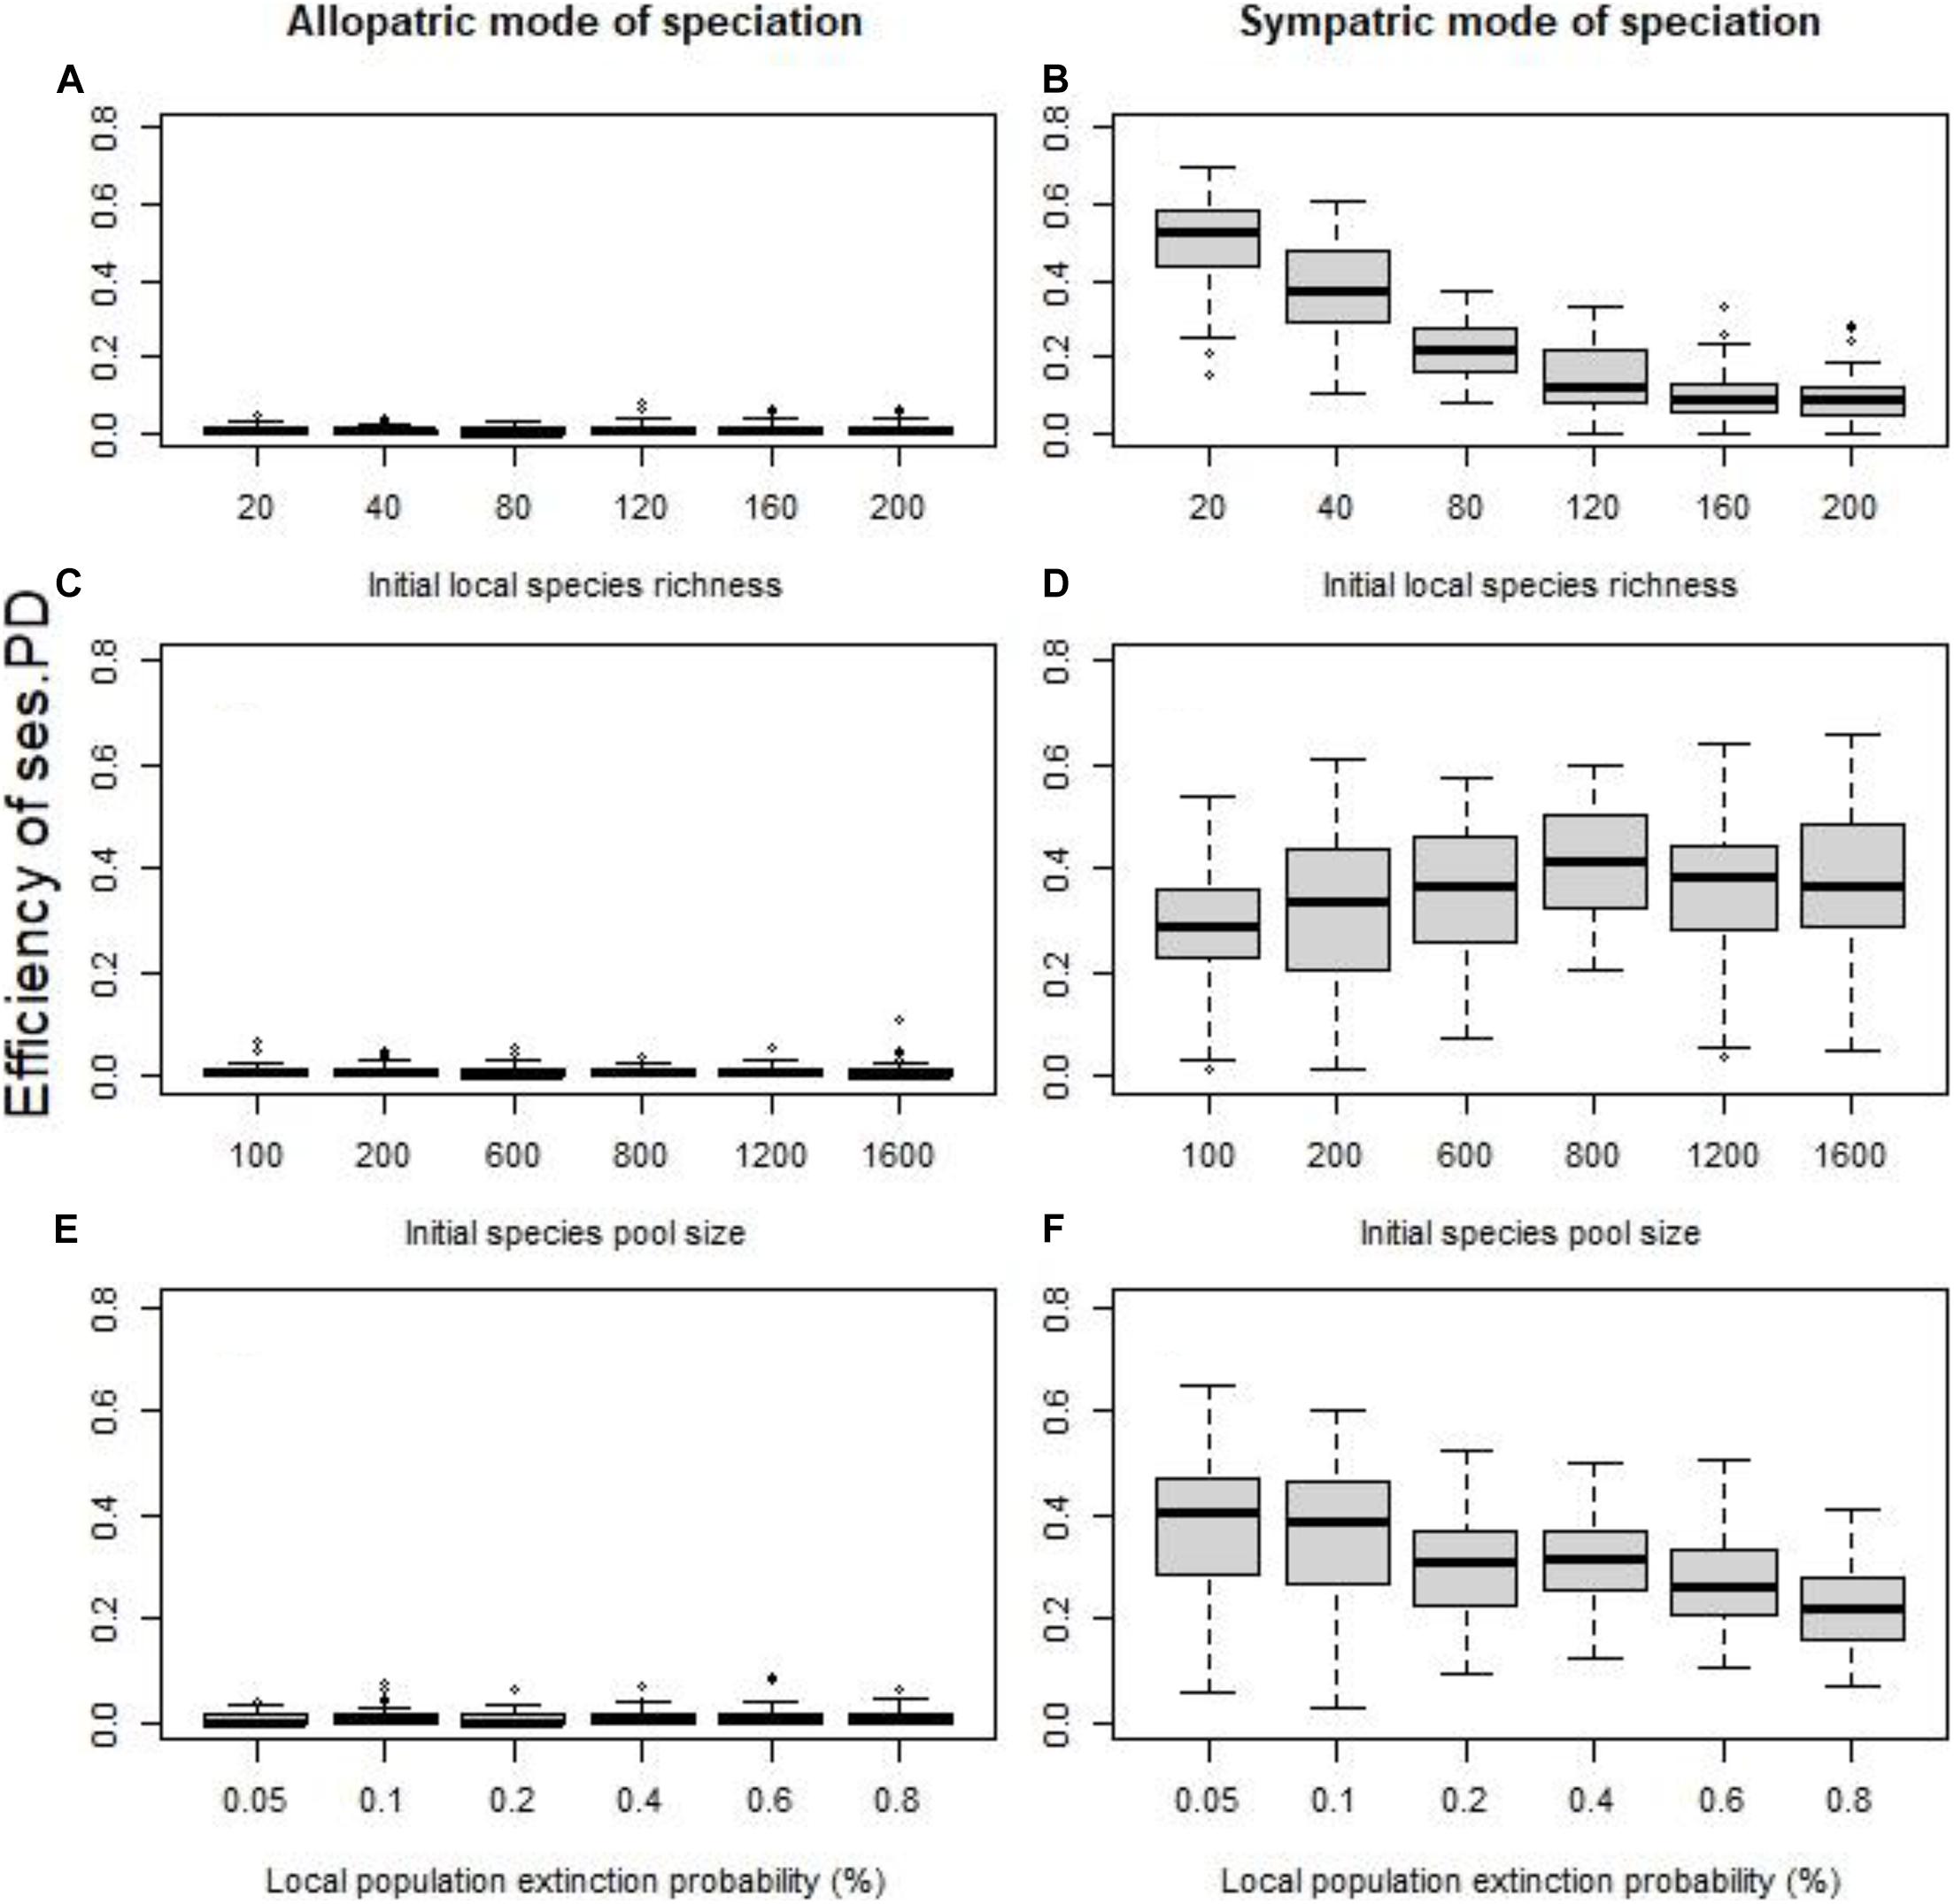
Figure 2. Without dispersal, the effect of the initial local species richness for fixed species pool (A,B), the size of the initial species pool for fixed species richness per cell (C,D), and the probability of local extinctions (E,F) on the efficiency of the standardized effect size of PD as indicator of speciation history (quantified using the coefficient of determination R2). The allopatric speciation mode results are in the left column, while the sympatric speciation mode results in the right column. To assess the role of each factor independently we kept all the other values fixed at their default values (initial local richness = 40 species, species pool size = 400 species, probability of local extinction = 0.1%.
In the absence of dispersal and the “sympatric” speciation mode, the initial local species richness (all else equal) had a conspicuous effect on the ability of phylogenetic clustering to detect speciation (for SES of PD Figure 2B, p < 0.0001, R2 = 0.62, for SES of MNTD p < 0.0001, R2 = 0.54). Given that the speciation rate (the number of speciation events) is fixed for each cell, regardless of the initial species richness of the cell, or the initial species pool size, the probability for a given species to undergo speciation is in fact decreasing for an increasing initial local species richness. On the other hand, the size of the initial species pool (all other factors fixed) did not greatly affect the efficiency of phylogenetic indices (for SES of PD Figure 2D, p = 0.0007, R2 = 0.03, for SES of MNTD p = 0.0041, R2 = 0.02), highlighting that the ratio of original species richness to speciation events matters. Perhaps, this is due to the simulation method of speciation process followed here, and using a proportional speciation rate (all species keep the same probability to speciate a given time) might lead to different results. Regarding local extinctions, given that local populations of all species had equal probability to go extinct, the effect of local extinctions on the ability of phylogenetic diversity indices to detect speciation history was significant but weak, with increased local extinction probability being associated with lower efficiency (for SES of PD Figure 2F, p < 0.0001, R2 = 0.17, for SES of MNTD p = 0.0013, R2 = 0.03).
Dispersal was a game-changer. With dispersal, the efficiency of phylogenetic clustering to detect speciation hotspots strengthened considerably (Figure 3) and the “allopatric” mode of speciation displayed as strong associations as the “sympatric” mode of speciation. The effect of initial local species richness (for “allopatric” mode of speciation: SES of PD Figure 3A, p = 0.0040, R2 = 0.04, for SES of MNTD p = 0.0002, R2 = 0.07; for “sympatric” mode of speciation: SES of PD Figure 3B, p = 0.55, R2 < 0.01, for SES of MNTD p = 0.0275, R2 = 0.02) and initial local species pool weakened (for “allopatric” mode of speciation: SES of PD Figure 3C, p = 0.0515, R2 = 0.01, for SES of MNTD p = 0.0004, R2 = 0.04; for “sympatric” mode of speciation: SES of PD Figure 3D, p = 0.55, R2 < 0.01, for SES of MNTD p < 0.0001, R2 = 0.07). The role of local populations extinction probability did not appear to alter compared to no dispersal, with increased extinctions being associated with lower efficiency (for “allopatric” mode of speciation: SES of PD Figure 3E, p < 0.0001, R2 = 0.05, for SES of MNTD p = 0.0003, R2 = 0.04; for “sympatric” mode of speciation: SES of PD Figure 3F, p < 0.0001, R2 < 0.10, for SES of MNTD p < 0.0001, R2 = 0.05).
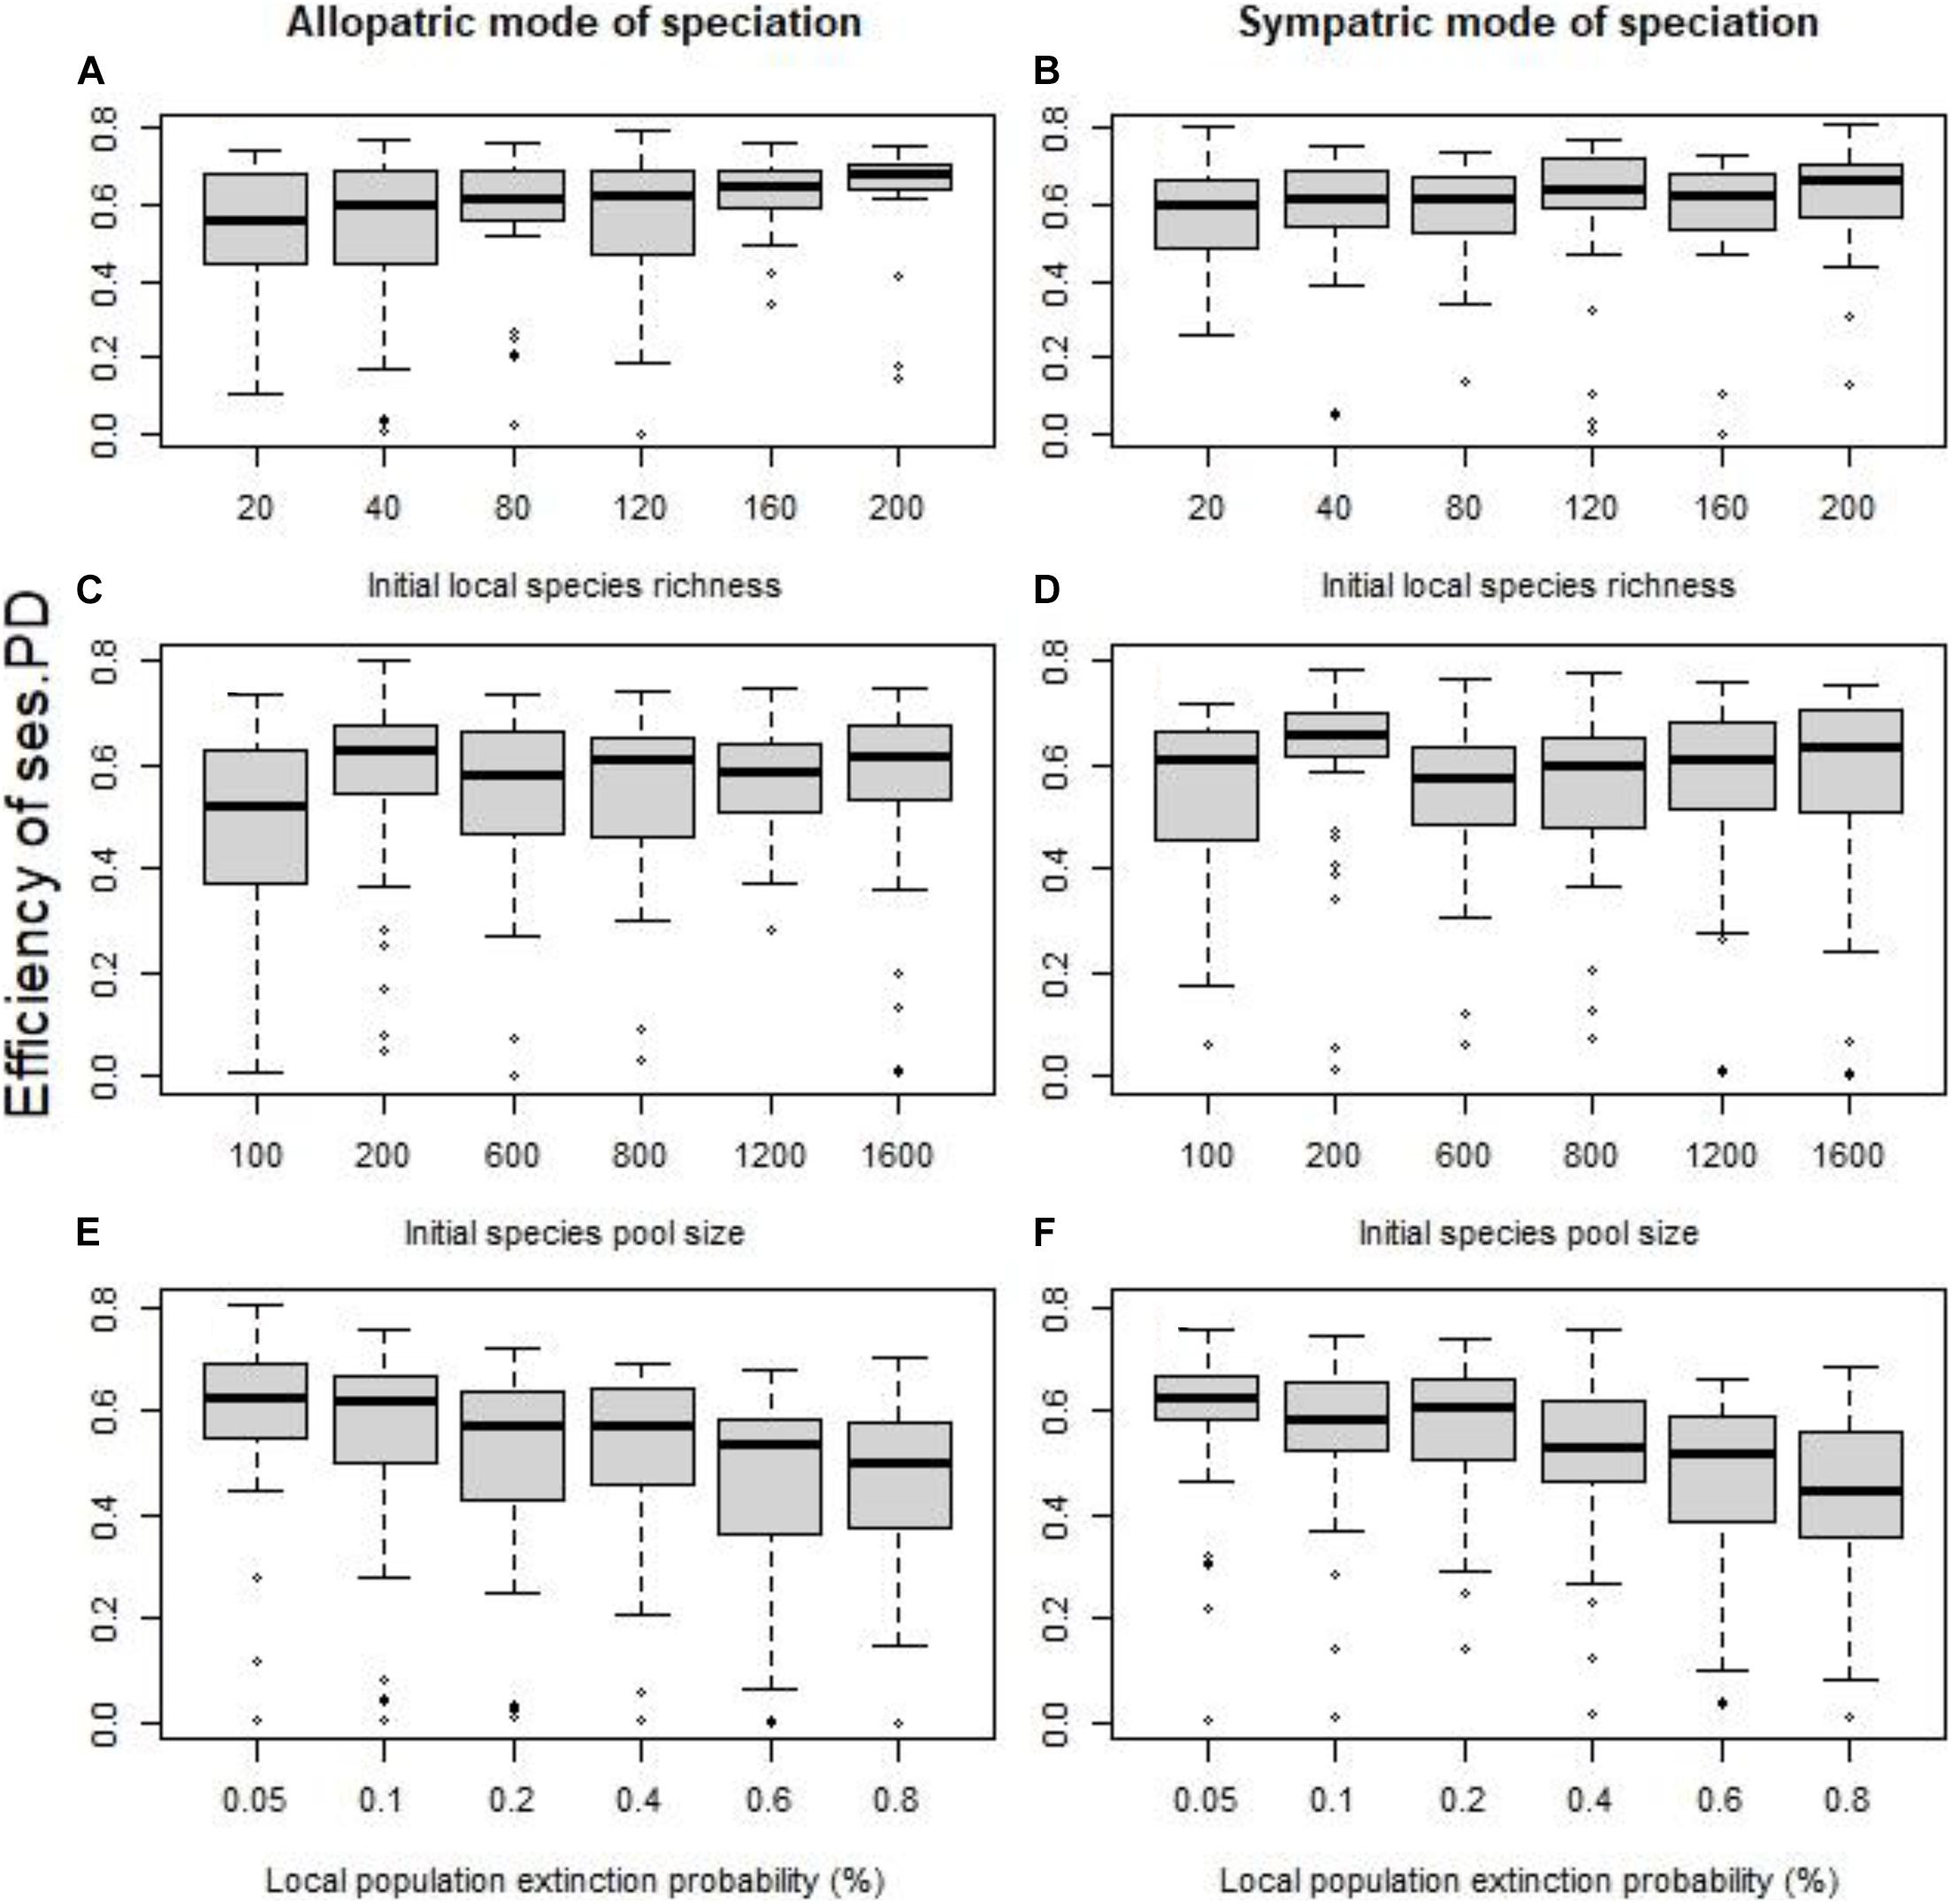
Figure 3. With a 5% probability of dispersal for each local population to its nearest neighbor cell, the effect of the initial local species richness for fixed species pool (A,B), the size of the initial species pool for fixed species richness per cell (C,D), and the probability of local extinctions (E,F) on the efficiency of the standardized effect size of PD as indicator of speciation history (quantified using the coefficient of determination R2). The allopatric speciation mode results are in the left column, while the sympatric speciation mode results in the right column. To assess the role of each factor independently we kept all the other values fixed at their default values (initial local richness = 40 species, species pool size = 400 species, probability of local extinction = 0.1%).
Dispersal plays an important role on whether phylogenetic clustering reflects speciation. Dispersal allows the two incipient species originating from the same ancestor to coexist. But dispersal could allow this coexistence to take place in areas where no speciation events occurred. So to elucidate the role of dispersal, we examined two cases when speciation hotspots were spatially contiguous, and there it became apparent that dispersal increased the effectiveness of phylogenetic clustering to detect speciation hotspots up to a point, in our case ∼5% (Figures 4A,C). But more illuminating is the case where speciation hotspots were randomly distributed across the landscape, where even low levels of dispersal meant that coexistence of related incipient species could occur in all areas irrespective of their speciation history, and thus phylogenetic clustering failed to detect the speciation history (Figures 4B,D).
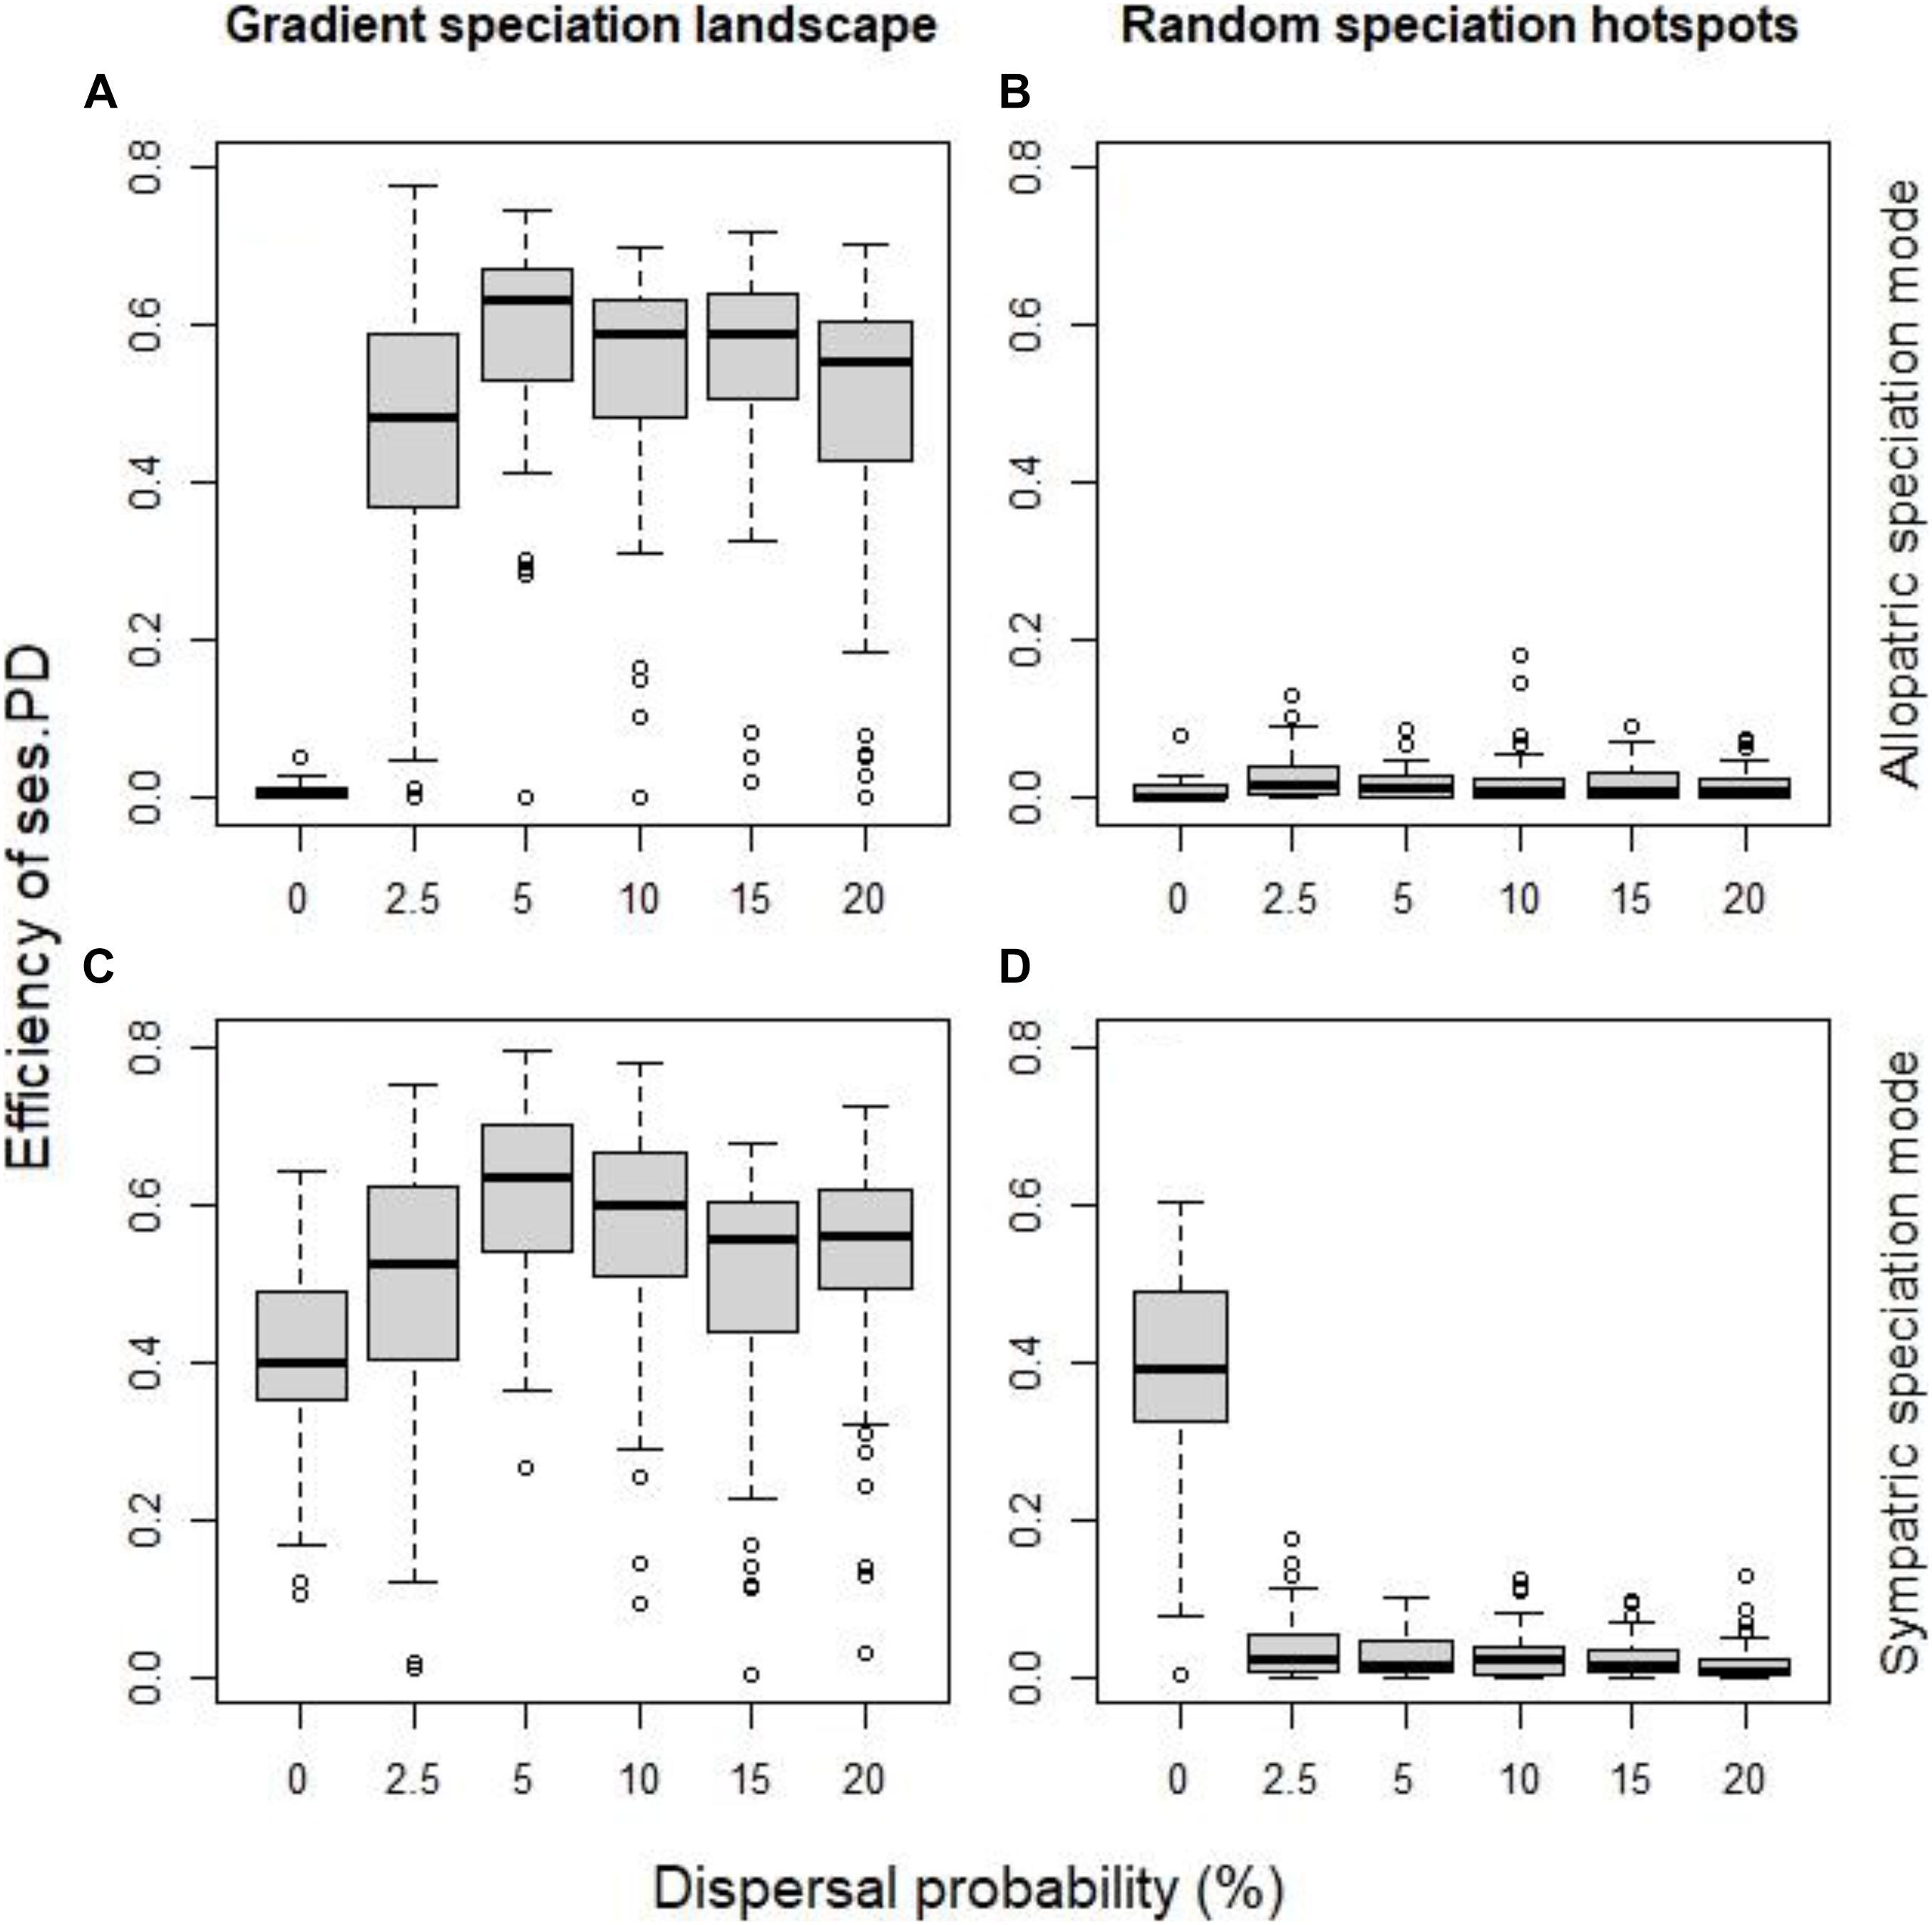
Figure 4. The effect of dispersal probability on the efficiency of the standardized effect size of PD as indicator of speciation history, for allopatric mode of speciation (A,B) and the sympatric mode (C,D), when speciation hotspots were spatially continuous (A,C) and when they were random (B,D). All other factor fixed at their default values (initial local richness = 40 species, species pool size = 400 species, probability of local extinction = 0.1%).
Discussion
Our simulations support the use of current phylogenetic clustering as indicator of a region’s speciation history, but only under specific conditions. The intuitive expectation that speciation events in an area may lead to declines in phylogenetic diversity (after accounting for the species richness, i.e., phylogenetic clustering) (Davies and Buckley, 2011) applies when both the incipient species coexist in the same region of high speciation and not elsewhere. This occurs in our model when speciation is sympatric and there is no dispersal, or when there is a spatially contiguous speciation gradient and local dispersal allows the introduction of the second incipient species in the region of the first incipient species and vice versa.
In allopatric speciation, geographical isolation of a species in a region leads to local differentiation that over sufficient evolutionary time results in reproductive isolation from the initial species and hence, the ancestral species leads to two new incipient species with disjunct distributions (Harrison, 2012). In this case, the two incipient species do not coexist in the same region (Wen et al., 2014). Therefore, the total phylogenetic diversity of the community is not significantly affected, and the phylogenetic diversity indices cannot detect the speciation gradient, unless the second incipient species is introduced in the region. On the other hand, the two incipient species coexist in the area in the sympatric speciation (Skeels and Cardillo, 2019). Thus, overall phylogenetic diversity of the area is significantly lower than random assemblages with the same species richness and SES of PD and MNTD phylogenetic diversity indices capture the speciation signal. The PD systematically (albeit slightly) outperformed MNTD in terms of efficiency, while MPD index weakly detected the speciation signal and was an unreliable indicator. This difference in efficiency may be due to MPD being more strongly influenced by the deep branching structure of the tree and thus by basal clustering rather than what happens in the tips of the phylogenetic tree, in contrast to PD and MNTD that are less sensitive to internal branching and therefore more sensitive to patterns occurring at the tips of the tree, like recent speciation events (Mazel et al., 2016).
In our model, extinction was simulated as a local phenomenon that did not differentiate between species and was spatially uniform (i.e., we did not include in our simulations extinction gradients or biodiversity museums). Spatially uniform extinction lowered the total species richness of each region and decreased the size of the total species pool, making deviations from random expectations more difficult to detect due to small numbers. So, the efficiency of phylogenetic diversity to detect speciation declined but the effect was not very strong.
In the absence of dispersal, the efficiency of phylogenetic clustering to detect speciation gradients becomes more pronounced as the ratio of speciation events to original species richness increases. It is this ratio, rather than the size of the total species pool throughout the landscape, that significantly affects the efficiency of phylogenetic indices. At the community level, if speciation events are few compared to the community’s total species richness, their contribution to phylogenetic diversity patterns is very small. Therefore, the standardized effect size of indices is closer to random expectations.
Dispersal plays an important role in this phenomenon changing the picture drastically. Dispersal provides a rescue effect to counteract local extinctions, as well as means for range expansion, thus nullifying the effect of initial species richness. In allopatric speciation, the new incipient species originating from the same ancestral species do not coexist, and thus they do not affect phylogenetic clustering. But even moderate levels of dispersal, will allow the introduction of the absent incipient species in the speciation hotspot leading to phylogenetic clustering. But simultaneously, dispersal will allow the incipient species to expand their range and colonize new areas. This reinforces the possibility that the incipient species originating from the same ancestral species will coexist in areas with no speciation, and thus phylogenetic clustering may be observed in areas of low or no speciation. This renders the role of spatial pattern of speciation very important. If speciation occurs in a spatially autocorrelated way (e.g., along geographic latitude), then areas adjacent to speciation hotspots will also be speciation hotspots (albeit for other species), and thus the phylogenetic clustering in a speciation hotspot will increase, even if this increase is not due to speciation per se. If speciation occurs in a spatially random way the results will be drastically different, and dispersal will blur the signal of speciation leading to phylogenetic clustering in areas of no speciation, making phylogenetic clustering an unreliable indicator of past speciation history.
Our model is the simplest model, i.e., the model with the fewer assumptions that allowed us to disentangle the effect of speciation. All other processes (initial biodiversity, extinction, dispersal) were spatially uniform. Our model did not incorporate any spatial structure in the original distribution of the species (but dispersal led to spatially autocorrelated species ranges). Also, species traits (e.g., extinction risk, dispersal, speciation probability) were equal among species and had no phylogenetic signal. Future work will look into relaxing these simplifying assumptions and investigate their importance.
Concluding, the use of phylogenetic clustering of current biodiversity as an indicator of the regions’ speciation history should be done with caution, since allopatric speciation does not lead to phylogenetic clustering in the absence of dispersal; and if there is dispersal and past speciation is not spatially autocorrelated, phylogenetic clustering may occur in regions of low or no speciation.
Data Availability Statement
The datasets presented in this article are not readily available because the data are the results of theoretical simulations. Requests to access the datasets should be directed to AK, a2FsbGltYW5AYmlvLmF1dGguZ3I=.
Author Contributions
AK planned and executed the experiments, analyzed data, and wrote the manuscript draft. ML, MT, AA-C, and SS assisted in manuscript draft. All authors contributed to the article and approved the submitted version.
Funding
This research was supported by the Hellenic Foundation for Research and Innovation (H.F.R.I.) under the “First Call for H.F.R.I. Research Projects to support Faculty members and Researchers and the procurement of high-cost research equipment grant” (Project Number: HFRI-FM17-2024 Mapping Functional Diversity Drivers, Impacts and Threats—MAPFUN).
Conflict of Interest
The authors declare that the research was conducted in the absence of any commercial or financial relationships that could be construed as a potential conflict of interest.
Supplementary Material
The Supplementary Material for this article can be found online at: https://www.frontiersin.org/articles/10.3389/fevo.2021.617356/full#supplementary-material
References
Dagallier, L. P. M., Janssens, S. B., Dauby, G., Blach-Overgaard, A., Mackinder, B. A., Droissart, V., et al. (2020). Cradles and museums of generic plant diversity across tropical Africa. New Phytol. 225, 2196–2213. doi: 10.1111/nph.16293
Davies, T. J., and Buckley, L. B. (2011). Phylogenetic diversity as a window into the evolutionary and biogeographic histories of present-day richness gradients for mammals. Philos. Trans. R. Soc. Lond. B Biol. Sci. 366, 2414–2425. doi: 10.1098/rstb.2011.0058
Eme, D., Anderson, M. J., Myers, E. M. V., Roberts, C. D., and Liggins, L. (2020). Phylogenetic measures reveal eco-evolutionary drivers of biodiversity along a depth gradient. Ecography 43, 689–702. doi: 10.1111/ecog.04836
Faith, D. P. (1992). Conservation evaluation and phylogenetic diversity. Biol. Conserv. 61, 1–10. doi: 10.1016/0006-3207(92)91201-3
Gavrilets, S. (2003). Perspective: models of speciation: What have we learned in 40 years? Evolution 57, 2197–2215. doi: 10.1111/j.0014-3820.2003.tb00233.x
Hardy, O. J., and Senterre, B. (2007). Characterizing the phylogenetic structure of communities by an additive partitioning of phylogenetic diversity. J. Ecol. 95, 493–506. doi: 10.1111/j.1365-2745.2007.01222.x
Harrison, R. G. (2012). The language of speciation. Evolution 66, 3643–3657. doi: 10.1111/j.1558-5646.2012.01785.x
Kembel, S. W., Cowan, P. D., Helmus, M. R., Cornwell, W. K., Morlon, H., Ackerly, D. D., et al. (2010). Picante: R tools for integrating phylogenies and ecology. Bioinformatics 26, 1463–1464. doi: 10.1093/bioinformatics/btq166
Kougioumoutzis, K., Kokkoris, I. P., Panitsa, M., Kallimanis, A., Strid, A., and Dimopoulos, P. (2021). Plant endemism centres and biodiversity hotspots in Greece. Biology 10:72. doi: 10.3390/biology10020072
Mazel, F., Davies, T. J., Gallien, L., Renaud, J., Groussin, M., Münkemüller, T., et al. (2016). Influence of tree shape and evolutionary time-scale on phylogenetic diversity metrics. Ecography 39, 913–920. doi: 10.1111/ecog.01694
Mazel, F., Mooers, A. O., Riva, G. V. D., and Pennell, M. W. (2017). Conserving phylogenetic diversity can be a poor strategy for conserving functional diversity. Syst. Biol. 66, 1019–1027. doi: 10.1093/sysbio/syx054
Mishler, B. D., Knerr, N., González-Orozco, C. E., Thornhill, A. H., Laffan, S. W., and Miller, J. T. (2014). Phylogenetic measures of biodiversity and neo-and paleo-endemism in Australian Acacia. Nat. Commun. 5:4473.
Paradis, E. (2012). Analysis of Phylogenetics and Evolution with R, Second Edn. New York, NY: Springer.
Revell, L. J. (2012). phytools: R package for phylogenetic comparative biology (and other things). Methods Ecol. Evol. 3, 217–223. doi: 10.1111/j.2041-210X.2011.00169.x
Skeels, A., and Cardillo, M. (2019). Reconstructing the geography of speciation from contemporary biodiversity data. Am. Nat. 19, 240–255. doi: 10.1086/701125
Tucker, C. M., Davies, T. J., Cadotte, M. W., and Pearse, W. D. (2018). On the relationship between phylogenetic diversity and trait diversity. Ecology 99, 1473–1479. doi: 10.1002/ecy.2349
Webb, C. O. (2000). Exploring the phylogenetic structure of ecological communities: an example for rain forest trees. Am. Nat. 156, 145–155. doi: 10.1086/303378
Keywords: phylogenetic diversity metrics, speciation history, simulation model, dispersal, extinction
Citation: Kallimanis AS, Lazarina M, Tsianou MA, Andrikou-Charitidou A and Sgardelis S (2021) Ability of Current Phylogenetic Clustering to Detect Speciation History. Front. Ecol. Evol. 9:617356. doi: 10.3389/fevo.2021.617356
Received: 14 October 2020; Accepted: 10 March 2021;
Published: 29 March 2021.
Edited by:
Paulo A. V. Borges, University of the Azores, PortugalReviewed by:
David Eme, Unité Écologie et Modèles pour l’Halieutique, Institut Français de Recherche pour l’Exploitation de la Mer (IFREMER), FranceVanessa Pontara, Universidade Estadual de Mato Grosso do Sul, Brazil
Copyright © 2021 Kallimanis, Lazarina, Tsianou, Andrikou-Charitidou and Sgardelis. This is an open-access article distributed under the terms of the Creative Commons Attribution License (CC BY). The use, distribution or reproduction in other forums is permitted, provided the original author(s) and the copyright owner(s) are credited and that the original publication in this journal is cited, in accordance with accepted academic practice. No use, distribution or reproduction is permitted which does not comply with these terms.
*Correspondence: Athanasios S. Kallimanis, a2FsbGltYW5AYmlvLmF1dGguZ3I=