 François-Nicolas Robinne1*
 J. John Stadt2
 Christopher W. Bater2
 Charles A. Nock3
 S. Ellen Macdonald3Scott E. Nielsen3
- 1Canadian Partnership for Wildland Fire Science, Department of Renewable Resources, University of Alberta, Edmonton, AB, Canada
- 2Forest Stewardship and Trade Branch, Forestry Division, Alberta Agriculture and Forestry, Government of Alberta, Edmonton, AB, Canada
- 3Department of Renewable Resources, University of Alberta, Edmonton, AB, Canada
Retention forestry is an approach in which live trees and other components of forest structure are retained within harvested areas. A primary objective of retention forestry is to maintain biodiversity and to hasten post-harvest recovery of forest structure and function. Retention is now a key element in sustainable forest management practices in many regions of the world. However, locating where retention should be placed to best achieve management objectives is a challenging problem, and evidence-based approaches to operational applications are rare. We suggest here that harvest planners could benefit from the use of systematic conservation planning principles and methods to inform retention design. Specifically, we used a conservation planning—or prioritization—tool, Zonation, to create spatially-explicit scenarios of retention harvesting in a boreal mixedwood forest in northwestern Alberta, Canada. Scenarios were informed by several environmental variables related to site productivity; in particular, we used a metric of wetness (depth-to-water from the Wet Areas Mapping algorithm) that is based on airborne lidar-derived terrain models previously shown to correlate with patterns in post-harvest forest regeneration and biodiversity. The nine retention scenarios examined here related to the placement of retention focused to drier, mesic, or wetter sites in combination with other prioritization constraints. Results were compared with an existing harvest plan to assess differences in the spatial pattern of retention (e.g., percent overlapping area, number of patches, size of the patches). We also tested for the homogeneity of forest attributes (e.g., tree species, deciduous density) between scenarios and the existing harvest plan using multivariate dispersion analysis. Our results showed limited commonalities among scenarios compared to the existing harvest plan; they were characterized as having limited spatial overlap, and more and smaller patches with the use of a timber-cost constraint further affecting retention patterns. While modeling results significantly differed from current retention practices, the approach presented here offers flexibility in testing different scenarios and assessing trade-offs between timber production and conservation goals using a standardized conservation planning toolkit.
Introduction
Disturbances are major drivers of forest structure and composition. In forests of western Canada managed for the production of timber, pulp, and other forest products, harvesting is one of them. Intensive forest management, which strongly emphasizes fiber production over other values, can threaten biodiversity by simplifying forest structure and composition at multiple scales, thereby reducing habitat and species diversity (Puettmann et al., 2009; Gustafsson et al., 2012; Venier et al., 2014). Retention has become an important paradigm of forest management; its aim is to minimize the differences between natural and managed forests, thereby conserving biodiversity (Attiwill, 1994; Bergeron et al., 1999, 2001; Burton et al., 2006). It also involves maintaining forest complexity at the stand scale through retention of biological legacies. This translates into leaving unharvested individual trees or tree patches during harvest, a practice known as variable retention harvesting (Franklin et al., 1997) or retention forestry (hereafter RF) (Gustafsson et al., 2012). Retention of tree structural complexity within the harvested stand provides refugia for elements of biodiversity otherwise not found in harvested areas (e.g., large live trees, snags, coarse woody material, and understory plant communities) (Franklin et al., 1997), thereby “lifeboating” species and ecosystem processes over the regeneration phase (Macdonald and Fenniak, 2007; Fedrowitz et al., 2014).
An important challenge to implementation of retention relates to deciding on the location of patches of retained trees within a harvested block. Finding an acceptable balance between designation of areas for RF to meet biodiversity objectives while limiting losses of timber revenue requires the development of spatially explicit scenarios to guide forest harvest planning (Ezquerro et al., 2016). Attempts to integrate biodiversity conservation goals while preserving timber revenues are recent (Ezquerro et al., 2016), often applied over large tracts of land (Hauer et al., 2010), and do not always provide spatial results directly applicable to planning purposes (Ahmad et al., 2018). In parallel, the wide adoption of systematic conservation planning (SCP) principles has facilitated the development of spatial prioritization tools that can be applied at a range of scales and for a variety of ecological questions, including forestry issues (Margules and Pressey, 2000; Moilanen et al., 2005; Moilanen, 2008; Lehtomäki et al., 2009). SCP is essentially based on spatial multi-criteria analysis in which a number of environmental features (e.g., land cover, forest stand age, umbrella species occurrence) are used as biodiversity surrogates (i.e., indicators) and combined in such a way that the selection of landscape characteristics is prioritized toward the conservation of representative biodiversity areas helping the completion of quantitative conservation targets (Margules and Pressey, 2000; Lehtomäki and Moilanen, 2013). While often used for the design of reserves at large scales (i.e., sub-national to global), the core concepts of prioritization and cost-effectiveness on which systematic conservation planning is based (Moilanen, 2008) are compatible with forestry needs and applicable at smaller scales typical of harvested landscapes, where retention patches can be thought of as analogs of biodiversity reserves in large-scale planning exercises (Work et al., 2003; Mazziotta et al., 2017).
To apply SCP in a forestry context, input data need to be assembled to capture variation in key forest ecosystem attributes at the cutblock scale, including biodiversity and timber quantity. These data can be assembled by combining vegetation inventory, satellite imagery, and lidar-derived vegetation and soil metrics. Topographic wetness has been shown to be relevant for forest management actions, including the establishment of infrastructure footprint minimizing soil disturbance (Ågren et al., 2014), forest stand type and structure characterization (Murphy et al., 2008a; Nijland et al., 2015b), site productivity (Bjelanovic et al., 2018), biodiversity in unmanaged and post-harvest forests (Bartels et al., 2018b, 2019; Echiverri and Macdonald, 2019), and managing soil carbon (Sewell et al., 2020). Fine-scale data on topographic wetness has become available for Alberta’s managed forests by applying models to spatially extensive airborne light detection and ranging (lidar) data (White et al., 2012). Lidar also provides fine-scale data on forest structural attributes, e.g., tree height, cover and vertical complexity (Lefsky et al., 2002; Wulder et al., 2008), while satellite data can provide information related to forest productivity (Cook et al., 1989; Coops, 2015). Together, these data provide the necessary input for adapting a SCP tool to a forestry context involving the search for a spatial pattern of retention that balances both biodiversity and timber production objectives. It is also often acknowledged that, within the mesic portions of the landscape managed for timber production (i.e., the active landbase), wetter sites display higher levels of productivity and biodiversity; indeed, relative site wetness has been demonstrated to be related to biotic and edaphic (i.e., soil) properties of mixedwood boreal forests (Nijland et al., 2015b; Bartels et al., 2018a; Echiverri and Macdonald, 2019; Sewell et al., 2020). If wetter sites have higher biodiversity and productivity, managers face a challenge in achieving goals for maintaining biodiversity while extracting the greatest quantity of timber. However, this relationship is not always true among the three main forest types of western boreal forests (i.e., conifer, deciduous, mixedwood); in some cases the evidence suggests that targeting drier forest sites for retention would be better for conservation and recovery of biodiversity or forest regeneration after harvesting (Nijland et al., 2015a, b; Bartels et al., 2018a, 2019; Echiverri and Macdonald, 2020).
In this study, our main objective is to test an existing SCP toolkit, Zonation (Moilanen, 2007), for retention planning. We sought to assess the degree to which RF pattern and stand attributes (e.g., tree height, species) vary among scenarios built using different constraints, including prioritization of when levels of a high-resolution topographic wetness gradient (Murphy et al., 2007, 2011). Further, we examined which scenario(s) might best meet one of three possible objectives: (i) lowest cost (lowest volume of merchantable timber left in retention); (ii) maintenance of habitat patches (largest retention patches); or (iii) biodiversity (retention patches distributed so as to be broadly representative of the range of wetness classes). To put the results of the various scenarios in context, we compare the outputs of Zonation with an existing forest harvest plan to assess (dis)similarities with current retention practices based on forest practitioners’ empirical knowledge. We then discuss the potential benefits of combining an SCP approach with information on topographic wetness used for designing RF schemes. We believe that this innovative approach based on an operational demand from forest managers, provides a simple and valuable contribution toward the development of sustainable forestry practices.
Materials and Methods
Study Area
The study area was located in northwestern Alberta, Canada, in the Boreal Plains ecozone (Figure 1). The Boreal Plains are characterized by a continental climate and boreal mixedwood forests.
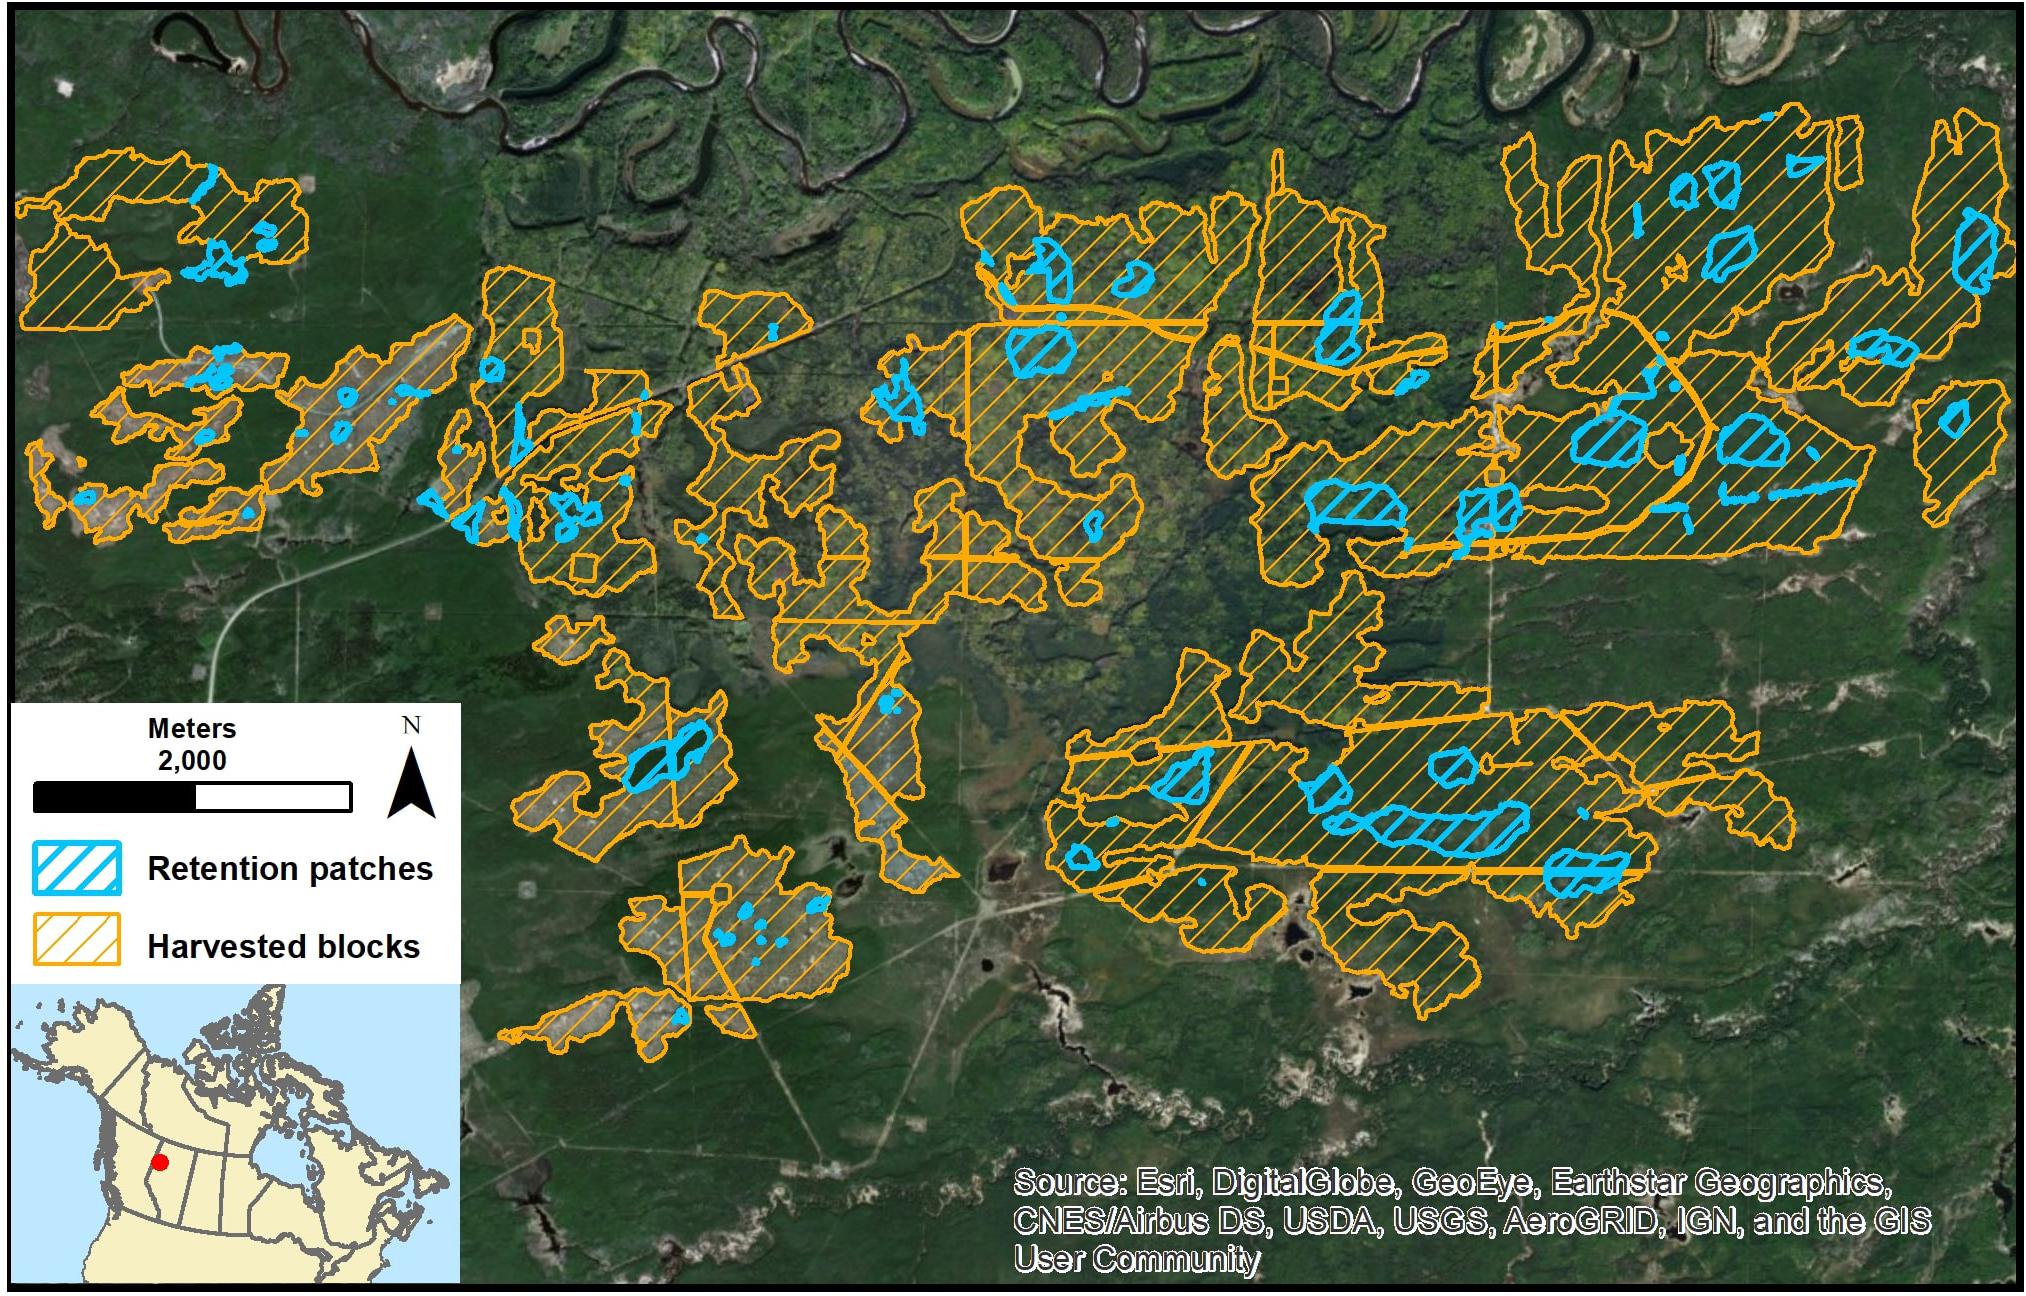
Figure 1. Study area located in northwestern Alberta, Canada (118°15′ W, 56°52′ N). The map displays forested perimeters that were harvested or are planned to be harvested, as well as existing and planned retention perimeters. The modeling work and analysis presented in this study apply to these perimeters only.
The harvested and retained perimeters on which our study focuses (Figure 1) covered a total of 24.4 km2 and were dominated by trembling aspen (Populus tremuloides, Table 1). Retention patches, as planned by the forestry company responsible for managing the area, covered 1.95 km2, or 8% of the total perimeter shown in Figure 1, and were dominated by trembling aspen ∼72% cover), white spruce (Picea glauca,∼10% cover) and black spruce (Picea mariana,∼10% cover) (Table 2). Here, retention patches were defined as areas within harvested blocks, and this did not include other areas that were excluded from harvest blocks in connection with planning guidelines such as riparian buffers, inoperable areas, or areas set aside for other specific purposes (e.g., key wildlife habitat).
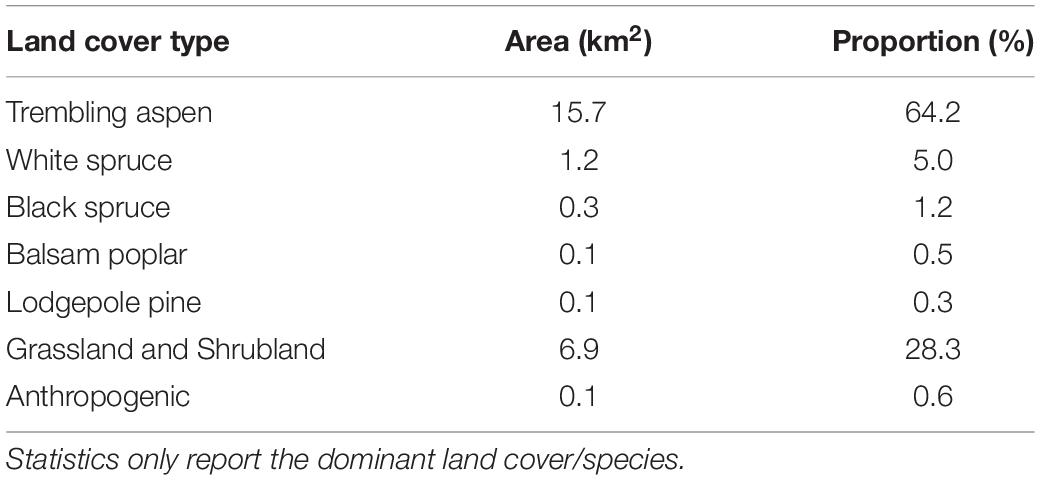
Table 1. Details pertaining to the land cover in the area of interest, derived from the Alberta Vegetation Inventory (Alberta, 2017).
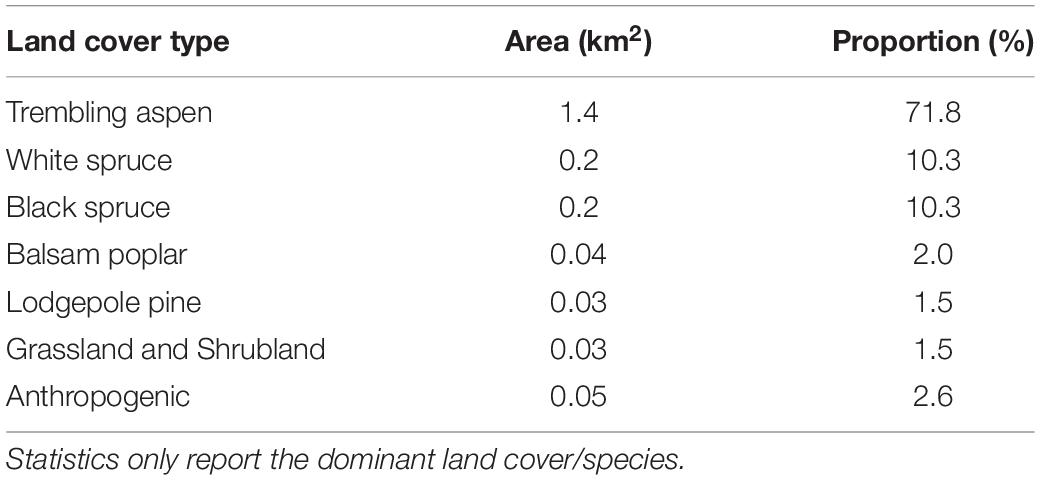
Table 2. Details pertaining to the land cover in the retention patches (as operationally implemented or planned); derived from the Alberta Vegetation Inventory (Alberta, 2017).
Alberta’s forests fall primarily on public (Crown) lands, but most forest harvesting is carried out by private forestry companies who are granted tenure rights to timber resources by the provincial government. Companies submit forest management plans to the Province that describe the rate, pattern, and location of harvest. Alberta requires these plans to follow sustainable forest management principles by setting objectives for landscape and stand level biodiversity indicators (Alberta, 2006a). This includes the requirement to commit to a minimum percentage of within-harvest area retention. Riparian areas receive protection through requirements to leave unharvested buffers along watercourses (Alberta, 2006b), and these buffer strips contribute to the maintenance of structural diversity in harvested areas. Forest management plans in Alberta include a Structure Retention Strategy that describes the process the company will be using to identify, lay out, and monitor retention patches during harvesting operations.
Data
Base data showing harvested blocks and existing or planned retention patches were provided by Mercer International – Peace River Pulp [formerly Daishowa-Marubeni International Ltd., (DMI)] in vector format (Figure 1).
Topographic wetness was represented by the depth-to-water (DTW) metric; a product of the Wet Areas Mapping (WAM)1 project supported by the Government of Alberta (White et al., 2012) and freely available to the public. DTW values were derived from one-meter spatial resolution bare-Earth digital elevation models (DEMs), which were interpolated from airborne lidar ground returns. This spatial processing equates to the modeling of soil wetness based on both the vertical and horizontal relationship of a given pixel to adjacent predicted steam lines, which were in turn also derived from the DEM. Higher DTW values represent lower relative site moisture (Murphy et al., 2008b, 2009; Oltean et al., 2016). Comparisons with existing wet area inventories in previous studies yielded a good correspondence and WAM has been extensively ground-truthed and validated in our study area (Murphy et al., 2007, 2009).
We used data on forest density and height, stand age, dominant tree species, and timber stocking derived from vegetation inventory, Sentinel-2 satellite imagery, and lidar-derived vegetation metrics. Detailed stand-level information on overstory and sub-canopy tree species composition and age was obtained from the Alberta Vegetation Inventory (Alberta, 2017). The normalized difference vegetation index (NDVI; Tucker, 1979) derived from the European Union Copernicus program’s Sentinel-2 satellite data (Drusch et al., 2012) provided a proxy of site productivity, a measure that is complementary to DTW information (Nijland et al., 2015b), and provided information on post-disturbance recovery potential. Tree height data, as a proxy for forest structure and productivity, was represented by the 95th percentile of airborne lidar first returns, a metric that has previously contributed to the characterization of stand successional stage (Kane et al., 2010) and the creation of a lidar-based habitat index (Coops et al., 2016). We also used lidar-derived deciduous and conifer merchantable stem density per hectare, and gross merchantable volume (GMV) per hectare as a measure of standing-tree volume potentially available for harvest.
Input raster data were at a 10-meter spatial resolution and projected in NAD1983 UTM Zone 11 North. This required resampling the DTW data from one to 10 m and timber volume and density data from 20 to 10 m using bilinear resampling. All data processing was done in ArcGIS Desktop 10.5 (Environmental Systems Research Institute, 2017).
Methods
Zonation and Systematic Conservation Planning
Zonation is a software described both as a conservation planning method based on the Zonation meta-algorithm and its implementation in the Zonation landscape prioritization software (Moilanen et al., 2005). Simply put, the Zonation meta-algorithm prioritizes the areas of a landscape deemed the most suitable for biodiversity conservation, either because of higher biodiversity levels (overlap in species habitats) or because of higher habitat quality, by iteratively removing areas of lesser values. Zonation ranks areas based on their ecological suitability with higher ranks—and so higher values—corresponding to areas of higher suitability. Although a number of studies demonstrated the capacity of Zonation to deal with large forested landscapes, particularly in the boreal environment (Lehtomäki et al., 2009), we are not aware of previous examples of its application to the challenge of selecting areas to be retained in an operational forestry context.
Selection of areas for conservation is often biased toward sites that are isolated and of low economic interest, thereby limiting the achievement of core conservation objectives such as representativeness (e.g., species, habitat) and long-term survival of the species and other elements of biodiversity they harbor (Margules and Pressey, 2000). Similarly, in early efforts to implement RF, economic considerations strongly influenced selection of retained areas in sites of low productivity (Mitchell and Beese, 2002). To mitigate the conflict between multiple objectives, SCP aims at constructing a well-informed, objective, and structured set of biodiversity indicators and protection targets, whose ecological and socio-economic relevance can be tested across land-management scenarios of varied complexity and scales resulting in an adequate conservation solution (i.e., the best trade-off between biodiversity and cost considering a set of management objectives) (Margules and Pressey, 2000; Lehtomäki and Moilanen, 2013). Conservation efforts based on SCP principles often start with the creation of spatially-explicit area prioritization schemes, which was the very point of building alternative RF scenarios in this study.
Systematic Retention Scenarios
Systematic conservation planning is based on the selection and use of biodiversity features, ideally species distribution data, which can be used as indicators of overall biodiversity for a given area of interest (e.g., total species richness), however, the availability and/or reliability of species distribution data is often limited over large territories, and the use of biodiversity coarse-filter surrogates, such as topographic wetness and forest structure, is a credible alternative. According to a number of recent studies in the western boreal forest of Canada (White et al., 2012; Nijland et al., 2015b; Bartels et al., 2018a, 2019; Echiverri and Macdonald, 2019, 2020), DTW is an effective surrogate for many conservation values, and different parts of the wetness spectrum can be prioritized for leaving retention, depending on the biodiversity targets to be reached by forest operators (Table 3).
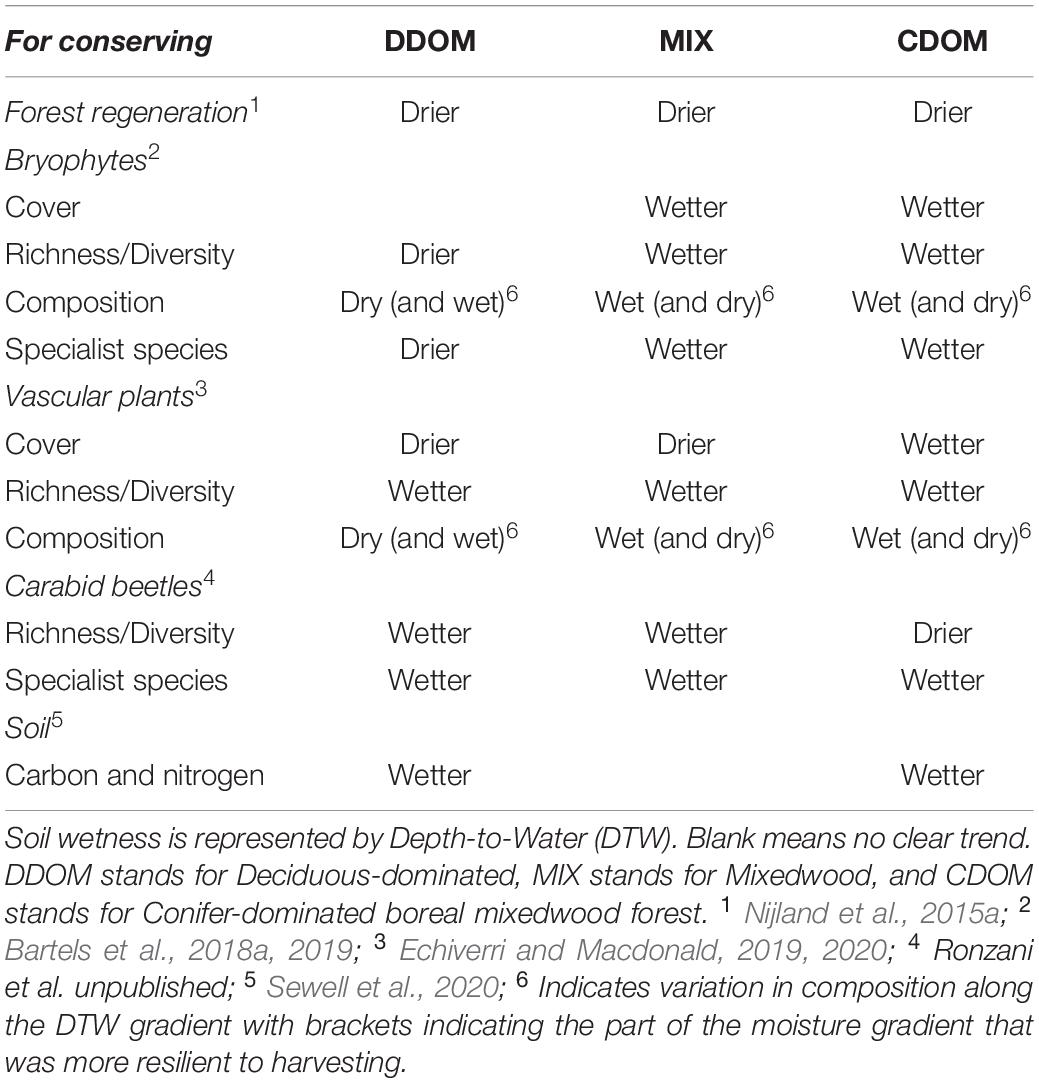
Table 3. Associations between soil wetness, biodiversity and ecosystem function (soil carbon and nitrogen) for three stand types in boreal mixedwood forest.
Our study was based on the comparison of actual retention identified within an existing harvest plan to multiple hypothetical RF designs generated by Zonation. The former, referred to as the reference below, represented business-as-usual practice, whereas the latter represented a set of modeling scenarios in which RF within the planned harvest blocks was constrained by different sets of parameters, i.e., pixel aggregation rules; prioritization of wet, dry, or mesic site wetness; and pixel removal cost (Table 4 and Supplementary Material 1). The process is summarized in Figure 2; in total, nine scenarios were modeled and their outputs were compared to the reference.
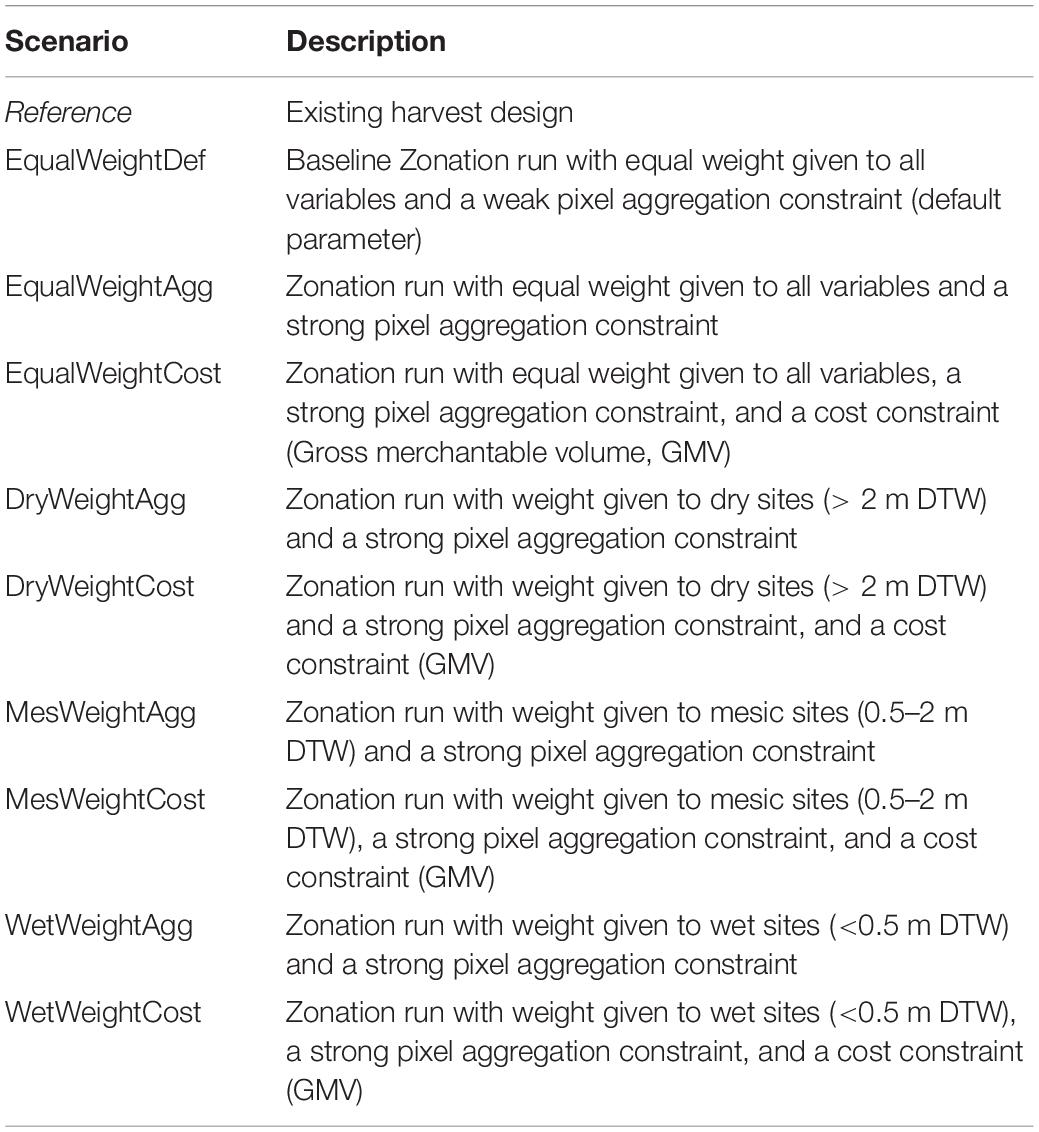
Table 4. Details pertaining to the scenarios modeled using Zonation.
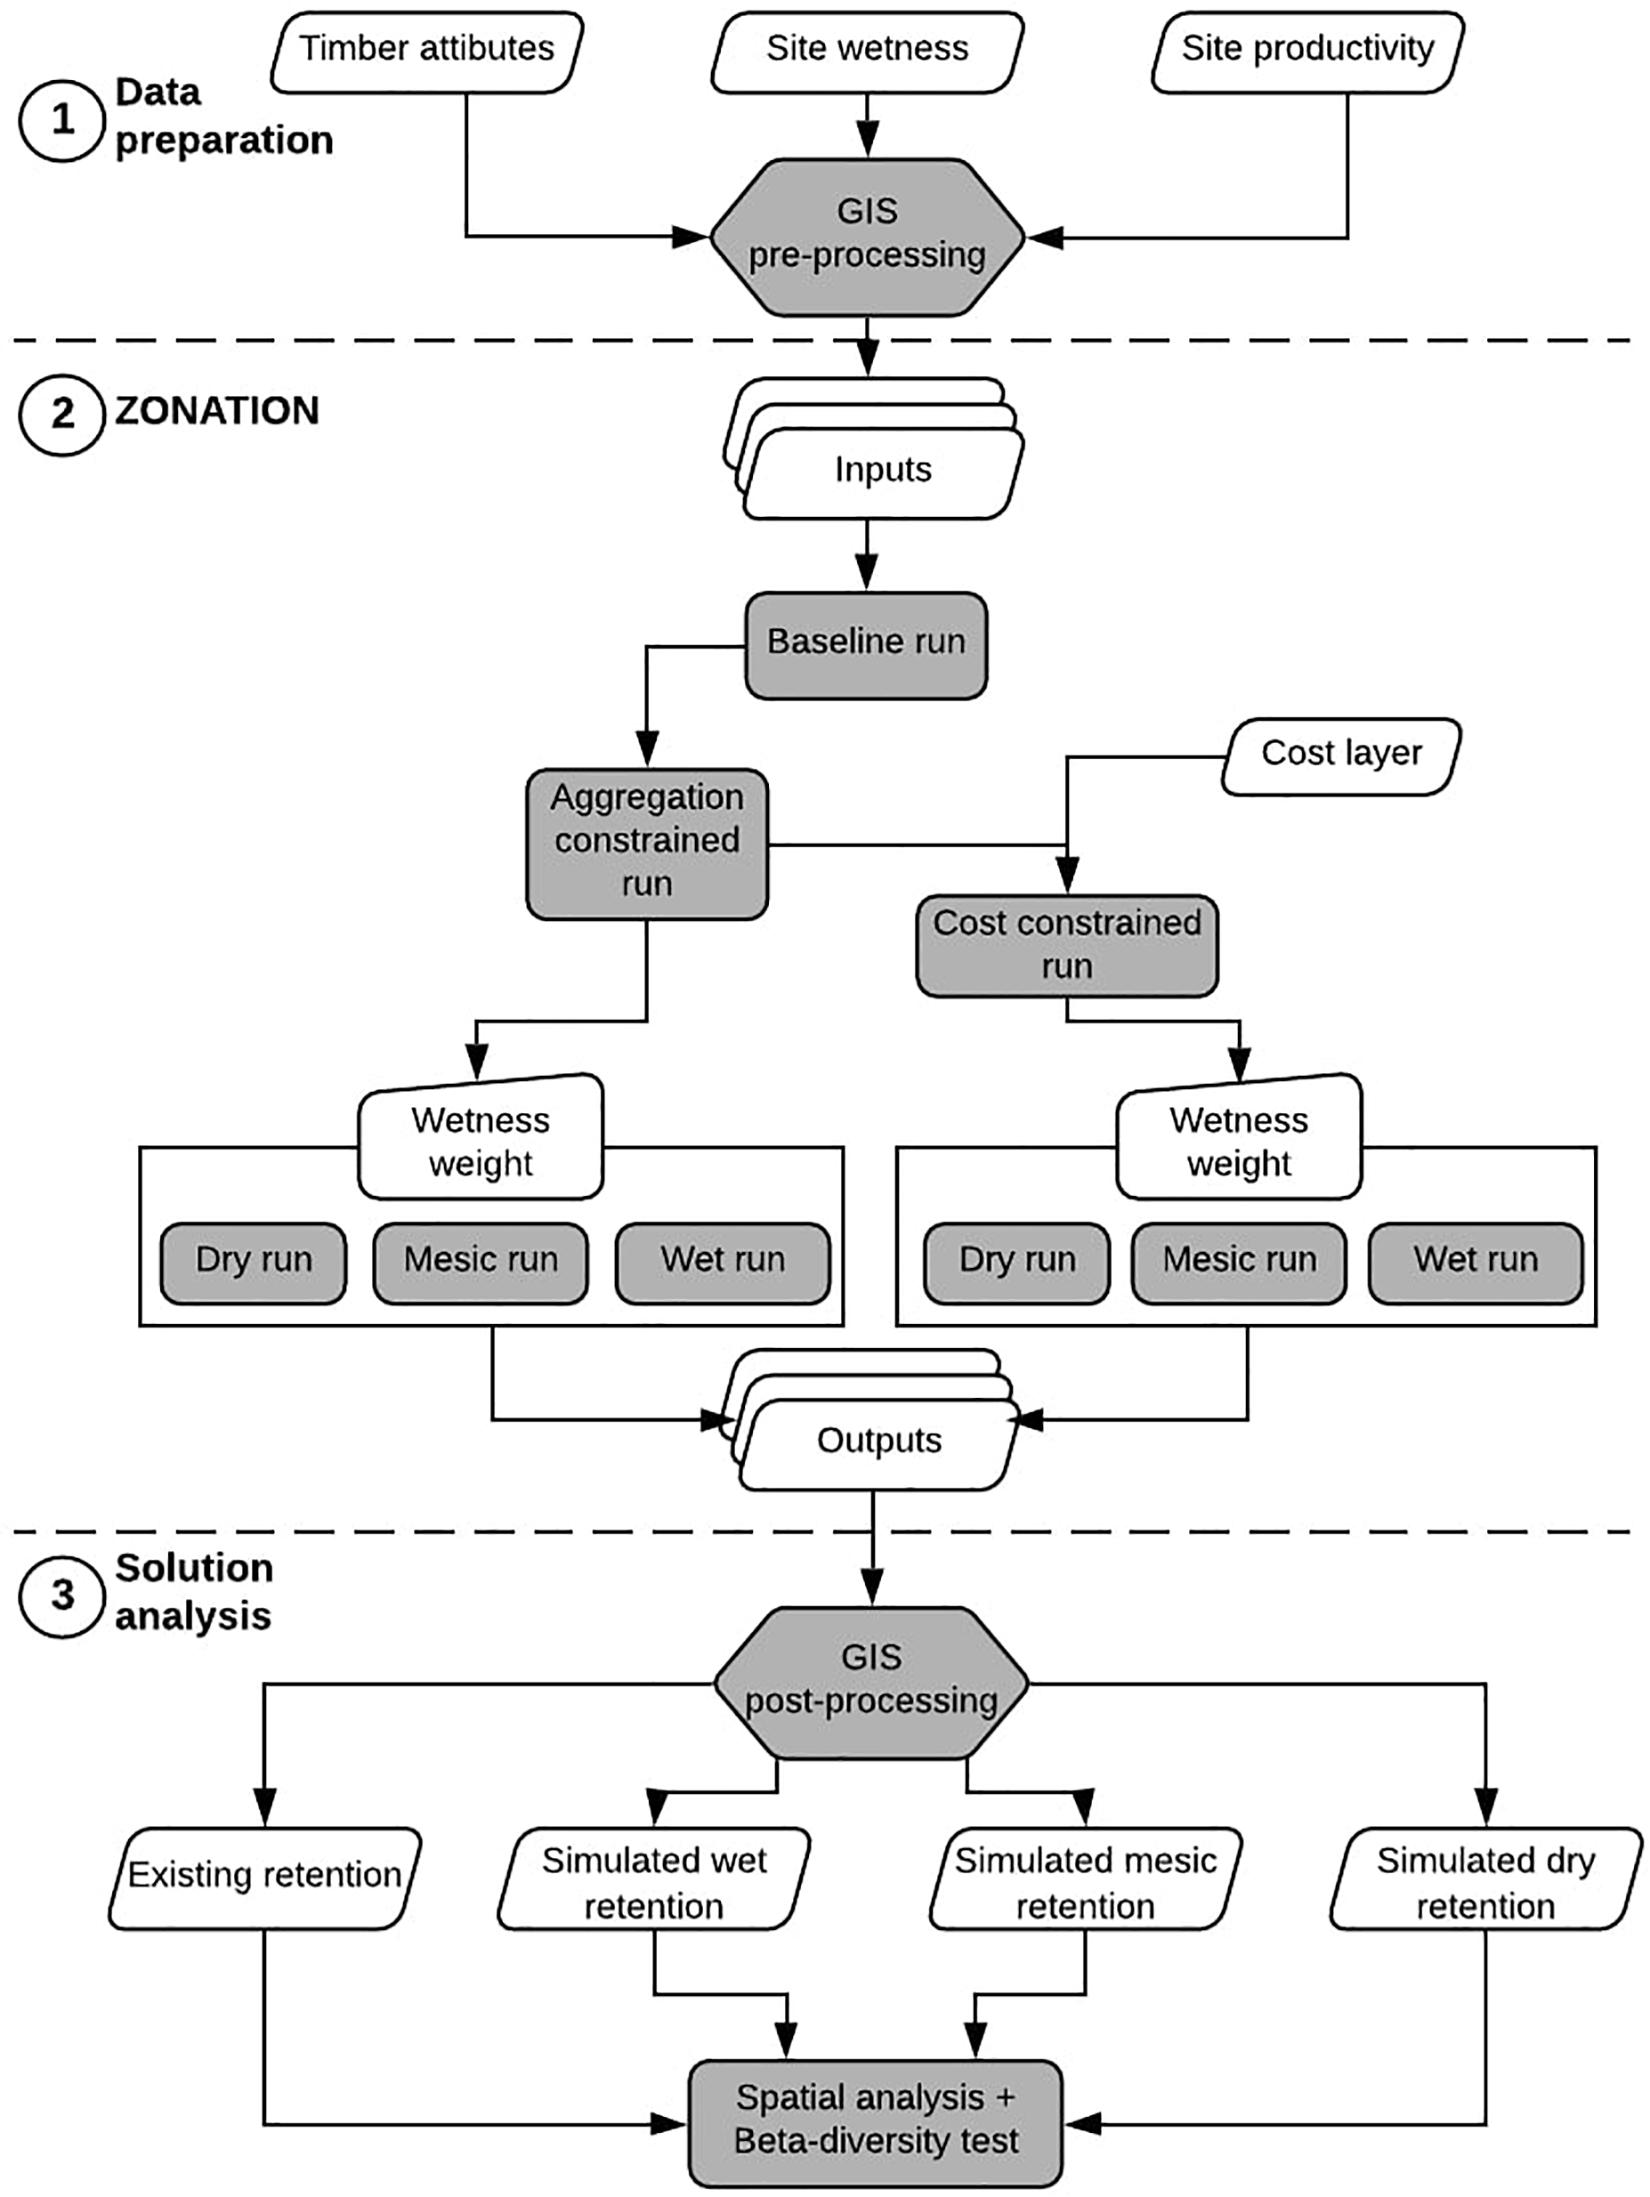
Figure 2. Systematic retention p lanning flowchart representing the method used in this study. Step 1 was conducted in ArcGIS10.5 and step 3 was conducted in both ArcGIS10.5 and R3.6.3.
According to best practices listed by Moilanen et al. (2014), we first created a baseline scenario (EqualWeightDef) in which all biodiversity features had an equal weight and pixel aggregation rules that control output patchiness were relaxed. We also used an additive benefit function (ABF) since we were using surrogates instead of species-specific information with trade-offs between conservation values allowed and conservation investments maximized (i.e., greater conservation to investment ratio, Moilanen et al., 2014). ABF would therefore prioritize areas of the landscape (i.e., pixels) whose sum of surrogate values were higher than those of the surrounding areas.
We then built on this baseline scenario to create eight additional scenarios (Table 4) in which we controlled for spatial aggregation by using a Boundary Length Penalty (BLP) rule of 0.001; a higher penalty would produce larger, more compact patches of lower boundary length while decreasing their overall conservation quality, whereas lower penalty would create more patches of higher conservation quality. Although a lower penalty would lead to a more fragmented result, it would also provide more flexible solutions in terms of RF design options, hence making trade-offs between conservation and timber production easier to reach. BLP is a generalist rule fitted for general biodiversity management purposes (Moilanen et al., 2014), as imposed in forestry regulations.
Out of these eight scenarios, six were further constrained by prioritizing different levels of site wetness, i.e., dry, wet, and mesic according to DTW values (Table 4). Drier sites had DTW values greater than 2 m. Wetter sites had DTW < 0.5 m and depicted the “traditional” RF practice of retaining the wettest parts of the landscape. Mesic sites had DTW between 0.5 and 2 m and represented an intermediate situation in which a larger range of moisture conditions, and thus ecological conditions, was preferable. We reclassified DTW values in ArcGIS10.5 (Environmental Systems Research Institute, 2017) to emphasize these different wetness levels: original DTW values were kept as-is so higher values correspond to the drier end of the spectrum; an inverse linear function was used to switch the range of DTW values, so higher values correspond to the wetter end of the spectrum; for mesic sites, we used a Gaussian function with a 1.25 m depth as the “midpoint” and a spread parameter of 0.75 m. For each of these wetness scenarios, the wetness layer was given a weight 10-times greater than the other layers to prioritize it.
Finally, out of these six scenarios, three were further constrained by the addition of a cost layer that prioritized the conservation of low-cost pixels (Table 4) to produce a RF design that would be less expensive to implement. By using gross merchantable timber values, we limited the selection of the most valuable timberland. This meant that areas displaying greater merchantable volumes would not be protected at the expense of timber revenues; therefore, Zonation would trade areas of high ecological value with areas that might be less important from an ecological standpoint but also more important from an economic standpoint. The same constraint was also applied to the baseline scenario (“EqualWeightCost,” Table 4).
Analysis
We compared RF patches in the reference (i.e., as operationally planned) and RF patches modeled by Zonation in terms of their spatial pattern and forest attributes (e.g., tree species, mean tree height). Patches in the reference covered 8% of the area; therefore, we kept the top 8% of each Zonation output so only those pixels with the best conservation values per scenario were used for comparison. In other words, we only kept those 8% of pixels that the model classified as being the best from a conservation standpoint.
For each scenario, we first summarized the number of patches, the mean patch size, and the percent spatial overlap with the reference in an attempt to present differences in a synthetic manner. We also created a heatmap displaying the frequency at which each pixel was selected throughout the scenarios and the reference. It provided a simple visual to identify clusters of pixels that were selected in most of the scenarios, or on the other hand, those that were rarely selected. Complementary to the heatmap, for each scenario we computed average stand age, mean DTW, the average deciduous and conifer density, the average NDVI, the average of the 95th percentile of tree height, and the total GMV. We also collected information regarding forest composition. This information was necessary to assess (dis)similarities in the structural composition of RF patches between the reference and the scenarios.
Subsequently, we made overall comparisons of the reference and scenarios using all forest attributes by means of multivariate dispersion analysis, which was deemed a robust method to measure abundance-based beta diversity among multiple areas (Anderson et al., 2006). For a set of environmental variables or species distributed across multiple groups, the test uses a distance matrix to analyze the variance (i.e., ANOVA) of sample distance around a calculated multivariate median (i.e., the dispersion). Dispersion within groups is then compared among groups by permuting ANOVA residuals under the null hypothesis of homogeneity among groups (Anderson, 2006). In our study, groups were represented by RF scenarios, environmental variables were derived from forest attributes within retention patches, and samples were the retention patches (Supplementary Material 2). To compare each forest attribute independently, continuous attributes of the reference (i.e., year of origin, tree height) were reclassified into four classes using a four-quantile scheme whose class bounds were applied to the other scenarios. The year of origin attribute was reduced from 11 to five classes of 30 years each. Tree height was reclassified using a four-class equal interval classification. Then for each retention patch, the number of pixels of each class was extracted before running the dispersion analysis and the permutational test (4999 permutations, Supplementary Material 3). This analysis was done using the vegan v2.5-6 package for R3.6.3 (RStudio Team, 2015; Oksanen et al., 2019; R Core Team, 2019; Supplementary Material 3).
To examine how the different scenarios compared – to one another and to the reference – in terms of the three objectives we summarized information on the best-performing scenarios as follows: (1) For the “cost” objective – those scenarios resulting in the lowest gross merchantable volume left in retention patches; (2) For the “habitat patch” objective – those scenarios resulting in the largest mean patch size; and (3) For the “biodiversity” objective – the scenarios that resulted in a distribution of retention that was broadly representative of the range of DTW values; this is based on the evidence that both wetter and drier sites could be important, depending on the biotic group and the forest type (Table 3).
Results
The reference (representing retention patches as operationally planned) had fewer, and thus larger, patches than most of the scenarios (Table 5). The number of patches in the reference was 103, compared to an average of 393 patches across the nine scenarios, with the baseline scenario (EqualWeightDef) resulting in the most patches (874). The addition of the aggregation constraint resulted in somewhat fewer and larger patches than the baseline scenario (726, 0.3 ha vs. 874, 0.2 ha). The addition of a cost constraint resulted in fewer and larger patches than the comparable scenario without a cost constraint, and thus the cost constraint scenarios were more similar to the reference (Table 5). In the scenarios with a cost layer there were no substantive differences among the wetness scenarios; in these three scenarios the number and size of patches were quite similar to those in the reference (an average of 98.7 patches, 1.96 hectare in size compared to 103 patches, 1.9 hectare in size in the reference). In contrast, scenarios based on the wetness level only showed consistently higher number and smaller size of patches, with an average of 0.42 hectare across the three wetness scenarios. Of the three wetness scenarios without a cost layer, the one prioritizing dry sites resulted in the fewest and largest patches, and was thus most similar to the reference; the mesic scenario had the most and smallest patches, and was quite similar to the scenario with only an aggregation constraint (Table 5).
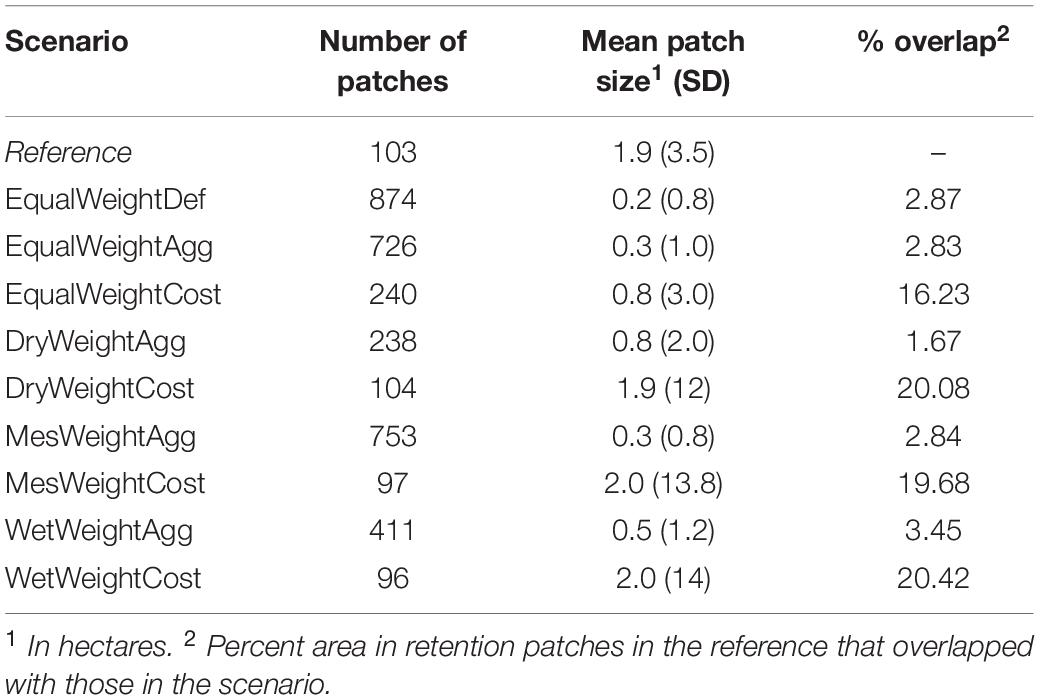
Table 5. Basic landscape-ecology metrics for retention patches under the various scenarios (see Table 4).
The level of spatial overlap between retention patches in the reference and in the scenarios ranged from 1.67 to 20.42%, with an average of 10%. Cost-constrained scenarios showed a higher degree of overlap, being 19.1% on average. In contrast, scenarios based only on the wetness level showed much lower overlap with the reference, (2.7% on average).
The heatmap (Figure 3) reveals variable spatial commonalities among scenarios, including with the reference. Over 38% of the pixels were selected only one time (i.e., cold-spots), almost 93% of pixels were selected less than five times, and less than 1% were selected eight times (i.e., hotspots). A closer look at the spatial distribution of pixels indicates that those selected the least often correspond to the large patches existing in the reference RF design (see Figure 1), as well as isolated pixels coming from the scenarios. Pixels that were selected four to five times often match patterns seen in the outputs of the models that used a cost layer; in the south-eastern portion of the study area, these also line up with the RF pattern in the reference. Pixel hotspots were generally in areas of intermediate to lower relative wetness (i.e., mesic to drier sites).
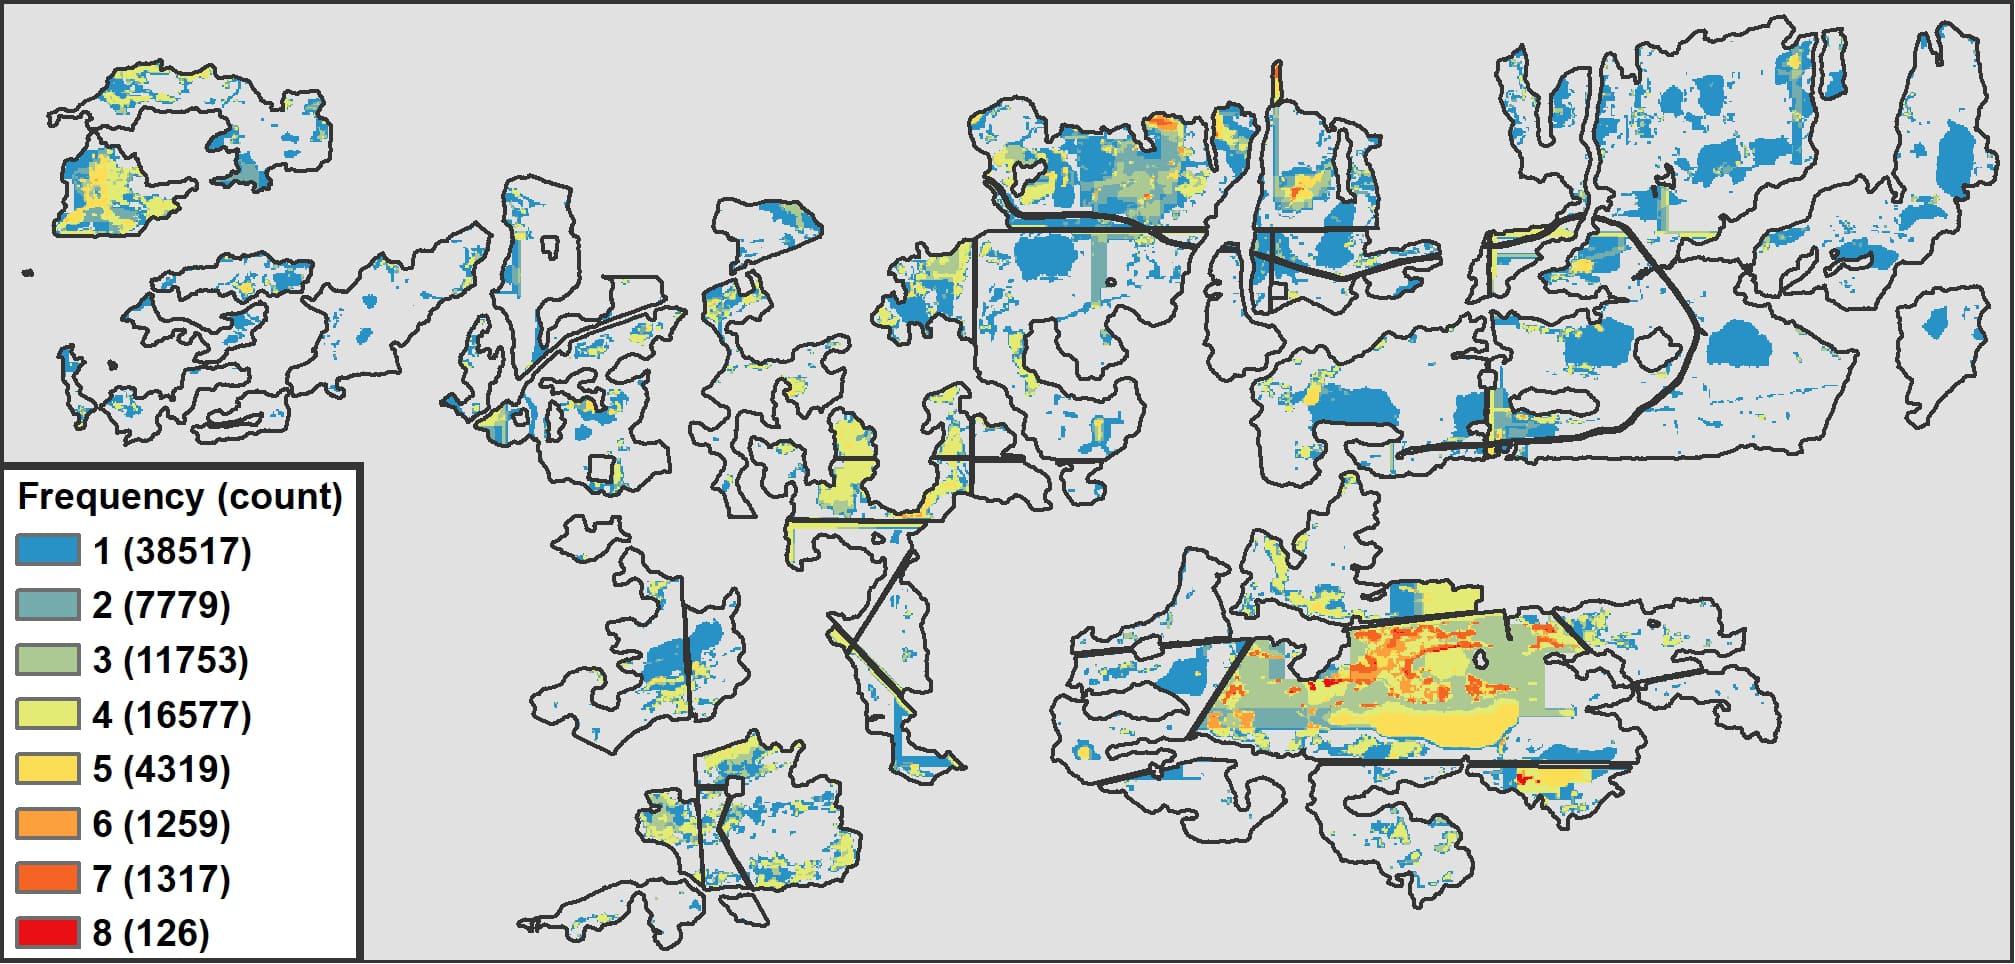
Figure 3. Heatmap showing the frequency of pixel selection across scenarios, including the reference, i.e., pixels coded as “1” were selected in one scenario only, whereas pixels coded as 9 were selected in 9 out of 10 scenarios.
A comparison of forest attributes shows no substantive difference in average stand origin (i.e., age) between the reference and any of the scenarios (Table 6). In the reference, and in all scenarios, most of the forest contained in retention patches originated in 1880–1909 or 1910–1939; the scenarios prioritizing mesic or wet sites had proportionally greater area in the older of these two age classes (Figure 4). Adding a cost constraint slightly increased the proportional area in the 1940–1970 age class. Mean DTW showed important differences, with an average DTW of 1.5 m from all scenarios being drier than the 0.4 m DTW in the reference (Table 6). Even the two “wet” scenarios (WetWeightAgg and WetWeightCost) had lower proportional area of wet sites than the reference, and these did not differ much from the comparable mesic scenarios (Figure 4). The baseline scenario and the one with only an aggregation constraint resulted in retention patches that were overall drier (higher DTW), as did the dry scenario with no cost constraint. The addition of a cost layer resulted in the selection of wetter sites (lower average DTW). Deciduous density in the wetness scenarios with no cost constraint was similar to the reference, whereas with the addition of a cost constraint it dropped, from 610 in the reference to an average of 450 stems/hectare. For conifer density, the results show an opposite pattern, with cost-constrained scenarios showing values closer to the reference (overall average of 246 versus 191 in the reference). Mean NDVI values and tree heights were quite similar in the reference and all scenarios. Most scenarios had higher gross merchantable volume values than the reference. The addition of a cost constraint slightly increased the area in low volume (Figure 4), resulting in these scenarios having somewhat lower GMV and thus being more similar to the reference. The wet scenario without a cost constraint had the highest GMV value of 478 cubic meters per hectare.
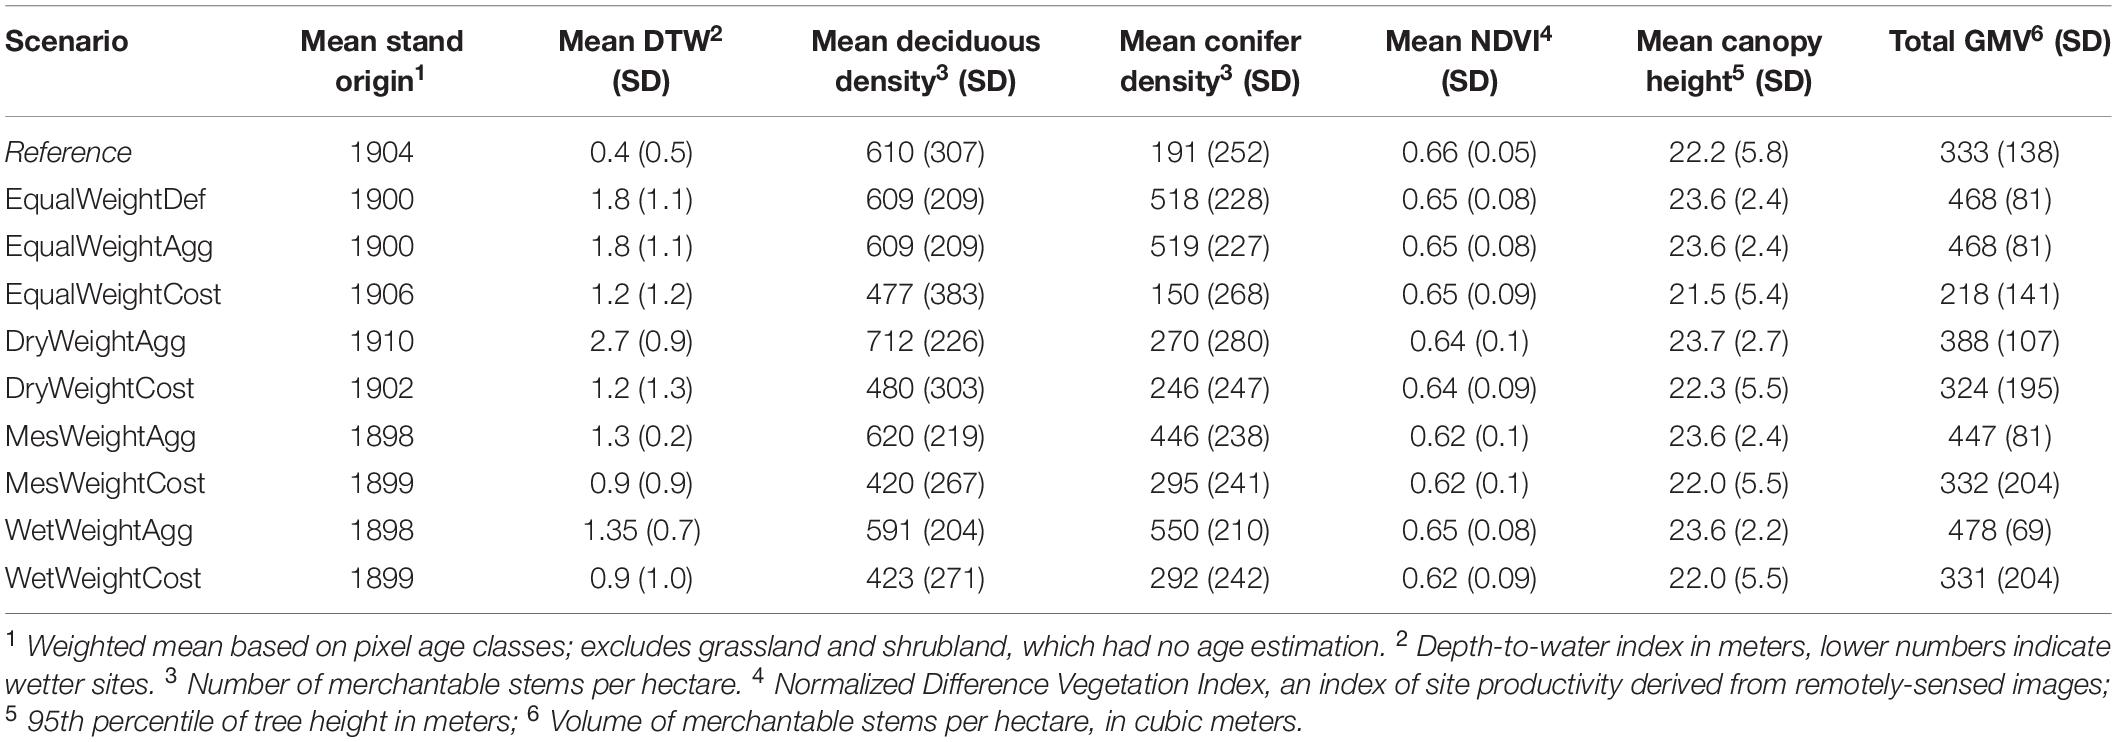
Table 6. Descriptive statistics pertaining to forest attributes per scenario.
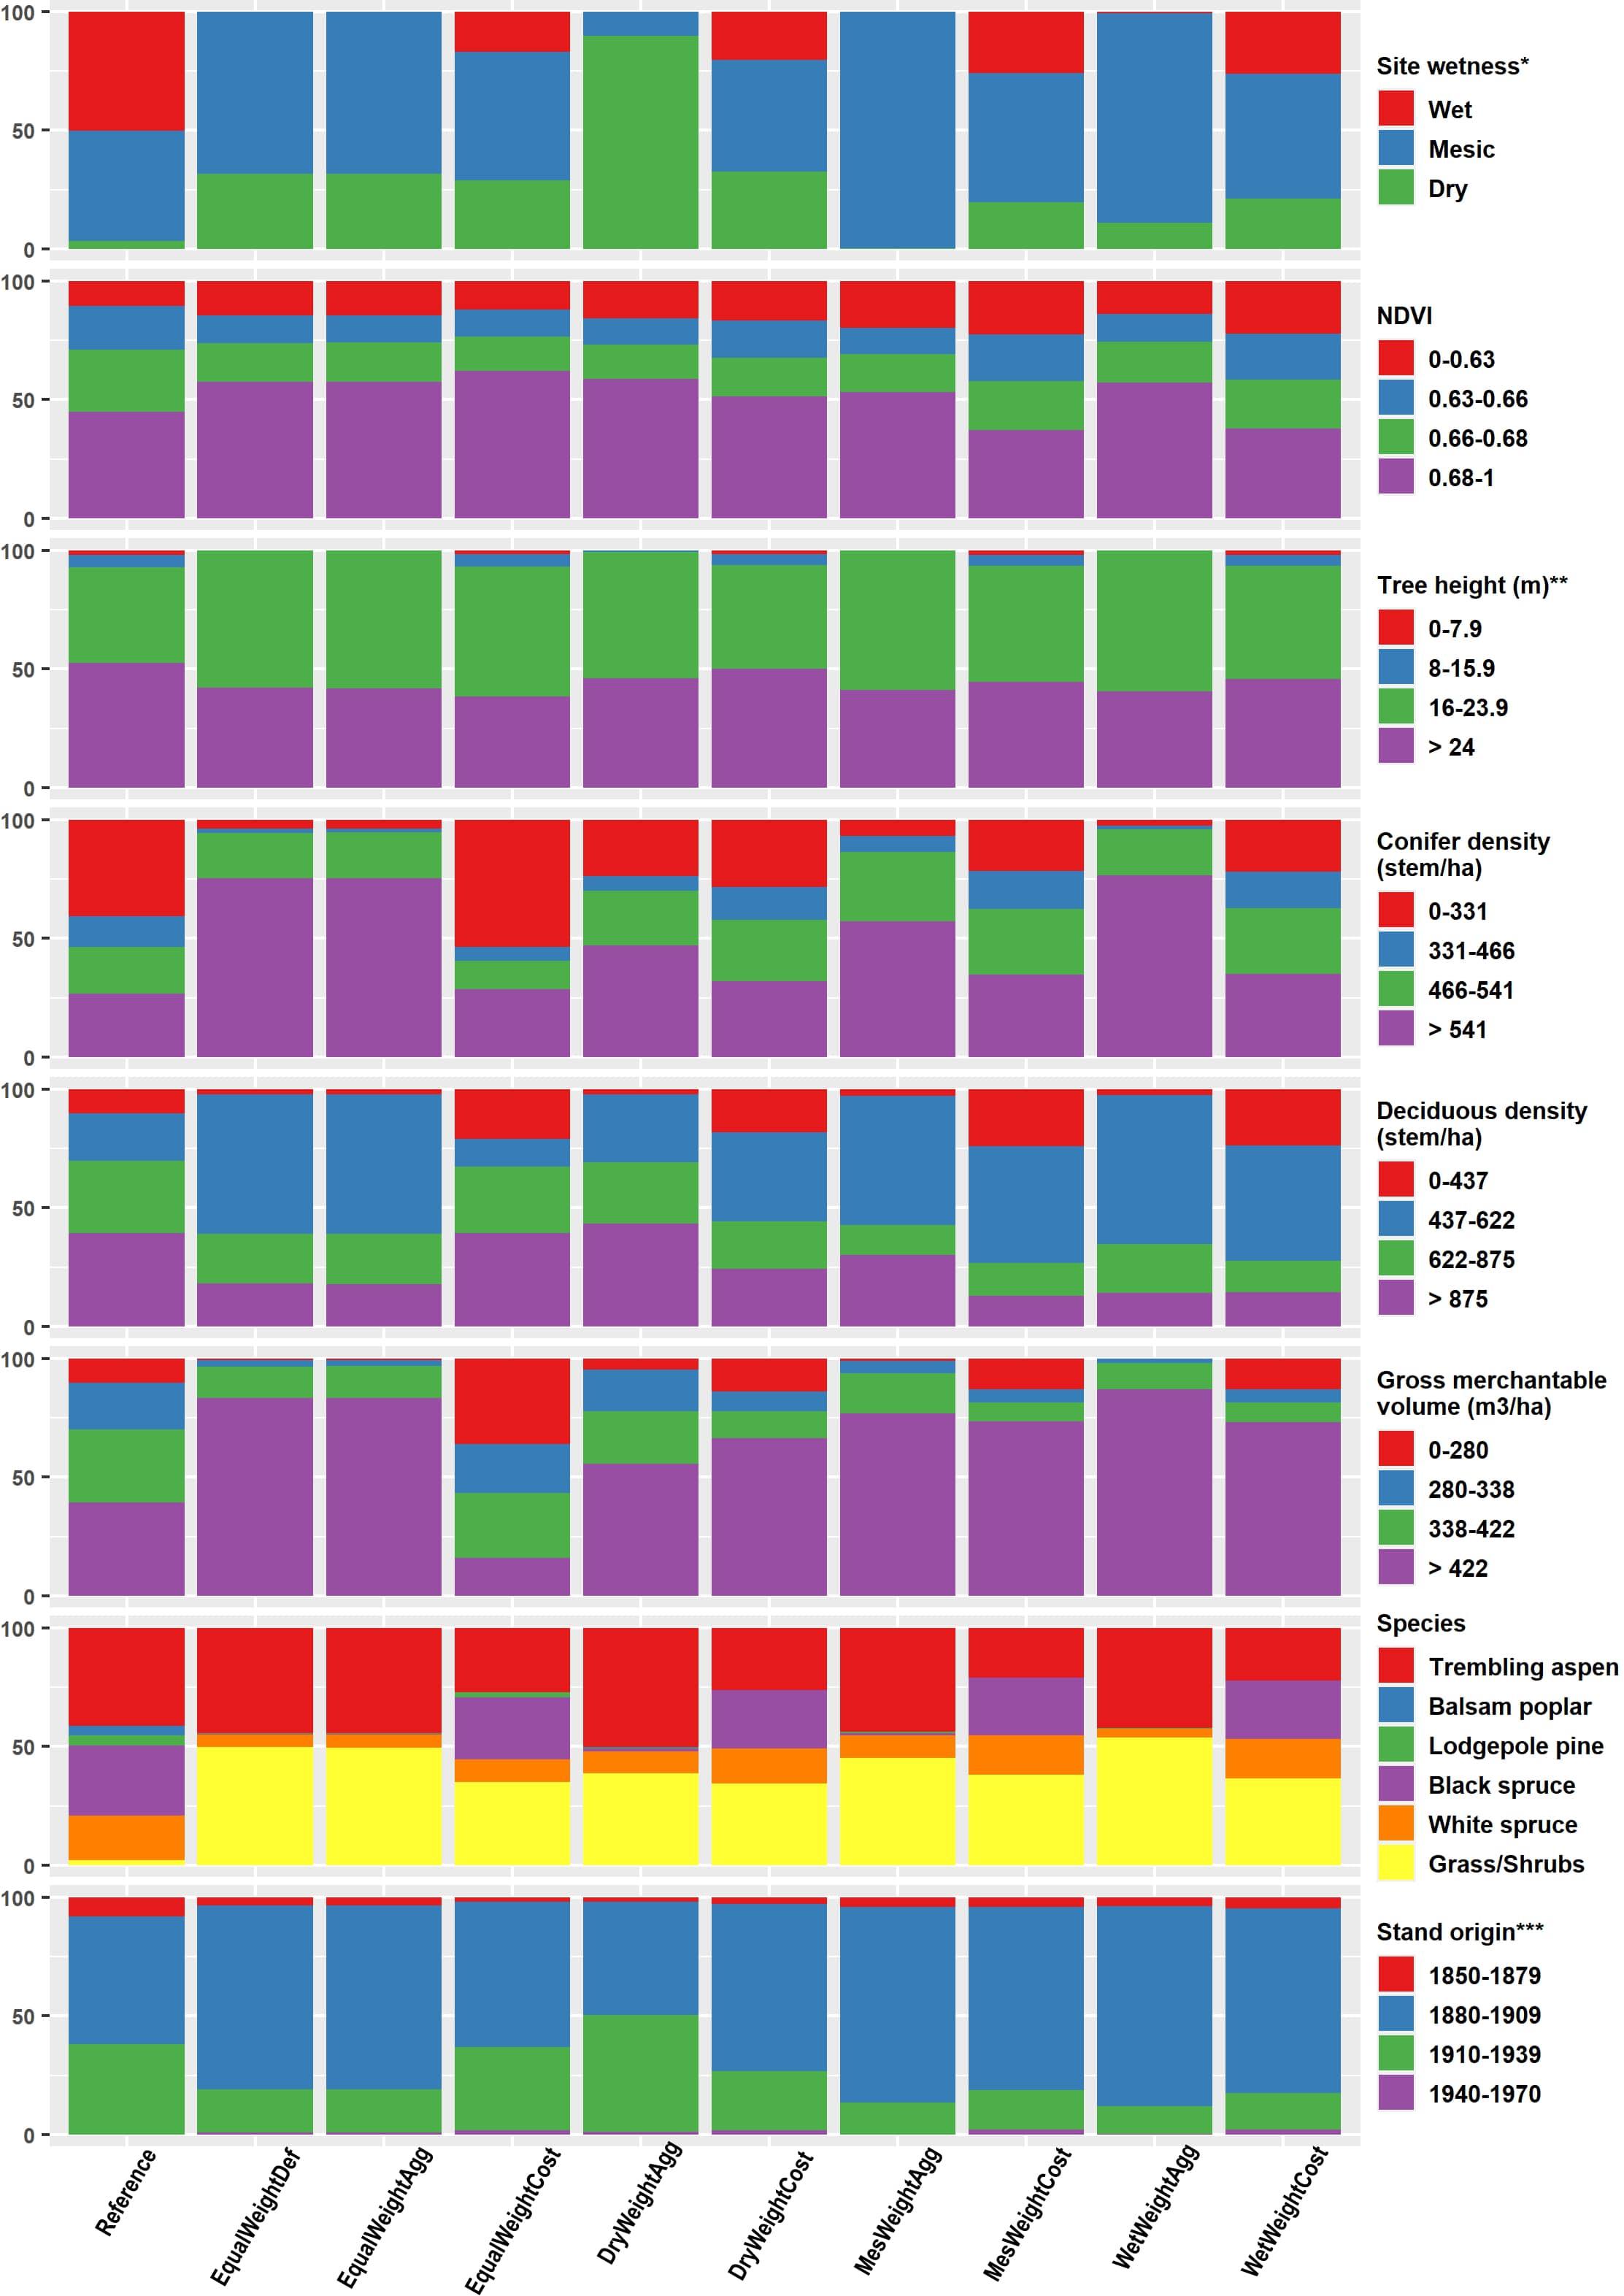
Figure 4. Compositional plots comparing forest stand structure between the reference retention design and the scenarios resulting from Zonation. See Table 4 for information on constraints included in the various scenarios. The Y-axis displays the percentage occupied by a class based on pixel counts within retention patches for a whole scenario. * Site wetness is classified by the Depth-to-Water Index as follows: Wet = 0–0.5 m; Mesic = 0.5–2 m; dry > 2 m. ** 95th percentile of LIDAR-derived tree heights. *** Year of origin of a given stand, used to calculate stand age; excludes grassland/shrubs patches which had no estimate of stand origin.
An examination of the forest composition shows that all scenarios had proportionally more area in grassland/shrubs than did the reference, although even the latter included some such area (Figure 4). Adding a cost constraint resulted in slightly less area in grassland/shrubs and more area dominated by black spruce stands at the expense of trembling aspen; this made the cost-constrained scenarios more similar to the reference.
Results from the multivariate dispersion analysis (Supplementary Material 3) indicate that all scenarios and the reference were significantly different from one another based on the overall analysis including all forest attributes (p-value < 0.0002), however, pairwise comparisons suggested that cost-constrained scenarios tended to display forest attributes closer to the reference, statistically speaking.
In terms of the “cost” objective the EqualWeightCost was best, resulting in substantially lower gross merchantable volume left in retention patches than did the reference (Tables 6, 7). For the “habitat patch” objective, the MesicWeightCost and WetWeightCost scenarios performed equally, but resulted in only a slightly larger mean patch size than the DryWeightCost or reference (Tables 5, 7). In terms of the “biodiversity” objective, the DryWeightCost scenario resulted in the most even representation of all three wetness (DTW) classes with MesicWeightCost being only slightly more unbalanced (Figure 4 and Table 7). In terms of meeting all three objectives, the DryWeightCost scenario would be best; it had mean patch size only slightly lower than the maximum, the best representation of the wetness gradient, and the second lowest gross merchantable volume.
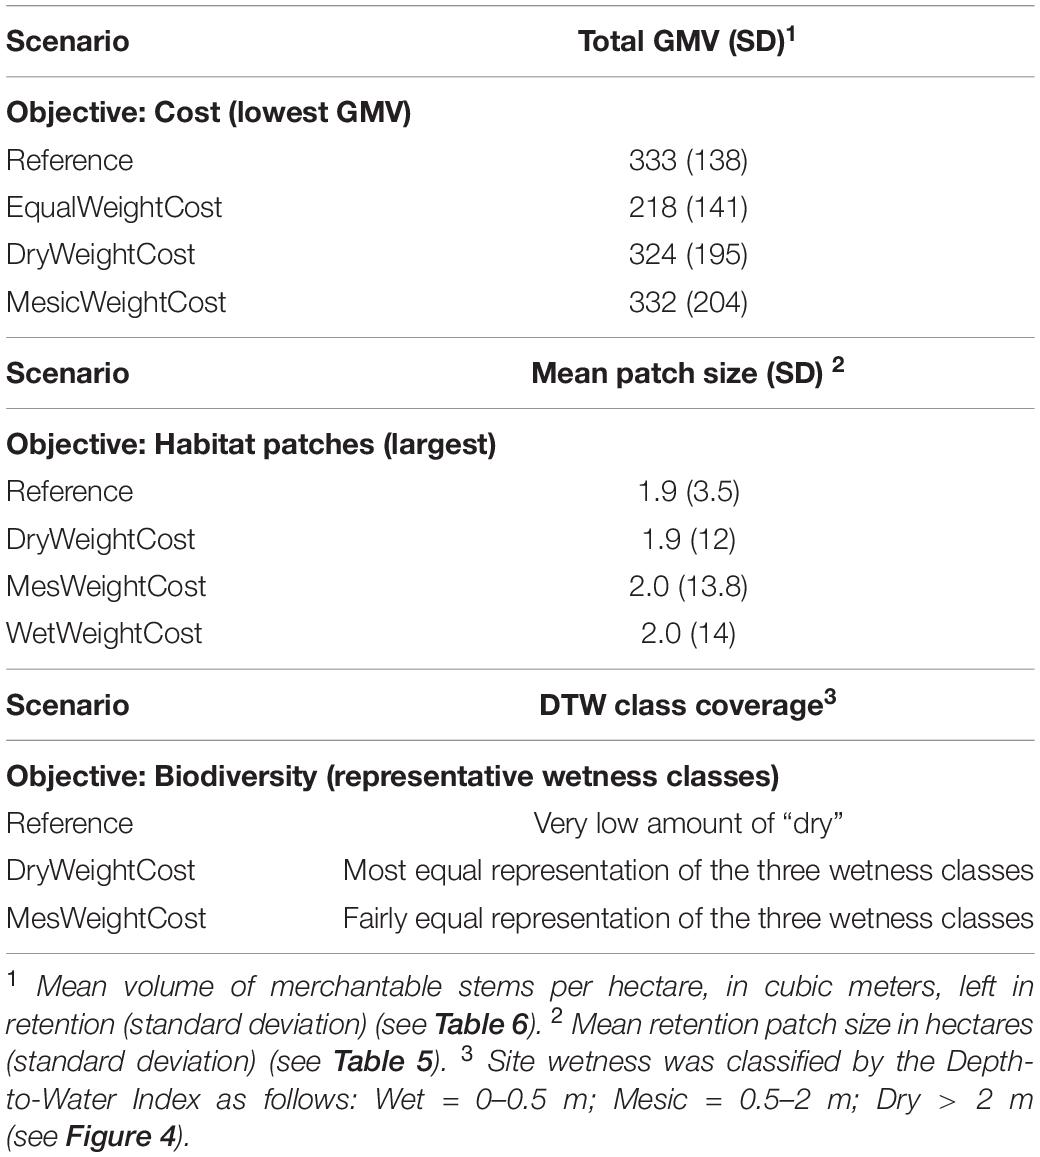
Table 7. Assessment of the scenarios relative to three objectives: (i) lowest cost (lowest volume of merchantable timber left in retention); (ii) maintenance of habitat patches (largest retention patches); or iii) biodiversity (distribution of retention patches broadly representative of the range of wetness).
Discussion
We demonstrated an approach to informing the design of tree retention using Zonation, a prioritization software commonly used in SCP. Prioritization scenarios included consideration of site topographic wetness across different site moisture profiles – dry, mesic, and wet — thus emphasizing different gradients associated with biodiversity observable in the western boreal forest of Canada. Operationally planned RF patches were compared to those of nine scenarios in terms of spatial patterns and their (dis)similarities in forest composition. Our results show that use of such an approach is likely to result in a substantially different end result in terms of size, structure, and spatial location of retention patches than those selected by a planning forester in a business-as-usual approach. Notably, incorporating wetness levels into prioritization for retention patches yielded very different results. The addition of a cost-constraint to scenarios resulted in outputs closer to the reference; for some forest structure variables the addition of a cost constraint resulted in the wetness level being almost completely overridden. The scenarios performed differently in the context of different objectives for RF; thus, we cannot say there is one single optimal solution. However, our results suggest that this approach could be helpful in identifying approaches that could best achieve multiple, even sometimes competing, objectives. This study provides an example of how RF planning can be done in a systematic manner, thereby providing a range of results that can accommodate a variety of management priorities. Our approach should be complemented by the use of ecological and economic models using our results as inputs to explore the variable impacts of RF scenarios on, for instance, animal behavior and movement, and long-term timber yield.
Toward Systematic Retention Planning for Multiple Values
Although retention harvesting as an approach is practiced worldwide and argued to be an important tool in ensuring forestry is sustainable, challenges regarding its operational implementation remain (Bose et al., 2014; Stockdale et al., 2016). Planning retention necessarily involves consideration of a variety of objectives, which are often competing. Fortunately, forestry professionals now have available to them data that provides extensive coverage for a variety of important forest structure, productivity, and site variables linked to desired outcomes, such as biodiversity (this study; Van der Plas et al., 2018). The utilization of a systematic conservation planning approach, such as we demonstrate herein, holds much promise for facilitating utilization of such spatial data on ecosystem function in a planning framework designed to efficiently consider trade-offs.
Including biodiversity in forest planning is not new, but is not often attempted at this scale (i.e., operational), and not with this type of software that emphasizes prioritization based on potential benefits for biodiversity. Further, there is no comparable work using relative site/soil wetness as a biodiversity proxy to drive reserve design. According to Ezquerro et al. (2016, 2019), research to integrate biodiversity into operational planning (i.e., the scale of our study) remains limited. There is, therefore, room to further explore the possibilities offered by spatial tools coming from the field of conservation planning to provide insights to better guide modern sustainable forest management.
Overall, the nine systematic retention planning scenarios resulted in quite different patterns and characteristics of retention patches than did the operational selection of retention, as represented in the reference. Operational planning of retention resulted in fewer and larger patches, which were located on wetter sites, with higher deciduous density, lower conifer density, similar stand age, and lower gross merchantable volume. The addition of a cost constraint resulted in patterns of retention that were generally more similar to the reference and that were very different than in the comparable scenario without a cost constraint: there were fewer and larger retention patches, and these retained areas were of comparable age, slightly shorter, less dense, had much lower GMV and NDVI, and showed a much higher degree of spatial overlap with the reference (Figure 4). The application of the aggregation or site wetness constraints had little effect on mean NDVI or canopy height. Differences among scenarios with the three site wetness levels were minimal when the cost constraint was in place; without it, a preference for drier sites resulted in higher deciduous density while a preference for wetter sites resulted in retention patches with higher conifer density and greater gross merchantable volume, with a larger proportion of older stands generally.
The comparison of the scenarios in the context of the three objectives demonstrated that they all performed as well or better than the reference. Further, those comparisons suggested that some scenarios could successfully achieve multiple objectives; for example, DryWeightCost.
An interesting outcome of the scenarios is that they included more areas identified as grassland/shrubland than did the reference (business-as-usual) approach. Although our study landbase was mesic upland boreal forest targeted for commercial forestry, it would naturally include some small patches with less dense, or lower height tree cover that would be identified as grassland or shrubland in the forest inventory. Our scenarios did not specifically prohibit the inclusion of such patches in retention. A planning forester would, however, be unlikely to map out such an area as a retention patch. It is worth considering the value of including such areas in an overall retention design, as they are an important part of finer-scale forest heterogeneity and there could be biodiversity benefits to leaving them undisturbed, particularly if they are contained within a larger forested retention patch.
The approach we demonstrate provides a variety of outputs that would be useful to a planning forester. In addition to metrics on size, number, and spatial distribution of retention patches under different constraints, the heatmap provides a simple tool for selecting areas for retention based on how often they were chosen under the varying scenarios. One benefit of Zonation comes from the ranked output. We limited our retention patches to the top 8% most valuable pixels in terms of biodiversity values to match the 8% of retention implemented by industry for ease of comparison in our example, but this threshold could be changed to match any retention objective. For example, in the Province of Alberta, retention objectives in forest management plans currently range from 3 to 15%. Another potential benefit of the approach we present here is the level of complexity that can be integrated. Considering the push toward the management of forests as complex networks fulfilling a range of functions and providing a range of ecosystem services (Messier et al., 2019), spatial conservation planning is promising as it can consider multiple values at once and allows for the creation of management scenarios that can then be fed into timber supply models to assess long-term yields. Plus, working on small landscapes, as shown here, can allow for the implementation of small-scale variable solutions, helping to fulfill different objectives across a larger landscape. This could include, for example, nesting finer-scale planning for retention within larger-scale residual planning, for example riparian buffers, in order to consider connectivity within the context of the “functional complex network” concept (Messier et al., 2019). Here, we focused on analyzing prioritization for retention within cutblock areas. A priority for future work with SCP tools would be to investigate, in a more integrated way, the joint influence of in-block retention and forest areas conserved in the course of planning prior to planning for retention (e.g., stream buffers etc.).
The use of tools such as Zonation could also help address more fundamental research problems related to emulation of natural disturbances, which is the inspiration for retention forestry in many parts of the world (Gustafsson et al., 2012). For example, in western Canada the practice of RF and the patterns created post-harvest (dispersed retention, patch retention) are inspired by forest fire residuals, or refugia. Previous empirical work provides a basis for understanding natural patterns resulting from wildfire in the boreal forest (Andison, 2012; Andison and McCleary, 2014), and other works suggest that landscape wetness could drive this pattern (Krawchuk et al., 2016; Rogeau et al., 2018; Whitman et al., 2018). In Alberta’s managed forests, detailed spatial information on burned and unburned areas within most wildfires is now being delineated and may function as another point of comparison for outputs of prioritization from Zonation. In a time of fire regime change, this approach is valid for management and forest adaptation purposes.
Limitations
As RF becomes increasingly popular around the globe, there is an urgent need for the development of open-access tools and reproducible approaches, such as demonstrated herein, to plan retention in the face of competing objectives. Our goal was to contribute to this challenge by demonstrating the utility of a systematic conservation planning approach. Thus, we felt constrained to put it in the context of an existing retention plan for comparison purposes. Future work should consider application of various scenarios to more areas with a variety of operationally-planned retention.
Our paper focuses specifically on the placement of island retention patches within harvested areas and does not directly deal with larger landscape connectivity issues that are affected by cutblock placement and the unharvested areas between cutblocks. The latter is an important issue but is beyond the scope of this paper. Island retention does contribute to landscape connectivity values so future research could assess how island retention within cutblocks affects landscape connectivity but this kind of study would need to control for other landscape patterns that this study was not able to control for.
Our modeling work is a simplification of otherwise complex ecological processes controlling the occurrence of unburned patches (Stockdale et al., 2016), the inspiration for retention forestry (RF). However, simplicity is always advocated when starting conservation design, and this study did not try to reproduce the spatial pattern of what would naturally be occurring during a high-severity fire. That being said, our approach could gain from further testing and tuning of Zonation’s parameters; in particular, there is a need to find the right set of parameters to create larger patches and to limit fragmentation. For instance, we used a low Boundary Length Penalty (BLP) value to give the model freedom to design small patches of high conservation value where needed; although such choice leads to a diversity of dispersed patch sizes that likely lines up with natural (and often random) fire refugia occurrence, it does not produce an economically viable solution for foresters. On the converse, too high a BLP value would lead to simpler patch shape and pattern, which would be easier to implement but would result in a strong decrease in conservation values. It is unknown at the moment if finding the “right” BLP value would suffice or if the best solution lies in the use of values within a “goldilocks” range.
Although we have incorporated multiple data streams into our analyses, future analyses may benefit from the inclusion of additional variables or by refining data inputs. First, in the absence of a comprehensive set of species distribution variables, using information on well-known umbrella species could help further refine the results (Meurant et al., 2018). Second, the cost layer could be refined in future work, as how “cost” is defined is a complex issue. For example, in this study, cost was defined simply as timber revenue loss, however, one can argue that there is also a cost of losing rare or endangered species’ habitat or areas providing important, maybe irreplaceable, ecosystem services. From a forest management perspective, timber revenue loss could also be offset by reduction of other costs. For example, as retention patches facilitate natural regeneration, planting costs may be reduced. We argue that more work should be done developing a cost layer that mixes competing interests.
Data Availability Statement
The data analyzed in this study is subject to the following licenses/restrictions: A part of the original datasets used in this study were provided by a private partner that does not allow public access to the information. Requests to access these datasets should be directed to Gordon Whitmore, Z29yZG9uLndoaXRtb3JlQG1lcmNlcmludC5jb20=.
Author Contributions
SN and SM developed the initial concept and obtained funding. F-NR and SN designed the study. JS, CB, CN, and SM provided updates on the study design. CB processed and provided the supplementary input data. F-NR prepared the inputs, performed modeling, and processed model outputs. F-NR, SN, CN, and SM analyzed the results. All co-authors helped with the writing of the manuscript.
Funding
Research funding was provided by a Natural Sciences and Engineering Research Council (NSERC) Strategic Partnership Grant (Grant Number: STPGP 447251).
Conflict of Interest
The authors declare that the research was conducted in the absence of any commercial or financial relationships that could be construed as a potential conflict of interest.
Acknowledgments
We acknowledged the support from Mercer International – Peace River Pulp (formerly Daishowa-Marubeni International Ltd.) particularly Gordon Whitmore, as well as the Government of Alberta through the provision of the necessary spatial data for the completion of this work. The depth-to-water data were created by Jae Ogilvie and colleagues at the University of New Brunswick.
Supplementary Material
The Supplementary Material for this article can be found online at: https://www.frontiersin.org/articles/10.3389/fevo.2020.584291/full#supplementary-material
Footnotes
References
Ågren, A. M., Lidberg, W., Strömgren, M., Ogilvie, J., and Arp, P. A. (2014). Evaluating digital terrain indices for soil wetness mapping – a Swedish case study. Hydrol. Earth Syst. Sci. 18, 3623–3634. doi: 10.5194/hess-18-3623-2014
Ahmad, B., Wang, Y., Hao, J., Liu, Y., Bohnett, E., and Zhang, K. (2018). Optimizing stand structure for trade-offs between overstory timber production and understory plant diversity: a case-study of a larch plantation in northwest China. L. Degrad. Dev. 29, 2998–3008. doi: 10.1002/ldr.3070
Alberta (2006b). Partial Harvest (Non-clearcut) Planning and Monitoring Guidelines: A Supplement to the Alberta Forest Management Planning Standard. Edmonton: Alberta.
Anderson, M. J. (2006). Distance-based tests for homogeneity of multivariate dispersions. Biometrics 62, 245–253. doi: 10.1111/j.1541-0420.2005.00440.x
Anderson, M. J., Ellingsen, K. E., and McArdle, B. H. (2006). Multivariate dispersion as a measure of beta diversity. Ecol. Lett. 9, 683–693. doi: 10.1111/j.1461-0248.2006.00926.x
Andison, D. W. (2012). The influence of wildfire boundary delineation on our understanding of burning patterns in the Alberta foothills. Can. J. For. Res. 42, 1253–1263. doi: 10.1139/X2012-074
Andison, D. W., and McCleary, K. (2014). Detecting regional differences in within-wildfire burn patterns in western boreal Canada. For. Chron. 90, 59–69. doi: 10.5558/tfc2014-011
Attiwill, P. M. (1994). The disturbance of forest ecosystems: the ecological basis for conservative management. For. Ecol. Manage. 63, 247–300. doi: 10.1016/0378-1127(94)90114-7
Bartels, S. F., Caners, R. T., Ogilvie, J., White, B., and Macdonald, S. E. (2018a). Relating bryophyte assemblages to a remotely sensed depth-to-water index in Boreal Forests. Front. Plant Sci. 9:858. doi: 10.3389/fpls.2018.00858
Bartels, S. F., James, R. S., Caners, R. T., and Macdonald, S. E. (2019). Depth-to-water mediates bryophyte response to harvesting in boreal forests. J. Appl. Ecol. 56, 1256–1266. doi: 10.1111/1365-2664.13359
Bartels, S. F., Macdonald, S. E., Johnson, D., Caners, R. T., and Spence, J. R. (2018b). Bryophyte abundance, diversity and composition after retention harvest in boreal mixedwood forest. J. Appl. Ecol. 55, 947–957. doi: 10.1111/1365-2664.12999
Bergeron, Y., Gauthier, S., Kafka, V., Lefort, P., and Lesieur, D. (2001). Natural fire frequency for the eastern Canadian boreal forest: consequences for sustainable forestry. Can. J. For. Res. 31, 384–391. doi: 10.1139/x00-178
Bergeron, Y., Harvey, B. J., Leduc, A., and Gauthier, S. (1999). Forest management guidelines based on natural disturbance dynamics: stand-and forest-level considerations. For. Chron. 75, 49–54. doi: 10.5558/tfc75049-1
Bjelanovic, I., Comeau, P., and White, B. (2018). High resolution site index prediction in boreal forests using topographic and wet areas mapping attributes. Forests 9:113. doi: 10.3390/f9030113
Bose, A. K., Harvey, B. D., Brais, S., Beaudet, M., and Leduc, A. (2014). Constraints to partial cutting in the boreal forest of Canada in the context of natural disturbance-based management: a review. Forestry 87, 11–28. doi: 10.1093/forestry/cpt047
Burton, P. J., Messier, C., Adamowicz, W. L., and Kuuluvainen, T. (2006). Sustainable management of Canada’s boreal forests: progress and prospects. Écoscience 13, 234–248. doi: 10.2980/i1195-6860-13-2-234.1
Cook, E. A., Iverson, L. R., and Graham, R. L. (1989). Estimating forest productivity with Thematic Mapper and biogeographical data. Remote Sens. Environ. 28, 131–141. doi: 10.1016/0034-4257(89)90111-9
Coops, N. C. (2015). Characterizing forest growth and productivity using remotely sensed data. Curr. For. Rep. 1, 195–205. doi: 10.1007/s40725-015-0020-x
Coops, N. C., Tompaski, P., Nijland, W., Rickbeil, G. J. M., Nielsen, S. E., Bater, C. W., et al. (2016). A forest structure habitat index based on airborne laser scanning data. Ecol. Indic. 67, 346–357. doi: 10.1016/j.ecolind.2016.02.057
Drusch, M., Del Bello, U., Carlier, S., Colin, O., Fernandez, V., Gascon, F., et al. (2012). Sentinel-2: ESA’s optical high-resolution mission for GMES operational services. Remote Sens. Environ. 120, 25–36. doi: 10.1016/j.rse.2011.11.026
Echiverri, L., and Macdonald, S. E. (2019). Utilizing a topographic moisture index to characterize understory vegetation patterns in the boreal forest. For. Ecol. Manage. 447, 35–52. doi: 10.1016/j.foreco.2019.05.054
Echiverri, L. F. I., and Macdonald, S. E. (2020). A topographic moisture index explains understory vegetation response to retention harvesting. For. Ecol. Manage. 474:118358. doi: 10.1016/j.foreco.2020.118358
Environmental Systems Research Institute (2017). ArcGIS: Release 10.5 for Desktop. Redlands, CA: Environmental Systems Research Institute.
Ezquerro, M., Pardos, M., and Diaz-Balteiro, L. (2016). Operational research techniques used for addressing biodiversity objectives into forest management: an overview. Forests 7:229. doi: 10.3390/f7100229
Ezquerro, M., Pardos, M., and Diaz-Balteiro, L. (2019). Integrating variable retention systems into strategic forest management to deal with conservation biodiversity objectives. For. Ecol. Manage. 433, 585–593. doi: 10.1016/j.foreco.2018.11.003
Fedrowitz, K., Koricheva, J., Baker, S. C., Lindenmayer, D. B., Palik, B., Rosenvald, R., et al. (2014). Can retention forestry help conserve biodiversity? A meta-analysis. J. Appl. Ecol. 51, 1669–1679. doi: 10.1111/1365-2664.12289
Franklin, J. F., Berg, D. F., Thornburg, D., and Tappeiner, J. C. (1997). “Alternative silvicultural approaches to timber harvesting: variable retention harvest systems,” in Creating a Forestry for the 21st Century: The Science of Ecosystem Management, eds K. A. Kohm and J. F. Franklin (Washington, D.C: Island Press), 111–140.
Gustafsson, L., Baker, S. C., Bauhus, J., Beese, W. J., Brodie, A., Kouki, J., et al. (2012). Retention forestry to maintain multifunctional forests: a world perspective. Bioscience 62, 633–645. doi: 10.1525/bio.2012.62.7.6
Hauer, G., Cumming, S. G., Schmiegelow, F., Adamowicz, W. L., Weber, M., and Jagodzinski, R. (2010). Tradeoffs between forestry resource and conservation values under alternate policy regimes: a spatial analysis of the western Canadian boreal plains. Ecol. Modell. 221, 2590–2603. doi: 10.1016/j.ecolmodel.2010.07.013
Kane, V. R., Bakker, J. D., McGaughey, R. J., Lutz, J. A., Gersonde, R. F., and Franklin, J. F., (2010). Examining conifer canopy structural complexity across forest ages and elevations with LiDAR data. Can. J. For. Res. 40, 774–787. doi: 10.1139/X10-064
Krawchuk, M. A., Haire, S. L., Coop, J., Parisien, M.-A., Whitman, E., Chong, G., et al. (2016). Topographic and fire weather controls of fire refugia in forested ecosystems of northwestern North America. Ecosphere 7:e01632. doi: 10.1002/ecs2.1632
Lefsky, M. A., Cohen, W. B., Harding, D. J., Parker, G. G., Acker, S. A., and Gower, S. T. (2002). Lidar remote sensing of above-ground biomass in three biomes. Glob. Ecol. Biogeogr. 11, 393–399. doi: 10.1046/j.1466-822x.2002.00303.x
Lehtomäki, J., and Moilanen, A. (2013). Methods and workflow for spatial conservation prioritization using Zonation. Environ. Model. Softw. 47, 128–137. doi: 10.1016/j.envsoft.2013.05.001
Lehtomäki, J., Tomppo, E., Kuokkanen, P., Hanski, I., and Moilanen, A. (2009). Applying spatial conservation prioritization software and high-resolution GIS data to a national-scale study in forest conservation. For. Ecol. Manage. 258, 2439–2449. doi: 10.1016/j.foreco.2009.08.026
Macdonald, S. E., and Fenniak, T. E. (2007). Understory plant communities of boreal mixedwood forests in western Canada: natural patterns and response to variable-retention harvesting. For. Ecol. Manage. 242, 34–48. doi: 10.1016/j.foreco.2007.01.029
Margules, C. R., and Pressey, R. L. (2000). Systematic conservation planning. Nature 405, 243–253. doi: 10.1038/35012251
Mazziotta, A., Podkopaev, D., Triviño, M., Miettinen, K., Pohjanmies, T., and Mönkkönen, M. (2017). Quantifying and resolving conservation conflicts in forest landscapes via multiobjective optimization. Silva Fenn. 51, 1–9. doi: 10.14214/sf.1778
Messier, C., Bauhus, J., Doyon, F., Maure, F., Sousa-Silva, R., Nolet, P., et al. (2019). The functional complex network approach to foster forest resilience to global changes. For. Ecosyst. 6:21. doi: 10.1186/s40663-019-0166-2
Meurant, M., Gonzalez, A., Doxa, A., and Albert, C. H. (2018). Selecting surrogate species for connectivity conservation. Biol. Conserv. 227, 326–334. doi: 10.1016/j.biocon.2018.09.028
Mitchell, S. J., and Beese, W. J. (2002). The retention system:reconciling variable retention with the principles of silvicultural systems. For. Chron. 78, 397–403. doi: 10.5558/tfc78397-3
Moilanen, A. (2007). Landscape Zonation, benefit functions and target-based planning: unifying reserve selection strategies. Biol. Conserv. 134, 571–579. doi: 10.1016/j.biocon.2006.09.008
Moilanen, A. (2008). Generalized complementarity and mapping of the concepts of systematic conservation planning. Conserv. Biol. 22, 1655–1658. doi: 10.1111/j.1523-1739.2008.01043.x
Moilanen, A., Franco, A. M., Early, R. I, Fox, R., Wintle, B., and Thomas, C. D. (2005). Prioritizing multiple-use landscapes for conservation: methods for large multi-species planning problems. Proc. R. Soc. B Biol. Sci. 272, 1885–1891. doi: 10.1098/rspb.2005.3164
Moilanen, A., Montesino Pouzols, F., Meller, L., Veach, V., Arponen, A., Leppänen, J., et al. (2014). ZONATION Version 4 – User Manual. V4 ed. Helsinki: C-BIG Conservation Biology Informatics Group, University of Helsinki.
Murphy, P. N. C., Ogilvie, J., and Arp, P. A. (2009). Topographic modelling of soil moisture conditions: a comparison and verification of two models. Eur. J. Soil Sci. 60, 94–109. doi: 10.1111/j.1365-2389.2008.01094.x
Murphy, P. N. C., Ogilvie, J., Castonguay, M., Zhang, C. F., Meng, F. R., and Arp, P. A. (2008a). Improving forest operations planning through high-resolution flow-channel and wet-areas mapping. For. Chron. 84, 568–574. doi: 10.5558/tfc84568-4
Murphy, P. N. C., Ogilvie, J., Connor, K., and Arp, P. A. (2007). Mapping wetlands: a comparison of two different approaches for New Brunswick, Canada. Wetlands 27, 846–854. doi: 10.1672/0277-5212(2007)27[846:mwacot]2.0.co;2
Murphy, P. N. C., Ogilvie, J., Meng, F.-R., and Arp, P. A. (2008b). Stream network modelling using lidar and photogrammetric digital elevation models: a comparison and field verification. Hydrol. Process. 22, 1747–1754. doi: 10.1002/hyp.6770
Murphy, P. N. C., Ogilvie, J., Meng, F.-R., White, B., Bhatti, J. S., and Arp, P. A. (2011). Modelling and mapping topographic variations in forest soils at high resolution: a case study. Ecol. Modell. 222, 2314–2332. doi: 10.1016/j.ecolmodel.2011.01.003
Nijland, W., Coops, N. C., Ellen Macdonald, S., Nielsen, S. E., Bater, C. W., and John Stadt, J. (2015a). Comparing patterns in forest stand structure following variable harvests using airborne laser scanning data. For. Ecol. Manage. 354, 272–280. doi: 10.1016/j.foreco.2015.06.005
Nijland, W., Coops, N. C., Macdonald, S. E., Nielsen, S. E., Bater, C. W., White, B., et al. (2015b). Remote sensing proxies of productivity and moisture predict forest stand type and recovery rate following experimental harvest. For. Ecol. Manage. 357, 239–247. doi: 10.1016/j.foreco.2015.08.027
Oksanen, J., Guillaume, F., Blanchet, M. F., Kindt, R., Legendre, P., McGlinn, D. J., et al. (2019). vegan v2.5-6 – Community Ecology Package. Available online at: https://cran.r-project.org/web/packages/vegan/index.html (accessed March 2019).
Oltean, G. S., Comeau, P. G., and White, B. (2016). Linking the Depth-to-Water Topographic Index to Soil Moisture on Boreal Forest Sites in Alberta. For. Sci. 62, 154–165. doi: 10.5849/forsci.15-054
Puettmann, K. J., Coates, K. D., and Messier, C. C. (2009). A critique of silviculture: managing for complexity. Choice Rev. Online 46, 46–5609. doi: 10.5860/choice.46-5609
R Core Team (2019). R: A Language and environment for Statistical Computing. Available online at: http://www.r-project.org (accessed March 2019).
Rogeau, M. P., Barber, Q. E., and Parisien, M. A. (2018). Effect of topography on persistent fire refugia of the Canadian Rocky mountains. Forests 9:285.
RStudio Team (2015). RStudio: Integrated Development for R. Available online at: https://rstudio.com/ (accessed July 2015).
Sewell, P. D., Quideau, S. A., Dyck, M., and Macdonald, E. (2020). Long-term effects of harvest on boreal forest soils in relation to a remote sensing-based soil moisture index. For. Ecol. Manage. 462:117986. doi: 10.1016/j.foreco.2020.117986
Stockdale, C., Flannigan, M., and Macdonald, E. (2016). Is the END (emulation of natural disturbance) a new beginning? A critical analysis of the use of fire regimes as the basis of forest ecosystem management with examples from the Canadian western Cordillera. Environ. Rev. 24, 233–243.
Tucker, C. J. (1979). Red and photographic infrared linear combinations for monitoring vegetation. Remote Sens. Environ. 8, 127–150. doi: 10.1016/0034-4257(79)90013-90010
Van der Plas, F., Ratcliffe, S., Ruiz-Benito, P., Scherer-Lorenzen, M., Verheyen, K., Wirth, C., et al. (2018). Continental mapping of forest ecosystem functions reveals a high but unrealised potential for forest multifunctionality. Ecol. Lett. 21, 31–42. doi: 10.1111/ele.12868
Venier, L. A., Thompson, I. D., Fleming, R., Malcolm, J., Aubin, I., Trofymow, J. A., et al. (2014). Effects of natural resource development on the terrestrial biodiversity of Canadian boreal forests. Environ. Rev. 22, 457–490. doi: 10.1139/er-2013-0075
White, B., Ogilvie, J., Campbell, D. M. H. M. H., Hiltz, D., Gauthier, B., Chisholm, H. K. H., et al. (2012). Using the cartographic depth-to-water index to locate small streams and associated wet areas across landscapes. Can. Water Resour. J. Rev. Can. Des Ressour. Hydriques 37, 333–347. doi: 10.4296/cwrj2011-909
Whitman, E., Parisien, M.-A., Thompson, D., and Flannigan, M. (2018). Topoedaphic and forest controls on post-fire vegetation assemblies are modified by fire history and burn severity in the Northwestern Canadian Boreal Forest. Forests 9:151. doi: 10.3390/f9030151
Work, T. T., Spence, J. R., Volney, W. J. A., Morgantini, L. E., and Innes, J. L. (2003). Integrating biodiversity and forestry practices in western Canada. For. Chron. 79, 906–916. doi: 10.5558/tfc79906-5
Keywords: conservation planning, prioritization model, retention, forest management, biodiversity, sustainable forestry
Citation: Robinne F-N, Stadt JJ, Bater CW, Nock CA, Macdonald SE and Nielsen SE (2020) Application of the Conservation Planning Tool Zonation to Inform Retention Planning in the Boreal Forest of Western Canada. Front. Ecol. Evol. 8:584291. doi: 10.3389/fevo.2020.584291
Received: 16 July 2020; Accepted: 17 November 2020;
Published: 07 December 2020.
Edited by:
Marie-Josee Fortin, University of Toronto, CanadaReviewed by:
David Andison, The University of British Columbia, CanadaDavid L. Martell, University of Toronto, Canada
Copyright © 2020 Robinne, Stadt, Bater, Nock, Macdonald and Nielsen. This is an open-access article distributed under the terms of the Creative Commons Attribution License (CC BY). The use, distribution or reproduction in other forums is permitted, provided the original author(s) and the copyright owner(s) are credited and that the original publication in this journal is cited, in accordance with accepted academic practice. No use, distribution or reproduction is permitted which does not comply with these terms.
*Correspondence: François-Nicolas Robinne, cm9iaW5uZUB1YWxiZXJ0YS5jYQ==