 Yiying Li
 Zehao Shen*
- MOE Key Laboratory for Earth Surface Processes, College of Urban and Environmental Sciences, Institute of Ecology, Peking University, Beijing, China
Biological invasion pose a severe threat to global biodiversity, and studies of bioinvasion patterns and the underlying mechanisms provide critical tests to ecological theories. China is a global hotspot of biodiversity and also biological invasions. The understanding of mechanisms for bioinvasion patterns has been limited by inadequacy of data spatial resolution, and lack of a historical perspective. This study compiled the first nation-scale distribution data with a sub-provincial spatial unit (prefecture) for 463 invasive alien plants species (IAPS) recorded in China, as well as their introduction times. The spatiotemporal patterns of species richness of invasive alien plants, including three life forms (annual-biennial, perennial, and woody) were explored, then related the species richness patterns with environmental, social-economic and historical factors. Statistical analyses included quantile regression, generalized linear model (GLM), and hierarchical variation partitioning. The results indicated that: (1) herbaceous species comprised 84% of the 463 IAPS in China; (2) plant introductions into China accelerated since 1800, reaching the maximum rate during 1900–1940. IAPS richness had a closer correlation with the time of newest introduction (R2 = 0.155) than with that of the oldest introduction (R2 = 0.472); (3) IAPS richness decreases with increasing latitude (r = −0.32, P < 0.001) and decreases from the coastal and southern terrestrial borders to inland regions, but doesn’t increase with prefecture size. The three life forms of IAPS showed similar latitudinal patterns of species richness and divergent latitudinal patterns of species percentage. (4) IAPS richness showed significantly positive correlations with thermal climate and a negative relationship with climate seasonality. GLM explained up to 65% of the variation in spatial patterns of IAPS and three life forms; with much less variation explained in the species percentage patterns. The year of the most recent IAPS introduction and the low temperature limit jointly dominated spatial patterns of IAPS richness in China, whereas road density showed little effect. Therefore, global warming and economic globalization play a prominent role in promoting biological invasion in the last few decades, and will continue to drive the trend of plant invasion in China and probably elsewhere.
Introduction
Along with globalization, anthropogenic species migration has accelerated (Seebens et al., 2018). An invasive alien species (IAS) is defined as a species of plant, animal, pathogen, or other organisms that are non-native to an ecosystem, where it may cause economic or environmental harm or adversely affect human health1. Biological invasions occur globally and they have become one of the primary threats to biodiversity, and cause huge losses to ecosystem functions and services, as well as public wealth (Pimentel et al., 2005; Pejchar and Mooney, 2009; Simberloff et al., 2013). It is estimated that the global loss caused by biological invasions is equivalent to 5% of gross domestic product (GDP) every year (Pimentel, 2002).
Since the pioneer work of Elton (1958), species invasiveness and habitat invasibility have been the central issues of biological invasion studies. Species related studies often focus on the effects of physiological characteristics, functional traits, and life history strategies of IAS (Davidson et al., 2011). Researches on invasive species diversity generally address the distribution patterns of invasive organisms and the habitat conditions affecting the dispersal and adaptation processes (Hierro et al., 2005; Denslow et al., 2009; Khuroo et al., 2012; Murray and Phillips, 2012) (e.g., environmental invulnerability), in order to predict potentially high-invasion risk areas (Zhu et al., 2007; Wolmarans et al., 2010), and to explore invasion mechanisms relating with environmental filters, dispersal pathways, and ecosystem resistance (Nentwig, 2007; Westphal et al., 2008; Pyšek et al., 2015; Dawson et al., 2017). Moreover, the study of invasive species diversity also seeks for novel understanding on the basic ecological problems of community assembly and species coexistence (Davis et al., 2005; Guisan et al., 2014).
Empirically, habitat disturbances erase standing vegetation and generate empty niches that facilitate biological invasions (Houseman et al., 2014; Jauni et al., 2015; Schrama and Bardgett, 2016). However, IAS richness is generally higher in habitats with high native biodiversity (Stohlgren et al., 1999; Pys̆ek et al., 2002; Bhattarai et al., 2014). These conflicting phenomena are induced by a set of scale dependent environmental filters that are critical for biological invasions (Milbau et al., 2009).
At regional to global scales, IAS diversity generally decrease with an increase in latitude, and low temperature normally acts as a primary limiting factor for the pattern, same as for the patterns of native species diversity (Sax, 2001; Pyšek et al., 2017). At the landscape scale, vegetation disturbances and land use changes (e.g., urbanization) commonly cause habitat fragmentation and degradation, intensify soil erosion, nutrient loss and water body eutrophication, and facilitate biological invasions in both terrestrial and aquatic habitats (Nentwig, 2007; Wang et al., 2011; Song et al., 2017; Wu et al., 2017). Because IAS generally has better dispersal capacity and wider environmental tolerance than native species, natural and anthropogenic landscape corridors also intensify bioinvasions (Minor et al., 2009; Resasco et al., 2014). At the local community scale, biotic and abiotic factors play a simultaneous role. Community structure show a prominent effect on resistance to bioinvasion (Houseman et al., 2014; Giorgis et al., 2016); the effects of soil fertility and soil microbes on plants also complicate the relationship between habitat invasibility and species invasiveness (Traveset and Richardson, 2014; Schrama and Bardgett, 2016).
Moreover, the positive correlation between introduction time and the distribution range of invasive species has been emphasized increasingly (Kowarik, 1995; Wu et al., 2004; Müllerová et al., 2005; Horvitz et al., 2017). The potential for species invasion generally increases with an increase of introduction time. A Hawaiian study found that only 1.8% of all alien species became invasive species, while 11% of those introduced more than 90 years ago became IAS (Schmidt and Drake, 2011). Introduction time is sometimes more important than species attributes in explaining the invasive nature of species (Pyšek and Jarošík, 2005; Pyšek et al., 2015). Therefore, when considering bioinvasion trends, the impact of introduction time or the time lag of the invasion should not be ignored.
The introduction of IAS into China has a long history and has caused great harm to the environment and economy of the country. For example, in Shanghai alone, the invasive species Solidago canadensis L. has eliminated more than 30 species of native plants in 20 years (Xu et al., 2006); Eupatorium adenophorum alone has caused a total of ¥119 million RMB per year of economic losses in Sichuan Province (Wan et al., 2009). Since Ding and Wang (1998) first listed invasive alien plant species and their provincial distribution in China, the list has been continuously updated to 188 species (Xu et al., 2004), 126 species (Liu et al., 2006), 270 species (Weber et al., 2008), 265 species (Xu et al., 2012), 515 species (Yan et al., 2014), and 404 species (Chen et al., 2017). In the last 20 years, a growing number of studies have addressed the geographical distribution and introduction mode (Chen et al., 2017), diffusion direction (Huang et al., 2012; Xu et al., 2012), origin (Weber et al., 2008; Yan et al., 2014), and influencing factors in plant invasions in China. Factors that are known to significantly affect IAS richness include annual mean temperature, annual precipitation, population density, GDP (Zhang et al., 2010), native species diversity (Weber et al., 2008; Wang et al., 2017), and the phylogenetic relationships between alien and native species (Zheng et al., 2018).
Although a body of evidence on the distribution of IAS in China is accumulating, the data resolution of national studies have all been at the provincial scale (e.g., Yan et al., 2014; Chen et al., 2017; Wang et al., 2017), and studies based on local data generally covered no larger than provincial regions (e.g., Feng et al., 2009). The unified real-time monitoring data at national scale is still lacking. By integrating the information of invasive alien plant species (IAPS) in the published literature, specimens, field surveys, and online database records, this research attempts to build the first database of IAPS distribution, origin, and introduction time in China below the provincial scale, and to quantify the impact of natural and social-economic factors on plant invasions.
Since speciation and extinction processes are ignorable in determining the geographical distribution of invasive species, we hypothesized that, the geographical patterns of IAPS diversity in China should be primarily constrained by the current environmental filters and dispersal conditions, as well as vital ecological traits of species. Specifically, this study attempts to answer the following questions: (1) How are spatiotemporal patterns of IAPS diversity in China affected by different life-forms? (2) What are the differences in the roles of environmental filtering and diffusion restriction in the distribution of IAPS diversity? (3) Which factor, natural environmental or human habitat disturbance, plays the largest role in determining the distribution of invasive plants in China?
Materials and Methods
List of Invasive Plants and Species Attributes Data
All known IAPS in China were included in the study, a total of 463 species. The list, biological attributes, and distribution data of these invasive plants were drawn from “The Survey Report of Invasive Plants in China” edited by Ma (2014). Ma integrated field investigation reports with specimen information and historical documents, recorded general and species specific information of invasive plants in eight regions comprising China, including Northeast China, North China, Northwest China, Central China, East China, South China, Central South China, and Southwest China. Information on invasive species compiled for each region included (but not limited to) species name, place of origin, introduction time, introduction mode, route of transmission, habitat, hazard level, county- or prefecture-level geographical distribution, as well as specimen information. Additional information about invasive plant distribution in China was obtained from the literature (Weber et al., 2008; Chen et al., 2017) and the Global Biodiversity Information Facility (GBIF) website (2018)2. The names of the species were integrated referring to the Plant List Database (The Plant List, 2013), with synonymous species removed from the list.
The objects of analyses in this paper were limited to those alien species explicitly identified in Ma (2014) as “invasive,” rather than all alien or naturalized species. The following fields are uniformly compiled for each species and included in this study: taxonomy, life form, introduction time, county- or prefecture-level distribution.
Time and Geographical Distribution Data of Species Introduction
We updated the species introduction time recorded in Ma (2014) by referring to GBIF records and recent literature (Weber et al., 2008; Chen et al., 2017). Plant introduction time, i.e., “minimum residence time” (MRT), which is common in invasion research, was obtained for 418 species. GBIF contributed approximately 10% of the total data, including the introduction times for 112 species not included in Ma (2014), and advanced the introduction time for 98 species (32%) of 306 species recorded in Ma (2014).
The geographical information data used in this study was from the Database of Global Administrative Areas (GADM, 2018). The confirmed distribution of each IAPS in counties and prefectures were systematically mapped to the shape file of China’s county administrative regions. For some ambiguous records, such as “coastal counties in Fujian province,” and “Southern Ganzhou Prefecture,” the names of counties or prefectures were further confirmed manually. Finally, about 64,000 records of IAPS distribution were collected and allocated to 2,312 county-level areas (120 counties in China have not been invaded). However, not all IAPS had complete county-level distribution information so the accuracy of species distribution data was adjusted from the county to the prefecture level so as to avoid incompleteness and inconsistency in data. The final data comprised distribution information on 463 IAPS in 346 prefecture-level regions of China, and introduction time (i.e., years from present) for 418 of these species.
Data of Natural and Social Environmental Factors
The climate data came from 19 bioclimatic variables with a resolution of 2.5′ arc (about 5 km) in database version 2.03. Seven bioclimatic variables were selected, with reference to earlier studies: mean annual temperature (MAT), mean annual precipitation (MAP), annual temperature range (ATR), coefficient of variance of precipitation (CVP), mean temperature of the warmest month (MTWM), mean temperature of the coldest month (MTCM), and the annual biological temperature (ABT) (Fang, 1994). The administrative region was taken as the spatial unit to calculate the average value of these climate factors. The topographic information of the study area was derived from the Shuttle Radar Topography Mission data published by United States Geological Survey, with a spatial resolution of 30″.
The socio-economic data was obtained from the database of Circle-Asia Economic Information Co., Ltd. (CEIC, insights.ceicdata.com, 2018). With reference to earlier studies, the GDP, population, and road mileage were selected to comprehensively reflect the habitat empty caused by human activities and exposure to bioinvasions (McKinney, 2002; Richardson and Pyšek, 2006). Bioinvasion is a long-term process, thus difficult to correspond to the social-economic conditions of a particular year. Assuming that a recent data can more completely reflect the cumulative effects of social-economic drivers, data for 2010 was selected to represent current conditions and to match the time of IAPS distribution data. Population data was converted into population density (per km2), road mileage into road density (km/km2) to eliminate the effect of area, and GDP data was converted into per capita GDP to more reasonably reflect economic intensity. Alien species enter the country from land or sea boundaries, and distance to a land boundary is a significant predictor of invasive species richness (Huang et al., 2012). However, because China’s population density and per capita GDP are significantly related to the distance to the coast and ports, the distance variable was not included in the following analyses.
Spatial Analysis and Statistics
We used the GIS software ArcGIS v 10.3 to establish the distribution range data of all IAPS and the environmental data of the study region. The Asia North Albers Equal Area Conic projection was applied to all data layer, uniformly taking the prefecture-level administrative region (“prefecture”) as the geographical unit of the maps. Overlaying maps of all IAPS resulted in a species richness map. The digital terrain data were resampled into 100 m resolution. The .shp file of the administrative map of the study area was overlaid with a map of each explanatory variable in grid or vector format, to extract the corresponding values by each polygon.
This study analyzed the causal factors of IAPS diversity with regard to environmental filtering and invasion probability, which were related to area, climate, introduction time, and social-economic factors (Table 1). Chen et al. (2017) suggested that the distributions of annual and biennial invasive plants respond similarly to climate gradients, different from perennial herbs and woody species. The effect of plant life-form on bioinvasion was explored here by dividing IAPS into three categories: annual and biennial herbs (ABHs), perennial herbs, and woody plants. Both species number and percentage of species in the three life forms were considered in the analyses. Pearson correlation coefficient was used to detect the relationship between continuous environmental variables and invasive species richness. One-way ANCOVA was used to test the bioinvasion difference between plant life-forms after accounting for the effect of introduction time. Quantile regression efficiently describes the conditional distribution of response variables relative to explanatory variables (Huang et al., 2012). Quantile regression was used to predict the relationship between the introduction time and the distribution area, so as to reflect the influence of the variability of dispersal rate on the distribution area of IAPS over a given time. Since species richness and species percentage as responsive variables do not follow normal distribution, a generalized linear model (GLM) combining with the hierarchical variation partitioning algorithm was applied to quantify contributions of interpretative variables. According to earlier studies, collinearity was generally present among predicting variables, thus routine steps of variable selection were applied to optimize the model structure (Shen et al., 2012). To evaluate the contribution of different factors to the spatial variations of IAPS richness patterns, partial regression was also applied to partition the total variation in species richness into four parts (Borcard et al., 1992): (1) independent components, i.e., the proportions of variance explained exclusively by the included factors, respectively, (2) co-varying component, i.e., the overlapping part of the explained variance by every pair two factors, (3) joint component, i.e., the part of explained variance as overlapping of three factors, and (4) residual variation. Based on the GLM results, in the partial regressions, we took climate, time of introduction, and social-economic condition as three independent factors for IAPS diversity patterns.
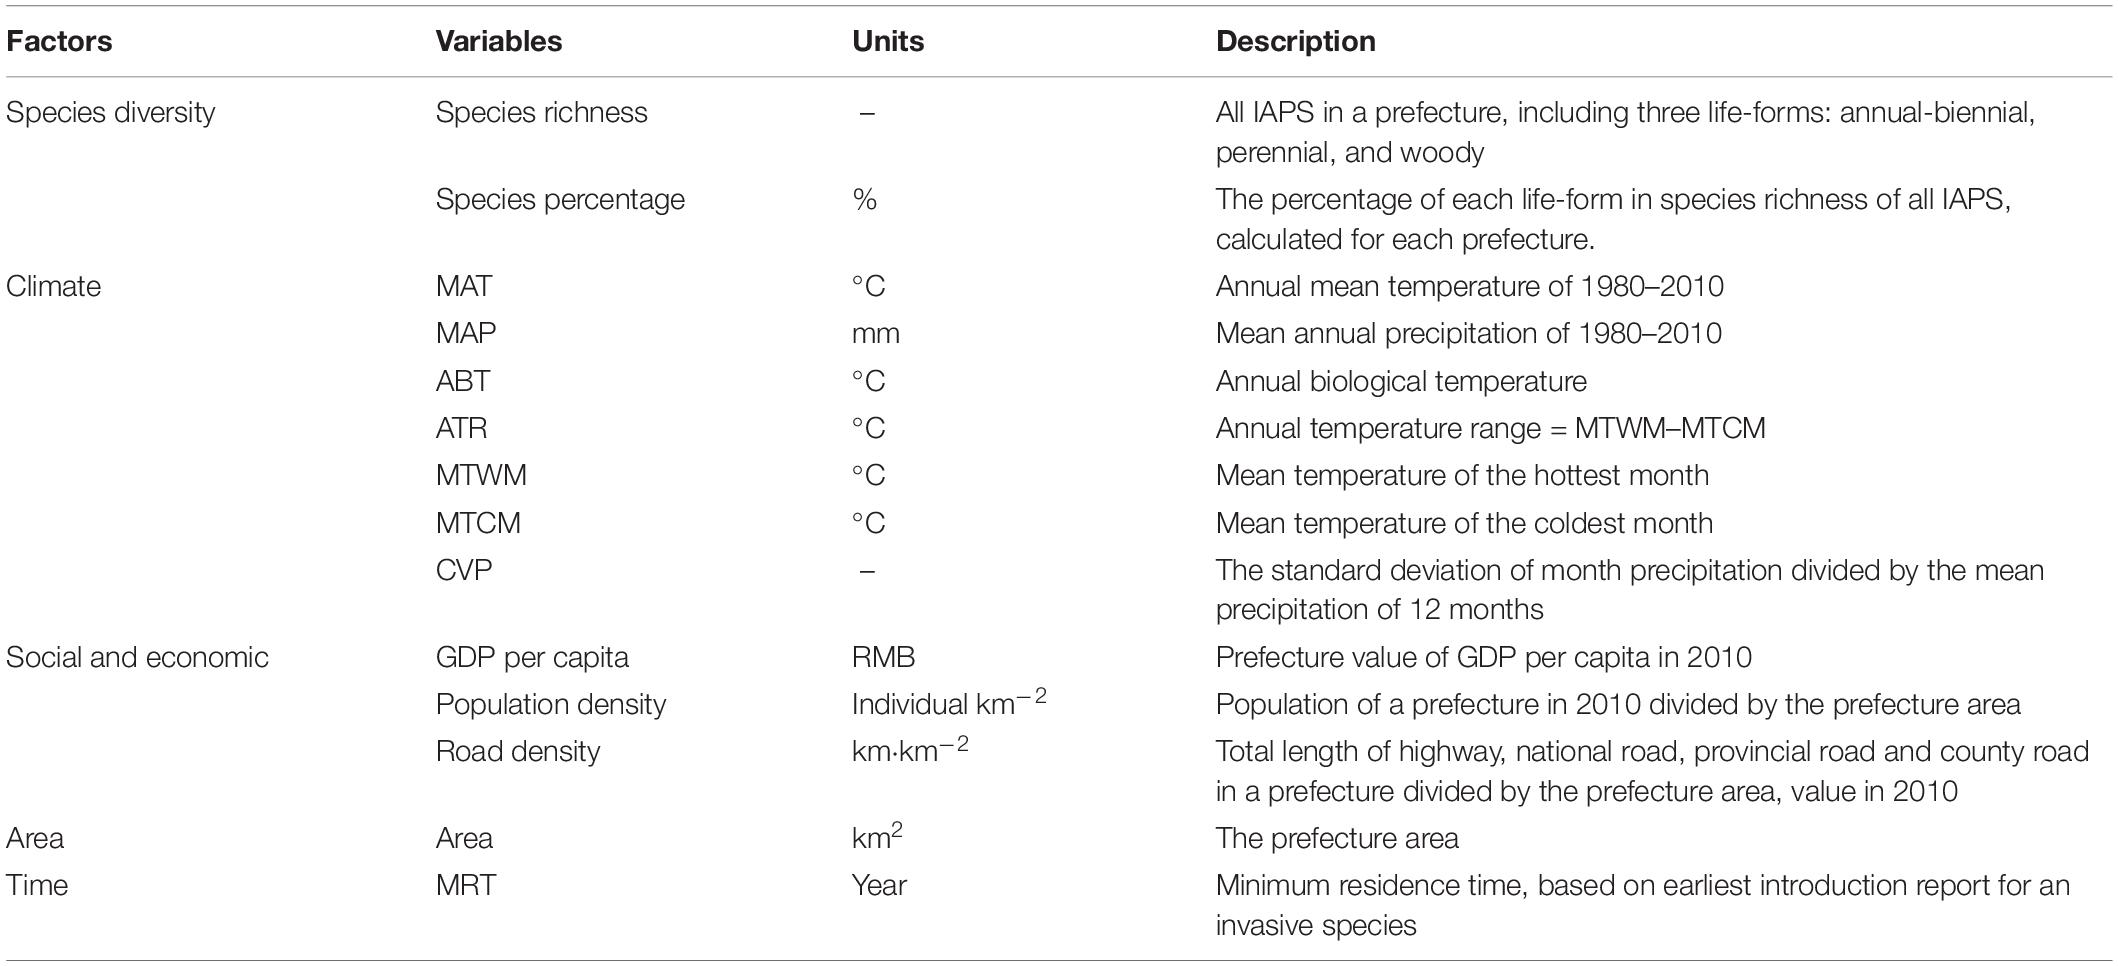
Table 1. Factors and variables for measuring and explaining the geographical pattern of invasive plant species richness in China.
All statistical analysis was completed in R (R Core Team, 2018). The R package used in the analysis includes hier.part, psych, quantreg, vegan.
Results
Species Diversity of IAPS and Temporal Profile of Introduction
There are 463 IAPS recorded in China, belonging to 271 genera and 65 families. The dominant ten families are Compositae (76 species), Leguminosae (66 species), Poaceae (46 species), Amaranthaceae (34 species), Solanaceae (23 species), Euphorbiaceae (18 species), Convolvulaceae (16 species), Brassicaceae (15 species), Onagraceae (12 species), and Plantaginaceae (11 species) (Supplementary Figure 1). The first five families account for half of the total IAPS. At the genus level, Amaranthus (15 species), Euphorbia (15 species), Solanum (12 species), Ipomoea (10 species) and Acacia (8 species) constituted the top five genera for invasive species richness. There were 391 species of herbs, accounting for 84.4% of all IAPS in China, including 254 species of ABHs and 137 species of perennials; 72 species of woody plants account for 15.6% of all IAPS.
The records of alien plants introduction into China can be traced back to 2000 years ago (Figure 1A), with Cannabis sativa and Coriander sativum comprising some of the earliest records; however, 80% of alien plant introductions have occurred since 1840. The rate of alien plant introduction accelerated rapidly in the 19th century. A total of 266 species (63.6%) invaded after 1900, among which 182 species invaded between 1900 and 1940. Regarding the introduction mode, 287 species of plants were intentionally introduced, and other 140 species were unintentionally introduced (or naturally disturbed). With regard to the distribution of the IAPS, species with the widest invasion range include Datura stramonium, Erigeron canadensis, and Hibiscus rustionum, which have invaded 212, 203 and 187 prefecture level administrative areas in China, respectively. In contrast, 117 species were present in 1–10 prefectures, 200 species were recorded in 11–50 prefectures, 90 species were in 51–100 prefectures, and 56 species have occupied more than 100 prefectures.
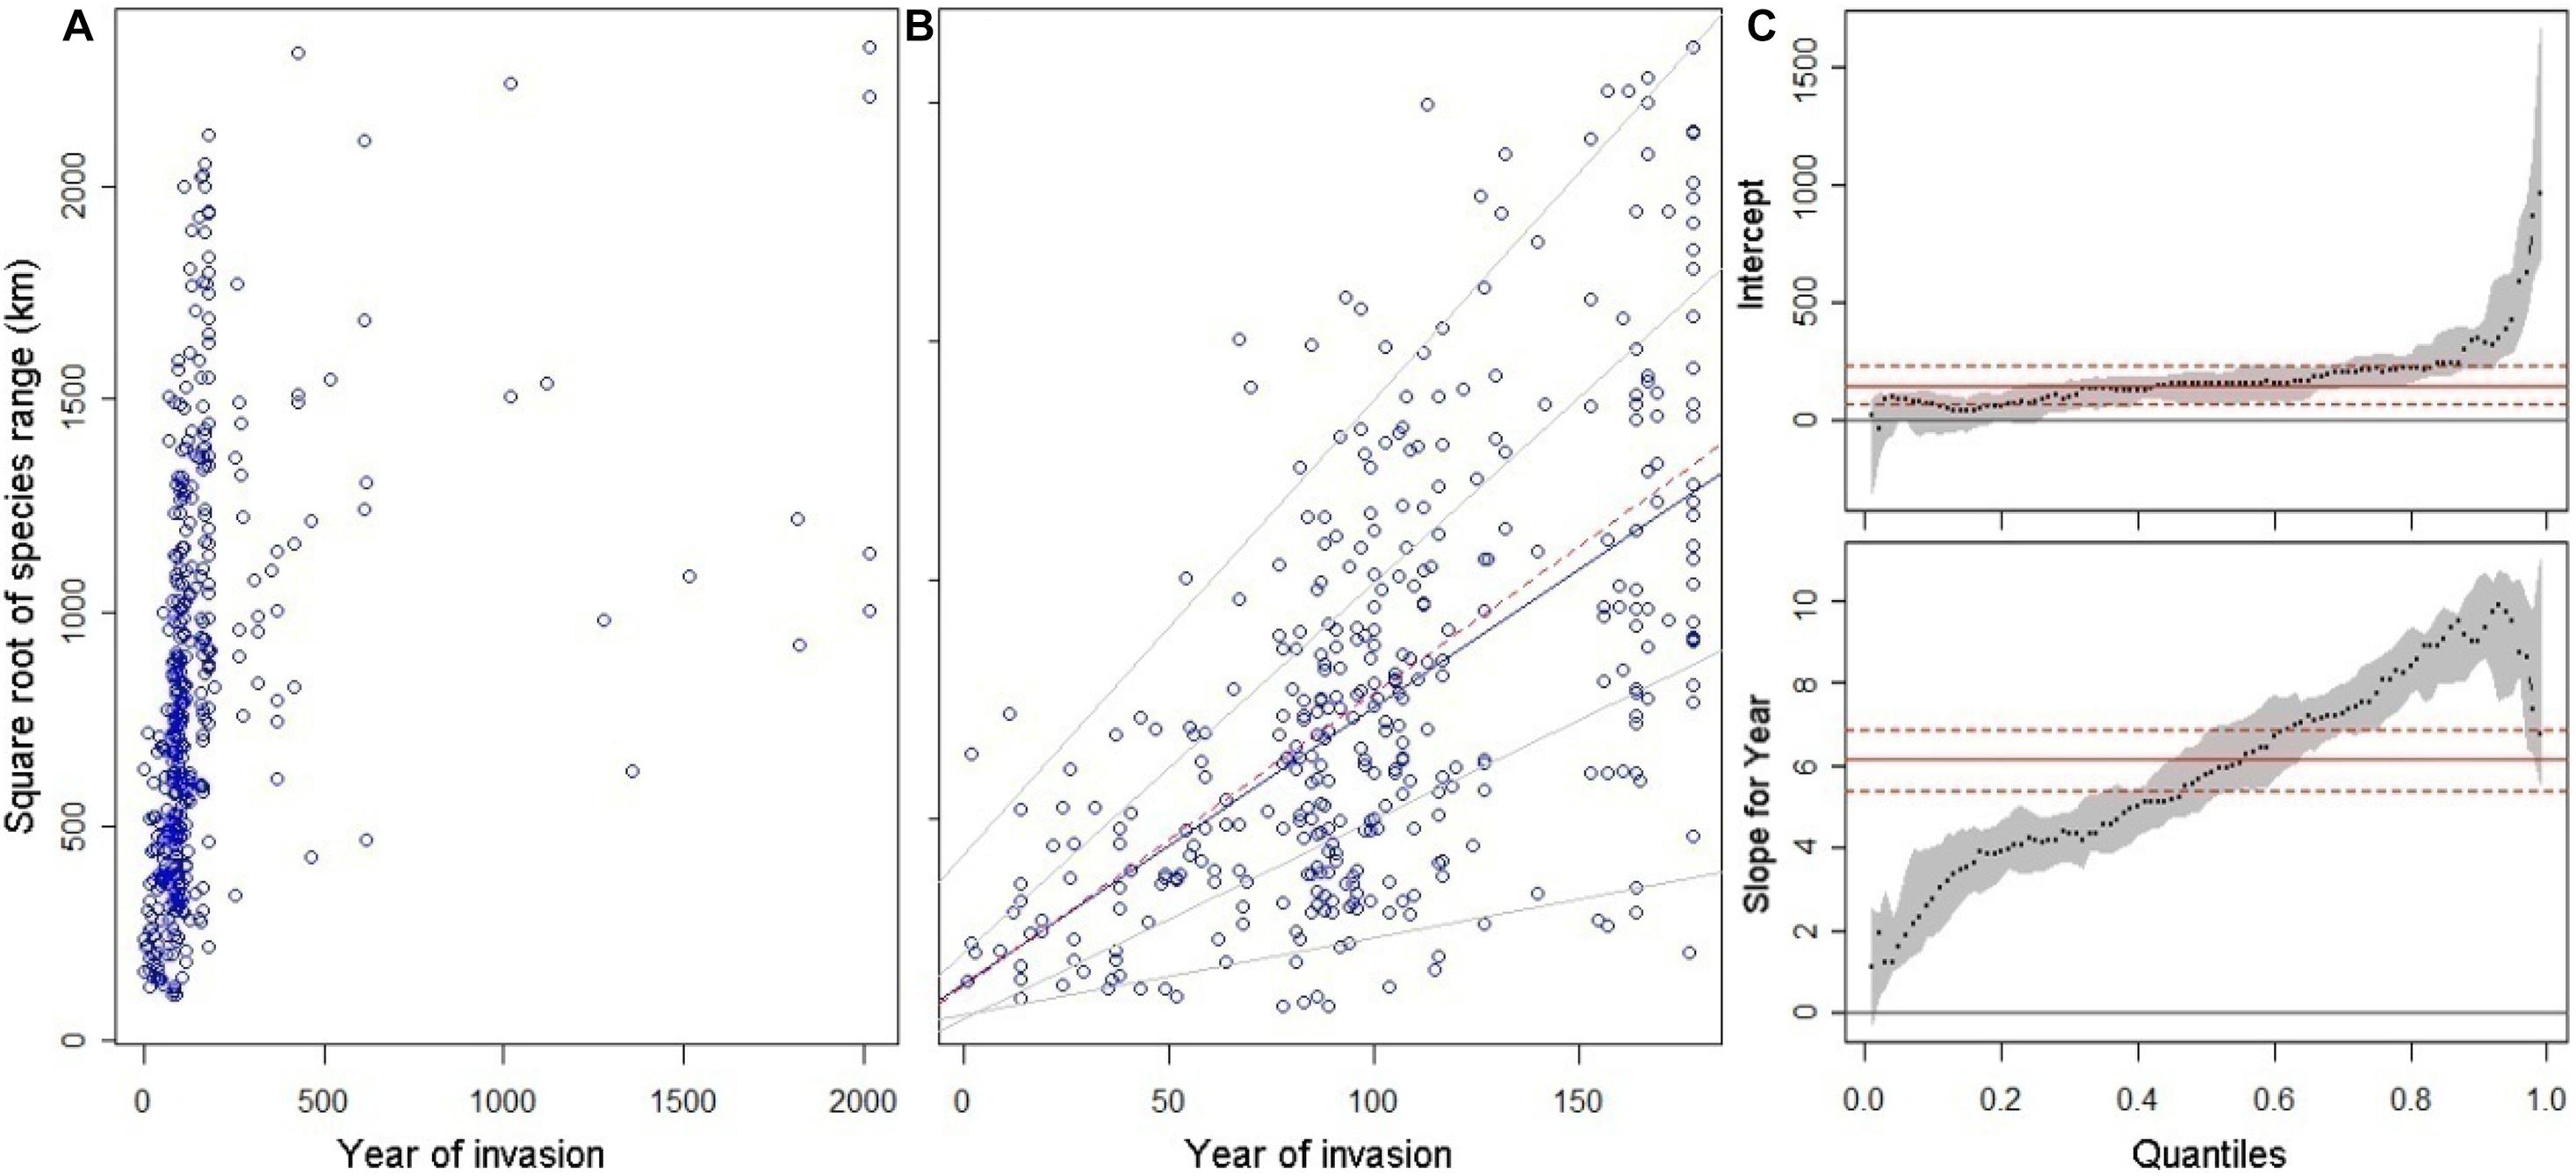
Figure 1. Time accumulation of invasive alien plant species (IAPS) in China and its relationship with distribution area. (A) the relation between area (square root of species range) and the year of introduction for all IAPS tracing back to 2000 year ago; (B) the same relationship for IAPS introduced since 1840, and fitted lines with quantile (thin solid lines for 5, 25, 75, and 95% quantiles, thick solid line for median, from up to low) and linear (dash line) regression models; (C) the slopes and intercepts of the quantile regression models (dotted line and variation in gray) and the 95% confidence interval for random variation (solid and dotted horizontal lines in red).
The distribution area of invasive species increased with increasing introduction time (r = 0.62, P < 0.001), but there was an upper limit of about 2500 km for the square root of species range of all invasive species (Figure 1A). The relationship between the introduction time and distribution area showed significant variability. The quantile regression models showed that the rate of distribution area increased with the introduction time, varying from slope = 1.62 = 2.56 km2/year for the 5% quantile to slope = 9.52 = 90.25 km2/year for the 95% quantile. This reflects the variation of species expansion rate, while the intercept of quantile regression model as the initial introduction area remained comparable (Figures 1B,C).
There were no statistically significant differences in the introduction time among different life forms of invasive plants (Figure 2A). After the effect of introduction time was controlled by an one-way covariance analysis, the log-transformed area of ABH species was larger than that of perennial herb and woody species (P = 0.004 and P = 0.005, respectively), and there was no significant different between perennial herbs and woody species (P = 0.76) (Figure 2B).
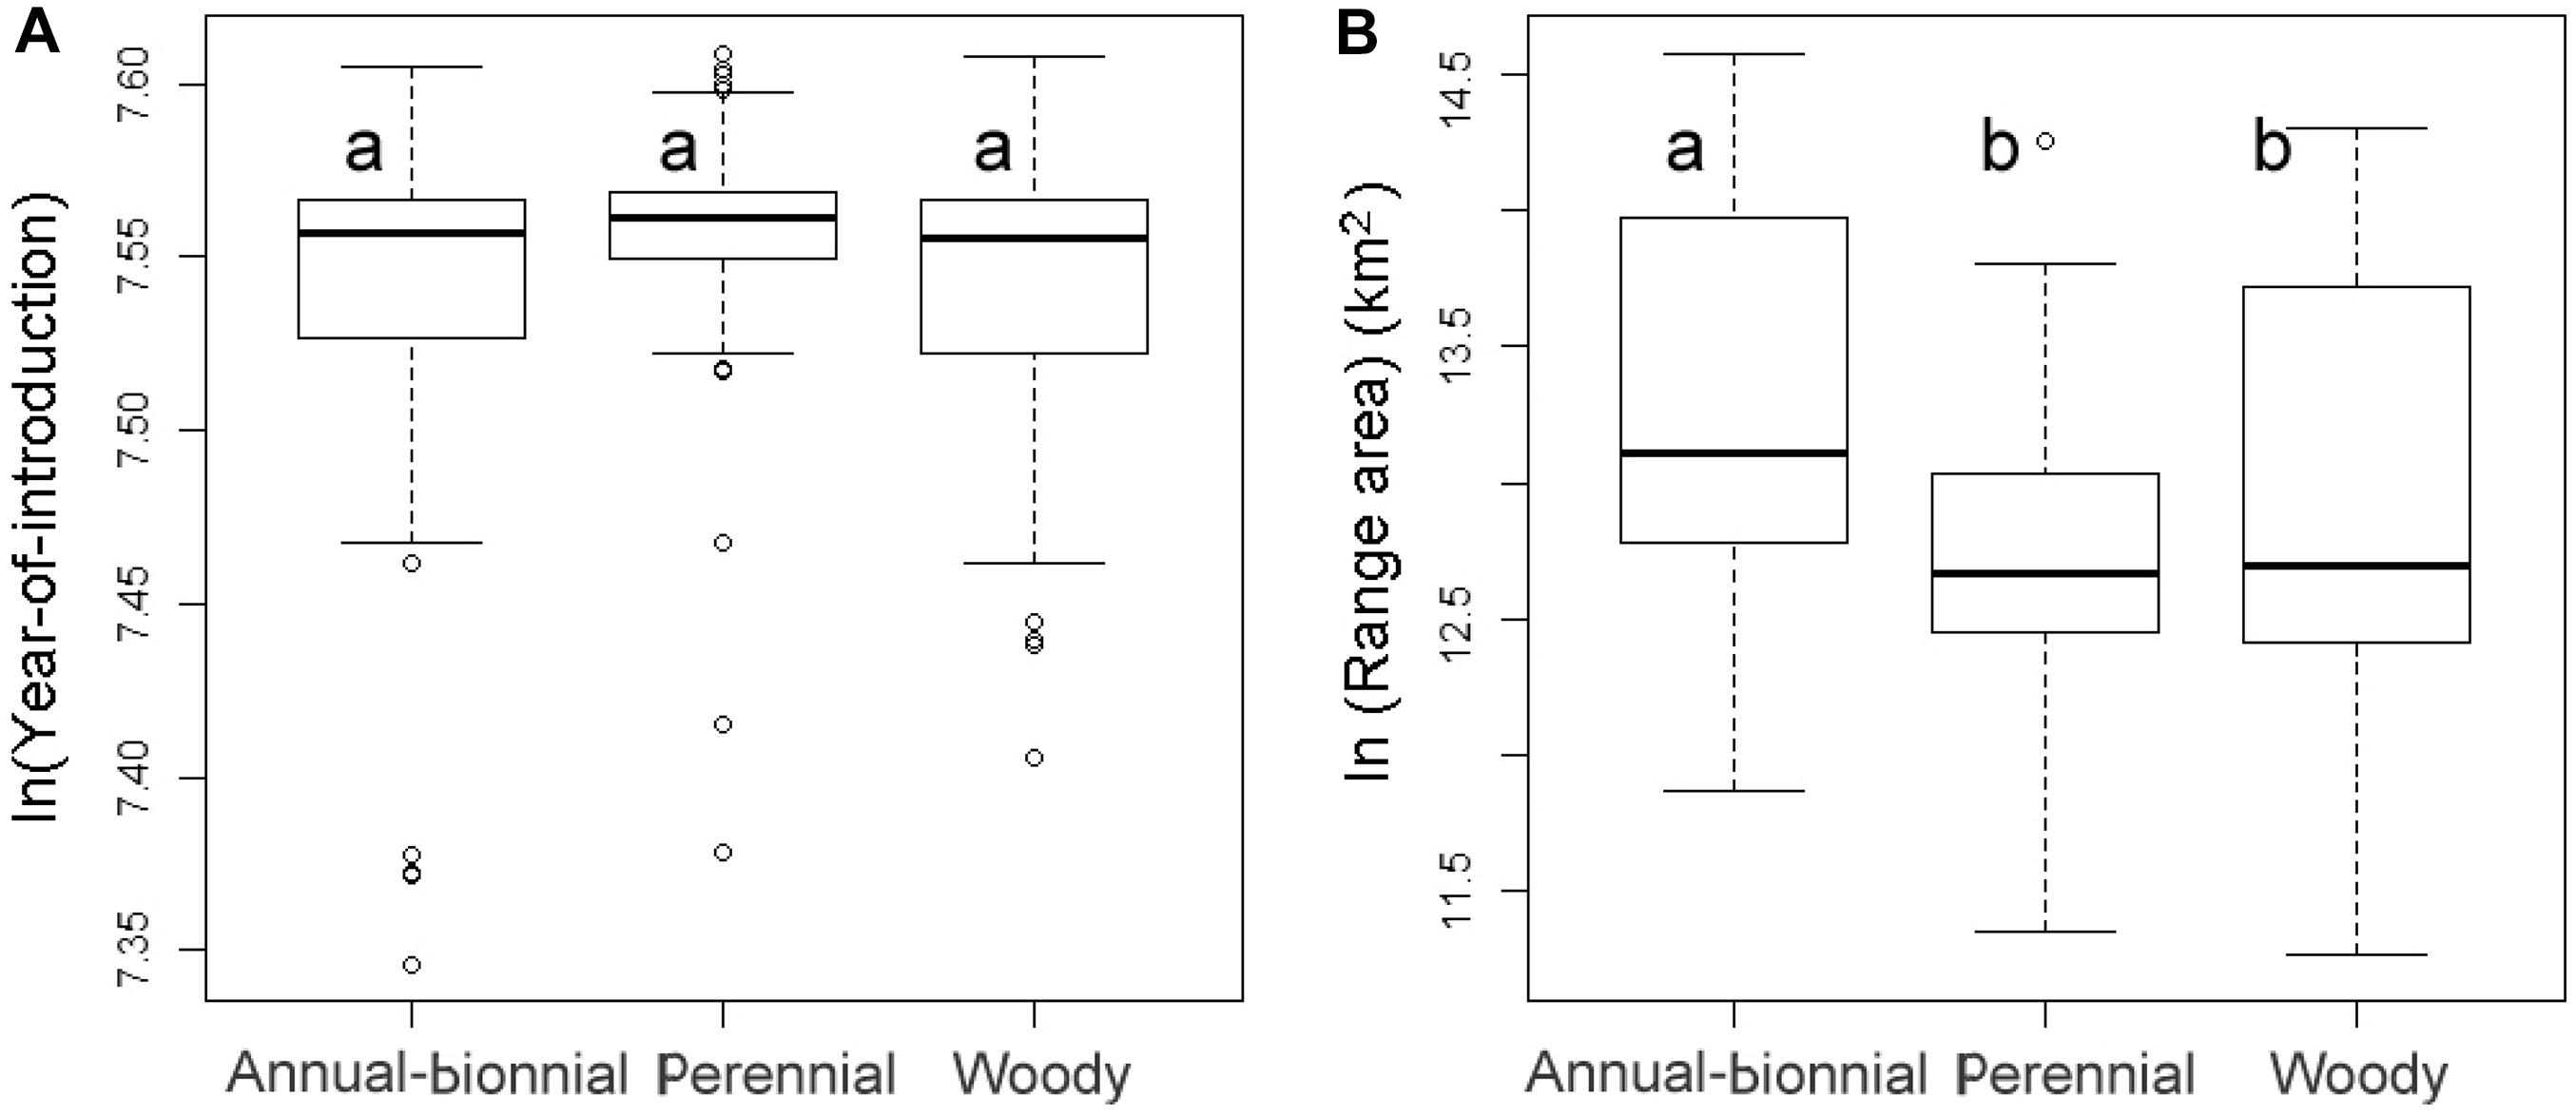
Figure 2. Boxplots for the frequency distributions of (A) introduction time (log-transformed values) and (B) current species range area (log-transformed values) for IAPS of different growth forms. Labels a and b above boxes indicate significant difference between means of two categories.
Geographical Patterns of Species Richness of Invasive Plants and Their Life-Forms
The IAPS richness in China decreased from south to north (Figure 3). Moreover, biological invasion was evidently more severe in the coastal areas and the land border areas adjacent to Southeast Asian countries, with more than 70 species per prefecture. The prefectures with high values belong to the provinces of Guangdong, Guangxi, Yunnan, Zhejiang, and Jiangsu. The IAPS diversity was seriously high in Taiwan Island and Hainan Island, to a less extent also in Northwest China prefectures adjacent to the central Asian countries, but very low in the areas adjacent to Mongolia, Russia, North Korea, and those neighboring the south border of the Qinghai-Tibet Plateau. In the interior of Central China and North China, the intensity of plant invasion in rural areas (∼30 species) was significantly lower than that in urban areas (>160 species). The top five cities of IAPS richness were all in the subtropical zone; namely, Guilin (227 species), Guangzhou (224 species), Shanghai (207 species), Hangzhou (203 species), and Xinbei city of Taiwan (202 species). The highest plant invasion intensity in North China was recorded as 127 species in Beijing, the capital of China.
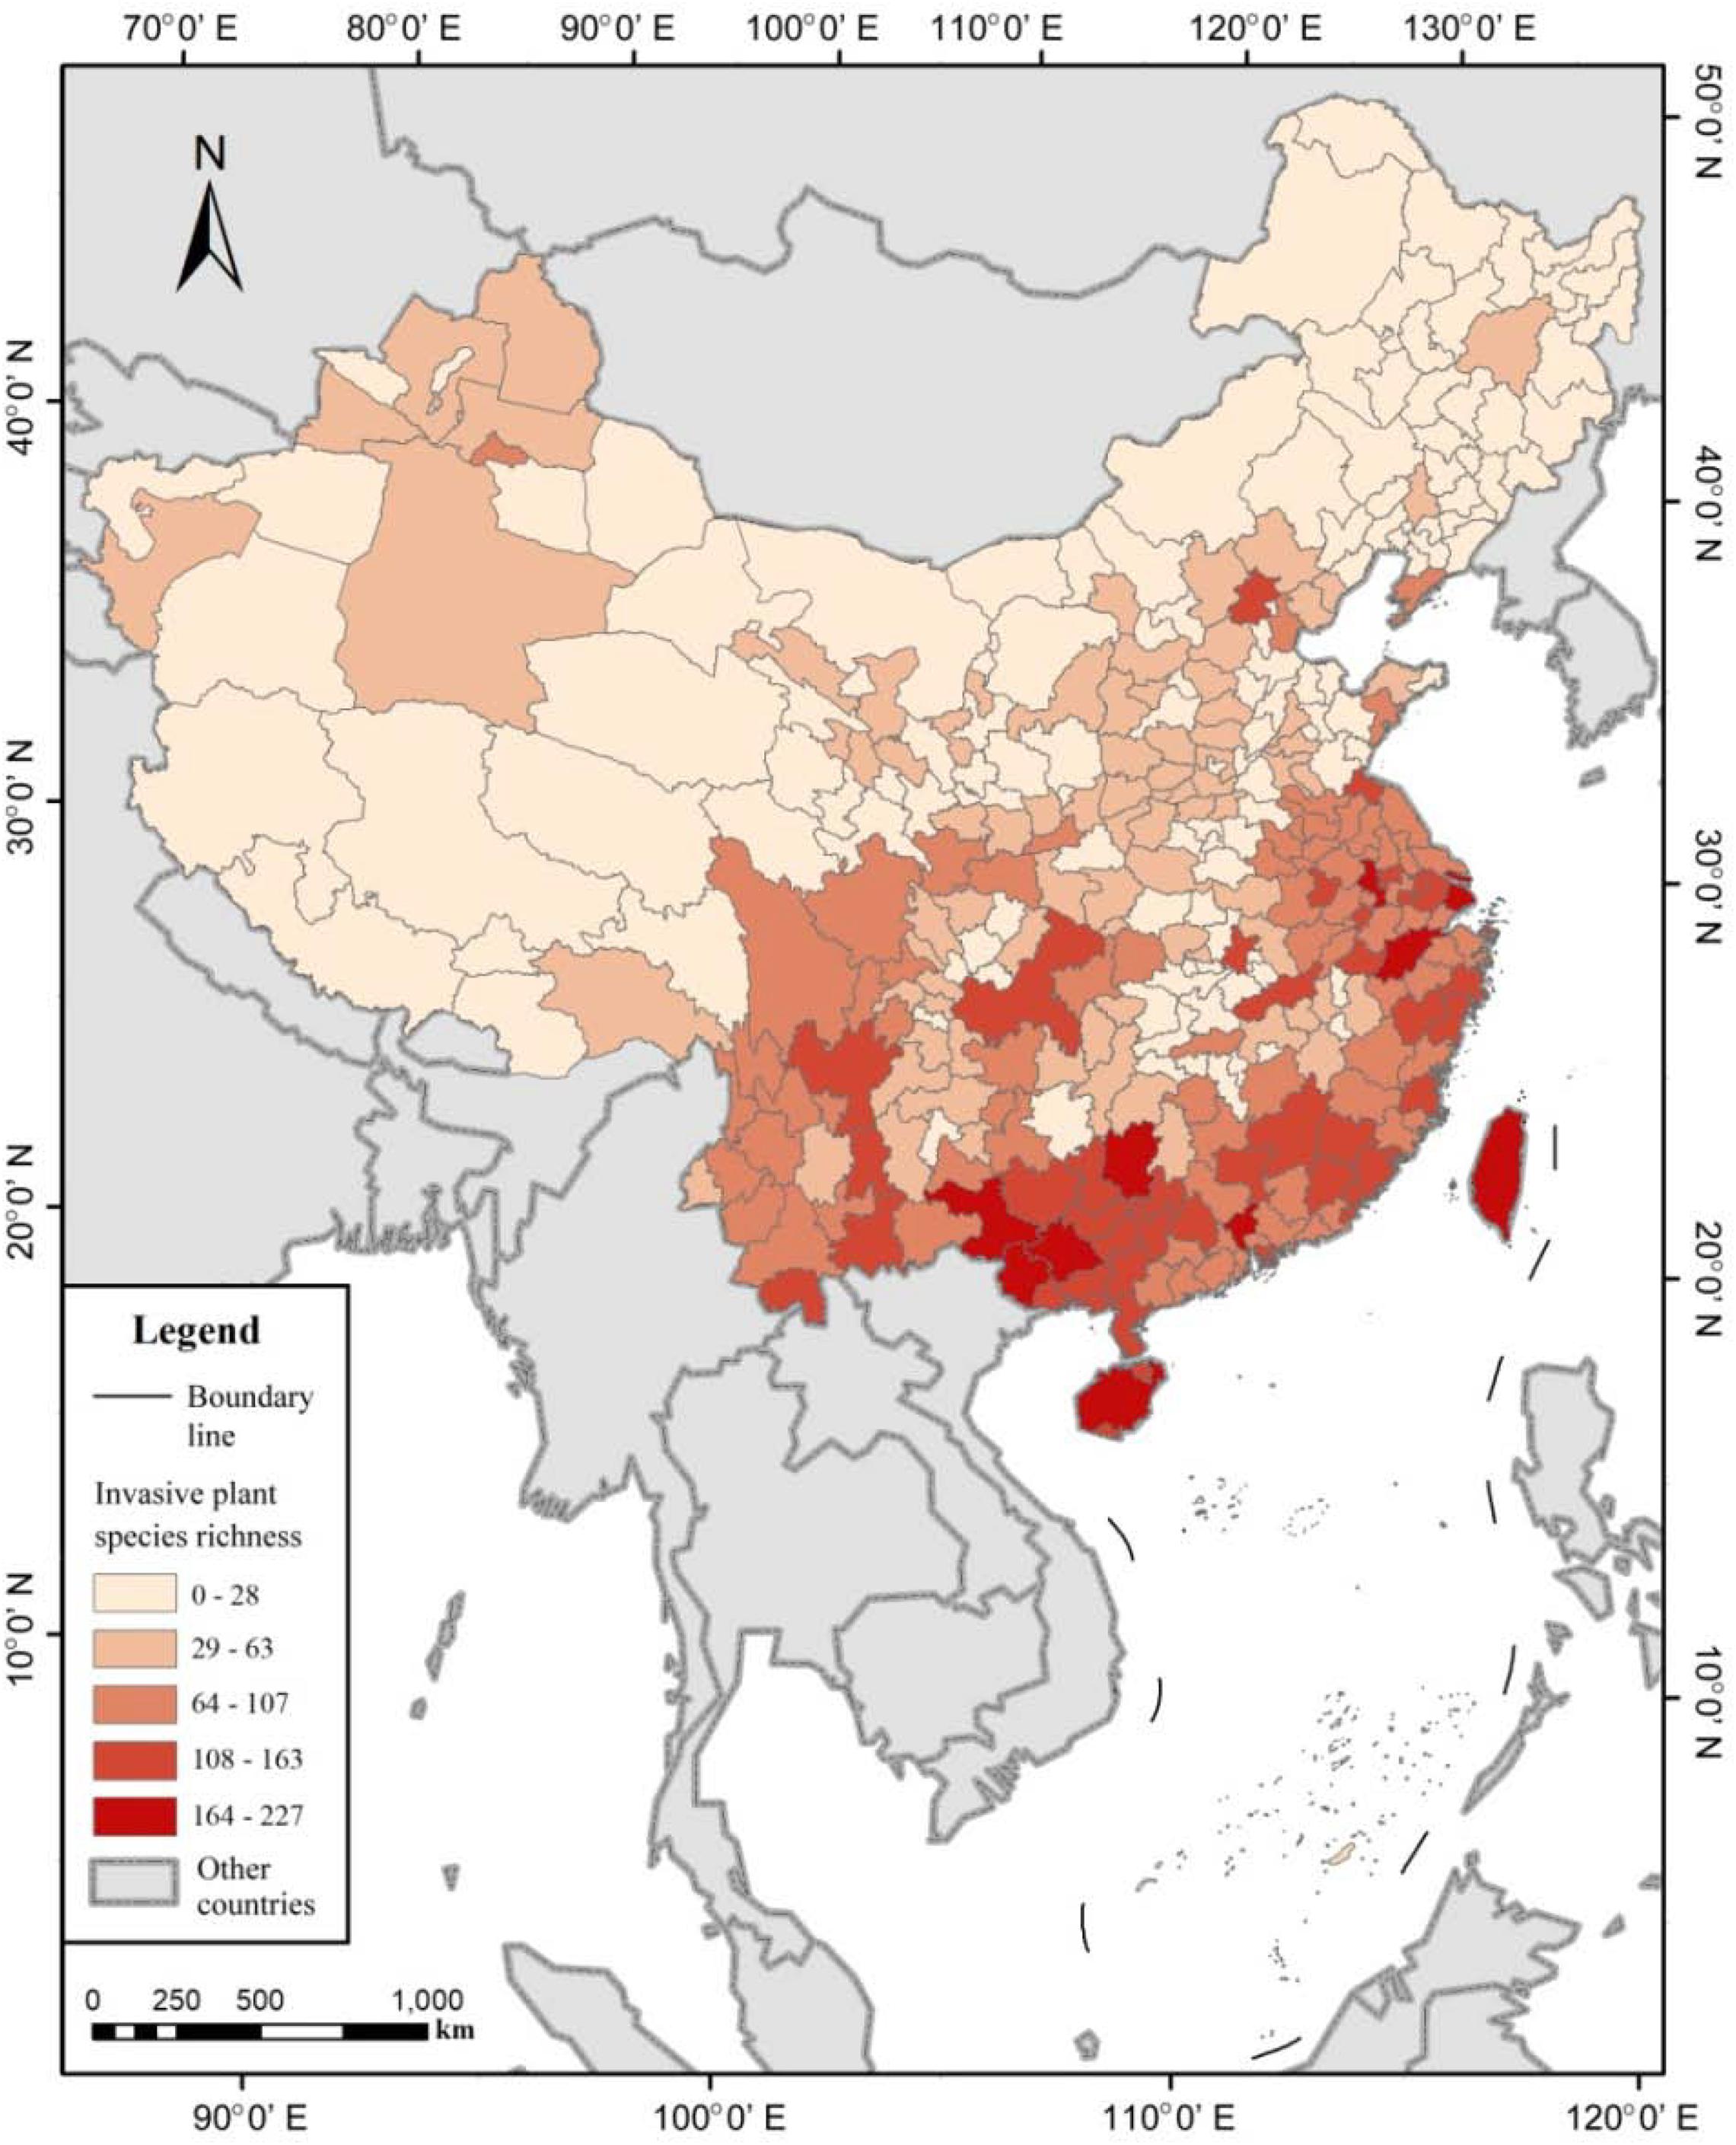
Figure 3. Species richness pattern of invasive plants in China, represented at prefecture scale.
With regard to different life forms, the richness pattern of ABHs was very similar to that of all IAPS. Subtropical coastal areas and Northwest China represented secondary invasion peak areas. In contrast, the percentage of ABHs to all IAPS showed an opposite latitudinal gradient, reaching the lowest values (30∼45%) in the tropical areas of Taiwan Island, Hainan Island, and Southern Yunnan. The highest values (up to 90%) appeared in the northwest of Qinghai-Tibet Plateau, Loess Plateau, Northeast China, and Shandong Peninsula, mainly temperate semi-arid regions. Invasive perennial species were mainly distributed in the southeast coastal areas, Taiwan Island, Hainan Island, Yunnan Province, and Chongqing city. Also, perennial species showed a peak value in the arid areas of Xinjiang and the central-western Inner Mongolia, reaching 20–40%. By contrast, low values of 5–20% were recorded in the vast area extending across the Qinghai-Tibet Plateau, Central China, North China, and most of Northeast China. Invasive woody species were mainly distributed in the south of subtropical region, with more than 30 species in some prefectures of Guangxi, Hainan, Yunnan, and Taiwan. However, in the regions north of 30°N, only 1–3 species were recorded in most areas. The percentage of invasive woody species had a similar pattern, with the highest value of 30% recorded in southern Yunnan and Guangxi, while absent in the vast northern regions (Figure 4).
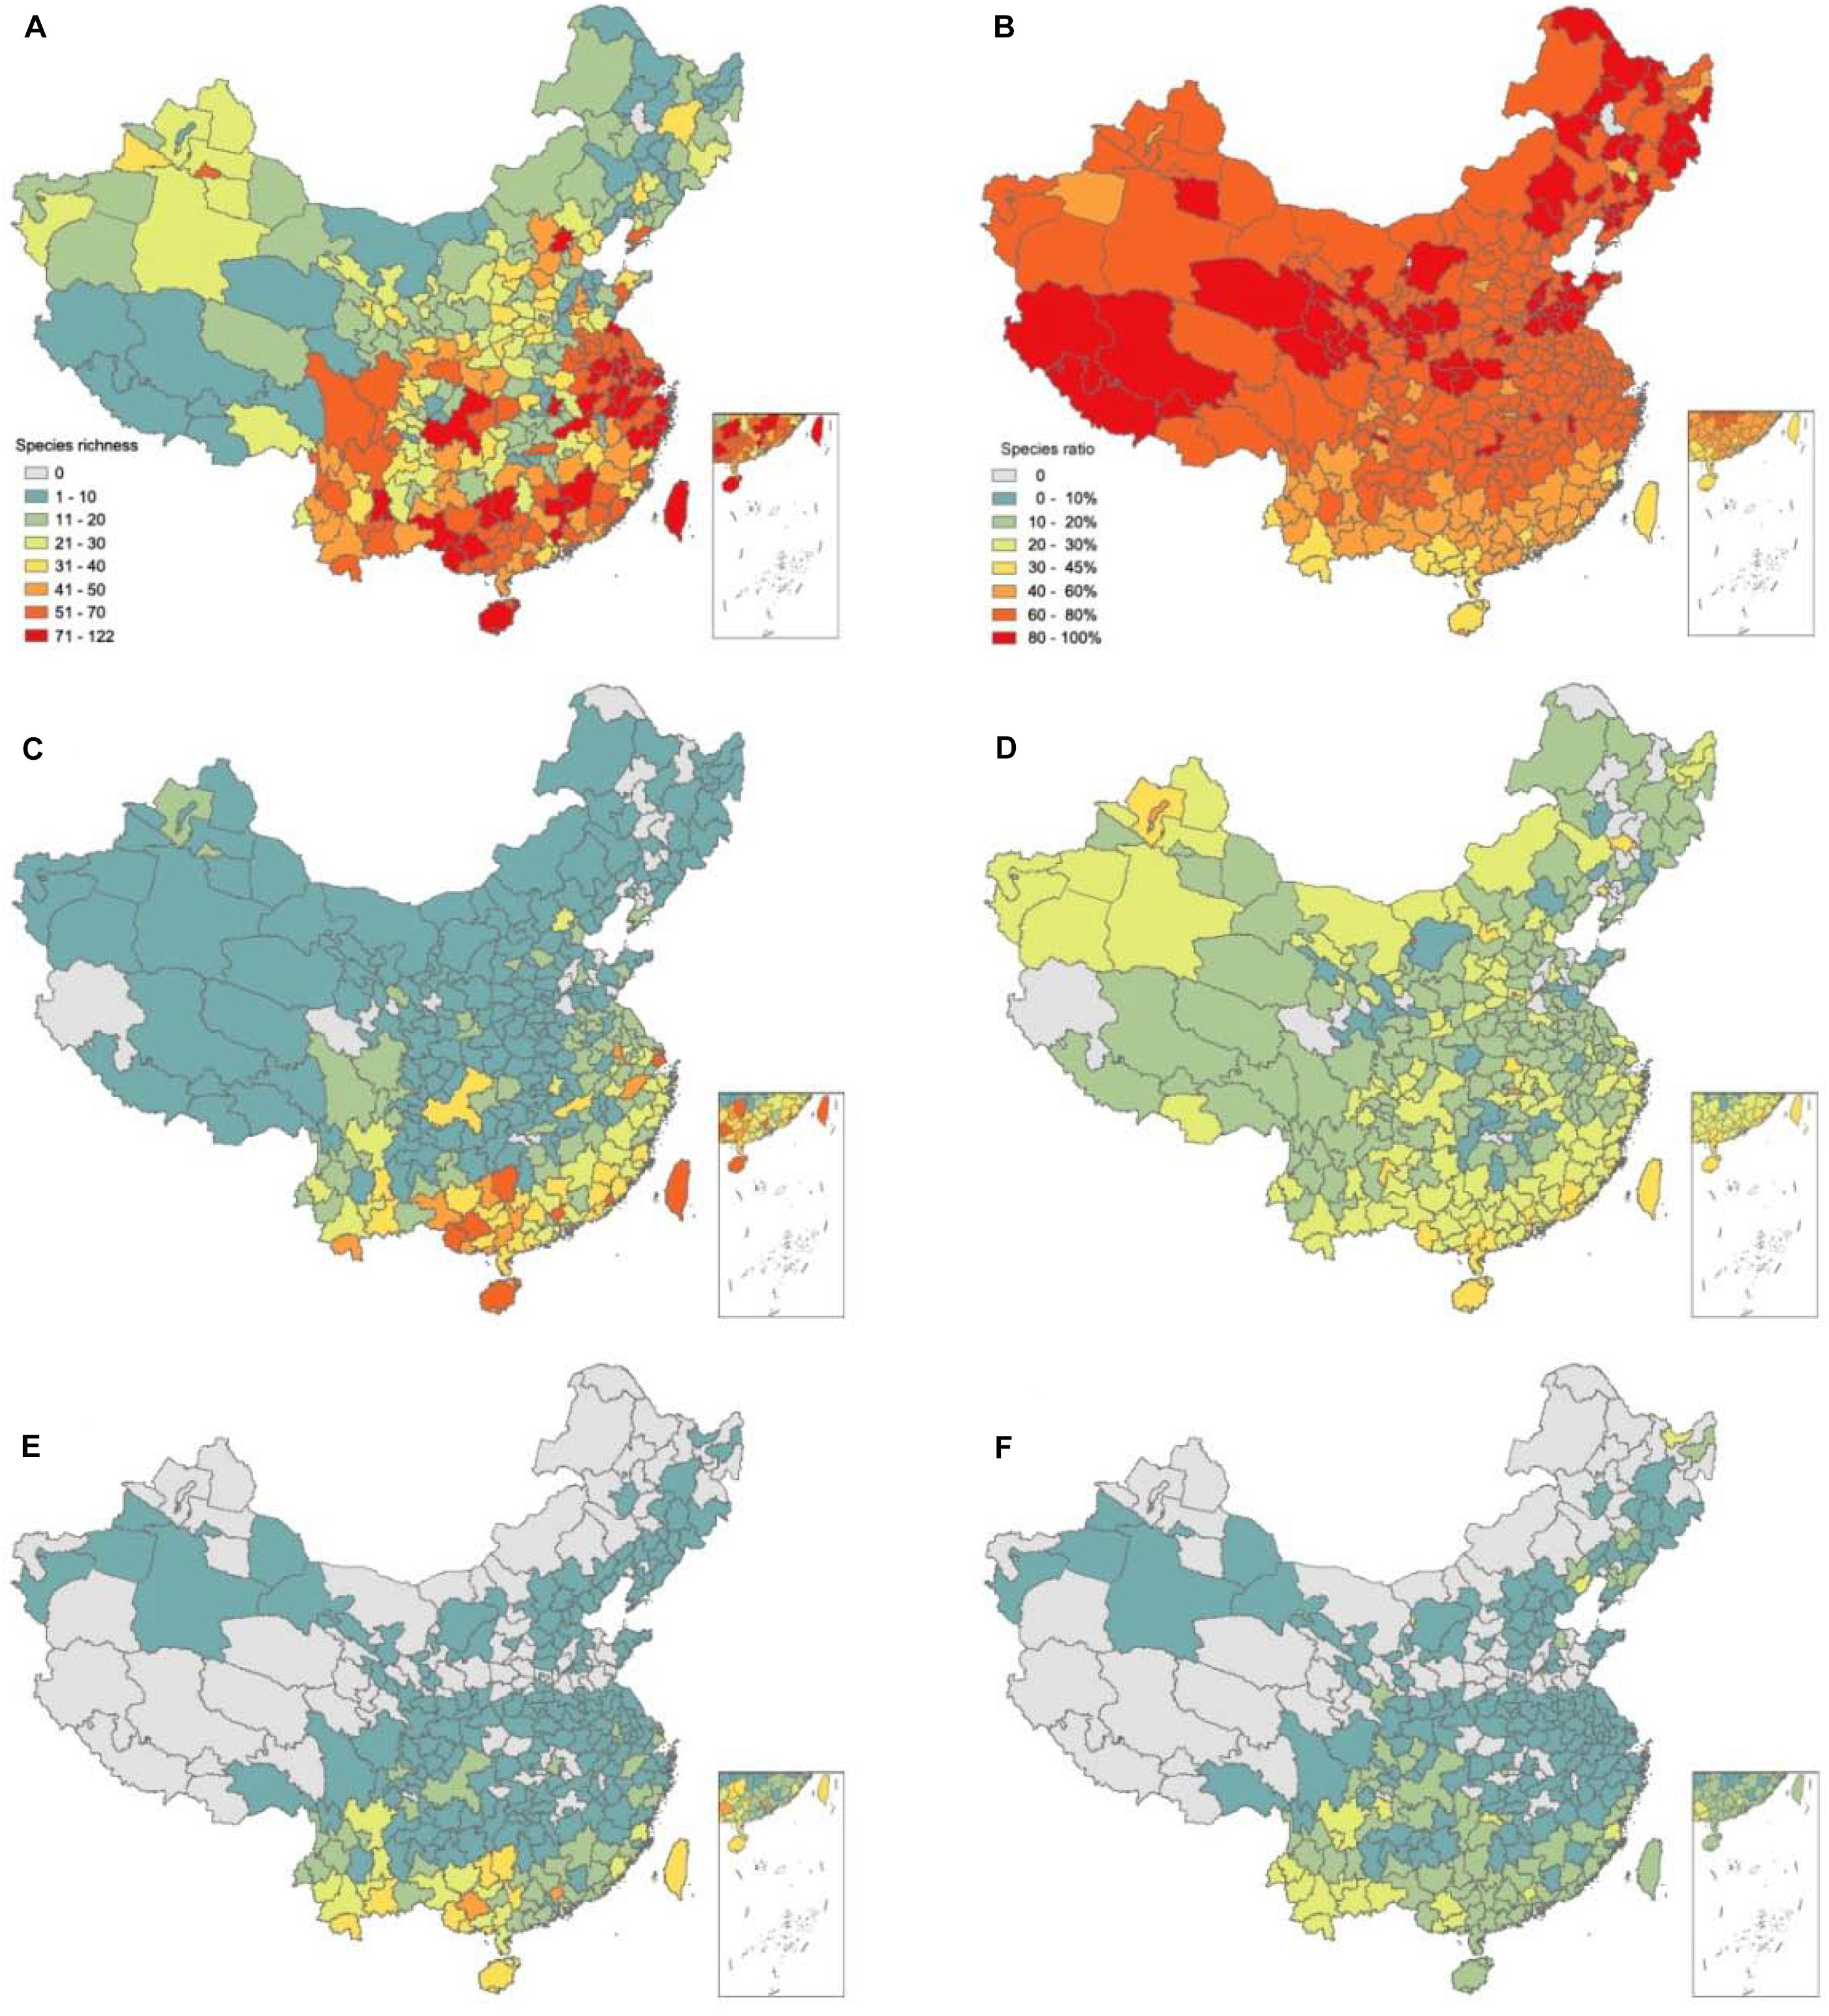
Figure 4. Geographical patterns of species richness and percentage of invasive plants and three life-forms; panels (A,C,E) represent species richness of annual-biennial herbs, perennial herbs and woody species, respectively; panels (B,D,F) represent the species percentage of three corresponding life-forms.
Determinants of Invasive Plant Species Richness Patterns
The relationship between IAPS richness in the three life forms (i.e., ABHs, perennial herbs, and woody plants) and the explanatory variables were estimated by linear models. IAPS richness had a positive correlation with energy indices of climate, including ABT, MAT, MTCM, and MTWM (Figure 3 and Supplementary Table 1). The Pearson correlation coefficients reached a significant level (P < 0.001), with the correlation strongest with MTCM, and weakest with MTWM. IAPS richness was also positively correlated with MAP, but negatively correlated with CVP (P < 0.001). Regarding social-economic factors, IAPS richness increased significantly with an increase in GDP and population (P < 0.001), with ABHs showing the highest intensity of infestation, followed by perennial herbs and then woody species. The correlation between IAPS richness of road density was barely significant (r = 0.10, P = 0.06), in which there was only a significant but weak positive correlation with ABH species richness, and no correlation with the perennial herb and woody species richness. The correlation between the above factors and IAPS richness increased from woody to perennial to annual life forms, which suggests that the invasion processes and the drivers of these three types of plants were related rather than independent of each other (Figure 5).
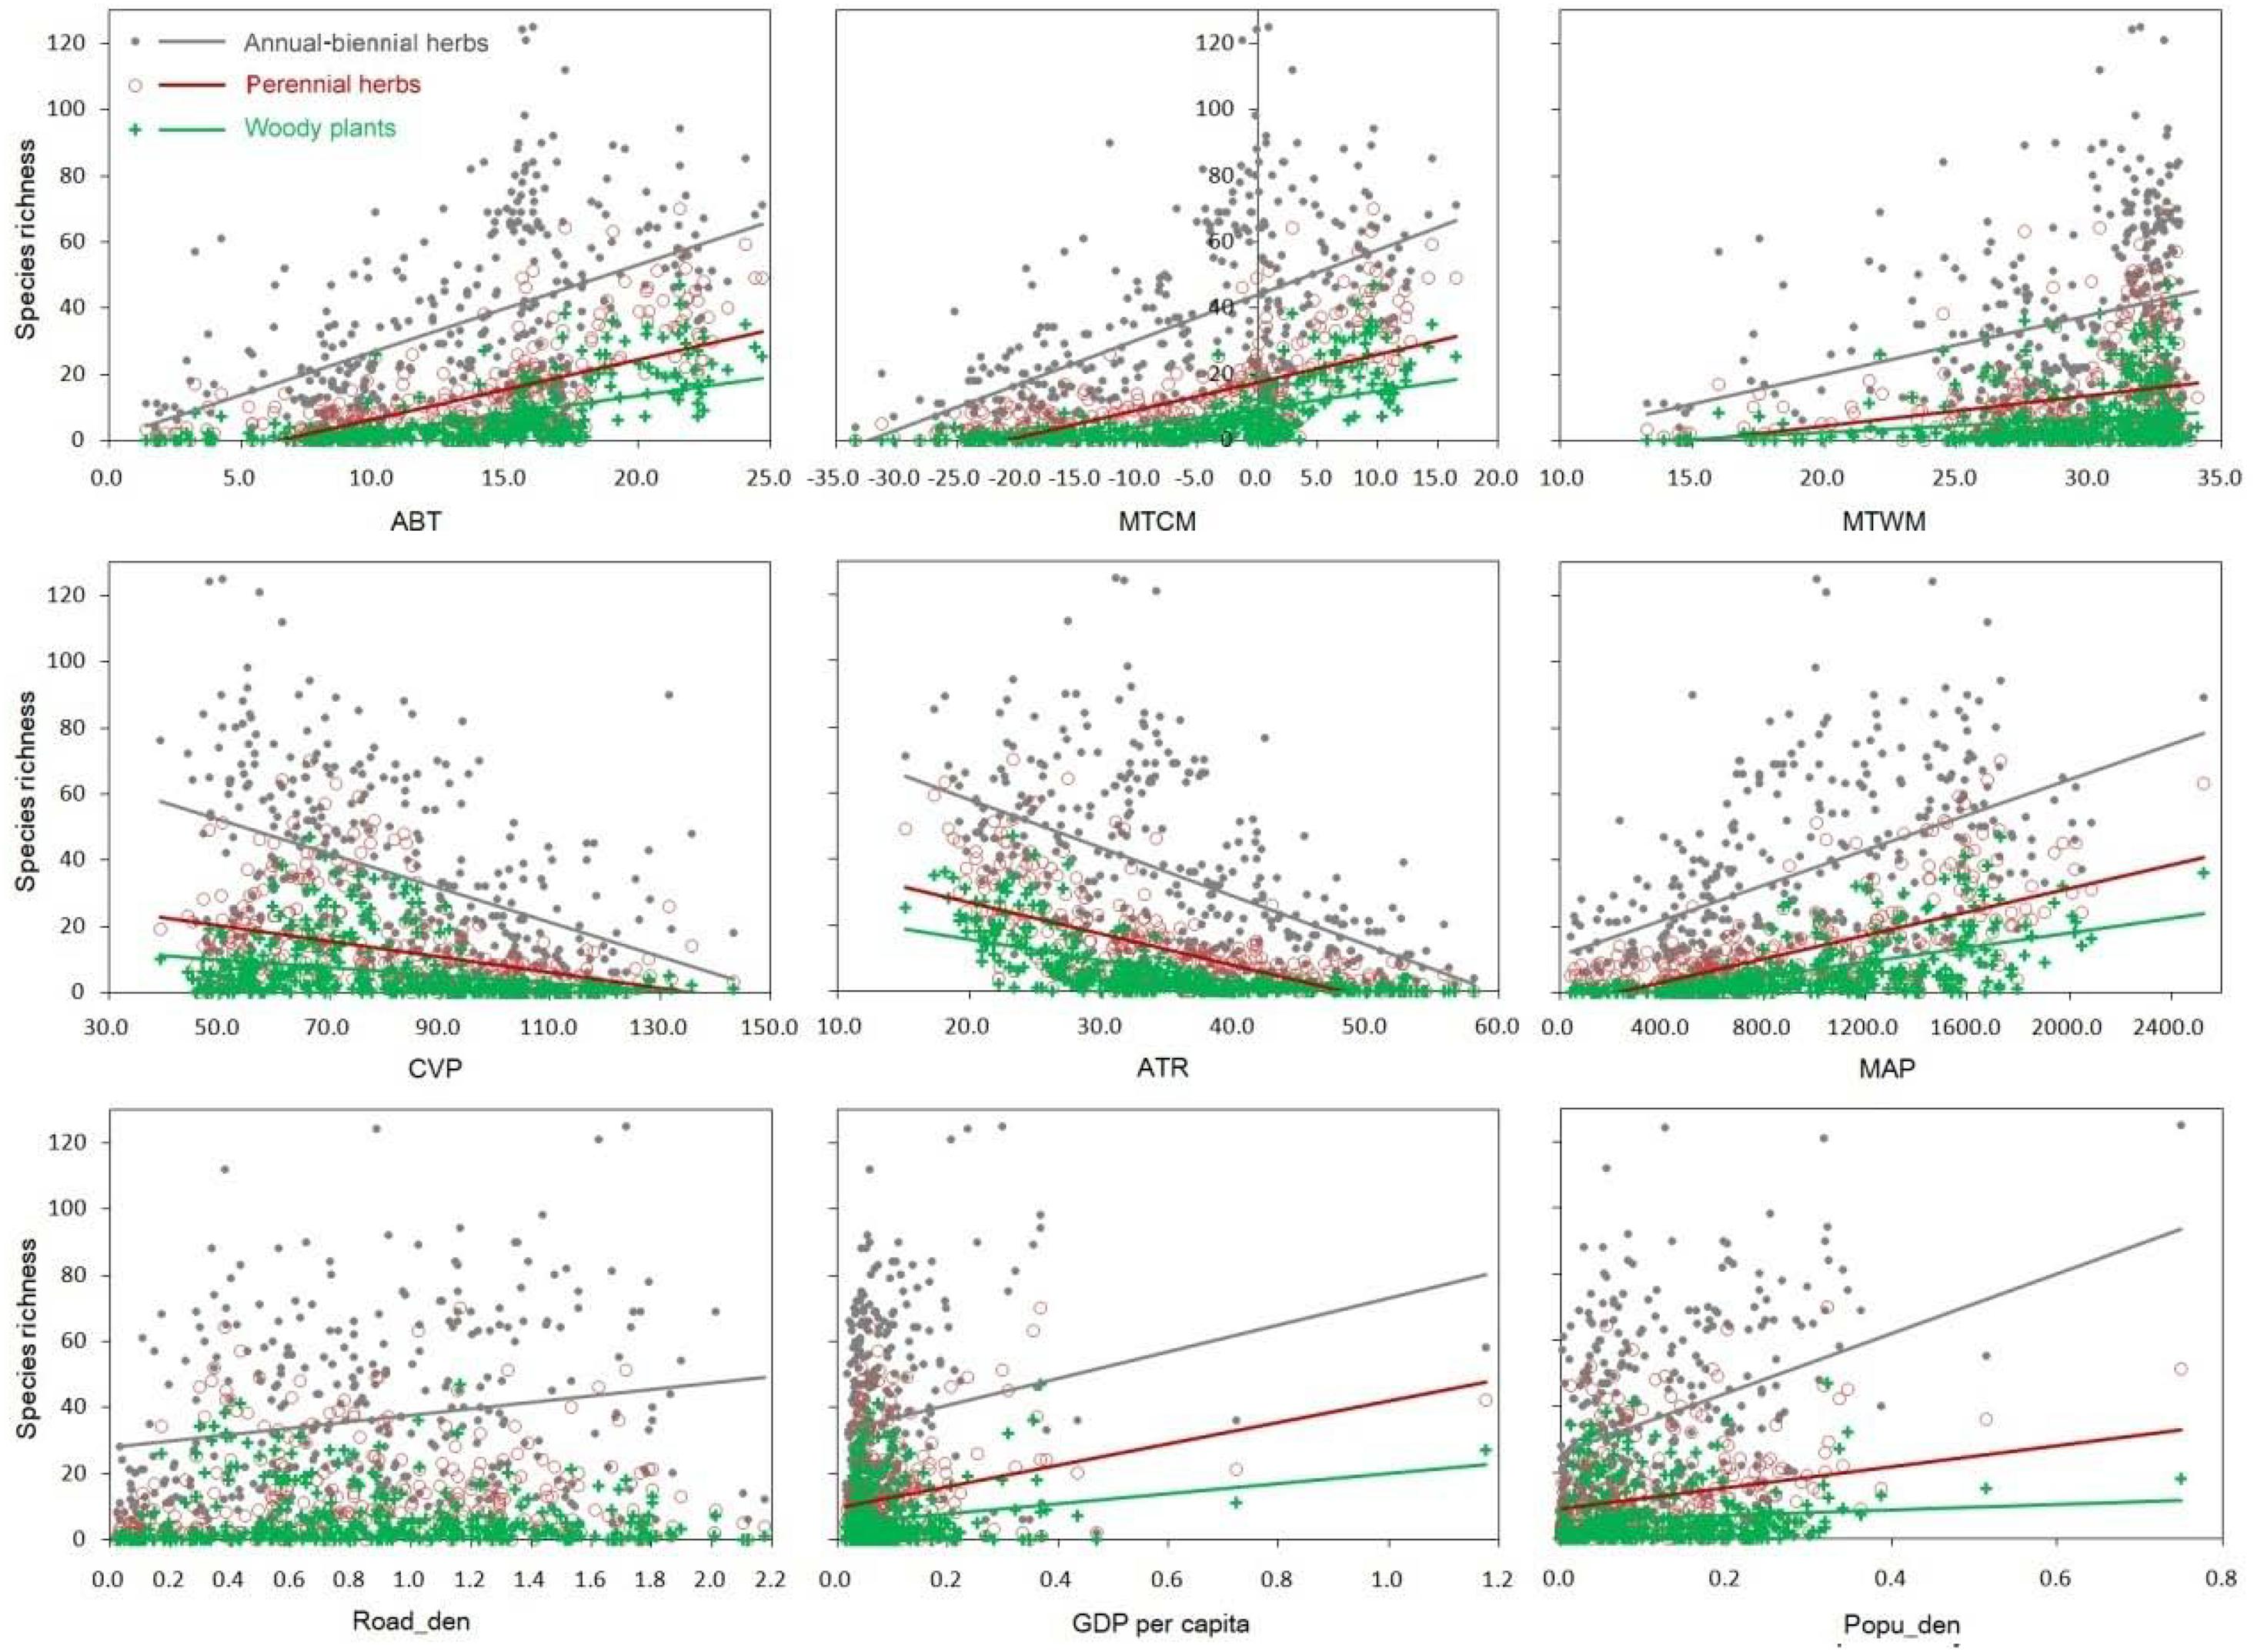
Figure 5. Relationship between each environmental factor and invasive plant species richness (the fitting line was not added if the correlation was not significant).
There was an insignificant negative correlation between the log-transformed prefecture area and the log-transformed total invasive species richness (Figure 6A). However, the year of earliest records of invasive species were positively correlated with invasive species richness (R2 = 0.155, P < 0.001), and the year of the most recent invasive species was negatively correlated with IAPS richness (R2 = 0.472, P < 0.001).
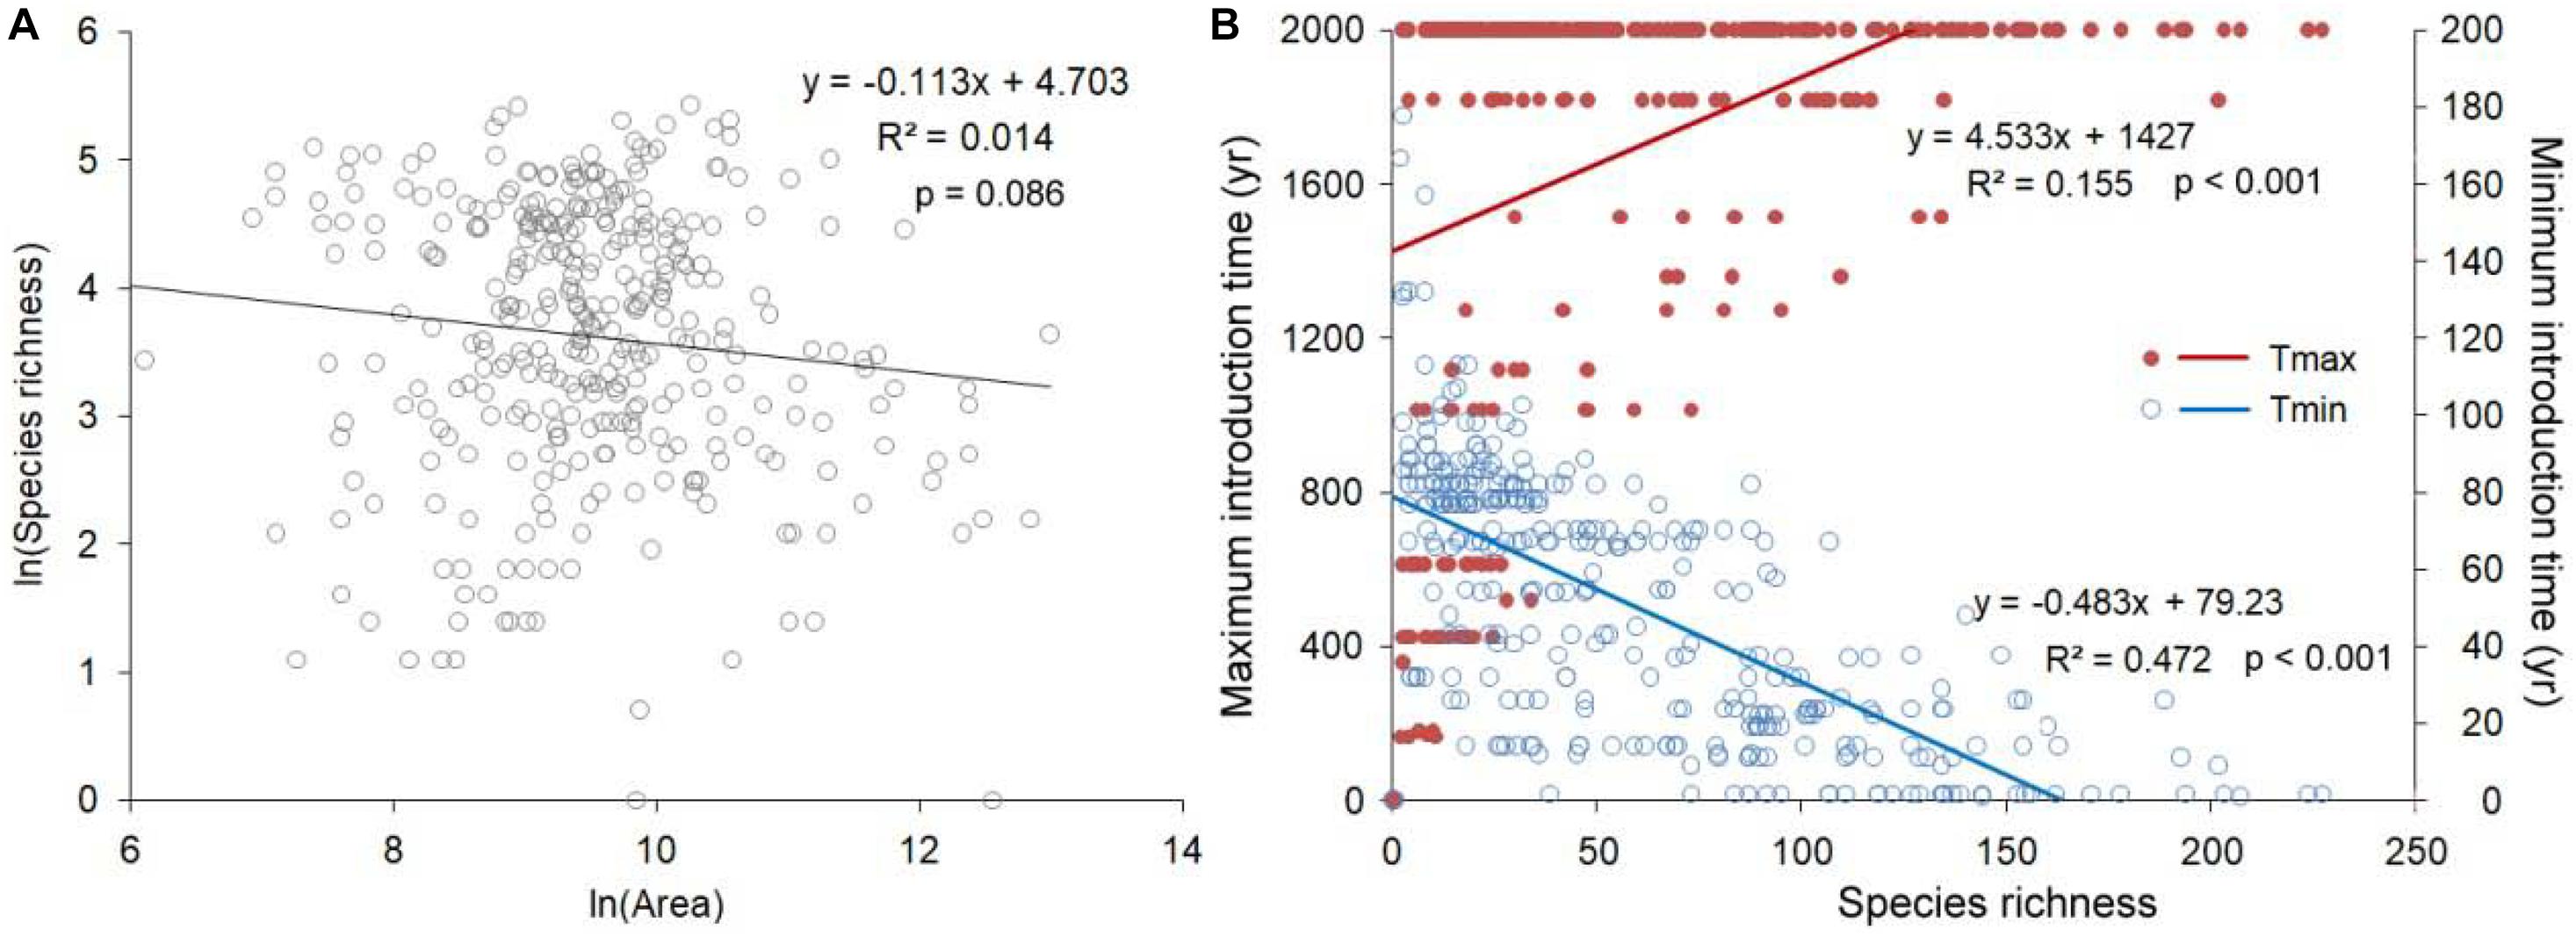
Figure 6. Relationship between invasive species richness and (A) prefecture area, (B) the year of the earliest versus the most recent invasive species.
Variation Interpretation of the Invasive Species Richness Pattern
Based on the GLM and variance decomposition algorithm, a full model considering climate factors (seven variables), social-economic factors (three variables) and the most recent introduction time (Tmin) can explain 75.7% variance in the species richness pattern of all IAPS, and this value was 68.2, 78, and 78.5% for ABHs, perennial herbs, and woody plants, respectively. By contrast, with the same set of explaining variables, the variance of species percentage pattern was explained by 47.4, 22.8, and 35% for ABHs, perennial herbs and woody plants, correspondingly (Figure 7).
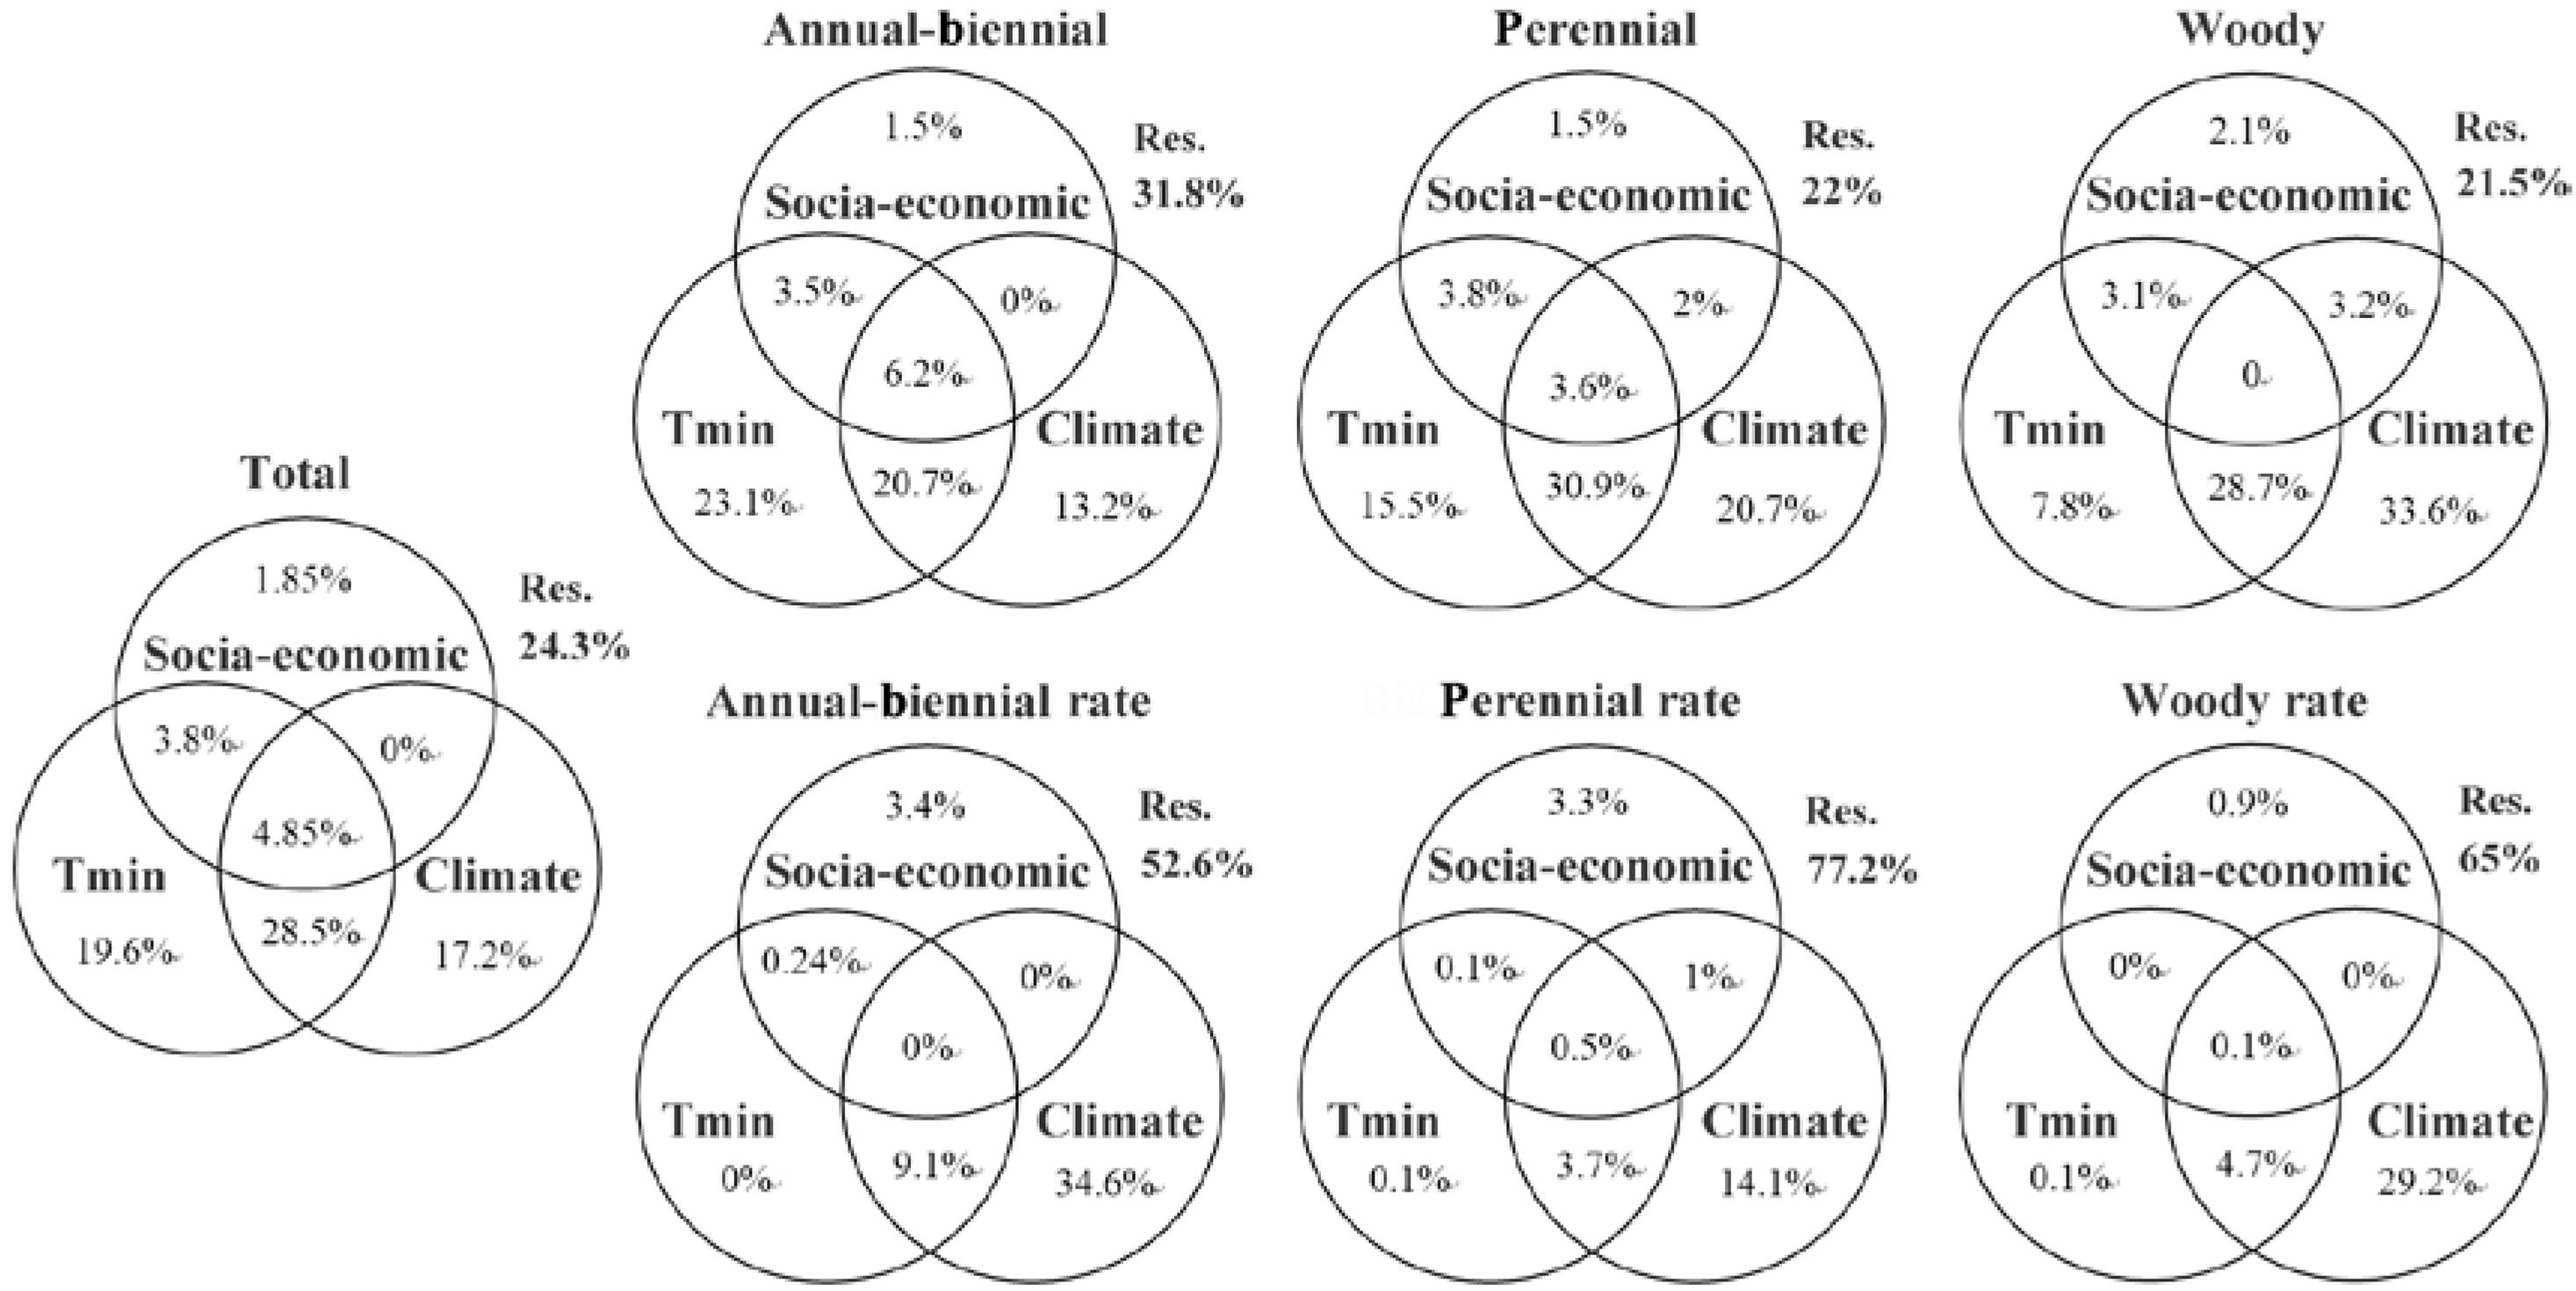
Figure 7. Variation partitioning for species richness and species percentage of all IAPS and three subgroups of life form. Tmin, time of most recent introduction; Climate, seven climate indices in Table 1; Social-economic, three social-economic indices in Table 1.
When breaking down the effects of Tmin, climate, and social-economic factors (as shown in Table 1) to the spatial patterns of invasive species richness (Figure 7), Tmin (19.6%), climate (17.2%), and their interactions (28.5%), were shown to play major roles, while human activities had little influence (1.85%). These contributory levels were basically applicable for the three life forms of invasive plants. Moreover, from annuals to BPHs and then to woody plants, the independent contribution of Tmin gradually decreased from 23.1 to 7.8%, while the limiting effect of climate increased from 13.2 to 33.6%. On the other hand, climate factors played a primary role in the patterns of species percentages of the three life forms of invasive plants; human activities had a weak but independent contribution, and Tmin had little independent effect on these patterns.
The hier.part algorithm further ranked the importance of individual factors on the species richness pattern of IAPS (Table 2). For total invasive species richness, the importance of Tmin was the greatest (contributing 43.7% of r2 of the full model), followed by temperature, especially MTCM (16.8%). Tmin contributed the most (51.7%) for invasive ABH species, followed by MTCM and CVP; for the invasive perennial herb species, Tmin (35.9%) and MTCM (21.9%) played major roles, and ABT and MAP also contributed significantly. For invasive woody species richness, the influence of Tmin was weakened and the effect of temperature became stronger, especially ATR and MTCM. For the richness percentage of three life forms of invasive species, ABT and ATR were significant factors (R2 = 0.263; P = 0.01).
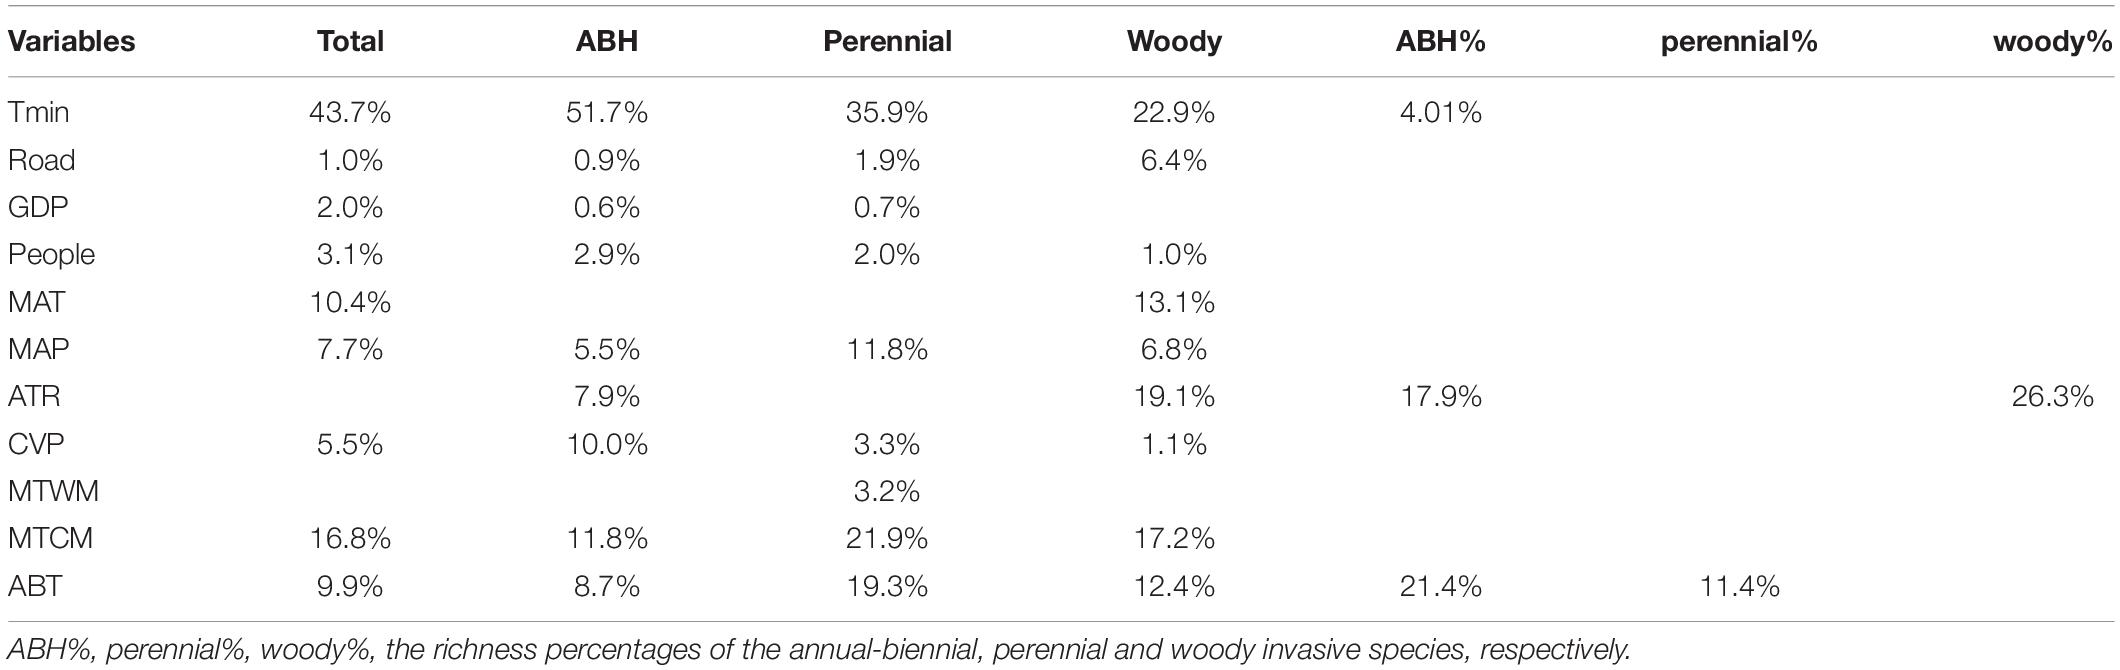
Table 2. Rank of variable contributions to the variation of species richness and species percentage of all invasive plants and the three life-form subgroups.
Discussion
Species Composition and Geographical Pattern of Invasive Plants in China
Based on the most complete list of IAPS existing in China, this study produced the first data of invasive alien plants distribution in China at a sub-provincial (prefecture) scale, thus provided a more accurate description to the geographical pattern of invasive plant diversity than earlier studies. In accord with existing studies (Yan et al., 2014; Wang et al., 2017), the IAPS diversity in China decreased from south to north, with substantially higher values in subtropical and tropical areas than in temperate areas. There were prominent introductions of IAPS from the northwest border of China, and the intensity of plant invasion was significantly higher in coastal than in inland areas, and significantly higher in cities than in rural areas. It is noteworthy that there were intensive IAPS introductions in the southwest border areas with Vietnam, Laos, and Myanmar, as reported earlier (Lu et al., 2005; Li et al., 2019; Zhang et al., 2019). Given there is no physical barrier to the introduction of IAPS between this region and its neighboring countries, it would be expected that plant dispersal would have already reached saturated and stable condition, and there should be no significantly increased biological invasion. Thus the active IAPS introduction suggests that adjacent areas are also facing similar biological invasions from abroad.
By integrating multiple data sources, this study updated the time accumulation curve of invasive plant species in China (Supplementary Figure 2), which showed that 75 species of plants had been introduced to China before 1840, in contrast to 30 reported by Huang et al. (2010) and 39 by Chen et al. (2017). According to Chen et al. (2017), 82 and 83 species of alien plants were recorded in China during the first and second half of the 20th century, respectively. Our updated sequence time showed that the first half of the 20th century represented the outbreak period of alien plant introductions in China, and a total of 182 species invaded during the 1900–1940 period, while the introduction speed slowed down after 1950. This result is different from earlier studies that stressed the importance of the reform-and-opening policy and rapid economic growth since 1980’s (Lin et al., 2007; Ding et al., 2008), for their contributions to species introduction and spread in China. However, recent studies with more complete historical data also showed the period of most rapid increase of invasive plant species, i.e., 1900–1950 (Huang et al., 2011). Nevertheless, this study provided the first estimate of the introduction rate of IAPS in China across the 20th century. As to the explanation for the outbreak of plant invasion during 1900–1940s, it is reasonable to think about the potential effects of wars, especially World War II that drove not only the rapid increase of commercial imports (of industrial goods including weapons), but also alien military invasions. The long period of wars caused unprecedented damage to everything across the country, including vegetation.
Seebens et al. (2017) pointed out that, globally, the spread of alien species has not slowed down, and the potential risk of bioinvasion is still accelerating. Their global patterns of temporal change in the records of alien plant introduction indicated a most rapid increase in 1850–1900 and a level-off during 1900–1950, followed by a recovering increase in last half century. What was observed in China seemed not consistent with this global pattern, but had more similarity with their results for Asia as a part, which suggested a little increase during 1850–1900 and a peak value in the 1900–1950 period. Obviously, the spatial difference across continents at the temporal scale of decades revealed more influence from human activities than from climate changes.
Similarity and Difference in Distribution of Different Life Forms of IAPS
Invasive alien plants species (IAPS) of different life-forms tend to responded distinctly to environmental drivers (Chen et al., 2017; Mehraj et al., 2018). The IAPS richness of three life forms in China revealed similar latitudinal patterns, but the latitudinal patterns of their percentages were different. The percentage of invasive ABHs decreased from north to south, but the highest value appeared in “the temperate semi-arid climate + grassland” region. This region is characterized by strong intra-annual and inter-annual fluctuations in precipitation, which causes severe degradation of perennial vegetation (Li et al., 2006), and forms large areas of bare habitat. This, in turn, facilitates the colonization of ABH plants. Invasive perennial herbs which are tolerant of more extreme climate, and are more competitive than annual herbs, so they can colonize more extensively than annuals in tropical and northern arid areas. Invasive woody species have a long generation cycle and lower dispersal rate, and adapt to habitats with relatively stable climate but more intensive competition; this means that invasive woody plants achieve a higher proportion in the south only. The spatial variations of the percentage composition of invasive species of different life forms reflect the differences in life history strategies and habitat selection (Liu et al., 2006; Huang et al., 2012).
Spatial and Temporal Drivers for Plant Invasion as an Ongoing Process
The effect of spatial factors on invasive species richness did not follow the classic species-area relationship (Connor and McCoy, 1979; Powell et al., 2013), which confirms that, although China is rich in plant species, there are still empty habitats for plant invasion at the regional scale, and community niche spaces were not saturated, as also revealed at the global scale (Seebens et al., 2017). The dominant role of introduction time on the diversity of invasive species also indicated that the process of plant invasion is still active (Pyšek and Jarošík, 2005). Species dispersal is one of the leading factors for the present patterns of IAPS diversity in China.
In terms of the contributions of environmental and socio-economic factors on the patterns of IAPS diversity in China, our results are similar to earlier studies (Zhang et al., 2010; Chen et al., 2017; Wang et al., 2017). Natural factors such as climate play a dominant role. Among the climate indices, temperature exceeded the influence of precipitation, especially MTCM and ATR. The independent influence of social and economic activities reflected by per capita GDP and population density were also obvious, but road density showed a very weak effect. Although many studies have used road density as an important indicator of habitat fragmentation (Forman et al., 2002) and an important variable to predict biological invasion (McKinney, 2002; Resasco et al., 2014), it showed little impact on plant invasion in China in this study (Figure 7). There could be several reasons for this inconsistency. First, although roads are suggested to be good corridors for invasive species dispersal, the dispersal of plants by seeds, generally small and often with attachments facilitating dispersion, can make use of all types of empty or disturbed habitats such as farmlands, rivers and ditches and bare lands (Nentwig, 2007), therefore the correlation with road length could be non-linear; and the arrival of IAPS at China might be more important than the road length for alien plants dispersal. Second, there is generally a time lag between available roads and IAPS dispersal taking advantage of the roads, and this time lag will also revealed in the records (Murray and Phillips, 2012; Albano et al., 2018). In contrast, human activities including deforestation and land cultivation in China have changed habitats over substantial areas for thousands of years. This long existing available niche across China for IAPS may not be simply correlated with road density of a particular time. Third, the scale-related road effect on IAPS dispersal has been widely reported (Williamson, 1996; Milbau et al., 2009). Also in southwest mountainous areas of China, Liang et al. (2014) found the correlation between the diversity of invasive plants and the density of low-grade rural roads is much higher than that of high-grade roads. Therefore, more research is needed to evaluate the multi-scale impacts of roads on biological invasions, the road density value of a particular time, as used in this study, seemed not to be an idea indicator for plant invasion.
Biological invasions are generally restricted by environmental filters and dispersal limitation (Vicente et al., 2014), and IAPS with different niche widths and dispersal capacities showed different distribution constraints (McDowell et al., 2014). Based on results of quantile regression, we divided the rate of the invasion range change with introduction year into four quartiles, which represented a sequence of species dispersal capacity from weak to strong. The primary explanatory factor for the diversity pattern of each quantile was different. In particular, for the IAPS groups corresponding to the quantile range of 26–100% and a spatial range of >10 prefectures (i.e., with a strong dispersal capacity), the diversity pattern was always dominated by MTCM, while for those IAPS located in the first quartile 0–25% and with a narrow distribution range (with a weak dispersal capacity), the diversity pattern was mainly limited by indicators of GDP and population. This result suggested that, IAPS of a weaker, rather than stronger, dispersal capacity benefit more from human induced habitat degradations, including soil erosion at terrestrial habitats and eutrophication in aquatic habitats (Scherer-Lorenzen et al., 2007; Albano et al., 2018).
The year of most recently introduction (Tmin) of IAPS in a prefecture is basically the year of most recent introduction into China. Tmin played the strongest role as a single variable in explaining IAPS diversity patterns of each life form or as a whole, this result has several important implications. First, the opportunity of arriving at China, from abroad by all means, is more important for a successful plant invasion than the dispersal condition and habitat availability within China, as also implied in a recent study on aquatic plant invasions (Wu and Ding, 2019). Second, the introductions of IAPS in recent decades is more important than the early introductions for the diversity pattern of IAPS, this is also supported by a larger R2 for Tmin (0.472) than Tmax (0.155) in species richness ∼ introduction year relationship (Figure 6B). Third, since prefectures on the national border generally have smaller Tmin values and more advanced economy and social bases, thus Tmin also indicated the effect of economic-social condition on plant invasion in China.
The past half century has seen the surge of rapid economic growth and globalization, particularly in the Asian-Pacific region. This has been accompanied by an unprecedented global warming since the 1970’s (IPCC, 2014). If these two trends were to continue in the future, as most projections suggested, our results should predict an increasingly urgent threat of plant invasions, along with other invasive organisms.
Conclusion
The current threat of plant invasion in China is represented by a total of 463 invasive alien plant species, comprising 84.4% herbaceous and 15.6% woody plants. With a long history of species introduction that traces back to 2000 years ago, plant introductions accelerated in the 19th century, reached a peak in the early half of the 20th century, and have kept a slower and more stable rate in the last 60 years; however, the spatial expansion of invasions have continued significantly over time. The latitudinal gradient, the coastal + southern border-inland gradient, and the urban-rural gradient characterized the prominent patterns of invasive plant species richness in China. This pattern is similar for the species richness of its three subgroups of life forms, but not for their diversity percentage patterns. Climatic thermal index, particularly low temperature, acted as a primary environmental filter to plant invasion, and the time of most recent introduction of IAPS in a prefecture showed the effect of dispersal limit on plant invasion, via either dispersal distance or dispersal capacity. These two factors jointly dominate the spatial pattern of IAPS richness, implying global warming and economy globalization as the main drivers of plant invasions in China, and probably elsewhere in general.
Data Availability Statement
The raw data supporting the conclusions of this article will be provided upon request to the corresponding author.
Author Contributions
YL compiled the data and prepared the first draft. ZS provided the idea and finalized the manuscript, tables, and figures. Both authors cooperated the data analyses.
Funding
This work was funded by the Key Research and Development Plan of the Ministry of Science and Technology of China (2017YFC0505200) and the National Natural Science Foundation of China (Project Nos. 41971228 and 41371190).
Conflict of Interest
The authors declare that the research was conducted in the absence of any commercial or financial relationships that could be construed as a potential conflict of interest.
Supplementary Material
The Supplementary Material for this article can be found online at: https://www.frontiersin.org/articles/10.3389/fevo.2020.544670/full#supplementary-material
Supplementary Figure 1 | Species richness rank of the invasive alien plants of families in China.
Supplementary Figure 2 | The accumulative increase of alien invasive plant species (IAPS) richness in China since 1600 A.D.
Supplementary Table 1 | The Pearson coefficients between species richness of three life-forms of invasive plants and the environmental and social-economic variables of prefectures in China.
Footnotes
References
Albano, P. G., Gallmetzer, I., Haselmair, A., Tomašovıch, A., Stachowitsch, M., and Zuschin, M. (2018). Historical ecology of a biological invasion: the interplay of eutrophication and pollution determines time lags in establishment and detection. Biol. Invasions 20, 1417–1430. doi: 10.1007/s10530-017-1634-7
Bhattarai, K. R., Måren, I. E., and Subedi, S. C. (2014). Biodiversity and invasibility: distribution patterns of invasive plant species in the Himalayas, Nepal. J. Mount. Sci. 11, 688–696. doi: 10.1007/s11629-013-2821-3
Borcard, D., Legendre, P., and Drapeau, P. (1992). Partialling out the spatial component of ecological variation. Ecology 73, 1045–1055. doi: 10.2307/1940179
Chen, C., Wang, Q., Wu, J., Huang, D., Zhang, W., Zhao, N., et al. (2017). Historical introduction, geographical distribution, and biological characteristics of alien plants in China. Biodivers. Conserv. 26, 353–381. doi: 10.1007/s10531-016-1246-z
Connor, E. F., and McCoy, E. D. (1979). The statistics and biology of the species-area relationship. Am. Nat. 113, 791–833.
Davidson, A. M., Jennions, M., and Nicotra, A. B. (2011). Do invasive species show higher phenotypic plasticity than native species and, if so, is it adaptive? A meta-analysis. Ecol. Lett. 14, 419–431. doi: 10.1111/j.1461-0248.2011.01596.x
Davis, M. A., Thompson, K., and Grime, J. P. (2005). Invasibility: the local mechanism driving community assembly and species diversity. Ecography 28, 696–704. doi: 10.1111/j.2005.0906-7590.04205.x
Dawson, W., Moser, D., van Kleunen, M., Kreft, H., Pergl, J., Pyšek, P., et al. (2017). Global hotspots and correlates of alien species richness across taxonomic groups. Nat. Ecol. Evol. 1:0186. doi: 10.1038/s41559-017-0186
Denslow, J. S., Space, J. C., and Thomas, P. A. (2009). Invasive exotic plants in the tropical Pacific islands: patterns of diversity. Biotropica 41, 162–170. doi: 10.1111/j.1744-7429.2008.00469.x
Ding, J., and Wang, R. (1998). “The impacts of alien species on China’s biodiversity,” in China’s Biodiversity: a Country Study. China Environmental, ed W. P. Zhang (Beijing: Science Press), 58–61.
Ding, J., Mack, R. N., Lu, P., Ren, M., and Huang, H. (2008). China’s booming economy is sparking and accelerating biological invasions. Bioscience 58, 317–324. doi: 10.1641/b580407
Fang, J. (1994). Arrangement of East-Asian vegetation-climate types on coordinates of temperature and precipitation. Acta Ecol. Sin. 14, 290–293.
Feng, J. M., Dong, X. D., and Xu, C. D. (2009). Spatial patterns of floristic composition of invasive alien plants in large scale and their climatic interpretation. J. Wuhan Bot. Res. 27, 159–164.
Forman, R. T. T., Sperling, D., Bissonette, J. A., Clevenger, A. P., Cutshall, C. D., and Dale, V. H. (2002). Road Ecology - Science and Solutions. London: Island Press.
GADM (2018). Database of Global Administrative Areas[DB/OL]. Available online at: https://gadm.org/ (accessed September 1, 2018).
Giorgis, M. A., Cingolani, A. M., Tecco, P. A., Cabido, M., Poca, M., and von Wehrden, H. (2016). Testing alien plant distribution and habitat invasibility in mountain ecosystems: growth form matters. Biol. Invasions 18, 2017–2028. doi: 10.1007/s10530-016-1148-8
Guisan, A., Petitpierre, B., Broennimann, O., Daehler, C., and Kueffer, C. (2014). Unifying niche shift studies: insights from biological invasions. Trends Ecol. Evol. 29, 260–269. doi: 10.1016/j.tree.2014.02.009
Hierro, J. L., Maron, J. L., and Callaway, R. M. (2005). A biogeographical approach to plant invasions: the importance of studying exotics in their introduced and native range. J. Ecol. 93, 5–15. doi: 10.1111/j.0022-0477.2004.00953.x
Horvitz, N., Wang, R., Wan, F., and Nathan, R. (2017). Pervasive human-mediated large-scale invasion: analysis of spread patterns and their underlying mechanisms in 17 of China’s worst invasive plants. J. Ecol. 105, 85–94.
Houseman, G. R., Foster, B. L., and Brassil, C. E. (2014). Propagule pressure-invasibility relationships: testing the influence of soil fertility and disturbance with Lespedeza cuneata. Oecologia 174, 511–520. doi: 10.1007/s00442-013-2781-x
Huang, D., Zhang, R., Kim, K. C., and Suarez, A. (2012). Spatial pattern and determinants of the first detection locations of invasive alien species in mainland China. PLoS One 7:e31734. doi: 10.1371/journal.pone.0031734
Huang, Q. Q., Qian, C., Wang, Y., Jia, X., Dai, X. F., and Zhang, H., et al. (2010). Determinants of the geographical extent of invasive plants in China: effects of biogeographical origin, life cycle and time since introduction. Biodivers. Conserv. 19, 1251–1259. doi: 10.1007/s10531-009-9751-y
Huang, Q., Wang, G., Hou, Y., and Peng, S. (2011). Distribution of invasive plants in China in relation to geographical origin and life cycle. Weed Res. 51, 534–542. doi: 10.1111/j.1365-3180.2011.00868.x
IPCC (2014). Climate Change 2014: Synthesis Report. Contribution of Working Groups I, II and III to the Fifth Assessment Report of the Intergovernmental Panel on Climate Change, eds Core Writing Team Pachauri, R. K., and L. A. Meyer. Geneva: IPCC, 151.
Jauni, M., Gripenberg, S., and Ramula, S. (2015). Non-native plant species benefit from disturbance: a meta-analysis. Oikos 124, 122–129. doi: 10.1111/oik.01416
Khuroo, A. A., Reshi, Z. A., Malik, A. H., Weber, E., Rashid, I., and Dar, G. H. (2012). Alien flora of India: taxonomic composition, invasion status and biogeographic affiliations. Biol. Invasions 14, 99–113. doi: 10.1007/s10530-011-9981-2
Kowarik, I. (1995). “Time lags in biological invasions with regard to the success and failure of alien species,” in Plant Invasions - General Aspects and Special Problems, eds P. Pyšek, K. Prach, M. Rejmánek, and Wade M (Hague: SPB Academic Publishing), 15–38.
Li, X. H., Jiang, D. M., Liu, Z. M., and Li, X. L. (2006). Seed germination characteristics of annual species in temperate semi-arid region. Acta Ecol. Sin. 26, 1194–1199.
Li, X., Tang, S., Wei, C., Pan, Y., and Wang, Y. (2019). Alien invasive plants in the Sino- Vietnamese border area, Guangxi. J. Biosaf. 28, 147–155.
Liang, J., Liu, Y., Ying, L., Li, P., Xu, Y., and Shen, Z. (2014). Do higher level roads have larger impacts on the mountain landscape? A case study of the three parallel rivers region. Chin. Geogr. Sci. 24, 15–27.
Lin, W., Zhou, G., Cheng, X., and Xu, R. (2007). Fast economic development accelerates biological invasions in China. PLoS One 11:e1208. doi: 10.1371/journal.pone.0001208
Liu, J., Dong, M., Miao, S. L., Li, Z. Y., Song, M. H., and Wang, R. Q. (2006). Invasive alien plants in China: role of clonality and geographical origin. Biol. Invasions 8, 1461–1470. doi: 10.1007/s10530-005-5838-x
Lu, P., Sang, W. G., and Ma, K. P. (2005). Progress and prospects in research of an exotic invasive species, Eupatorium adenophorum. Chin. J. Plant Ecol. 29, 1029–1037.
Ma, J. S. eds (2014). The Survey Reports on Chinese Alien Invasive Plants (Part One, Part Two). Beijing: Higher Education Press.
McDowell, W. G., Benson, A. J., and Byers, J. E. (2014). Climate controls the distribution of a widespread invasive species: implications for future range expansion. Freshw. Biol. 59, 847–857. doi: 10.1111/fwb.12308
McKinney, M. L. (2002). Influence of settlement time, human population, park shape and age, visitation and roads on the number of alien plant species in protected areas in the USA. Divers. Distrib. 8, 311–318. doi: 10.1046/j.1472-4642.2002.00153.x
Mehraj, G., Khuroo, A. A., Qureshi, S., Muzafar, I., Friedman, C. R., and Rashid, I. (2018). Patterns of alien plant diversity in the urban landscapes of global biodiversity hotspots: a case study from the Himalayas. Biodivers. Conserv.↰ 27↰ 1055–1072. doi: 10.1007/s10531-017-1478-6
Milbau, A., Stout, J. C., Graae, B. J., and Nijs, Y. (2009). A hierarchical framework for integrating invasibility experiments incorporating different factors and spatial scales. Biol. Invasions 11, 941–950. doi: 10.1007/s10530-008-9306-2
Minor, E. S., Tessel, S. M., Engelhardt, K. A. M., and Lookingbill, T. R. (2009). The role of landscape connectivity in assembling exotic plant communities: a network analysis. Ecology 90, 1802–1809. doi: 10.1890/08-1015.1
Müllerová, J., Pyšek, P., Jarošík, V., and Pergl, J. (2005). Aerial photographs as a tool for assessing the regional dynamics of the invasive plant species Heracleum mantegazzianum. J. Appl. Ecol. 42, 1042–1053. doi: 10.1111/j.1365-2664.2005.01092.x
Murray, B., and Phillips, M. L. (2012). Temporal introduction patterns of invasive alien plant species to Australia. NeoBiota 13, 1–14.
Nentwig, W. eds (2007). Biological Invasion: Section III. Patterns of Invasion and Invasibility. Berlin: Springer- Verlag, 145–214.
Pejchar, L., and Mooney, H. A. (2009). Invasive species, ecosystem services and human well-being. Trends Ecol. Evol. 24, 497–504. doi: 10.1016/j.tree.2009.03.016
Pimentel, D., Zuniga, R., and Morrison, D. (2005). Update on the environmental and economic costs associated with alien-invasive species in the United States. Ecol. Econ. 52, 273–288. doi: 10.1016/j.ecolecon.2004.10.002
Pimentel, D. (2002). Biological Invasions: Economic and Environmental Costs of Alien Plant. Animal, and Microbe Species. Boca Raton, FL: CRC Press.
Powell, K. I., Chase, J. M., and Knight, T. M. (2013). Invasive plants have scale-dependent effects on diversity by altering species-area relationships. Science 339, 316–318. doi: 10.1126/science.1226817
Pyšek, P., Manceur, A. M., Alba, C., Mcgregor, K. F., Pergl, J., Stajerova, K., et al. (2015). Naturalization of central European plants in North America: species traits, habitats, propagule pressure, residence time. Ecology 96, 762–774. doi: 10.1890/14-1005.1
Pyšek, P., Pergl, J., Essl, F., Lenzner, B., Dawson, W., Kreft, H., et al. (2017). Naturalized alien flora of the world: species diversity, taxonomic and phylogenetic patterns, geographic distribution and global hotspots of plant invasion. Preslia 89, 203–274. doi: 10.23855/preslia.2017.203
Pyšek, P., and Jarošík, V. (2005). “Residence time determines the distribution of alien plants,” in Invasive Plants: Ecological and Agricultural Aspects, ed S. Inderjit (Basel: Birkháuser Verlag).
Pys̆ek, P., Jaros̆ìk, V., and Kuc̆era, T. (2002). Patterns of invasion in temperate nature reserves. Biol. Conserv. 104, 13–24. doi: 10.1016/s0006-3207(01)00150-1
R Core Team (2018). R: A Language and Environment for Statistical Computing. Vienna: R Foundation for Statistical Computing.
Resasco, J., Haddad, N. M., Orrock, J. L., Shoemaker, D., Brudvig, L., Damschen, E., et al. (2014). Landscape corridors can increase invasion by an exotic species and reduce diversity of native species. Ecology 95, 2033–2039. doi: 10.1890/14-0169.1
Richardson, D. M., and Pyšek, P. (2006). Plant invasions: merging the concepts of species invasiveness and community invasibility. Prog. Phys. Geog. 30, 409–431. doi: 10.1191/0309133306pp490pr
Sax, D. (2001). Latitudinal gradients and geographic ranges of exotic species: implications for biogeography. J. Biogeogr. 28, 139–150. doi: 10.1046/j.1365-2699.2001.00536.x
Scherer-Lorenzen, M., Venterink, H. O., and Buschmann, H. (2007). “Nitrogen enrichment and plant invasions: the importance of nitrogen-fixing plants and anthropogenic eutrophication,” in Biological Invasions. Ecological Studies 193, ed W. Nentwig (Berlin: Springer), 163–180.
Schmidt, J. P., and Drake, J. M. (2011). Time since introduction, seed mass, and genome size predict successful invaders among the cultivated vascular plants of Hawaii. PLoS One 6:e17391. doi: 10.1371/journal.pone.0017391
Schrama, M., and Bardgett, R. D. (2016). Grassland invasibility varies with drought effects on soil functioning. J. Ecol. 104, 1250–1258. doi: 10.1111/1365-2745.12606
Seebens, H., Blackburn, T. M., Dyer, E. E., and Genovesi, P. (2017). No saturation in the accumulation of alien species worldwide. Nat. Commun. 8:14435.
Seebens, H., Blackburn, T. M., Dyer, E. E., Genovesi, P., Hulme, P., Jeschke, J. M., et al. (2018). Global rise in emerging alien species results from increased accessibility of new source pools. Proc. Natl. Acad. Sci. 115, E2264–E2273.
Shen, Z., Fei, S., Feng, J., Liu, Y., Liu, Z., Tang, Z., et al. (2012). Geographical patterns of community-based tree species richness in Chinese mountain forests: the effects of contemporary climate and regional history. Ecography 35, 1134–1146. doi: 10.1111/j.1600-0587.2012.00049.x
Simberloff, D., Martin, J. -L., Genovesi, P., Maris, V., Wardle, D., Aronson, J., et al. (2013). Impacts of biological invasions: what’s what and the way forward. Trends Ecol. Evol. 28, 58–66. doi: 10.1016/j.tree.2012.07.013
Song, X., Hogan, J. A., Brown, C., Cao, M., and Yang, J. (2017). Snow damage to the canopy facilitates alien weed invasion in a subtropical montane primary forest in southwestern China. For. Ecol. Manag. 391, 275–281. doi: 10.1016/j.foreco.2017.02.031
Stohlgren, T. J., Binkley, D., Chong, G. W., Kalkhan, M. A., Schell, L. D., Bull, K. A., et al. (1999). Exotic plant species invade hot spots of native plant diversity. Ecol. Monogr. 69, 25–46. doi: 10.1890/0012-9615(1999)069[0025:epsihs]2.0.co;2
The Plant List (2013). Published on the Internet. Available online at: http://www.theplantlist.org/ (accessed January 1, 2018).
Traveset, A., and Richardson, D. M. (2014). Mutualistic interactions and biological invasions. Annu. Rev. Ecol. Evol. Sci. 45, 89–113. doi: 10.1146/annurev-ecolsys-120213-091857
Vicente, J. R., Pereira, H. M., Randin, C. F., Gonçalves, J., Lomba, A., Alves, P., et al. (2014). Environment and dispersal paths override life strategies and residence time in determining regional patterns of invasion by alien plants. Perspect. Plant Ecol. 16, 1–10.
Wan, F. H., Guo, J. Y., and Zhang, F. ed. (2009). Research on Biological Invasion in China. Beijing: Science Press.
Wang, G. H., Bai, F., and Sang, W. G. (2017). Spatial distribution of invasive alien animal and plant species and its influencing factors in China Plant Sci. J. 35, 513–524.
Wang, H., López-Pujol, J., Meyerson, L. A., Qiu, J., Wang, X., and Ouyang, Z. (2011). Biological invasions in rapidly urbanizing areas: a case study of Beijing, China. Biodivers. Conserv. 20, 2483–2509.
Weber, E., Sun, S. G., and Li, B. (2008). Invasive alien plants in China: diversity and ecological insights. Biol. Invasions 10, 1411–1429. doi: 10.1007/s10530-008-9216-3
Westphal, M. I., Browne, M., MacKinnon, K., and Noble, I. (2008). The link between international trade and the global distribution of invasive alien species. Biol. Invasions 10, 391–398. doi: 10.1007/s10530-007-9138-5
Wolmarans, R., Robertson, M. P., and van Rensburg, B. J. (2010). Predicting invasive alien plant distributions: how geographical bias in occurrence records influences model performance. J. Biogeogr. 37, 1797–1810. doi: 10.1111/j.1365-2699.2010.02325.x
Wu, H., Carrillo, J., and Ding, J. (2017). Species diversity and environmental determinants of aquatic and terrestrial communities invaded by Alternanthera philoxeroides. Sci. Total Environ. 581–582, 666–675. doi: 10.1016/j.scitotenv.2016.12.177
Wu, H., and Ding, J. (2019). Global change sharpens the double-edged sword effect of aquatic alien plants in China and beyond. Front. Plant Sci. 10:787. doi: 10.3389/fpls.2019.00787
Wu, S. H., Hsieh, C. F., Chaw, S. M., and Rejmanek, M. (2004). Plant invasions in Taiwan: insights from the flora of casual and naturalized alien species. Divers. Distrib. 10, 349–362. doi: 10.1111/j.1366-9516.2004.00121.x
Xu, H., Ding, H., Li, M., Qiang, S., Guo, J., Han, Z., et al. (2006). The distribution and economic losses of alien species invasion to China. Biol. Invasions 8, 1495–1500. doi: 10.1007/s10530-005-5841-2
Xu, H., Qiang, S., Genovesi, P., Ding, H., Wu, J., Meng, L., et al. (2012). An inventory of invasive alien species in China. NeoBiota 15, 1–26.
Xu, H., Qiang, S., Han, Z., Guo, J., Huang, Z., Sun, H., et al. (2004). The distribution and introduction pathway of alien invasive species in China. Biodivers. Sci. 12, 626–638.
Yan, X. L., Liu, Q. R., Shou, H. Y., Zeng, X. F., Zhang, Y., Chen, L., et al. (2014). The categorization and analysis on the geographic distribution patterns of Chinese alien invasive plants. Biodivers. Sci. 22, 667–676.
Zhang, L. Y., Li, Y. B., Huang, J. C., and Liu, X. F. (2019). Evaluation of the short-term and long-term performance of biological invasion management in the China-Myanmar border region. J. Environ. Manage. 240, 1–8.
Zhang, S., Guo, S. L., Guan, M., Yin, L. P., and Zhang, R. X. (2010). Diversity differentiation of invasive plants at a regional scale in China and its influencing factors: according to analyses on the data from 74 regions. Acta Ecol. Sin. 30, 4241–4256.
Zheng, S. S., Chen, X. B., Xu, W. N., Luo, Z. R., and Xia, G. S. (2018). Effects of exotic-native species relationship on naturalization and invasion of exotic plant species. Chin. J. Plant Ecol. 42, 990–999.
Keywords: invasive alien plant, species richness, geographical patterns, introduction time, climate, sub-provincial unit
Citation: Li Y and Shen Z (2020) Roles of Dispersal Limit and Environmental Filtering in Shaping the Spatiotemporal Patterns of Invasive Alien Plant Diversity in China. Front. Ecol. Evol. 8:544670. doi: 10.3389/fevo.2020.544670
Received: 21 March 2020; Accepted: 01 December 2020;
Published: 21 December 2020.
Edited by:
Hang Sun, Kunming Institute of Botany, Chinese Academy of Sciences, ChinaCopyright © 2020 Li and Shen. This is an open-access article distributed under the terms of the Creative Commons Attribution License (CC BY). The use, distribution or reproduction in other forums is permitted, provided the original author(s) and the copyright owner(s) are credited and that the original publication in this journal is cited, in accordance with accepted academic practice. No use, distribution or reproduction is permitted which does not comply with these terms.
*Correspondence: Zehao Shen, c2h6aEB1cmJhbi5wa3UuZWR1LmNu