
94% of researchers rate our articles as excellent or good
Learn more about the work of our research integrity team to safeguard the quality of each article we publish.
Find out more
ORIGINAL RESEARCH article
Front. Ecol. Evol., 03 February 2021
Sec. Behavioral and Evolutionary Ecology
Volume 8 - 2020 | https://doi.org/10.3389/fevo.2020.539061
This article is part of the Research TopicAdvances in Ungulate EcologyView all 22 articles
 Kavita Isvaran1,2*
Despite many decades of research, the evolution of the rare and unusual lek-mating system continues to be debated. The key question is: why do males defend tiny territories clustered together in an aggregation when the costs of doing so are so high? Theory and empirical work on lek evolution typically focus on why males cluster their territories. Surprisingly, the other characteristic feature of classical leks, which is the unusually small size of lek-territories, has received very little attention. Here, I argue that understanding the factors favoring the reduced size of lek-territories can provide fresh insights into the evolution of leks. I used the variable mating system of an Indian antelope, the blackbuck (Antilope cervicapra), to investigate lek territory size. Because there are few quantitative models of mating territory size, I first constructed a spatial simulation model of territory size based on male competition costs and on mating benefits generated by a female bias for mating on central lek-territories, the processes most likely to influence lek-territory size. The model generated much systematic variation in territory size within a territory-cluster and also across territory-clusters varying in the number of territorial males. I tested predictions from the model using comparative data on territory size from six blackbuck populations, and detailed spatial and temporal data from an intensively-studied population. Empirical analyses strongly supported model predictions and assumptions. Based on these findings, I present a novel hypothesis for the small size of classical lek-territories. I suggest that much of the variation in the size of lek-territories can be explained by the competition that arises from a female bias for mating on central territories and that is intensified by the number of territorial males in an aggregation. Thus, the reduced size of classical lek-territories is likely a consequence of a central mating advantage in large aggregations. I present a framework for the evolution of leks that explicitly incorporates the evolution of reduced territory size alongside the evolution of male clustering. This framework can also help explain other forms of mating systems that are based on the defense of mating territories by males.
Animals display marvelously diverse behaviors in their search for mates. Among the most intriguing suites of mating behavior is lek-mating. Here, rather than adopt more conventional strategies, such as defending females from other males or defending resources that attract females, males aggregate, fiercely defend tiny territories, and perform elaborate displays toward potential competitors and mates (Bradbury, 1981; Höglund and Alatalo, 1995). Females visit these aggregations to mate and appear to be free to move between lek-territories. The potential for strong sexual selection on leks and the unusual territorial behavior of lekking males have spurred many theoretical and empirical studies. But, despite extensive efforts, the evolution of lekking is still not fully understood. Why should males cluster together and defend tiny territories when they incur enormous costs of competition associated with such dense aggregations? Hypotheses and empirical tests for the evolution of lekking have typically focused on the clustering aspect of lek territories (Bradbury, 1981; Bradbury et al., 1986; Beehler and Foster, 1988; Gosling and Petrie, 1990; Balmford et al., 1993; Clutton-Brock et al., 1993; Stillman et al., 1993; Widemo and Owens, 1995; Nefdt and Thirgood, 1997; Gibson et al., 2002; Partecke et al., 2002; Bro-Jørgensen, 2003; Jiguet and Bretagnolle, 2006; Duraes et al., 2007; Young et al., 2009; Isvaran and Ponkshe, 2013; Apollonio et al., 2014; DuVal et al., 2018). Males may cluster their territories on hotspots with high female encounter rates (“hot-spot hypothesis,” Bradbury et al., 1986; Westcott, 1997; Jones and Quinnell, 2002). Alternatively, male clustering may arise because males of poorer phenotype cluster around successful “hotshots” (“hotshot hypothesis,” Beehler and Foster, 1988; Partecke et al., 2002). Another hypothesis proposes that males cluster because females prefer to mate with clustered males for various reasons, such as reduced costs of mate-sampling, increased chances of obtaining high-quality mates, and reduced male harassment (Bradbury, 1981; Isvaran and Ponkshe, 2013; Apollonio et al., 2014). Yet another hypothesis is that clusters are better at retaining females than solitary territories (“black hole” model Clutton-Brock et al., 1993; Stillman et al., 1993; Jiguet and Bretagnolle, 2006).
All hypotheses for the evolution of leks, thus, focus on the factors that favor male clustering. However, arguably an equally remarkable feature of lekking is the extraordinarily tiny size of territories. Surprisingly, there are no evolutionary hypotheses or empirical studies focusing on the small size of lek-territories. The implicit assumption in many descriptions of leks appears to be that the characteristically small size results from lek territories being primarily display territories, which females visit solely for mating (Bradbury, 1981; Clutton-Brock et al., 1993; Höglund and Alatalo, 1995). These territories typically do not involve the defense of conventional resources (such as forage and breeding sites) attractive to females. Therefore, unlike resource-based territories, they do not have to be large and territory size is not expected to be an important factor contributing to male mating success. However, comparisons across lekking species reveal an intriguing variation in territory size (Wiley, 1974; Clutton-Brock et al., 1993; Höglund and Alatalo, 1995). In some cases, this variation may even blur the distinction between leks and other territorial systems. For example, in several species, male mating territories are clustered, a lek-like feature, but are large enough so that the resources within territories appear substantial, a feature of resource-based territoriality (e.g., black lechwe Kobus leche smithemani, Thirgood et al., 1992; little bustard Tetrax tetrax, Jiguet et al., 2000; grassquit Volatinia jacarina, Almeida and Macedo, 2001). Within species too, territory sizes vary both among leks of different sizes and within a lek (Ranjitsinh, 1989; Gosling and Petrie, 1990). Because mating territory sizes vary so widely and do not always co-vary with male clustering, investigating the factors underlying variation in mating territory size and, specifically, favoring a reduction in size may provide important insights into lek evolution.
There are few explicit predictions in the literature about the size of lek-territories, or more broadly, the size of display or mating territories (i.e., territories that males establish to display from and that are used for mating rather than for gaining access to food, water, or any other resource). Work on territory size has typically focused on territories that animals defend for conventional resources, such as food and breeding sites (e.g., Davies, 1976; Maher and Lott, 2000; Iossa et al., 2008; Sorato et al., 2015). Therefore, to arrive at quantitative predictions of lek territory size, I first searched the literature for observations concerning lek territories to identify general factors likely to influence their size, and next constructed a formal spatial model of mating-territory size. The main factor I modeled was the movement of females on leks. A large part of male behavior at leks is thought to be in response to female behavior when visiting leks (Höglund and Alatalo, 1995). In particular, a striking pattern reported in most lekking species is that females move to and mate with males on central territories in leks (Clutton-Brock et al., 1988; Trail and Adams, 1989; Gosling and Petrie, 1990; Balmford et al., 1992; Hovi et al., 1994; Höglund and Alatalo, 1995; Isvaran and Jhala, 2000; Bro-Jørgensen and Durant, 2003). Along with higher female visits and mating success in central territories, these territories are also generally smaller than those at the periphery (Kruijt and Hogan, 1967; Fryxell, 1987; Gosling and Petrie, 1990; Hovi et al., 1994). This suggests that males on central territories receive greater competitive pressure from other males seeking to establish territories in areas attractive to females, thereby leading to a reduction in territory size toward the center of the lek. There are several possible explanations for a female bias for central territories on leks (e.g., Gosling and Petrie, 1990; Bro-Jørgensen and Durant, 2003). In this paper, I do not assess these explanations, instead, I evaluate (1) whether a female bias for central territories in a cluster of territories, however caused, can lead to systematic variation in territory size, (2) how this effect varies with the number of males in a territory cluster, and (3) what its implications are for the evolution of the reduced size of lek-territories. I also consider a simple “null” model without any female bias but with only competitive interactions among territorial males.
I then use data from the variable mating system of an Indian antelope, blackbuck (Antilope cervicapra), to empirically test processes that may lead to variation in mating-territory size and, specifically, that may favor small territories. Blackbuck, like many ungulates (e.g., fallow deer Dama dama, Thirgood et al., 1999, topi Damaliscus lunatus, Bro-Jørgensen and Durant, 2003) show variable mating behavior, and provide an excellent opportunity to examine processes maintaining variation in behavior and to identify conditions that favor particular behavioral forms. Male blackbuck defend mating territories that may be solitary or clustered to different degrees including classical lekking (Mungall, 1978; Ranjitsinh, 1989; Isvaran and Jhala, 2000; Isvaran, 2005). Territory size also varies (Mungall, 1978; Prasad, 1989; Ranjitsinh, 1989). Thus, territory distributions may differ dramatically among populations, from solitary, dispersed, large territories to tightly clumped classical leks. However, in all cases, these are primarily mating territories and can be analyzed in a common framework to investigate the factors influencing mating-territory size.
In this paper, I first present a spatial model of mating-territory size that evaluates the influence of a female bias for central territories on territory size. I do not evaluate processes that favor male clustering since this has been addressed extensively by previous studies (e.g., reviewed in Clutton-Brock et al., 1993; Höglund and Alatalo, 1995; Apollonio et al., 2014), but instead focus on processes that may favor a reduction in territory size. I use this model to generate predictions for how territory size should vary within a territory-cluster and across clusters with different numbers of males. I compare predictions from the female-bias model with those from a simple “null” model which does not include female bias but includes local interactions among males. I then test model predictions using data from six blackbuck populations distributed widely across the range of this species. I also use detailed spatial and temporal variation in territory size from one intensively-studied population, including variation among different territory clusters, variation within a cluster over time, and variation in the size of territories of known males over time. I also test the main assumption of the model, about a female bias for central territories, using data on female behavior.
Based on these results, I present a novel hypothesis for the small size of classical lek-territories and, more generally, for variation in the size of mating territories across populations and species. I suggest that much of the variation in the size of lek territories can be explained by the competition generated among males by a female bias for central territories and modulated by the number of territorial males in the aggregation. I compare the roles of a female bias for central territories and alternative processes in producing a central advantage in territorial aggregations. Finally, I present a framework for the evolution of leks that explicitly incorporates the evolution of reduced territory size alongside the evolution of male clustering. This framework can also help explain other forms of mating systems in ungulates that are based on the defense of mating territories by males.
In many lekking species, females move to and mate in the center of a cluster of territorial males (e.g., Balmford et al., 1992; Hovi et al., 1994; Bro-Jørgensen and Durant, 2003). To model the effect of this behavior on territory size, I considered a territorial arena consisting of 900 unit squares of unit size. Males sequentially entered this arena and established a territory (size = 9 units) in the part of the arena that maximized mating benefits to males devalued by the cost of male-male competition. Male mating benefits were assumed to be initially distributed uniformly across the territorial ground (i.e., benefits were drawn from a random uniform distribution). Males could establish territories in unoccupied units and could also choose to overlap their territories with those of other males, in effect, as explained below, choosing to carve out areas from previously established territories. Males did not experience any cost of competition in the unoccupied units, but in areas of overlap, males competed with others previously occupying these areas. They suffered a cost that was proportional to the number of males they were competing with: in each unit, cost = cn where c is a constant and n is the number of males occupying a unit (including the new male). In the absence of competitors, c represents a maintenance cost of territorial behavior. In addition to the costs of competition, males were assumed to share mating benefits in the areas of overlap. These areas of overlap were divided equally among males occupying them while calculating final territory sizes. This, in effect, represents new males carving out areas from previously established territories when setting up new territories. By equally dividing a unit among its occupants, males are assumed to be of equal competitive ability. Thus, the process of territory establishment involved males evaluating the territorial arena and, based on net benefits, choosing to hold territories in empty areas or carving out, to different extents, areas from previously established territories. Note that the area of the territorial arena (900 unit squares) was never limiting. The size of the arena was large enough so that all males in the largest simulated cluster (50 males) could choose to establish territories of the maximum size (9 units). This assumption, that area is never limiting, was made because the habitat available for establishing lek-territories is typically not limiting in lekking species (reviewed in Höglund and Alatalo, 1995). Rather, leks are often found to occupy a relatively small part of the habitat available for territory establishment (e.g., Balmford et al., 1993; Isvaran, 2005; Apollonio et al., 2014).
Once two territories were established, a female bias for mating in the center of an aggregation was modeled as follows. Mating benefits to males were assumed to decline exponentially from the centroid of previously established territories to the periphery (Figure 1). At any given unit u on the arena, the expected mating benefit was given by Mu = p · e−du, where du is the distance of unit u from the centroid of established territories on the mating arena, p is a constant representing mating benefits in the center of the cluster, i.e., when d = 0; and q is a constant representing the strength of a female bias for central territories. The mating benefit surface was recalculated after every territory addition because the center of a territorial aggregation shifts with every new territory added. This process assumes (1) that females show a strong bias to mate in the center of the current territorial aggregation, and (2) the location of maximum female bias shifts to some extent as the center of the territorial aggregation shifts with the addition of each new territory.
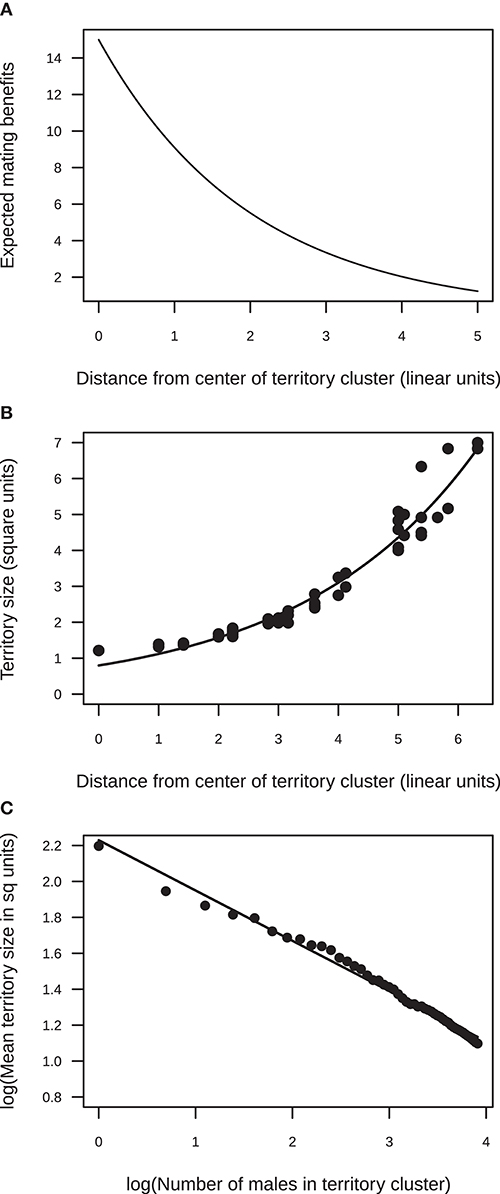
Figure 1. Results from the simulation model of the effect of a female preference to mate in the center of an aggregation on territory size. (A) Mating benefits were assumed to decline exponentially from the center of the aggregation to the periphery (exponent = 0.5). (B) The model predicts that, within a cluster, territory size should increase from the center to the periphery. An example is shown for a cluster of 50 territorial males (the line shows the fit of an exponential function Y = 0.8e0.34X). (C) The model predicts that, across clusters varying in size, mean territory size should decrease non-linearly with cluster size [as indicated by the slope of the log-log plot, log(Y) = 2.22 – 0.28log(X)].
Using these rules, each time a new male entered the territorial ground, the fitness (Ft) of each possible new territory, t, (each territory a set of 9 units) was calculated as where Mu is the expected mating benefit of each unit, c the cost of overlap, nu the number of males occupying that unit (previously established males + new male), and the term (1 − cnu) represents the competition costs (see above) which act to devalue potential mating benefits over and above the maintenance cost of territorial behavior. For example, in an unoccupied unit u the net male mating success is Mu(1 − c) and in a unit u with one previous occupant it is . The term (1 − cnu) was set to 0 if it fell below 0. The territory with the maximum fitness was adopted by the new male. Thus, mating benefits were represented as the number of matings a male could expect to gain in that unit (after incorporating the matings lost to other occupants of that unit as a result of dividing matings equally among occupants, see above), and costs of competition were represented as the proportion of these matings that a male could expect to lose as a result of the energetic costs of competing with other occupants of that unit. Energetic costs could result in a loss in matings, for example, because these costs might reduce the time for which a male is able to retain his territory, and thus reduce his encounter with females visiting that unit. A reduction in territory tenure associated with an increase in fighting rates has been reported in several lekking antelope (Gosling and Petrie, 1990; Isvaran and Jhala, 2000). Note, however, that this representation of costs is meant only as an example. More specific processes generating benefits and costs were not modeled. The assumptions for costs and benefits were kept general because we know very little about patterns and processes in mating territory size. Hence, the main aim of the modeling effort was to construct a simple model of the most likely processes and generate quantitative predictions about patterns in mating territory size.
After all males sequentially established territories, I calculated final effective territory sizes. Areas of overlap were divided equally among males occupying them. I also calculated the mean size of territories in the cluster.
I ran the simulation varying the number of males in a cluster from a solitary territory (“cluster” of 1), to a cluster of 50 males. Note that this model does not investigate the causes of the clustering of territories; instead, it takes clustering as given and then explores how territory size is influenced by (1) the effect of a female central bias and (2) the number of males forming a territory-cluster. Therefore, in all simulations with more than one territorial male entering the territorial ground, clustering is assumed (i.e., territories must share a part of their boundary with at least one other territory).
To evaluate the effect on the model of the strength of female preference to mate at the center of the aggregation, I varied the exponent (q) of the function describing mating benefits from 0 to 0.9. A value of 0 for q represents a null model of no female preference and contains only competition costs. In all these model runs, the parameter p was set at 15 and c at 0.1. Each combination of parameters was run 100 times. The sensitivity of the model to the magnitude of the cost function was also evaluated (Supplementary Figure 2).
Here, I present two types of predictions from the model: (1) how territory size should vary spatially within a cluster (lek) of territories, and (2) how territory size should vary across clusters with different numbers of territorial males. Under a moderate female bias for mating in the center of a cluster of territories (q = 0.5), the size of individual territories varied spatially within a territory cluster. Territory size was smallest in the center of the territorial aggregation and increased to the periphery (Figure 1). This is because more territories were established toward the center than the periphery, which, in turn, was because mating benefits were highest in the center and declined steeply toward the periphery of the cluster. This steep increase in territory size from the center to the periphery was seen in clusters with different numbers of males (Supplementary Table 1). Note that the area of the mating arena (900 unit squares) was never limiting. The size of the mating arena was large enough so that all males in the largest simulated cluster (50 males) could choose to establish territories of the maximum size (9 units). However, because of the pattern in mating benefits, territory sizes were usually much smaller as males tried to establish territories in areas that maximized net benefits.
A comparison across territory-clusters with different numbers of territorial males showed that mean territory size at a cluster decreased exponentially with male numbers (Figure 1). This is because as the number of males attending a cluster increased, many more males established territories toward the center of the aggregation. Even though males who carved out territories in central parts of the arena, in areas already occupied by other males, faced high competition costs, the large mating benefits at the center outweighed these costs. Hence, as male numbers at a cluster increased, the competitive pressure from males attempting to establish territories in areas with high mating benefits also increased. The steepness with which mean territory size declined with the number of territorial males attending a cluster depended on how steeply mating benefits fell away from the center of the cluster, that is, it depended on the strength of the female bias for central territories (Supplementary Figure 1).
Simulations representing a “null” model of no effect of female bias were also run. When mating benefits were assumed to be uniform throughout the territorial arena (exponent q = 0), territory sizes did not vary systematically from the center to the periphery within a cluster. In addition, mean territory size did not vary systematically across clusters with different numbers of territorial males (Supplementary Figure 1). Because mating benefits were not concentrated in a particular part of the aggregation, males gained no benefit from attempting to carve out territories in previously occupied areas to outweigh the cost of competition. Instead, new males established territories at the edge of the existing cluster. In these simulations, habitat for territories was never limiting, and such a lack of limitation has commonly been shown in lekking species (see Höglund and Alatalo, 1995). The results from this “null” model suggest that in the absence of a systematic spatial pattern in benefits across the territorial arena, costs associated with territorial interactions alone are unlikely to give rise to systematic variation in territory size, either within or between territory clusters.
Overall, the simulation model predicted that, given a female bias for central territories, (1) within a territory-cluster, territory size should increase from the center to the periphery, and (2) across clusters with different numbers of territorial males, mean territory size should decrease as the number of males in a cluster increases.
The blackbuck is a small antelope (31–45 kg, Ranjitsinh, 1989) native to the Indian subcontinent. It is a group-living, selective grazer. Mating typically occurs on mating territories that males defend. While males have also been observed courting females in mixed-sex groups, these seldom end in successful matings (Mungall, 1978; Prasad, 1989; Ranjitsinh, 1989; Jhala and Isvaran, 2016). Although some breeding occurs throughout the year, there are two prominent annual mating peaks, one in March and April and another from August to October (Ranjitsinh, 1989).
To test predictions from the model, I use data on territory size collected from six blackbuck populations in India from August to November 1998 and 1999 (Isvaran, 2003). These sites were Tal Chappar in Rajasthan state, Velavadar and Savainagar in Gujarat state, Nannaj in Maharashtra state, Rollapadu in Andhra Pradesh state, and Point Calimere in Tamil Nadu state (details of these study sites are presented in Isvaran, 2005, 2007). Territory size patterns were studied more intensively in one population, Velavadar in Gujarat, from February to May 2001.
I spent 2–4 weeks at each population during August-November (which covers a mating peak) in 1998 and 1999. At each site, I surveyed the area repeatedly and recorded putative territorial males. This was made possible by the relatively small size of study areas (Isvaran, 2005). Putative territorial males were observed during three to six 1-h watches performed during morning and evening hours when territorial and mating activity is high (Isvaran and Jhala, 2000). During these watches, I recorded the area used by males and interactions between males. Neighboring males engage in frequent displays (nose-up displays, parallel walks, Mungall, 1978) and fights at the boundaries of their territories (Mungall, 1978; Ranjitsinh, 1989; Isvaran and Jhala, 2000). From these data, I identified territory clusters, defined as territories that shared boundaries. Territory clusters were typically identified unambiguously because clusters were usually at least half a km apart (while the average nearest-neighbor distance between males within a cluster was 80 m). Mean territory sizes were estimated for a sample of territory clusters (mean = 4 clusters, range = 2–6) at each population. For each of these clusters, I measured territory sizes for a sample of males (mean = 5 males, range = 1–15). During 1-h focal watches, I noted the location of males every 5 min. Males were typically active and moved over the majority of the area subsequently recorded as their territories within the first half hour. At the end of these watches, I estimated territory size by pacing out the longest and shortest axes of the area used by each male during the watch. Territories varied in shape but were well-approximated by an ellipse.
Territorial and mating behavior was studied more intensively at Velavadar in Gujarat from February 5 to May 1, 2001. I studied the principal lek (maximum of 90 males) and four relatively small clusters (with a maximum of 8, 4, 4, and 3 males). Blackbuck use dung piles, formed by repeated defecation at a site, to mark territories and a territory typically contains a principal central dung pile and several smaller dung piles at the periphery and elsewhere in the territory (Mungall, 1978; Prasad, 1989; Isvaran and Jhala, 2000). I mapped the principal dung pile of each territory in the clusters studied using a 30 m tape measure and permanent markers on the territorial ground. I identified territory boundaries by observing interactions (Nose-up displays, parallel walks and fights; Mungall, 1978; Ranjitsinh, 1989) between neighboring males. I then estimated territory sizes by measuring with a tape measure the longest and shortest axes of the area used by males and using the formula for the area of an ellipse. I also identified individual males using horn characteristics (Isvaran and Jhala, 2000), and recorded changes in the number of territories and ownership at least once in 3 days at the main lek and once a week at the smaller clusters. Furthermore, at the main lek, I intensively monitored the sizes of 20 territories (randomly chosen at the beginning of the study), at least once in 3 days, throughout the mating peak.
To test the key model assumption that mating benefits decline from the center to the periphery of a cluster, I studied spatial patterns in female visits. Previous work at this study population established that female visits were closely correlated with mating success (Isvaran and Jhala, 2000). I recorded female location and behavior on the main lek at Velavadar during 1-h scan-sampling sessions. During each session, I scanned the lek every 15 min and recorded the location of all observed females and male intruders on territories. Females spend variable amounts of time at the lek (8–120 min; Isvaran K, unpublished data) and move among multiple territories during their visit. Therefore, observations across scans within a session are unlikely to be highly correlated. Scan sessions for female numbers and location on the lek were conducted in the afternoons and evenings as mating activity is concentrated during these hours (Isvaran and Jhala, 2000). I conducted these sessions at least once a week during the study period, and every 2 days during the peak in mating activity (28 February−14 March).
I tested model predictions using four kinds of variation in territory size: (1) variation in mean territory size among territory-clusters from different populations; (2) variation in mean territory size within a territory-cluster over time; (3) spatial variation in the size of individual territories from the center to the periphery of a territory-cluster; and (4) variation in the size of the territories of known males over time. To test the first model prediction that territory size should vary spatially from the center of the territory cluster to the periphery, data from the main lek at Velavadar from the peak in mating activity (28 February−14 March) were used to build a Generalized Least Squares (GLS) model with territory size as the response, distance from the center as the predictor, and with potential spatial non-independence incorporated into the error structure by modeling correlations between territory-pairs as a linear function of the distance between them (Pinheiro and Bates, 2000). The center of a cluster was defined as the center of gravity, centroid, of all territories in the cluster in that period.
The second prediction that mean territory size should vary with the number of territories in a cluster, specifically that mean territory size should decrease with increasing number of territorial males at a cluster, was tested with data from multiple scales. I first used data from the six populations and calculated the mean territory size for each territory cluster for the six populations. A linear mixed-effects (LME) model was then fitted with mean territory size of a cluster as the response variable, the number of territorial males attending the cluster as the main predictor, and with study site as a random effect to account for non-independence among clusters from the same population. I then tested the prediction using temporal variation in territorial male numbers at the main lek at Velavader. To examine the change in mean territory size at the main lek at Velavadar as the number of territorial males attending the lek varied over time, a GLS model was built with mean territory size on a given day as the response variable, the number of territorial males on that day as the predictor variable, and with a first-order autocorrelation with a time covariate. GLS methods allow one to incorporate the possibility that mean territory size at a cluster estimated on successive days may be more correlated than values further separated in time. Finally, I also tested the prediction using data from individually identified males. An LME was fitted with the territory size of known males as the response variable, the number of territorial males attending a cluster when each territory size measurement was made as the predictor, and male identity as a random term. Territory size was loge-transformed in all analyses to normalize errors. In addition, in all analyses, two alternative shapes of the relationships between territory size and the main predictors (number of territorial males, distance from lek-center) were evaluated, namely exponential and power relationships, by comparing the fit of models using raw and loge-transformed values of the main predictors. The type of relationship that gave the better fit is reported here.
The assumption about female bias in the territory size model was tested using data on the location of female visits at the main lek at Velavadar. The relationship between female visits and distance from the lek-center was analyzed by first, dividing the lek-area into concentric bands 40 m in diameter and centered about the lek-center; second, calculating the mean number of females (averaged across scans within a sampling session and then across the 20 sampling sessions) per unit area for each of these bands; and third, using ordinary least-squares (OLS) analyses on loge-transformed data.
In all analyses, conditional t- and F- tests were used to test fixed effects, and likelihood ratio (LR) tests to test the effects of spatial and temporal correlations in GLS models and of random terms in LME models (Pinheiro and Bates, 2000). The residuals from analyses were checked for deviations from model assumptions. If random terms were not statistically detectable in LME or GLS models, they were dropped and results from OLS models are shown. All analyses were run in R ver 3.6.2 (R Core Team, 2019). The package nlme (Pinheiro et al., 2019) was used to run GLS and LME models.
This prediction was tested using data from the main lek at Velavadar during the peak in mating (28 Feb−14 Mar). As predicted, territory sizes at the main lek increased exponentially with the distance from the lek center (Figure 2; GLS, logY = 6.07 + 0.01X, N = 34 territories, t = 5.33, df = 1, P < 0.0001).
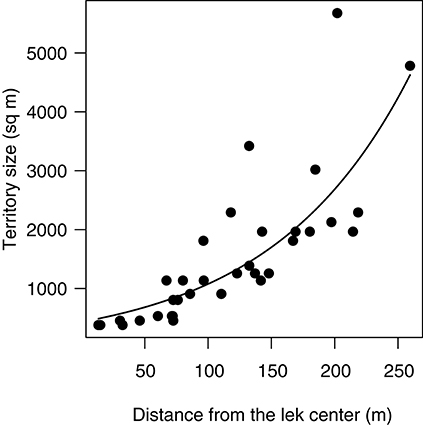
Figure 2. Spatial patterns in territory size at the main lek in Velavadar during the peak in mating activity (28 February−14 March). Territories were smallest in the lek-center and increased toward the periphery. The curve is the prediction from the GLS model (see methods). Each data point is a territory.
Territory sizes varied widely both among and within populations from territories 350–100,000 m2 in area. The number of territorial males attending a cluster also ranged widely from solitary males (“cluster” size = 1) to clusters of 50 territorial males. Pooling together territory-clusters from all six populations, the mean size of territories in a cluster was strongly negatively related to the number of territorial males in that cluster. Mean territory size in a cluster declined disproportionately with the number of territorial males at a cluster as indicated by the slope of the relationship between the two loge-transformed variables [Figure 3; OLS; n = 23 clusters; intercept: estimate (s.e.) = 10.95(0.27), t = 40.58, df = 1, p < 0.0001; slope: estimate (s.e.) = −1.08(0.15), t = −7.35, df = 1, p < 0.0001]. This decline was also apparent among the smaller subset of clusters within each population (Figure 3). The random intercept was not statistically detectable (LR test: p > 0.5).
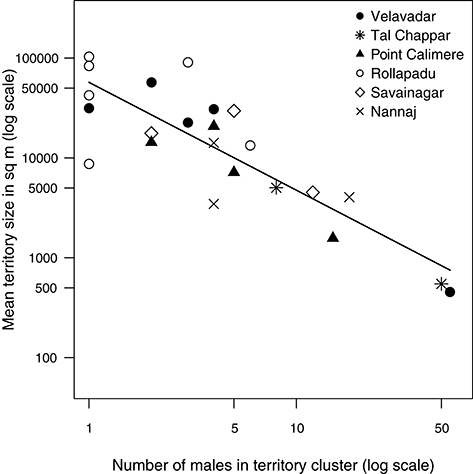
Figure 3. Relationship between the number of territorial males in a cluster and mean territory size pooling together data from six blackbuck populations. Mean size of territories in a cluster decreased rapidly with the number of males in a cluster. Each data point represents a cluster and is an average of the size of a sample of territories from that cluster (range = 1–15 territories). Each set of symbols represents clusters from a particular population. The relationship is strongly non-linear and hence the data have been log-transformed to obtain a better view of the pattern. The line represents the model prediction from a linear model (see methods).
At Velavadar, the intensive study site, the number of territorial males varied at the main lek and at the smaller clusters throughout the study period. At the main lek, the number of territorial males increased from 35 males in the beginning of February to 90 males in the middle of March and then fell to 43 males in the end of April (Figure 4). Corresponding to the change in territorial male numbers, the mean size of territories at the lek also changed (GLS with loge-transformed mean territory size and male numbers; intercept: estimate (s.e.) = 8.4(0.49), t = 17.22, p < 0.0001; slope: estimate (s.e.) = −0.27(0.12), t = −2.17, p = 0.042; n = 22 days). Mean territory size decreased with an increase in territorial male numbers in March and then increased again once territorial male numbers declined in April (Figure 4).
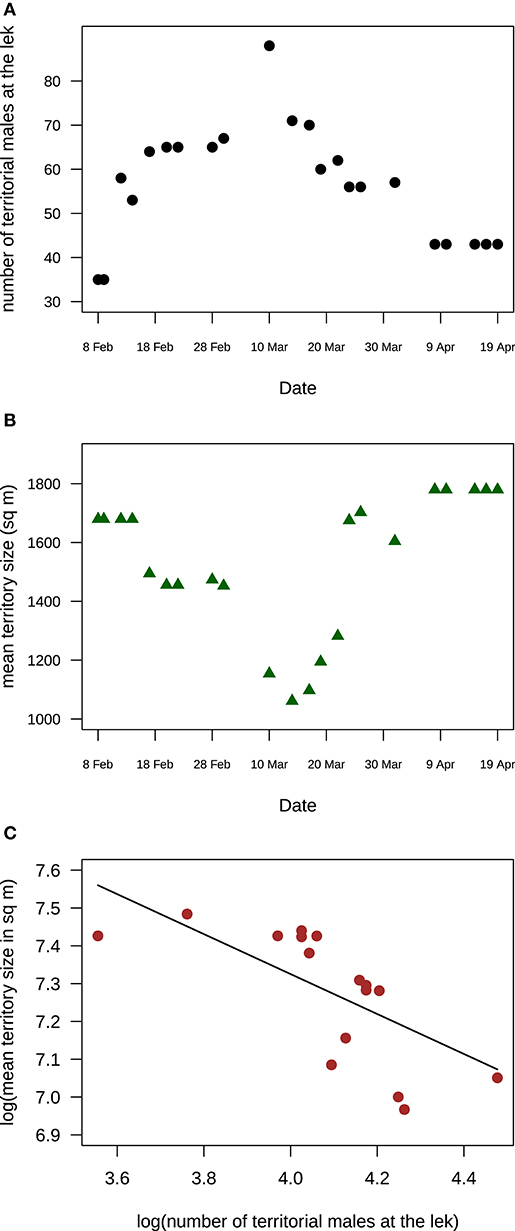
Figure 4. Temporal variation in territory size and male numbers at the main lek in Velvadar indicated that mean territory size was negatively correlated with the number of males holding lek-territories (A) The number of males holding territories at the main lek in Velavadar increased, peaked and then decreased during the March-April mating peak, from 8 Feb to 19 April 2001. (B) Mean territory size at the main lek in Velvadar decreased to a minimum and then increased during the same mating season. (C) Mean territory size was negatively related to the number of territorial males at the main lek. The line shows the estimated relationship from a GLS model. In all three panels, each data point is a day. Territory sizes are the means of 23 territories whose sizes were monitored throughout the mating season.
Changes in territory sizes of known individual males were also negatively related to changes in the number of territorial males attending a cluster both at the main lek and at the smaller clusters [Figure 5; LME on loge-transformed data: intercept: estimate (s.e.) = 12.28(0.41), t = 30.07, p < 0.0001; slope: estimate (s.e.) = −0.93(0.12), t = −7.62, p < 0.0001; n = 34 measurements from 17 males]. Interestingly, the slope of the relationship indicates that the degree to which territory size changed for a given change in cluster size (e.g., an addition of one territory) was higher in small clusters than at a large one (Figure 5).
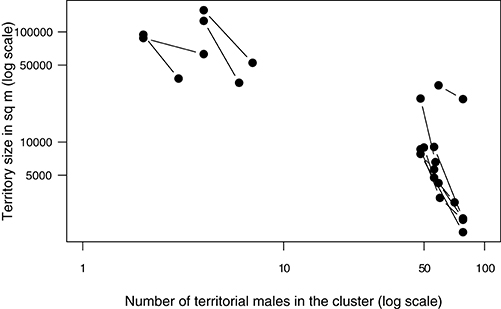
Figure 5. The territory sizes of individual males changed apparently in response to the number of territorial males in the aggregation. Displayed here are examples of the change in the size of territories of known individuals in relation to the change in the number of males in the territory-cluster that the individuals belonged to. Each pair of data points connected by a line is the territory size of the same individual male measured on two different days when the number of territorial males in their territory-cluster differed. A subset of data is shown from small clusters (maximum number of territorial males ranging from 4 to 8) and from the large main lek. The relationship is strongly non-linear and hence the data have been log-transformed to obtain a better view of the pattern.
Female numbers on the lek were concentrated at the lek center (Figure 6). The mean number of females per scan per unit area decreased rapidly with distance from the center of the lek. Previous work at the same study site had already shown that matings and courtship were similarly concentrated in the lek center (Isvaran and Jhala, 2000).
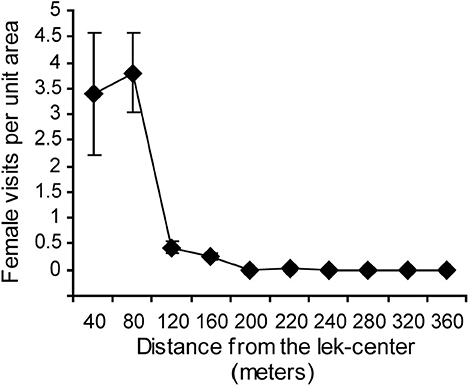
Figure 6. Female visits were highest in the center of the lek and decreased toward the periphery. Means and standard errors based on 20 scan sessions are shown.
To understand the selective factors promoting the characteristically reduced size of lek territories, I modeled the effect of a female bias for central territories, a common female mating behavior on leks. This model generated much variation in territory size and made predictions about the patterns that this variation should show and the conditions favoring small territories. Empirical analyses from blackbuck strongly supported model predictions and key assumptions. These findings outline a clear evolutionary process for the evolution of reduced size of lek territories. I argue that lek territory size results from competition generated by a female bias for central territories and modulated by the number of territorial males attending an aggregation. Furthermore, both in the model and in the data from blackbuck, there was a range of conditions under which males clearly clustered their territories, but reduced territory sizes and classical leks did not occur. Therefore, I also argue that alongside formulating hypotheses for male clustering, understanding the processes underlying the classically small territory sizes in leks is key to understanding the evolution of leks.
The female bias model and data from blackbuck suggest that the characteristically small size of lek-territories, a key feature of lekking, is explained well by competition that arises from a female bias for mating on central territories and that is intensified by the number of territorial males in an aggregation. First, the model predicted that within a territorial aggregation, territory size should decrease from the periphery to the center, as a consequence of increased competition for the areas preferred by females. This prediction was closely matched by data from blackbuck. This pattern has also been reported from many lekking species (e.g., White-eared kob, Kobus kob leucotis, Fryxell, 1987; topi, Damaliscus lunatus, Gosling and Petrie, 1990, black grouse, Tetrao tetrix, Hovi et al., 1994, sage grouse, Centrocercus urophasianus, Wiley, 1991).
Second, across territory clusters varying in the number of attending territorial males, the female bias model predicted that mean territory size should decrease as male attendance increases, because the competition for more central territories intensifies with an increase in the number of males attempting to defend territories. As predicted, mean territory size in blackbuck was strongly negatively associated with the number of territorial males in a cluster. This pattern was seen across multiple blackbuck populations, in comparisons of mean territory size in clusters with different numbers of territorial males. Even at individual clusters, mean territory size was strongly associated with territorial male numbers, as territorial males numbers changed over time. For example, mean territory size at the main lek in Velavadar decreased as the number of lekking males increased and then increased again as territorial males left the lek toward the end of the mating season. A third line of support was provided by changes in the territory sizes of known males. Again, individual territories expanded when the number of males at a territory cluster decreased and shrank when more males joined the cluster. Interestingly, the female bias model predicted that since territory size is expected to decrease disproportionately with territorial male numbers, the incremental change in territory size should be greater at small than at large clusters. This prediction was also supported by data from blackbuck. Apart from reflecting the influence of the number of territorial males in an aggregation, these results also suggest that territory size is dynamic and changes flexibly in response to immediate changes in costs and benefits.
Taken together, the model and the lines of evidence presented above suggest that variation in mating territory size, and specifically the reduced territory size in classical leks, in species such as blackbuck can be explained by two interacting factors: a female bias for mating on central territories and territorial male numbers at a cluster. A female bias for mating in the center of a territorial aggregation can lead to a reduction in the size of territories toward the center as a result of males competing to establish territories as close as possible to areas preferred by females. Central territories receive more competitive pressure from males and are smaller than peripheral ones. This pressure on central territories can escalate with the number of males attending a territory-cluster. Thus, female bias and the number of males in an aggregation may interact so that the effect of a female preference is greatest when territorial male numbers are high and the smallest territories are found in the largest aggregations. The reduced size of lek territories may, therefore, be explained by a central mating advantage in large aggregations.
The importance of a central advantage was also highlighted by a simple “null” model which did not include female bias but included the other rules concerning the costs of competition and local interactions between males. This did not produce systematic variation in territory size suggesting that in the absence of systematic spatial variation in benefits, the presence of competitive male interactions alone is not sufficient to explain the small size of lek territories. Note that in all simulations habitat for territories was unlimited, as has been typically reported for lekking species (reviewed in Höglund and Alatalo, 1995), including blackbuck (Isvaran, 2005). If habitat is limited, then competition for available habitat could result in mean territory size decreasing as territorial male attendance increases.
The main assumption of the female bias model, that mating benefits decline exponentially from the center of the aggregation to the periphery, was supported by data from blackbuck. Both female numbers (this study) and mating activity (Isvaran and Jhala, 2000) declined exponentially from the lek center. Furthermore, studies of many lekking species report similar spatial patterns in female visits and mating success (reviewed in Höglund and Alatalo, 1995) suggesting that territory size variation may be related to a central territory advantage in a wide range of lekking species. Note, however, that a decrease in female visits and mating benefits from the lek-center to the periphery could arise for multiple reasons. Females may use territory centrality as a cue in mate choice (e.g., Isvaran and Jhala, 2000; Bro-Jørgensen and Durant, 2003). Alternatively, females may preferentially visit males of a particular phenotype (e.g., Rintamäki et al., 1995; Vitousek et al., 2008) who are then surrounded by less-preferred males attempting to intercept females traveling to mate with attractive males. Both these processes are expected to generate competition among males for more central territories, but the nature of competition is likely to be different.
The second important factor in the model, the number of territorial males forming a cluster, is likely to be influenced by local female distribution in blackbuck. At Velavadar, variation in local numbers of territorial males at a spatial scale of a square kilometer was closely related to local variation in female group size (Isvaran, 2005) and local female abundances. Local female abundances were, in turn, closely related to ecological conditions, specifically openness of the habitat and forage availability (Isvaran, 2007). Thus, apart from evolutionary factors, such as selection for a female mating bias for central males and selection for male clustering, ecological factors affecting local densities likely affect whether leks form in a population.
Although the main mechanism in the model is a female bias for mating in the center, the model can be interpreted more generally as one in which benefits to territorial males are highest in the lek center, thereby generating increased competition for central territories. Therefore, any process that results in a strong central advantage to males could lead to the kind of variation in territory size predicted by the model. Three factors (apart from female bias) that are thought to be important in lekking species and therefore, should be assessed are the harassment of estrous females by non-territorial intruders, predation risk, and female copying.
In many lekking species, courtship is often disrupted by intruding non-territorial males harassing the female and such harassment is thought to play an important role in the maintenance of leks by favoring male territory clustering (Clutton-Brock et al., 1993; Nefdt and Thirgood, 1997). This factor has not been previously discussed in relation to territory size. Male intrusions might explain variation in territory size if patterns in intrusion rates lead to greater benefits to males on central territories than to those on peripheral ones. For example, this might occur if it becomes progressively more difficult for intruders to penetrate into the center of leks because of the resistance from territorial males that they encounter during their progress into a cluster. However, in blackbuck, intrusion rates were highest in the lek-center and decreased toward the periphery, suggesting that intrusions by non-territorial males are unlikely to influence lek territory size in this species (K Isvaran, unpublished data). Another lekking antelope, D. lunatus, shows a similar pattern of high intrusion rates on central lek-territories (Bro-Jørgensen, 2002). There are few data on spatial variation in predation risk within a lek. One study of lekking kob (Kobus kob thomasi) reported that the distribution of carcasses on a lek did not support a reduction in predation rates from the periphery of the lek to the center although peripheral males did show greater vigilance than central males (Balmford and Turyaho, 1992). It remains to be investigated whether patterns in predation risk within clusters may provide a central territory advantage leading to territory size variation.
Female copying, while difficult to assess in the field, is thought to be an important source of variation in male mating success in several lekking species (Gibson et al., 1990; Clutton-Brock et al., 1993; Höglund and Alatalo, 1995). Female copying could also influence territory sizes by leading to a strong decline in mating benefits from the center of a cluster to the periphery. Suppose the first few females entering a lek mate on a particular territory on the lek (chosen either at random or based on mating preferences). If their locations are copied by females subsequently visiting the lek, this would give rise to a pattern of mating benefits that decline sharply from the site of initial female preferences. Such a female copying model is likely to make predictions similar to the model of female bias for mating in the center. Data from several lekking species suggest that the initial females visiting a lek and females visiting a lek alone do not randomly visit territories but preferentially visit central territories (Höglund and Alatalo, 1995). Thus, there seems to be a preference to visit central territories that is independent of copying. To summarize, intrusion rates are unlikely to influence lek-territory size and there is, at present, little evidence for the influence of predation risk and female copying. A female bias for central territories is currently the most likely factor to generate a strong central advantage and thereby influence territory size in a wide range of lekking species.
Since this is the first systematic study of lek-territory size, I aimed to present a simple, general model that incorporates factors most likely to influence territory size and makes quantitative predictions about patterns in lek-territory size. An empirical test revealed that this simple model can explain much of the variation in territory size seen at different scales in blackbuck leks. Apart from the processes considered in this study (a central territory advantage and number of competitors), several other factors could potentially influence lek-territory size. For example, together with paying attention to immediate costs and benefits, males returning to the lek in successive mating seasons may show fidelity to locations where they have previously held territories (Rintamäki et al., 1995; Kokko et al., 1998). Males typically vary in their competitive ability (Alatalo et al., 1991; Bro-Jørgensen and Durant, 2003; Ciuti and Apollonio, 2011) and this could influence the location and size of their territories. The relatedness between males on a lek (Lebigre et al., 2014) may also influence the nature of their competition and territory size. In future work, as data on lek territory sizes become available, more detailed and complex models could be constructed that examine the impact of these additional factors on lek territory size.
The model and empirical tests of lek territory size have two major implications for the evolution of leks. First, the hypothesis for lek territory size presented here strongly suggests that understanding lek evolution requires examining the causes of variation in both male clustering and territory size (Figure 7). Even if male clustering (the factor that is typically explored by studies of lek evolution) is favored, classical leks may not form if the conditions for a reduction in territory size are not met. For example, consider a small population in which clustering is strongly selected for. Even if all territorial males in that population cluster together, the number of males attending a cluster will remain small. When the number of territorial males in an aggregation is low, the model predicts that territory sizes will be relatively large, unlike classical lek territories. The territorial system is then likely to resemble the clustered resource-based mating territories seen in some antelope (e.g., low density populations of D. lunatus) or the exploded leks seen in some bird species, rather than classical leks. Thus, the two main characteristics of lekking—male clustering and reduced territory size—may not always co-vary and may be affected by different sets of factors. This may explain why leks are so rare, even though mating systems based on the defense of mating/display territories by males are fairly common (Clutton-Brock, 1989). That is, if leks form only when multiple conditions that favor male clustering and reduced territory size are met, we would expect that a change in any of these conditions will result in the disappearance of leks and the appearance of a different form of spatial distribution of mating territories.
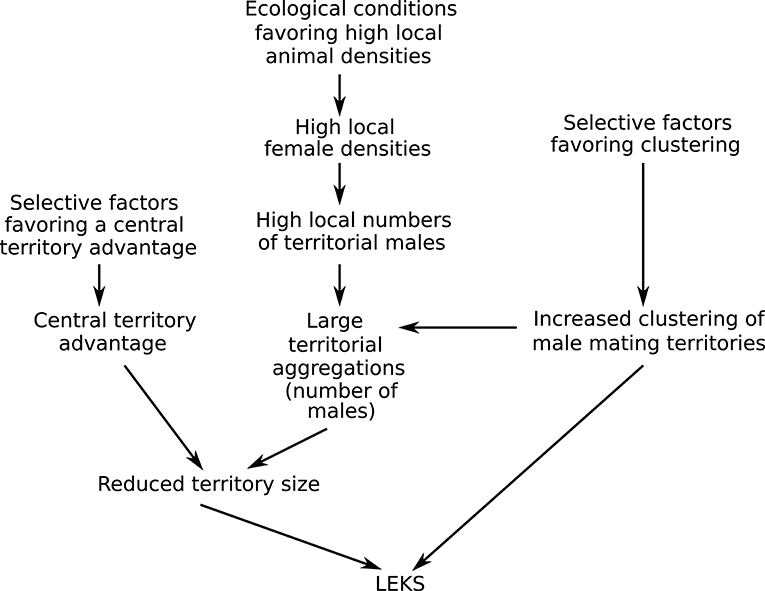
Figure 7. A hypothesis for the evolution of leks that proposes that leks are the outcome of selection acting on two male traits: clustering of territories and the size of mating territory. Leks form when conditions favoring both male clustering and reduced territory size are met. This study, focusing on reduced territory size, proposes that both evolutionary and ecological factors interact to produce the tiny territories characteristic of classical leks. A central territory advantage (e.g., provided by a female bias for central territories) in large territorial aggregations likely results in reduced territory sizes. Large territorial aggregations (many males in an aggregation) are likely to be an outcome of the male decision to cluster interacting with ecological conditions that favor high local numbers of territorial males.
A second implication of this study is that there is a strong role for ecology in the formation of classical leks in an area (Figure 7). The female bias model and data from blackbuck indicate that the tiny size of classical lek territories is seen only when the number of territorial males in an aggregation is relatively high. That is, even when a population shows male clustering and a female bias for central territories (both evolved traits), if territorial male numbers are low, territory sizes are likely to remain large and classical leks are unlikely to form. Previous work on blackbuck suggests that territorial male numbers in an area are strongly correlated with local female densities, which, in turn, are affected by ecological conditions related to predation risk and food. Thus, to understand the maintenance of the lek mating system, we need to evaluate both evolutionary processes favoring key male and female mating decisions (such as clustering and a central bias) and ecological processes favoring high local densities. This link between local animal densities and lekking has previously been reported (Leuthold, 1966; Clutton-Brock et al., 1993; Deutsch, 1994). For example, Clutton-Brock et al. (1993) report that with a decrease in local animal densities as a result of hunting, lekking disappeared and was replaced by the defense of larger resource-based mating territories. However, while these studies call lekking a “default” mating tactic when female densities are high, they have not been able to find a mechanism connecting the two. The findings from this study on the impact of the number of territorial males in an aggregation provide a potential mechanism for the influence of high local densities on lek formation.
An extension of the argument presented above is that the female bias model of territory size can suggest novel explanations for the occurrence of territorial systems intermediate between lekking and resource-based territories. Specifically, it shows that by varying the central territory advantage and/or territorial male numbers at a cluster we can get territorial distributions ranging from large dispersed territories to classical leks. Evidence for such processes is provided by findings from a non-lekking K. kob thomasi population with clustered, resource-based territories. Fischer and Linsenmair (1999) report that a reduction in the number of territorial males at clusters over several years was associated with an increase in mean territory size. These results suggest that the factors captured by the female bias model: (1) decline in benefits from the center of an aggregation to the periphery (leading to male-male competition for central locations); and (2) size of the aggregation (influencing the magnitude of the competition for more central locations), may be more widely applicable to a range of territorial systems.
All datasets generated for this study are included in the article/Supplementary Material.
The animal study was reviewed and approved by Institute Animal Care and Use Committee, University of Florida.
KI designed the study, collected the data, performed statistical analyses, and wrote the manuscript.
The author declares that the research was conducted in the absence of any commercial or financial relationships that could be construed as a potential conflict of interest.
I am grateful to the Forest Departments of Rajasthan, Gujarat, Maharashtra, Andhra Pradesh, and Tamil Nadu for permission to work in protected areas and for support in the field; the Indian Institute of Science, the Animal Behavior Society, the American Society for Mammalogists, Sigma Xi and University of Florida for funds; Ben Bolker, Jane Brockmann, Suhel Quader, YV Jhala, and Colette St. Mary for discussions and comments on the manuscript; and two reviewers for constructive comments on the manuscript.
The Supplementary Material for this article can be found online at: https://www.frontiersin.org/articles/10.3389/fevo.2020.539061/full#supplementary-material
Alatalo, R. V., Höglund, J., and Lundberg, A. (1991). Lekking in the black grouse—a test of male viability. Nature 352, 155–156. doi: 10.1038/352155a0
Almeida, J. B., and Macedo, R. H. (2001). Lek-like mating system of the monogamous blue-black grassquit. Auk 118, 404–411. doi: 10.1093/auk/118.2.404
Apollonio, M., De Cena, F., Bongi, P., and Ciuti, S. (2014). Female preference and predation risk models can explain the maintenance of a fallow deer (Dama dama) lek and its ‘handy’location. PLoS ONE 9:e89852. doi: 10.1371/journal.pone.0089852
Balmford, A., Albon, S., and Blakeman, S. (1992). Correlates of male mating success and female choice in a lek-breeding antelope. Behav. Ecol. 3, 112–123. doi: 10.1093/beheco/3.2.112
Balmford, A., Deutsch, J. C., Nefdt, R. J., and Clutton-Brock, T. (1993). Testing hotspot models of lek evolution: data from three species of ungulates. Behav. Ecol. Sociobiol. 33, 57–65. doi: 10.1007/BF00164347
Balmford, A., and Turyaho, M. (1992). Predation risk and lek-breeding in Uganda kob. Anim. Behav. 44, 117–127. doi: 10.1016/S0003-3472(05)80761-4
Beehler, B. M., and Foster, M. S. (1988). Hotshots, hotspots and female preferences in the organization of lek mating systems. Am. Nat. 131, 203–219. doi: 10.1086/284786
Bradbury, J. (1981). “The evolution of leks,” in Natural Selection and Social Behavior, eds R. D. Alexander and T. W. Tinkle (New York, NY: Carron Press), 138–169.
Bradbury, J. W., Gibson, R. M., and Tsai, I. M. (1986). “Leks and the unanimity of female choice,” in Evolution: Essays in Honour of John Maynard Smith, eds P. J. Greenwood, P. H. Harvey, and M. Slatkin (Cambridge: Cambridge University Press), 301–314.
Bro-Jørgensen, J. (2002). Overt female mate competition and preference for central males in a lekking antelope. Proc. Natl. Acad. Sci. U.S.A. 99, 9290–9293. doi: 10.1073/pnas.142125899
Bro-Jørgensen, J. (2003). The significance of hotspots to lekking topi antelopes (Damaliscus lunatus). Behav. Ecol. Sociobiol. 53, 324–331. doi: 10.1007/s00265-002-0573-0
Bro-Jørgensen, J., and Durant, S. M. (2003). Mating strategies of topi bulls: getting in the center of attention. Anim. Behav. 65, 585–594. doi: 10.1006/anbe.2003.2077
Ciuti, S., and Apollonio, M. (2011). Do antlers honestly advertise the phenotypic quality of fallow buck (Dama dama) in a lekking population? Ethology 117, 133–144. doi: 10.1111/j.1439-0310.2010.01862.x
Clutton-Brock, T. H., Deutsch, J. C., and Nefdt, R. J. C. (1993). The evolution of ungulate leks. Anim. Behav. 46, 1121–1138. doi: 10.1006/anbe.1993.1302
Clutton-Brock, T. H., Green, D., Hiraiwa-Hasegawa, M., and Albon, S. D. (1988). Passing the buck: resource defense, lek breeding and mate choice in fallow deer. Behav. Ecol. Sociobiol. 23, 281–296. doi: 10.1007/BF00300575
Davies, N. B. (1976). Food, flocking and territorial behaviour of the pied wagtail Motacilla alba yarrellii gould in winter. J. Anim. Ecol. 45, 235–253. doi: 10.2307/3777
Deutsch, J. C. (1994). Lekking by default: female habitat preferences and male strategies in Uganda kob. J. Anim. Ecol. 63, 101–115. doi: 10.2307/5587
Duraes, R., Loiselle, B. A., and Blake, J. G. (2007). Intersexual spatial relationships in a lekking species: blue-crowned manakins and female hot spots. Behav. Ecol. 18, 1029–1039. doi: 10.1093/beheco/arm072
DuVal, E. H., Vanderbilt, C. C., and M'Gonigle, L. K. (2018). The spatial dynamics of female choice in an exploded lek generate benefits of aggregation for experienced males. Anim. Behav. 143, 215–225. doi: 10.1016/j.anbehav.2018.01.009
Fischer, F., and Linsenmair, K. E. (1999). The territorial system of the kob antelope (Kobus kob kob) in the comoé national park, côte d'ivoire. Afr. J. Ecol. 37, 386–399. doi: 10.1046/j.1365-2028.1999.00194.x
Fryxell, J. M. (1987). Lek breeding and territorial aggression in white-eared kob. Ethology 75, 211–220. doi: 10.1111/j.1439-0310.1987.tb00654.x
Gibson, R. M., Aspbury, A. S., and McDaniel, L. L. (2002). Active formation of mixed-species grouse leks: a role for predation in lek evolution? Proc. R. Soc. Lond. B 269, 2503–2507. doi: 10.1098/rspb.2002.2187
Gibson, R. M., Taylor, C. E., and Jefferson, D. R. (1990). Lek formation by female choice: a simulation study. Behav. Ecol. 1, 36–42. doi: 10.1093/beheco/1.1.36
Gosling, L. M., and Petrie, M. (1990). Lekking in topi: a consequence of satellite behaviour by small males at hotspots. Anim. Behav. 40, 272–287. doi: 10.1016/S0003-3472(05)80922-4
Hovi, M., Alatalo, R. V., Hoglund, J., Lundberg, A., and Rintamaki, P. T. (1994). Lek center attracts black grouse females. Proc. R. Soc. Lond. B 258, 303–305. doi: 10.1098/rspb.1994.0177
Iossa, G., Soulsbury, C. D., Baker, P. J., and Harris, S. (2008). Body mass, territory size, and life-history tactics in a socially monogamous canid, the red fox Vulpes vulpes. J. Mamm. 89, 1481–1490. doi: 10.1644/07-MAMM-A-405.1
Isvaran, K. (2003). The evolution of lekking: insights from a species with a flexible mating system (Doctoral dissertation). University of Florida, Gainesville, FL.
Isvaran, K. (2005). Female grouping best predicts lekking in blackbuck (Antilope cervicapra). Behav. Ecol. Sociobiol. 57, 283–294. doi: 10.1007/s00265-004-0844-z
Isvaran, K. (2007). Intraspecific variation in group size in the blackbuck antelope: the roles of habitat structure and forage at different spatial scales. Oecologia 154, 435–444. doi: 10.1007/s00442-007-0840-x
Isvaran, K., and Jhala, Y. (2000). Variation in lekking costs in blackbuck (Antilope cervicapra): relationship to lek-territory location and female mating patterns. Behaviour 137, 547–563. doi: 10.1163/156853900502204
Isvaran, K., and Ponkshe, A. (2013). How general is a female mating preference for clustered males in lekking species? A meta-analysis. Anim. Behav. 86, 417–425. doi: 10.1016/j.anbehav.2013.05.036
Jhala, Y. V., and Isvaran, K. (2016). “Behavioural ecology of a grassland antelope, the blackbuck Antilope cervicapra: linking habitat, ecology and behaviour,” in The Ecology of Large Herbivores in South and Southeast Asia (Dordrecht: Springer), 151–176.
Jiguet, F., Arroyo, B., and Bretagnolle, V. (2000). Lek mating systems: a case study in the little bustard Tetrax tetrax. Behav. Process. 51, 63–82. doi: 10.1016/S0376-6357(00)00119-4
Jiguet, F., and Bretagnolle, V. (2006). Manipulating lek size and composition using decoys: an experimental investigation of lek evolution models. Am. Nat. 168, 758–768. doi: 10.1086/508808
Jones, T. M., and Quinnell, R. J. (2002). Testing predictions for the evolution of lekking in the sandfly, Lutzomyia longipalpis. Anim. Behav. 63, 605–612. doi: 10.1006/anbe.2001.1946
Kokko, H., Lindström, J., Alatalo, R. V., and Rintamäki, P. T. (1998). Queuing for territory positions in the lekking black grouse (Tetrao tetrix). Behav. Ecol. 9, 376–383. doi: 10.1093/beheco/9.4.376
Kruijt, J. P., and Hogan, J. A. (1967). Social behavior on the lek in black grouse, Lyrurus tetrix tetrix (L.). Ardea 55, 204–240. doi: 10.5253/arde.v55.p203
Lebigre, C., Alatalo, R. V., Soulsbury, C. D., Höglund, J., and Siitari, H. (2014). Limited indirect fitness benefits of male group membership in a lekking species. Mol. Ecol. 23, 5356–5365. doi: 10.1111/mec.12941
Leuthold, W. (1966). Variations in territorial behavior of Uganda kob Adenota kob thomasi (Neumann 1896). Behaviour 27, 215–258. doi: 10.1163/156853966X00164
Maher, C. R., and Lott, D. F. (2000). A review of ecological determinants of territoriality within vertebrate species. Am. Mid. Nat. 143, 1–29. doi: 10.1674/0003-0031(2000)143[0001:AROEDO]2.0.CO;2
Mungall, E. C. (1978). The Indian Blackbuck Antelope: A Texas View. Kleberg Studies in Natural Resources. College Station, TX: Caesar Kleberg Research Program in Wildlife Ecology.
Nefdt, R. J. C., and Thirgood, S. J. (1997). Lekking, resource defense, and harassment in two subspecies of lechwe antelope. Behav. Ecol. 8, 1–9. doi: 10.1093/beheco/8.1.1
Partecke, J., von Haeseler, A., and Wikelski, M. (2002). Territory establishment in lekking marine iguanas, Amblyrhynchus cristatus: support for the hotshot mechanism. Behav. Ecol. Sociobiol. 51, 579–587. doi: 10.1007/s00265-002-0469-z
Pinheiro, J., and Bates, D. (2000). Mixed-Effects Models in S and S-PLUS. New York, NY: Springer Science & Business Media.
Pinheiro, J., Bates, D., DebRoy, S., Sarkar, D., and R Core Team. (2019). nlme: Linear and Nonlinear Mixed Effects Models. R Package Version 3.1-143. Available online at: https://CRAN.R-project.org/package=nlme
Prasad, N. L. N. S. (1989). Territoriality in the Indian blackbuck, Antilope cervicapra (Linnaeus). J. Bombay Nat. Hist. Soc. 86, 187–193.
R Core Team (2019). R: A Language and Environment for Statistical Computing. R Foundation for Statistical Computing, Vienna. Available online at: https://www.R-project.org/
Rintamäki, P. T., Alatalo, R. V., Höglund, J., and Lundberg, A. (1995). Male territoriality and female choice on black grouse leks. Anim. Behav. 49, 759–767. doi: 10.1016/0003-3472(95)90050-0
Sorato, E., Gullett, P. R., Creasey, M. J., Griffith, S. C., and Russell, A. F. (2015). Plastic territoriality in group-living chestnut-crowned babblers: roles of resource value, holding potential and predation risk. Anim. Behav. 101, 155–168. doi: 10.1016/j.anbehav.2014.12.012
Stillman, R., Clutton-Brock, T. H., and Sutherland, W. J. (1993). Black holes, mate retention and the evolution of ungulate leks. Behav. Ecol. 4, 1–6. doi: 10.1093/beheco/4.1.1
Thirgood, S., Langbein, J., and Putman, R. J. (1999). Intraspecific variation in ungulate mating strategies: the case of the flexible fallow deer. Adv. Stud. Behav. 28, 333–361. doi: 10.1016/S0065-3454(08)60220-X
Thirgood, S. J., Robertson, A., Jarvis, A. M., Belbin, S. V., Robertson, D., and Nefdt, R. J. (1992). Mating system and ecology of black lechwe (Kobus: Bovidae) in Zambia. J. Zool. 228, 155–172. doi: 10.1111/j.1469-7998.1992.tb04439.x
Trail, P. W., and Adams, E. S. (1989). Active mate choice at cock-of-the-rock leks: tactics of sampling and comparison. Behav. Ecol. Sociobiol. 25, 283–292. doi: 10.1007/BF00300055
Vitousek, M. N., Rubenstein, D. R., Nelson, K. N., and Wikelski, M. (2008). Are hotshots always hot? A longitudinal study of hormones, behavior, and reproductive success in male marine iguanas. Gen. Comp. Endocrinol. 157, 227–232. doi: 10.1016/j.ygcen.2008.04.015
Westcott, D. A. (1997). Lek locations and patterns of female movement and distribution in a neotropical frugivorous bird. Anim. Behav. 53, 235–247. doi: 10.1006/anbe.1996.0294
Widemo, F., and Owens, I. P. F. (1995). Lek size, male mating skew and the evolution of lekking. Nature 373, 148–151. doi: 10.1038/373148a0
Wiley, R. H. (1974). Evolution of social organization and life-history patterns among grouse. Q Rev. Biol. 49, 201–227. doi: 10.1086/408083
Wiley, R. H. (1991). Lekking in birds and mammals: behavioral and evolutionary issues. Adv. Study Behav. 20, 201–291. doi: 10.1016/S0065-3454(08)60322-8
Keywords: lek evolution, ungulates, Antilope cervicapra, territory size, female mating behavior, density
Citation: Isvaran K (2021) Lek Territory Size and the Evolution of Leks: A Model and a Test Using an Ungulate With a Flexible Mating System. Front. Ecol. Evol. 8:539061. doi: 10.3389/fevo.2020.539061
Received: 28 February 2020; Accepted: 17 November 2020;
Published: 03 February 2021.
Edited by:
Vernon Bleich, University of Nevada, Reno, United StatesReviewed by:
Carl Soulsbury, University of Lincoln, United KingdomCopyright © 2021 Isvaran. This is an open-access article distributed under the terms of the Creative Commons Attribution License (CC BY). The use, distribution or reproduction in other forums is permitted, provided the original author(s) and the copyright owner(s) are credited and that the original publication in this journal is cited, in accordance with accepted academic practice. No use, distribution or reproduction is permitted which does not comply with these terms.
*Correspondence: Kavita Isvaran, a2F2aXRhQGlpc2MuYWMuaW4=
Disclaimer: All claims expressed in this article are solely those of the authors and do not necessarily represent those of their affiliated organizations, or those of the publisher, the editors and the reviewers. Any product that may be evaluated in this article or claim that may be made by its manufacturer is not guaranteed or endorsed by the publisher.
Research integrity at Frontiers
Learn more about the work of our research integrity team to safeguard the quality of each article we publish.