 Hang Wang
 Hui Li
 Junping Xu
 Kun Tian
- 1National Plateau Wetlands Research Center, Southwest Forestry University, Kunming, China
- 2Key Laboratory of Urban Environment and Health, Institute of Urban Environment, Chinese Academy of Sciences, Xiamen, China
Empirical records of plant responses to climate warming increasingly rely on warming experiments which supposedly provide meaningful predictions of future scenarios. However, the accuracy of such predictions may be compromised by warming artifacts. In our study, we integrated two approaches, the use of in situ open-top chambers (OTCs), as well as transplants along a latitudinal gradient, to study the biological responses of three wetland species to experimental warming over 4–5 years. Under ongoing warming, plant photosynthesis was negatively influenced by the OTCs, coupled with reduced species height and biomass accumulation, while unexpectedly, these trends were not reflected in the transplant experiments. Temperature patterns artificially altered with the use of OTCs included asymmetrical day/night warming and hot extreme events. To understand whether the significant mismatches in results between these two approaches could be attributed to these temperature alterations, we alleviated temperature artifacts by using two identical chamber types differing only in their opening sizes and making comparisons between these chambers. The negative impact of warming associated with the use of OTCs on wetland species was reversed when these temperature artifacts were canceled out, and consistent plant responses to warming were observed for both approaches. We highlight here, beyond the commonly investigated reductions in soil moisture, that unintended temperature artifacts associated with the use of warming devices are major determinants of the negative responses to warming for wetland plant species.
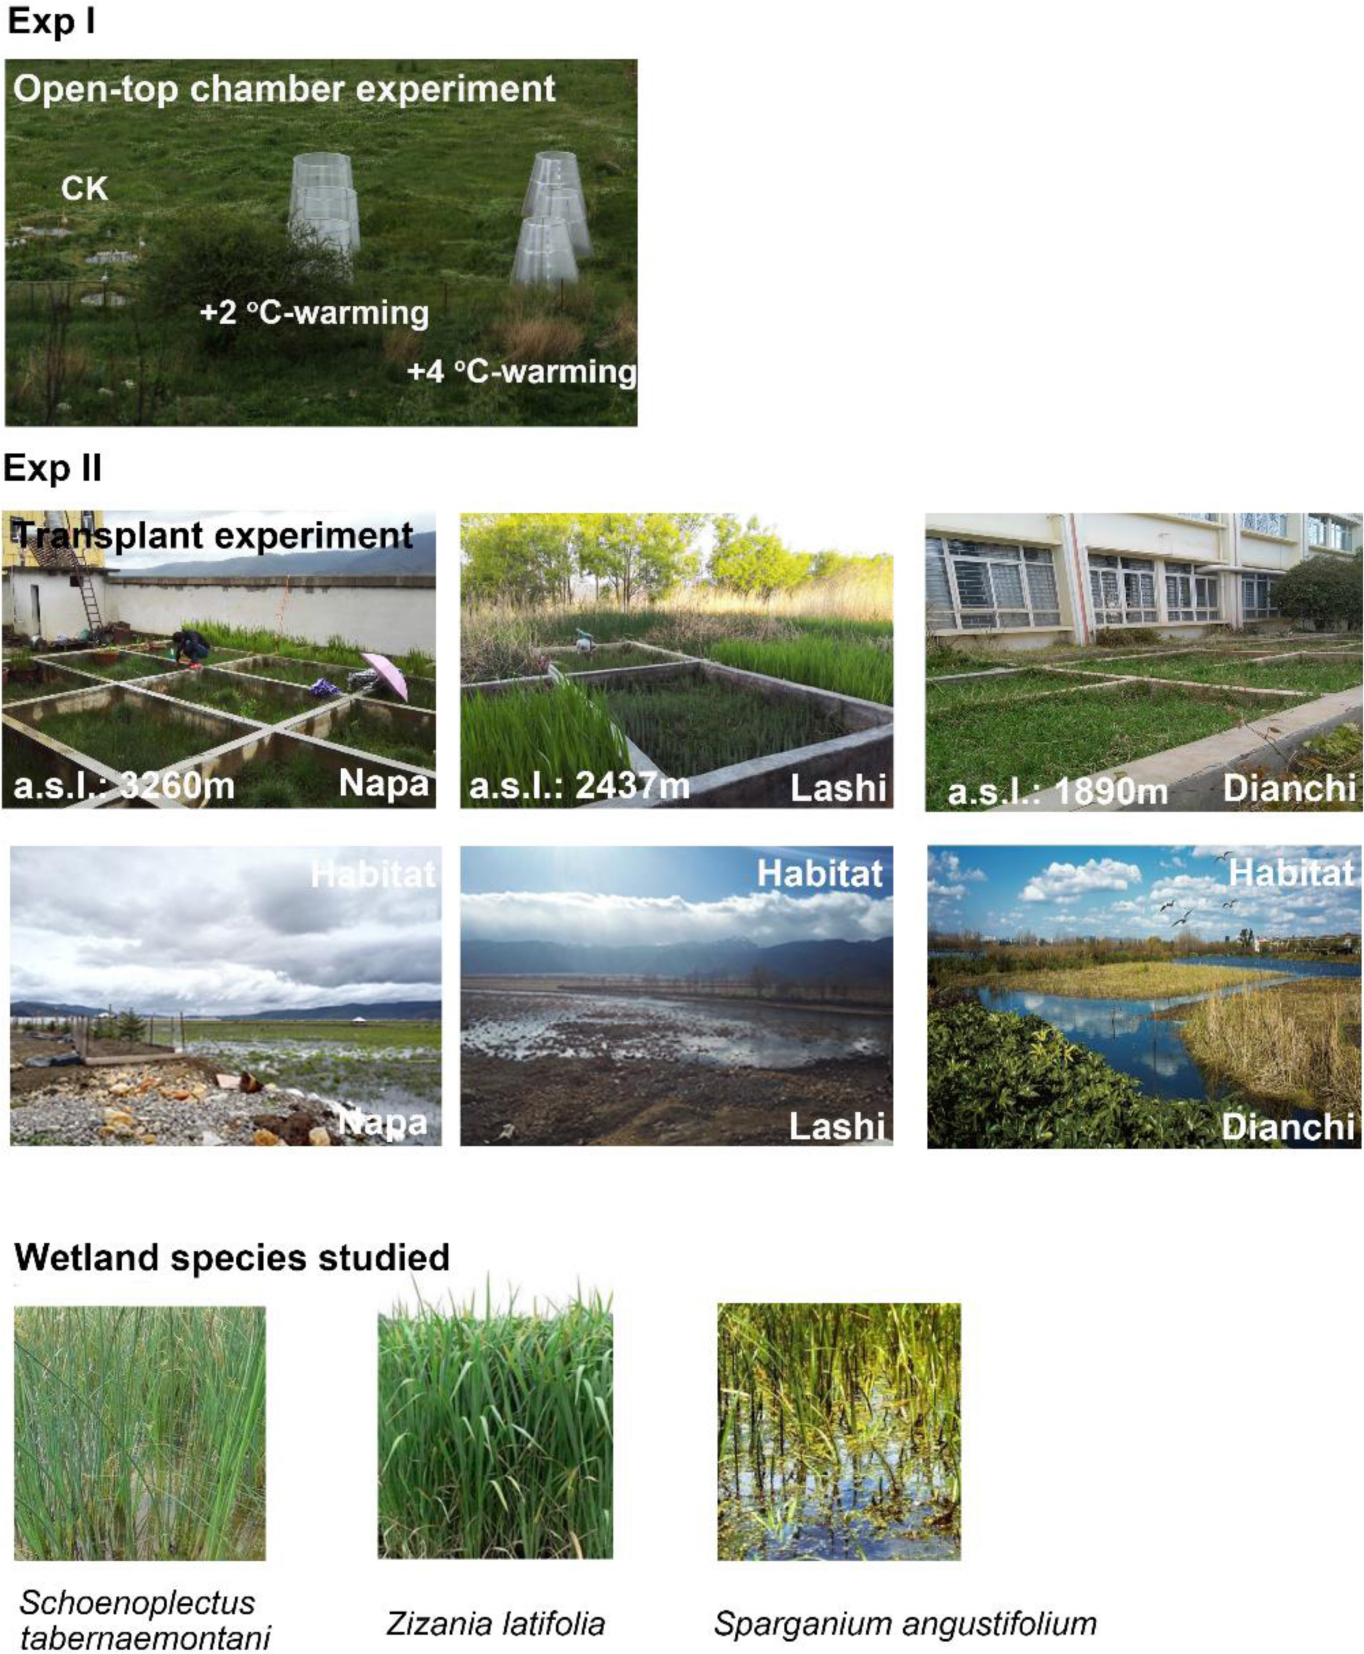
Graphical Abstract. Photographs of the two warming approaches [open-top chamber experiment (EW-I) and transplant experiment (EW-II)] used in this work to study the biological responses of three wetland species (Schoenoplectus tabernaemontani, Zizania latifolia, and Sparganium angustifolium) to experimental warming.
Introduction
Global warming is worsening as a consequence of the increased atmospheric concentrations of greenhouse gases since the industrial revolution (Collins et al., 2013). Understanding the responses of plant species to predicted global temperature rise is among the most urgent scientific challenges for ecologists (Colesie et al., 2018). Plant survival and carbon budgets can be greatly affected by warming, through temperature effects on photosynthesis and biomass accumulation (King et al., 2006; Martin and Huey, 2008; Bokhorst et al., 2011b; Kingsolver et al., 2013). However, field experiments with simulated temperature rises often show divergent responses in plant photosynthesis and the resultant reduced or increased biomass production in an ecological context (León-Sánchez et al., 2016; Wertin et al., 2017; Sáez et al., 2018). On the one hand, research has highlighted intrinsically biological thermal traits, adaptation capacities, and phenotypic plasticity as determinants for species-specific responses to warming (Cui et al., 2018; Sáez et al., 2018). On the other hand, researchers also fully recognize that natural habitats in the field often interact in a confounding way with the warming itself. For instance, productivity in wetter habitats is likely to be enhanced together with increases in temperature, while in contrast, more arid ecosystems are likely to experience declines in productivity (Reeves et al., 2014; Liu et al., 2018), resulting in habitat-specific responses to warming.
However, divergent responses can also be attributed to undetected artifacts introduced by warming devices, an area which is less explored and often overlooked. Unlike the characteristics of naturally occurring habitats, these artifacts may not be a true reflection of either warming scenarios or local ecological context. For instance, a global study compared field warming experiments with observations over natural geographic space, and found that warming experiments underestimate advances in the timing of flowering by 8.5-fold (Wolkovich et al., 2012). After accounting for physiological characteristics of the species involved as well as the complex local habitats, this mismatch has been attributed, speculatively, to potential artifacts introduced by manipulated experiments. Directly examining the effects of artifacts is difficult, if not impossible, because artifacts themselves cannot be easily disentangled from the main factors. To date, few studies directly test and explore warming-induced artifacts in a field context, and scientists therefore are still uncertain about how these artifacts will distort their observations, or indeed whether or not the observed effects on plant species can be attributed to the real responses of the plants to the simulated temperature increases.
Much climate research has focused on cold and high-altitude regions, where warming is even more rapid than in low-altitude regions (Klein et al., 2005; Bokhorst et al., 2011b; Mulder et al., 2017). Simulation of climate warming scenarios in cold and high-altitude regions has been always dominated by the use of passive warming devices (Stef et al., 2012), such as open-top chambers (OTCs). OTCs certainly give an increment of annual mean temperature (say, 2–4°C), but a major concern is that they induce temperature extremes and alter general temperature dynamic patterns (Marion et al., 1997; Bokhorst et al., 2011b). They have also been shown to influence other microclimatic variables, such as soil moisture and intensity of irradiance (Stef et al., 2012). Indeed, there is a long-standing debate over whether or not the biological responses observed in passive warming experiments are attributable to the mean warming, or rather to changes in temperature extremes (Bokhorst et al., 2011a). However, intriguingly, this argument has never been formally tested through experimental approaches in the field and it is therefore still uncertain whether artifacts such as temperature extremes have only minor effects, whether they affect the magnitude of plant responses to warming, or whether they can affect both their direction and magnitude. We consider this issue critical to the accurate assessment of biological responses to warming scenarios.
Understanding the response of species to warming therefore calls for the integration of different warming approaches within a single study, and for the experiments to avoid artifacts by using more sophisticated designs (Godfree et al., 2011). With these facts in mind, we designed an experiment to examine the effects of warming on three dominant wetland species in Yunnan Plateau (altitude > 3000 m, located on the southeastern rim of the Qin-Tibetan Plateau in China), and their responses to warming by integrating two different approaches: the use of in situ OTCs, and transplants along a latitudinal gradient (Figure 1). We performed our warming experiments in situ to test whether these species would utilize the higher temperatures effectively, by measuring photosynthesis, growth, and productivity traits for each species. To disentangle artifacts from desired increases in temperature, we incubated species in ambient conditions (without OTC chambers) and in two types of OTC chambers varying in their opening sizes, in which +2°C and +4°C-warming scenarios were simulated. In a separate experiment, we transplanted plants of these species, together with their soils, from cold to warmer climates along a latitudinal gradient, as an alternative analogy of warming. Because our wetland species always grow in submerged soils, warming-induced soil drying as a major cause of negative responses to experimental warming has been avoided. Two aspects have been examined:
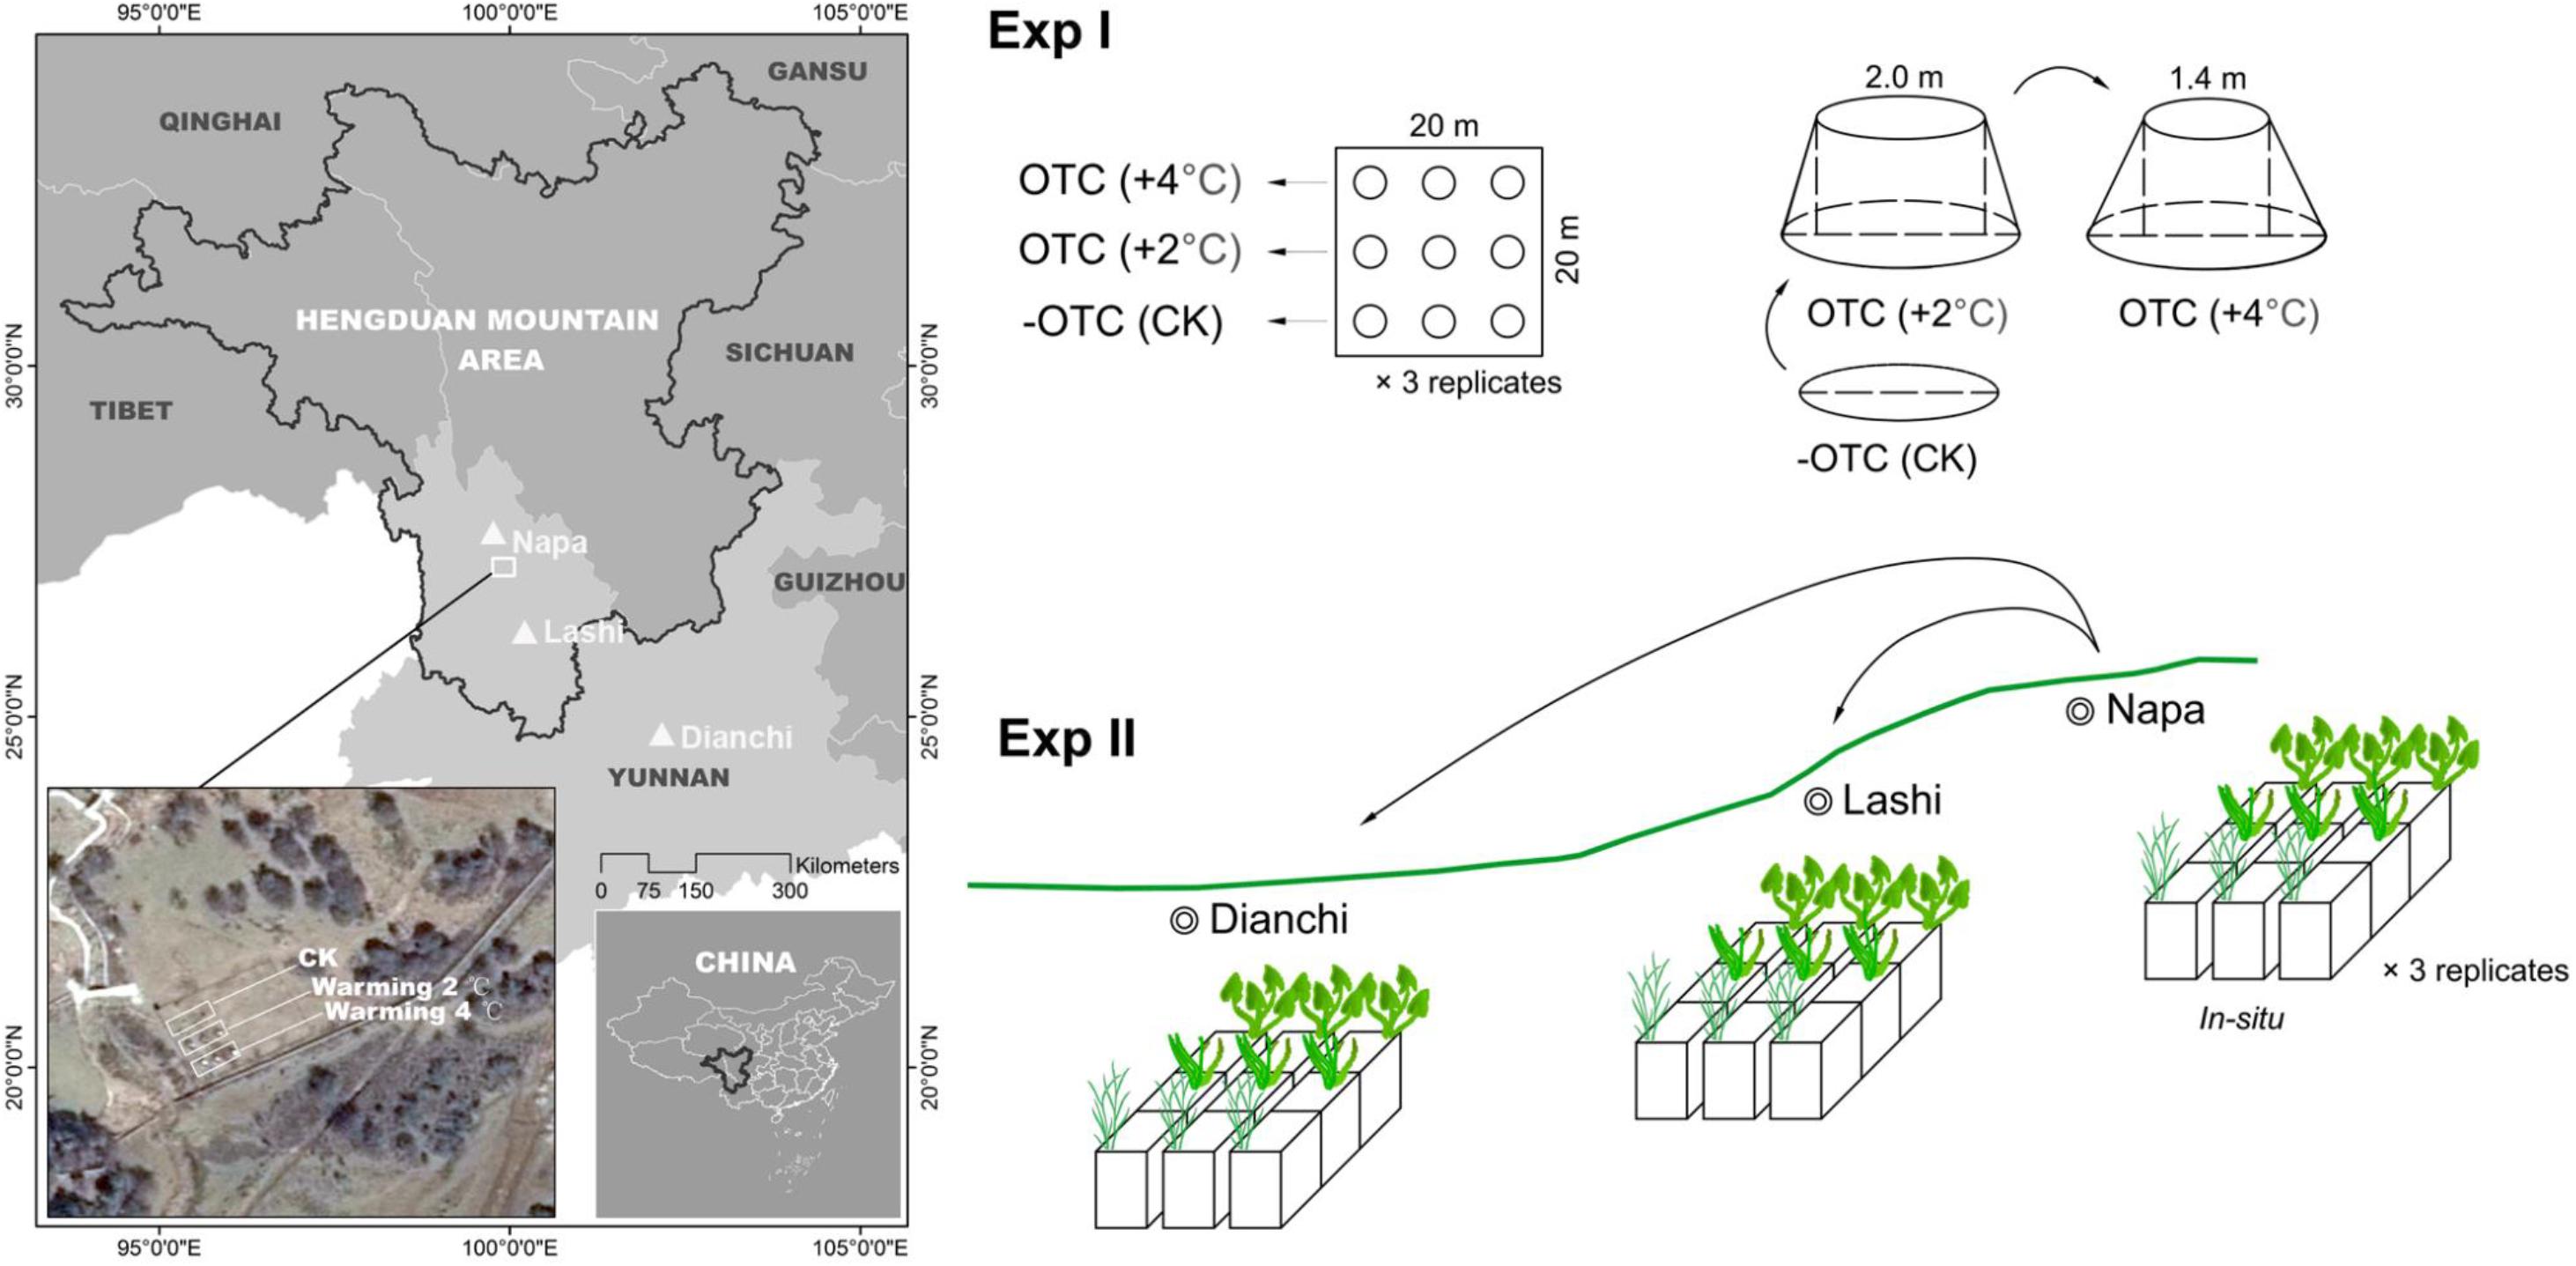
Figure 1. Warming experiments used in this study. Experiment I (Exp I): field warming manipulations using open-top chambers (OTCs). Two types of OTCs were used, differing in the sizes of the open window at the top (2.0 m and 1.4 m diameter) to achieve two warming targets of +2°C and +4°C, respectively. The ambient conditions were simulated in the open air without using OTC (CK, as the control). The chambers were set up in a fenced plot (20 m × 20 m) in Shangri-La Research Station, Northwest Yunnan Plateau. Experiment II (Exp II): field transplant experiment using a natural latitudinal gradient. Plants and their soil were transplanted together from the origin (Napa, 3260 m in elevation) to two lower sites (Lashi, 2400 m and Dianchi, 1980 m).
(1) We developed a group of indices to evaluate temperature means and their variability. Based on these indices, we made a detailed comparison of dynamic temperature patterns in the OTCs and the transplant experiments. Comparisons between the ambient conditions (without OTCs) and a +2°C-warming scenario using the OTCs aim to find out what temperature artifacts have been introduced by OTCs, and the comparisons between the +2°C and +4°C-warming scenarios, both using the OTCs, aim to determine whether temperature artifacts have been accounted for with the use of two types of OTCs.
(2) We demonstrated empirically whether or not OTC-induced temperature artifacts are major factors causing negative responses of wetland plants to experimental warming, with the evidence derived from our combined OTC-warming experiments and transplant experiments along a latitudinal gradient.
Materials and Methods
Study Species
Three wetland plants, S. tabernaemontani, Z. latifolia, and S. angustifolium, typically found growing in the littoral area (aquatic-terrestrial ecotone) of plateau lakes, were selected as test species. These species are perennial herbs, commonly with clonal propagation, and have the same life form (hygrophyte), growth form (emergent species), and photosynthetic pathway (C3 plants). Their aboveground shoots only survive one growing season and recruit from belowground buds the following spring. S. tabernaemontani and Z. latifolia have a globally wide distribution, with an elevation < 3300 m in Yunnan province. The third species, S. angustifolium, has a narrow distribution. Across China, it has been reported to grow in high mountains over 1500 m in altitude, and in Yunnan province it has been recorded at higher altitudes (2400–3400 m).
Open-Top Chamber Experiments
The first experiment (Exp I) was performed using OTCs, and ran from 2014 to 2017. The study field was set up near a small lowland stream in Shangri-La Research Station (N27°47′27.39″, E99°50′23.76″, Figure 1), which has an average altitude of 3200 m and mean annual temperature of 5.40°C. Shangri-La Research Station is located on Yunnan Plateau (23–27°N, 100–110°E) about 12 km from Shangri-La city. In 2014, we fenced a 20 m × 20 m area to deter outside disturbance and made nine circular plots (each 2.4 m in diameter and 80 cm deep) within it. These plots were laid out at intervals of 3 m and connected by embedded PVC pipes. Flooding water for all plots was obtained from the neighboring small lowland stream and piped through PVC pipes, and was evenly distributed into these plots. The water in the plots was constantly maintained at a depth of 70–80 cm.
Three treatments were set up, including an ambient scenario (CK) and two warming scenarios. Each treatment comprised three circular plots, representing three replicates. Warming scenarios were simulated using large-size OTCs placed upon the plots. These OTCs were all 2.4 m both in diameter at the bottom and in height, but they differed in the sizes of the open window at the top: the OTCs with a top diameter of 2.0 m had a target of 2.0°C warmer than CK (we hereafter refer to this warming scenario as +2°C-warming) and the OTCs with a top diameter of 1.4 m had a target of 4.0°C warmer than CK (+4°C-warming). The smaller the open window at the top, the higher is the temperature achieved within the OTCs. The chambers were made of polycarbonate with a light transmittance of over 90%. For CK, there were no OTCs covering the plots. TP-2200 temperature loggers (Anfu Electronic Technology Company, Beijing, China), suspended 1.0 m above the natural ground level within the plots, one logger per treatment, were used to record air temperature and relative humidity on an hourly basis for all treatments.
At the start of the growing season in May 2014, we dug up clonal tillers (stems for vegetative propagation) for each species from a neighboring riverine wetland, 150 m from the study field. We carefully separated them one by one, and in order to obtain individuals, we used a knife to gently remove any belowground buds from each tiller. After measuring the original height and basal diameter of each tiller, we transplanted it into a plastic pot (35 cm in diameter and 50 cm in height), along with soil taken from where they were collected. According to the WRB soil classification system, the soil can be classified as a gleysol (semi-hydromorphic soil with a high clay content). Its parent material is water-sorted alluvial sediments. Three pots for each of three species were placed in each plot, and in total we cultivated 27 pots for each species (3 pots × 3 plots × 3 treatments). Several (2–3) extra pots per treatment were also prepared just as backups. After the pots were placed into the plots, the flooding depth for these tillers (from the natural water table to soil level in each pot) was constantly maintained at approx. 20 cm. We cultivated only one tiller within each pot at the very beginning of experiments, in order to avoid root restrictions within pots during our 4-year observations. To check this, we collected roots at the end of incubation in 2017, and checked that the plants had not become root-bound.
Field Transplants
The second experiment (Exp II) ran from 2012 to 2016 and was performed using natural latitudinal gradients. The Yunnan plateau is characterized by a low-relief upland landscape (relict landscape), with elevations ranging from 5000 m in the northwest to <1000 m in the southeast. This 3-D climatic topography provides good opportunities for conducing field transplant experiments along the natural latitudinal gradients. We selected three sites on the Yunnan Plateau. The first site (N27°49′28.90″, E99°39′40.99″) is located within the boundary of Napa, with an elevation of 3260 m and a mean annual temperature of 6.15°C (hereafter this site is referred to as Napa). The second site (Lashi, N26°51′51.53″, E100°07′56.11″) is located within the boundary of Lashi, with an elevation of 2437 m and a mean annual temperature of 12.5°C. The third site (Dianchi, N25°03′57.52″, E102°45′39.94″) is located in the Dianchi lake basin, with an elevation of 1890 m and a mean annual temperature of 15.8°C. Napa is near the Shangri-La Research Station (also see Figure 1) and both Napa and Lashi wetlands have been designated wetlands of international importance under the Ramsar convention.
In 2011, at each of the three sites, we built a cement pool, 3.0 m long, 6.0 m wide, and 1.0 m deep. Each pool was segmented into nine sub-pools (1.0 m long, 1.5 m wide, and 1.0 m deep). These pools were under protection by local wetland administration bureaus to avoid potential disturbance and deliberate destruction, and the pools have been designed to have the same orientation toward the sunlight and similar wind speeds and exposures. Plants of the three study species (S. tabernaemontani, Z. latifolia, and S. angustifolium) were collected from original habitats in Napa wetland, where the soil is also classified as a Gleysol. For each species, we cut nine intact cubic soil blocks (1.0 m long × 1.5 m wide × 0.5 m deep) together with the target species with natural population density. These blocks were transplanted into the sub-pools built in each of three sites (Napa, Lashi, and Dianchi). A total of 27 soil blocks (3 sub-pools × 3 species × 3 sites) were transplanted for all three species. One year after transplantation, the soil placed in pools had sunk to a depth of 0.70–0.85 m. Each pool was filled with the water, and the depth of water was constantly maintained at ∼25 cm (from the water surface to soil level) by pumping the water into the pools whenever this was necessary, especially in dry periods. Local maintainers were responsible for monitoring the water level and pumping the water into the pools. Irregular weeding was also performed during our experiment to avoid the possibility that other alien species moved into the pools or grew from the soil seed banks. Because of this, our study can explicitly test for climate effects without the interference of potential indirect effects of competition. At each site, we installed a small weather station (RainWise PortLog, United States) to record air temperature and relative humidity on an hourly basis. Because plant-soil ecosystems are greatly disturbed by transplantation, we only began our measurements in 2012, the year following the transplants.
Determination of Temperature Records
In this study, using hourly temperature records (i.e., one temperature record per hour), we developed a group of indices to evaluate temperature means and their variability. Mean air temperature (Tmean) over a year was assessed using annual mean temperature, monthly mean temperature, and hourly mean temperature:
Taking annual mean temperature as an example, we first calculated daily mean temperature (using a total of twelve hourly temperature records per day) over the year, and subsequently summed the 365 daily mean temperature records for the whole year. The result was then divided by 365 to give the annual mean temperature.
Temperature variability can be initially evaluated by using monthly maximum temperature (Tmax), monthly minimum temperature (Tmin), and the total range between these two (Trange). We developed three indices to account for this:
To examine whether there were asymmetrical daytime and nighttime warming patterns, monthly daytime (Tday) and monthly nighttime temperature (Tnight) were determined:
Temperature variability can also be reflected in daily temperature fluctuations and extreme temperature records. We therefore investigated these two aspects, and we used the hourly temperature data to calculate diurnal temperature range (DTR) over the year:
We grouped these DTRs into different temperature sections (DTR1 to DTR11) which differed from each other by 5.0°C, and the number of days in which the DTR values fell into each of these 11 groups was calculated. Patterns of DTR illustrated the daily temperature fluctuations (Peng et al., 2013). We then calculated the number of hot extreme hourly temperature records on a monthly basis. A hot extreme hourly temperature (Thot) is defined as an hourly temperature record in a warmed treatment within a month that is higher than monthly maximum temperature in the control treatment. The threshold value for a hot extreme hourly temperature was calculated as follows:
Measurements of Plant Physiological Traits
During the period of 2014–2016, at the end of growing season (late September) each year, we measured gas exchange parameters using a portable photosynthesis system (Li-6400XT, Li-cor, Inc., Lincoln, NE, United States) on attached leaves from potted plants in the OTC warming experiment. Measurements were made on mature, healthy, and fully sun-exposed leaves on clear days. A red-blue LED light source attached to the system was used to produce steady photosynthetic photo flux density. For the determination of instantaneous photosynthetic traits, leaves were first illuminated under a photosynthetic photo flux density of 1200 μmol m–2 s–1 until a steady state of net CO2 fixation was reached. Thereafter, photo flux density was kept at 1000 μmol m–2 s–1, and the net photosynthetic rate (μmol CO2 m–2 s–1), stomatal conductance (mol H2O m–2 s–1), intercellular CO2 concentration (μmol CO2 mol–1), as well as the transpiration rate (μmol H2O m–2) were measured following our previously published work (Xu et al., 2018). The open gas path system of the Li-6400XT has a 6 cm2 clamp-on leaf cuvette. During the measurements, the cuvette temperature was maintained at 25°C for both control and OTC-treated samples, the air flow in the cuvette was 0.5 L/min, the humidity was kept at 70–75%, and CO2 concentration was maintained at 400 μmol mol–1. For each treatment (CK and warming), measurements were made on six randomly selected leaves (two per plot), resulting in six replicates (n = 6).
We also measured the response curve of the net photosynthetic rate to photosynthetic active radiation (A-Pn curve) by setting photo flux density to a range from 0 to 2200 μmol m–2 s–1. The response curve of the net photosynthetic rate to intercellular CO2 concentration (A-Ci curve) was measured by setting CO2 concentrations in a range from 50 to 2000 μmol mol–1. The microenvironments in the cuvettes were kept the same as described above. Three leaves were randomly selected per treatment for this measurement (i.e., one per plot, n = 3). Estimates of the maximum net photosynthetic rate (μmol m–2 s–1), light saturation point (μmol m–2 s–1), light compensation point (μmol m–2 s–1), and apparent quantum yield (AQY, %) were made from the A-Pn curves. Light utilization range (μmol m–2 s–1) was calculated as light saturation point minus light compensation point. Estimates of maximum RuBP-saturated carboxylation capacity (Vcmax, μmol m–2 s–1), maximum capacity for electron transport contribution to RuBP regeneration (Jmax, μmol m–2 s–1), and triose-phosphate utilization rate (μmol m–2 s–1) were made from the A-Ci curves. These estimates followed Farquhar (Farquhar et al., 1980) with details provided in our previous study (Xu et al., 2018).
Measurement of Plant Growth and Productivity Traits
At the end of each growing season (October 25th to 30th) from 2014 to 2017, we also measured two plant growth variables (species height and basal diameter) and one productivity variable (above-ground biomass) for the three species. At the early growth stage (May 5th to 20th), a total of 3–10 shoots per pot were randomly tagged. Shoots that were standing dead, immature, or obviously in poor health were excluded. The tagged shoots were selected for the measurement of species height and basal diameter at the end of growing season (n = 9, three per plot per treatment). All shoots from each pot were then cut from the soil surface with scissors and were shipped to the laboratory for the measurements of above-ground biomass (n = 9, three per plot per treatment). Since below-ground biomass can only be assessed through destructive sampling, we took this measurement in 2017 at the end of incubation, by selecting three pots per treatment as three replicates (n = 3). During the same year, leaf elements (total carbon and total nitrogen) were analyzed using a Flash 2000 NC Analyzer (Thermo Scientific, MA, United States).
For Exp-II under natural latitudinal gradients, photosynthetic and growth traits, as well as plant biomass were also determined for three species using the methods described above with some differences. For instantaneous photosynthetic traits, we randomly selected two mature and fully sun-exposed leaves per sub-pool per site for measurements (n = 6, 2 × 3 sub-pools) for each of the four study years (2012, 2013, 2014, and 2016 inclusive). For the response curves, measurements were conducted only in 2012 and 2016, and one leaf per sub-pool per site was selected (n = 3). We also measured growth traits and above-ground biomass in all 4 years. The measurements of biomass were performed within a 0.5 m2 quadrat, two of which were placed in the center of sub-pools (instead of using pots as in the OTC experiments). Below-ground biomass was measured in 2016 at the end of incubation. Six replicates per site were used for the determination of species height, basal diameter, and above-ground biomass (2 quadrats × 3 sub-pools), and three replicates per site were used to calculate the below-ground biomass (1 quadrat × 3 sub-pools).
Statistical Analyses
Only one temperature logger per treatment or per site was installed in our experimental setup (n = 1), and therefore no statistical tests were performed on the temperature data. Despite this, the temperature loggers used in this study were frequently checked using the portable photosynthesis system to ensure their accuracy in data recording.
Our study investigated three species, and statistical analyses were performed separately for each species. To assess species traits, we used repeated-measures analysis of variance (repeated-measures ANOVA) to evaluate the effects of experimental warming on leaf photosynthetic traits (net photosynthetic rate, stomatal conductance, intercellular CO2 concentration, transpiration rate, maximum net photosynthetic rate, light saturation point, light compensation point, light utilization range, apparent quantum yield, Vcmax, Jmax, Vcmax/Jmax, and triose-phosphate utilization rate), as well as growth and productivity traits (species height, basal diameter, above-ground biomass, below-ground biomass, and the ratio of below- to above-ground biomass). Temperature treatment (warming vs. control) and site (Dianchi, Lashi, and Napa) were used as between-subject factors, and the observation year was used as a within-subject factor in this analysis. Student’s t-tests were then used to evaluate the effects of warming on these variables in each specific year. Most variables were normally distributed as judged by Shapiro–Wilk test and P–P (probability) plot. Therefore, parametric tests (ANOVA and Student’s t-tests) were performed in this study. For Exp I, comparisons were performed between ambient conditions (CK) and +2°C-warming as well as between +2°C and +4°C-warming using OTCs. For Exp II, comparisons were performed between Napa and Lashi as well as between Lashi and Dianchi along a latitudinal gradient. The relationships linking net photosynthetic rate to stomatal conductance, Vcmax, and Jmax were examined using linear regression analyses to investigate whether OTC warming-induced changes in net photosynthetic rate were mainly controlled by diffusive limitations or reduced enzymatic potentials of Rubisco. Furthermore, given the key roles of leaf nutritional factors in influencing photosynthetic traits, changes in leaf nitrogen and carbon concentrations induced by warming were also examined in parallel with the other variables.
Results
Identifying Artificial Temperature Patterns Under Warming
Around the year 2016, the annual Tmean in Dianchi was 3.64°C higher than that in Lashi (Table 1, also see Supplementary Figure S1). Tmax and Tmin over this year were on average 2.42°C and 4.15°C higher in Dianchi than Lashi, respectively, resulting in differences in Trange between the sites being −1.73°C (Supplementary Figure S2). Similarly, Trange in Lashi was also 1.70°C lower than in Napa. However, by comparing the +2°C-warming scenario to CK (Table 1), we found that a different temperature pattern could be observed in the chambers than in the ambient experiments. As shown, an annual Tmean increase of 2.12°C was accompanied by imbalanced increases of Tmax (+6.80°C) and Tmin (+1.90°C, Supplementary Figure S2). As a consequence, Trange under the +2°C-warming scenario was on average +4.90°C higher than under CK (Table 1).
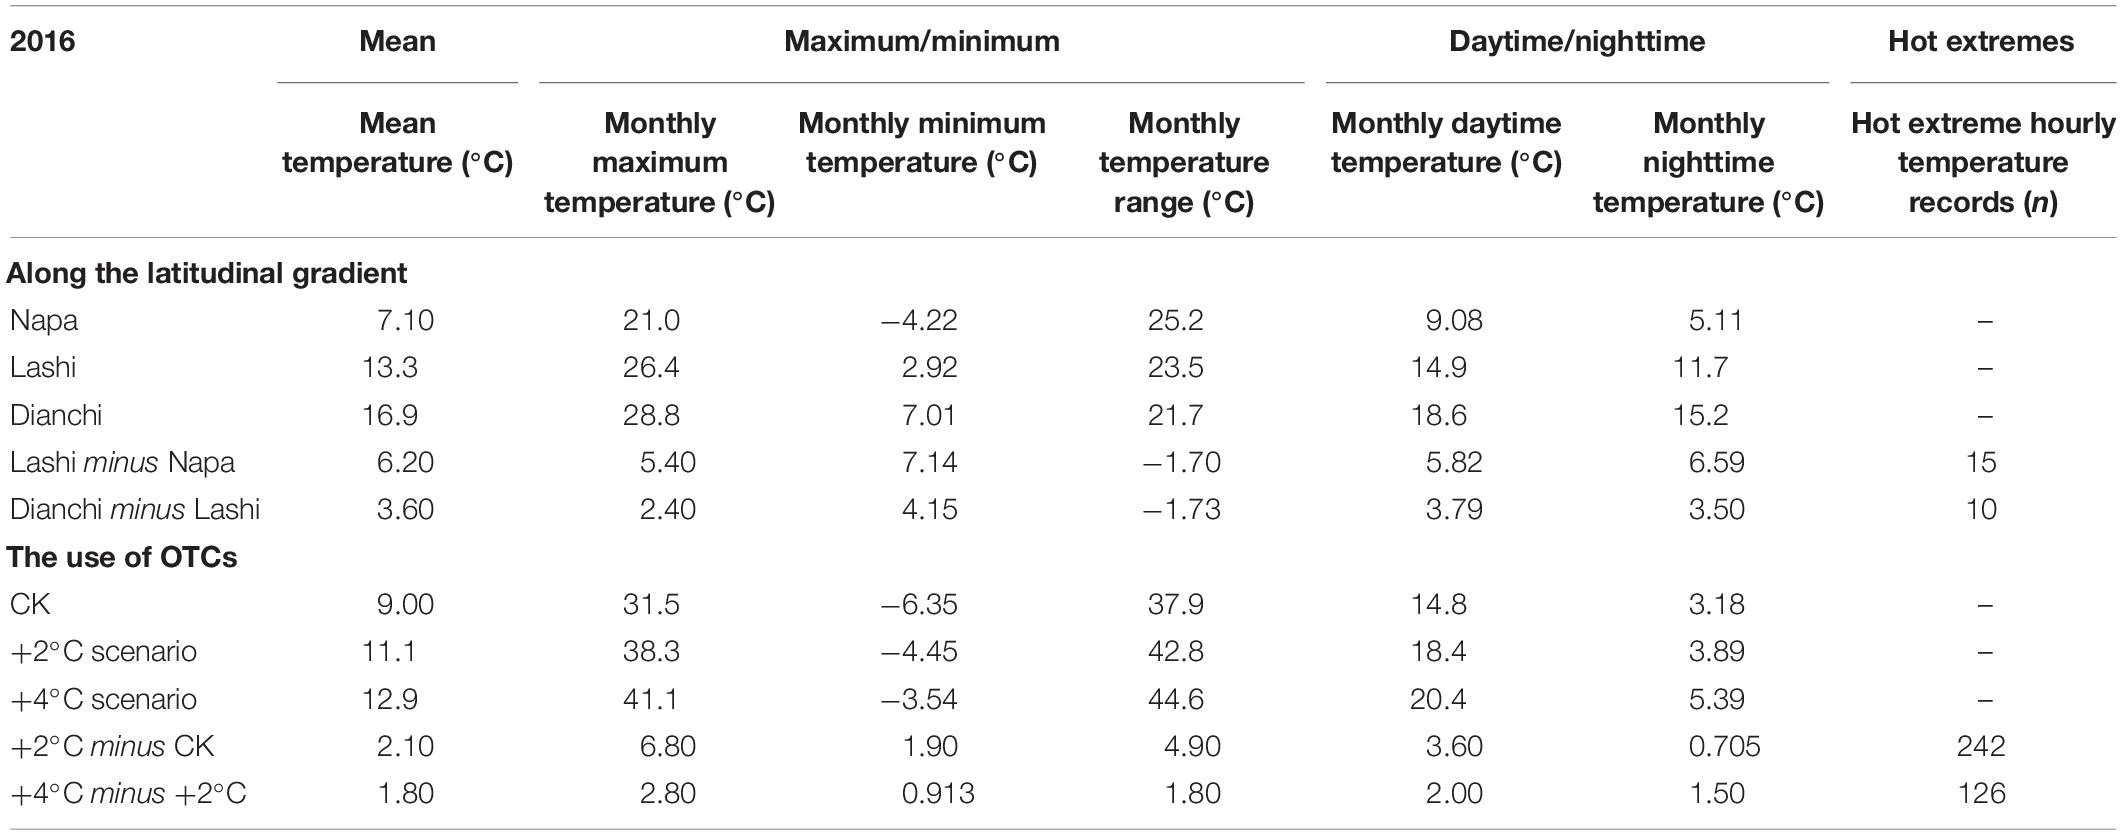
Table 1. Temperature patterns of two warming experiments averaged over a year.
We then calculated Tday and Tnight over the same year (2016, Table 1). Temperature differences between Dianchi and Lashi were generally equally contributed by increases in Tday (+3.79°C) and Tnight (+3.50°C, Supplementary Figure S3). Similarly, increases in Tday and Tnight were +5.82°C and +6.59°C when Lashi was compared with Napa, respectively. However, the increase in Tmean under the +2°C-warming scenario as compared with CK was the result of increases in Tday (+3.54°C, contributing 83.3% of the increase), with increases in Tnight contributing much less (+0.705°C, 16.7%, Supplementary Figure S3).
The DTR distribution patterns were not fundamentally different between Dianchi and Lashi, and neither did they differ much between Lashi and Napa, with most DTRs falling into a range of 5–25°C (i.e., from 5°C ≤ DTR2 < 10°C to 20°C ≤ DTR5 < 25°C, Supplementary Figure S4). However, there was a shift to the “right side” for DTR patterns under the +2°C-warming scenario compared to CK (Supplementary Figure S4), suggesting that OTC-simulated warming preferentially changed DTRs by increasing the number of days with higher DTR values, an indication of increased daily temperature fluctuations toward hotter hours.
We also calculated the numbers of hot extremes (Thot) over each season in 2016 (Table 1). A total of 10 and 15 hot extremes were recorded when comparing Dianchi to Lashi and comparing Lashi to Napa, respectively, while a total of 242 hot extremes were recorded when comparing +2°C-warming to CK (Supplementary Figure S4).
By comparing the +4°C- and +2°C-warming scenarios, we can disentangle intended temperature rises from artifacts. There were many fewer asymmetrical maximum/minimum temperatures and asymmetrical daytime/nighttime temperatures between these two warming scenarios than between +2°C-warming and CK (Supplementary Figures S2, S3). On average, the difference in Trange was +1.80°C and moreover, the differences in Tday (+2.00°C) and Tnight (+1.50°C) were well balanced between the +4°C- and +2°C-warming scenarios (Table 1). In addition, no obvious differences in DTR patterns were detected between these two scenarios, and the number of hot extremes records was reduced to 126, although this was still many more than were found over the same timescale in the latitudinal experiments (Supplementary Figure S4).
The temperature patterns recorded in 2016 were similar to those observed in other experimental years (data not shown). Furthermore, we also compared air relative humidity here. Neither seasonal nor annual relative humidity was obviously altered by OTC warming (Supplementary Figure S5). In the gradient experiments, differences in air relative humidity between sites were also minor and no consistent patterns were identified. For instance, in 2012 the air relative humidity was the highest in Dianchi, while in 2016 Dianchi has the lowest values of the three sites (Supplementary Figure S5).
Species Photosynthetic Traits
Given the huge amount of data generated in these experiments, detailed results relevant to S. tabernaemontani are provided here, as a representative in the study region, while those relating to the other two species are given mainly in the supporting materials and are mentioned in a concise way as complementary verification. In 2014, net photosynthetic rate, stomatal conductance, intercellular CO2 concentration, and transpiration rate of S. tabernaemontani leaves were 9.61% (p = 0.601), 169% (p = 0.083), 28.4% (p = 0.114), and 69.5% (p = 0.016) higher under +2°C than under CK, respectively (Figure 2). However, this positive response to warming did not persist. In 2015, negative responses were found in stomatal conductance (lower by 36.4%, p = 0.124), intercellular CO2 concentration (by 5.75%, p = 0.367), and transpiration rate (by 25.3%, p = 0.231). In 2016, all photosynthetic traits showed negative responses under the +2°C scenario, especially for net photosynthetic rate (lower by 62.7%, p = 0.021) and transpiration rate (by 47.3%, p = 0.034). Correspondingly, maximum net photosynthetic rate under +2°C was lower (by 57.2%, p = 0.030) than under CK in 2016 (Figure 2). Jmax was higher by 17.4% (p = 0.027) in 2014 and higher by 35.0% (p = 0.011) in 2015, but lower by 21.7% (p = 0.022) in 2016 under the +2°C scenario compared with CK. Furthermore, traits derived from Pn-Ci curves all varied significantly among the observed years (Figure 2, repeated-measures ANOVA). Significant warming × year interactions were observed for variables including net photosynthetic rate, stomatal conductance, transpiration rate, maximum net photosynthetic rate, Vcmax, and Jmax (Figure 2), suggesting that the responses of these variables to warming are highly dependent on the year of observation. To investigate whether diffusive or biochemical processes underlay the alterations in photosynthetic rates under +2°C warming, we plotted net photosynthetic rate against stomatal conductance, Vcmax, and Jmax. Net photosynthetic rate correlated significantly with stomatal conductance but not with Vcmax or Jmax (Supplementary Figure S6), implying OTC warming-induced diffusive limitations may affect net photosynthetic rate to a greater extent than do the enzymatic properties of Rubisco.
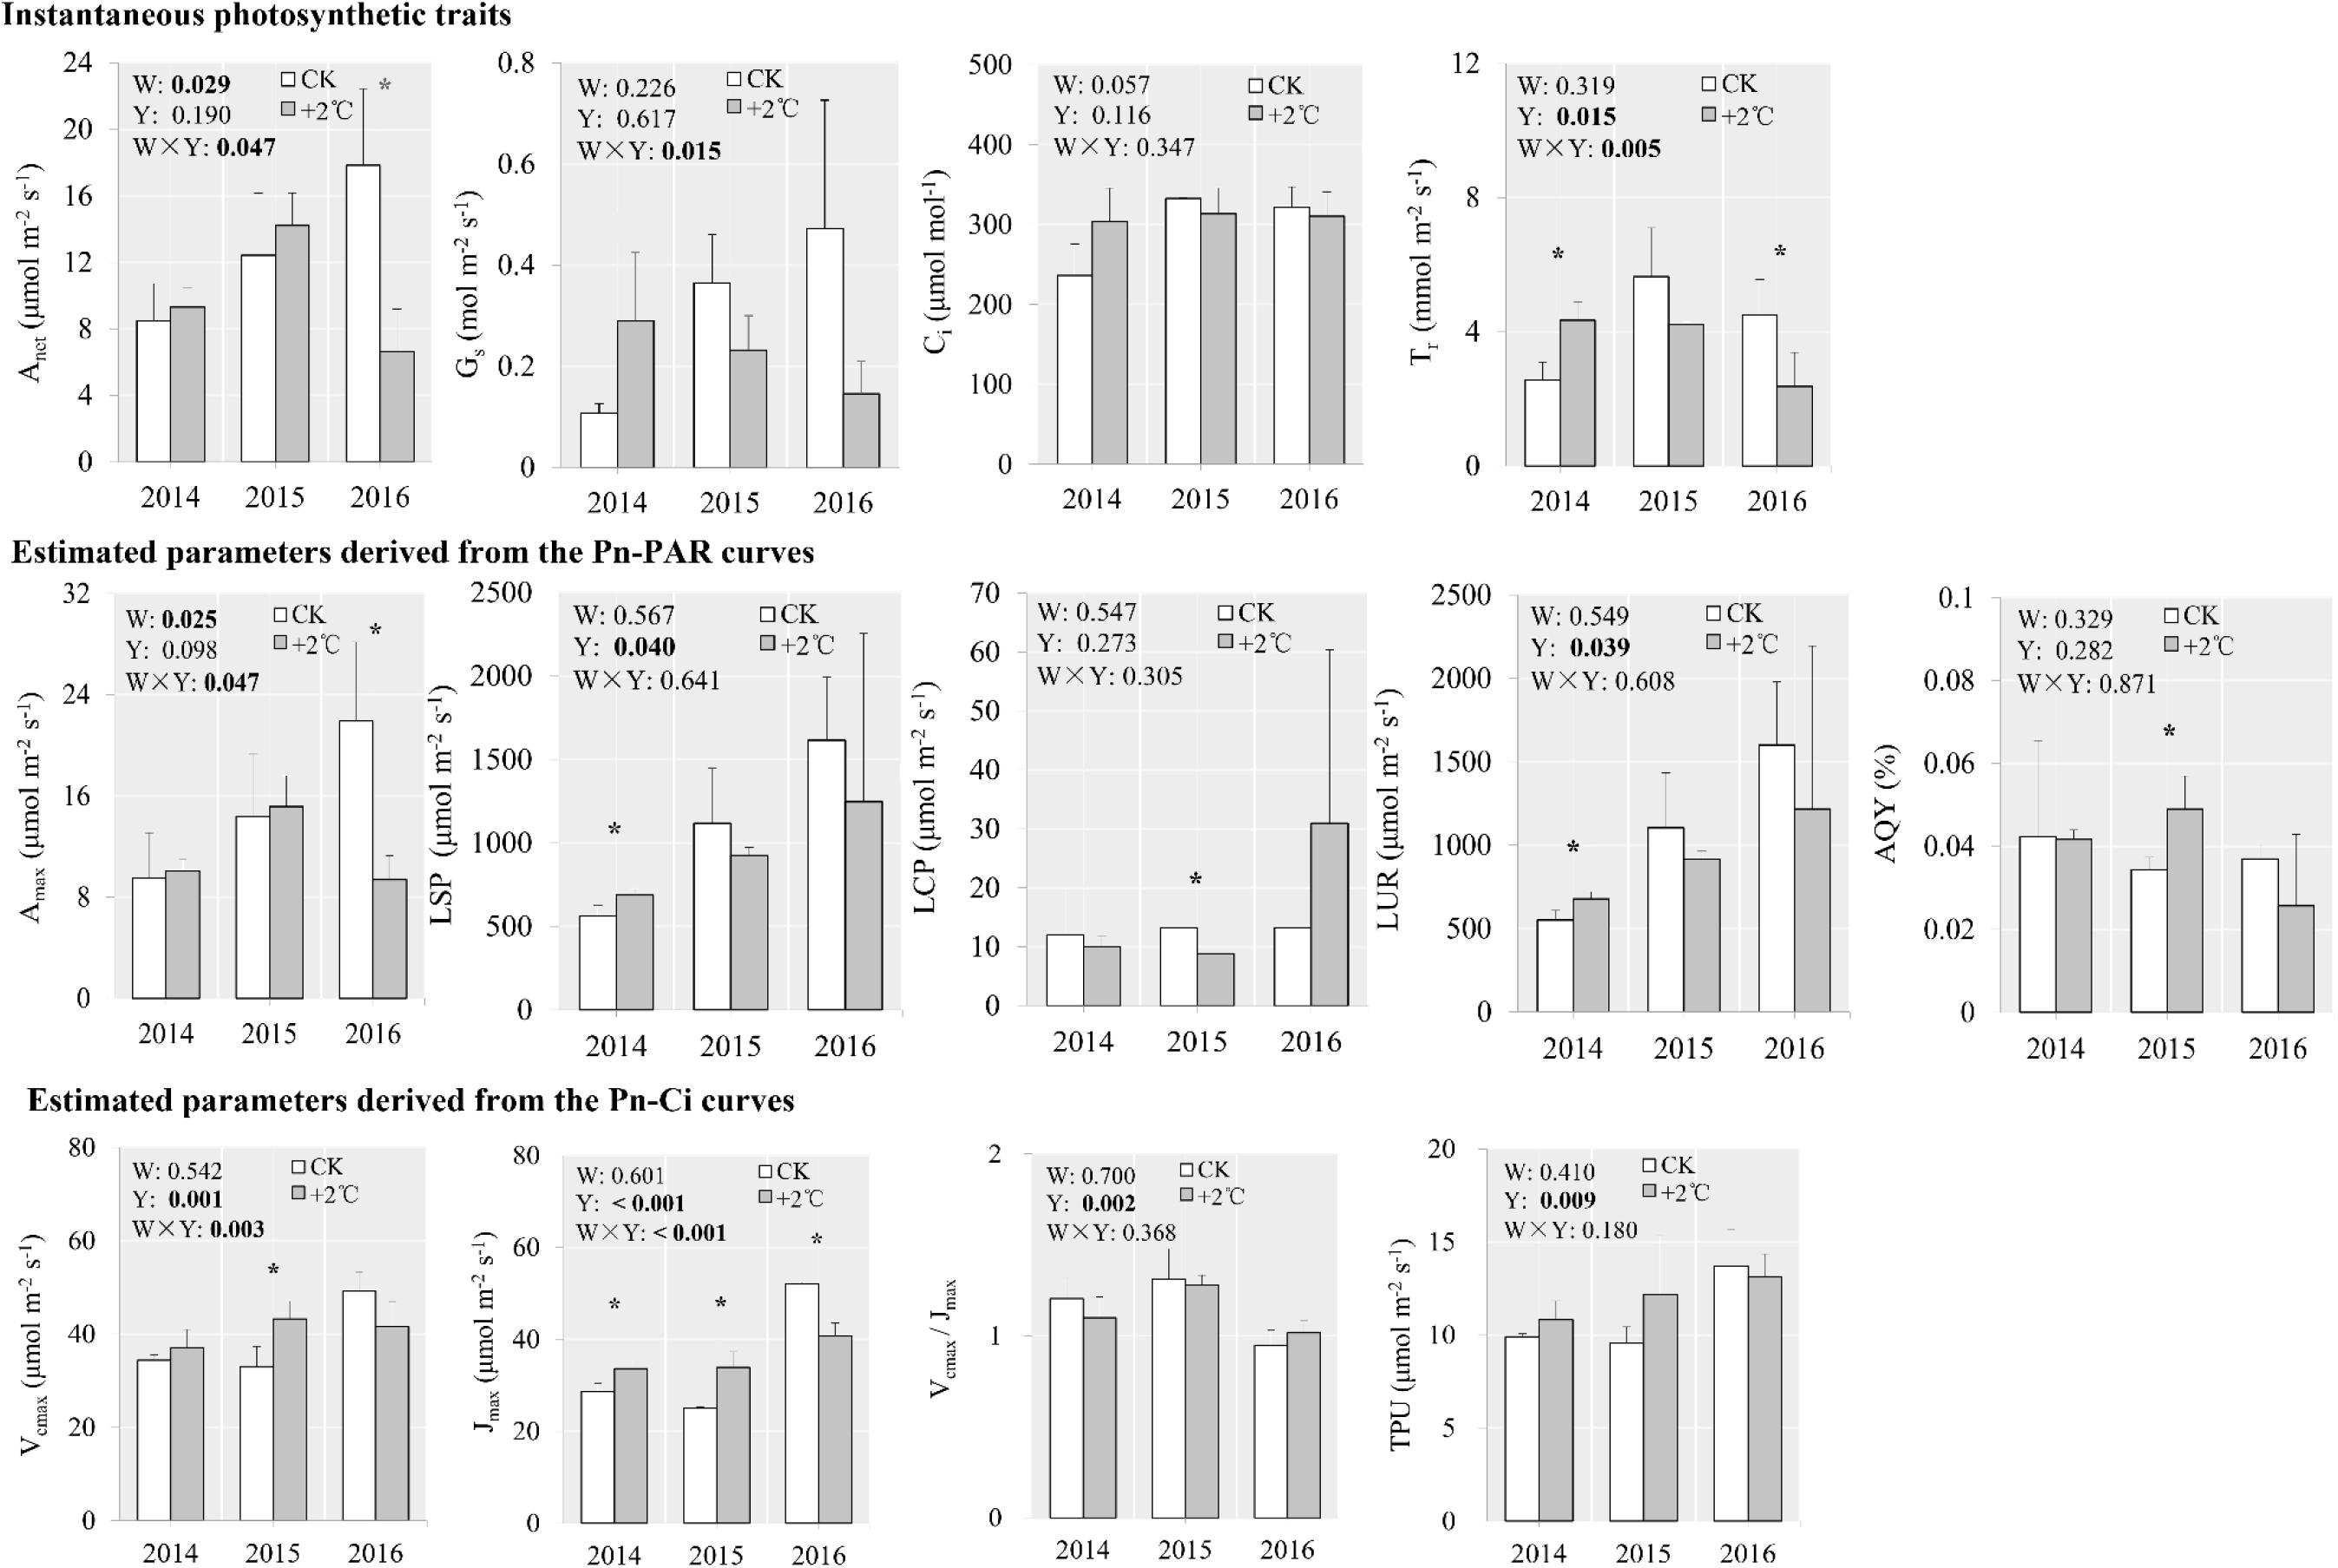
Figure 2. Photosynthetic traits of S. tabernaemontani leaves under CK and +2°C warming scenario using OTCs. Significance tests for warming (W), observed year (Y), and the interaction term (W × Y) under repeated-measures ANOVA are presented for each variable integrated across the different years (p-values less than 0.05 are in bold). Within each year, variables that responded significantly to warming are indicated by asterisks (***p < 0.001; **p < 0.01; *p < 0.05). Error bars indicate standard deviations. Variable descriptions: Anet, light-saturated net photosynthesis; Gs, stomatal conductance; Ci, intercellular CO2 concentration; Tr, transpiration rate; Amax, light- and CO2-saturated net photosynthesis; LSP, light saturation point; LCP, light compensation point; LUR, light utilization range; AQY, apparent quantum yield; Vcmax, maximum RuBP-saturated carboxylation capacity; Jmax, maximum capacity for electron transport contribution to RuBP regeneration; Vcmax/Jmax, the ratio of Vcmax to Jmax; TPU, triose-phosphate utilization rate.
Between the +4°C and +2°C scenarios, no significant differences in net photosynthetic rate, stomatal conductance, intercellular CO2 concentration, or transpiration rate were seen in 2014. However, in 2015, the net photosynthetic rate was lower by 38.3% (p = 0.049) under the +4°C scenario than +2°C. Transpiration rate was significantly higher by 46.7% and 71.2% under the +4°C scenario in 2015 and 2016 compared with +2°C, respectively (Figure 3). No differences in photosynthetic traits derived from both Pn-PAR and Pn-Ci curves were detected between the +4°C and +2°C scenarios in 2016, although in 2014 and 2015, the traits Vcmax and Jmax were much higher under the +4°C than the +2°C scenario (Figure 3). Significant warming × year interactions were observed for stomatal conductance, transpiration rate, maximum net photosynthetic rate, and Vcmax (Figure 3).
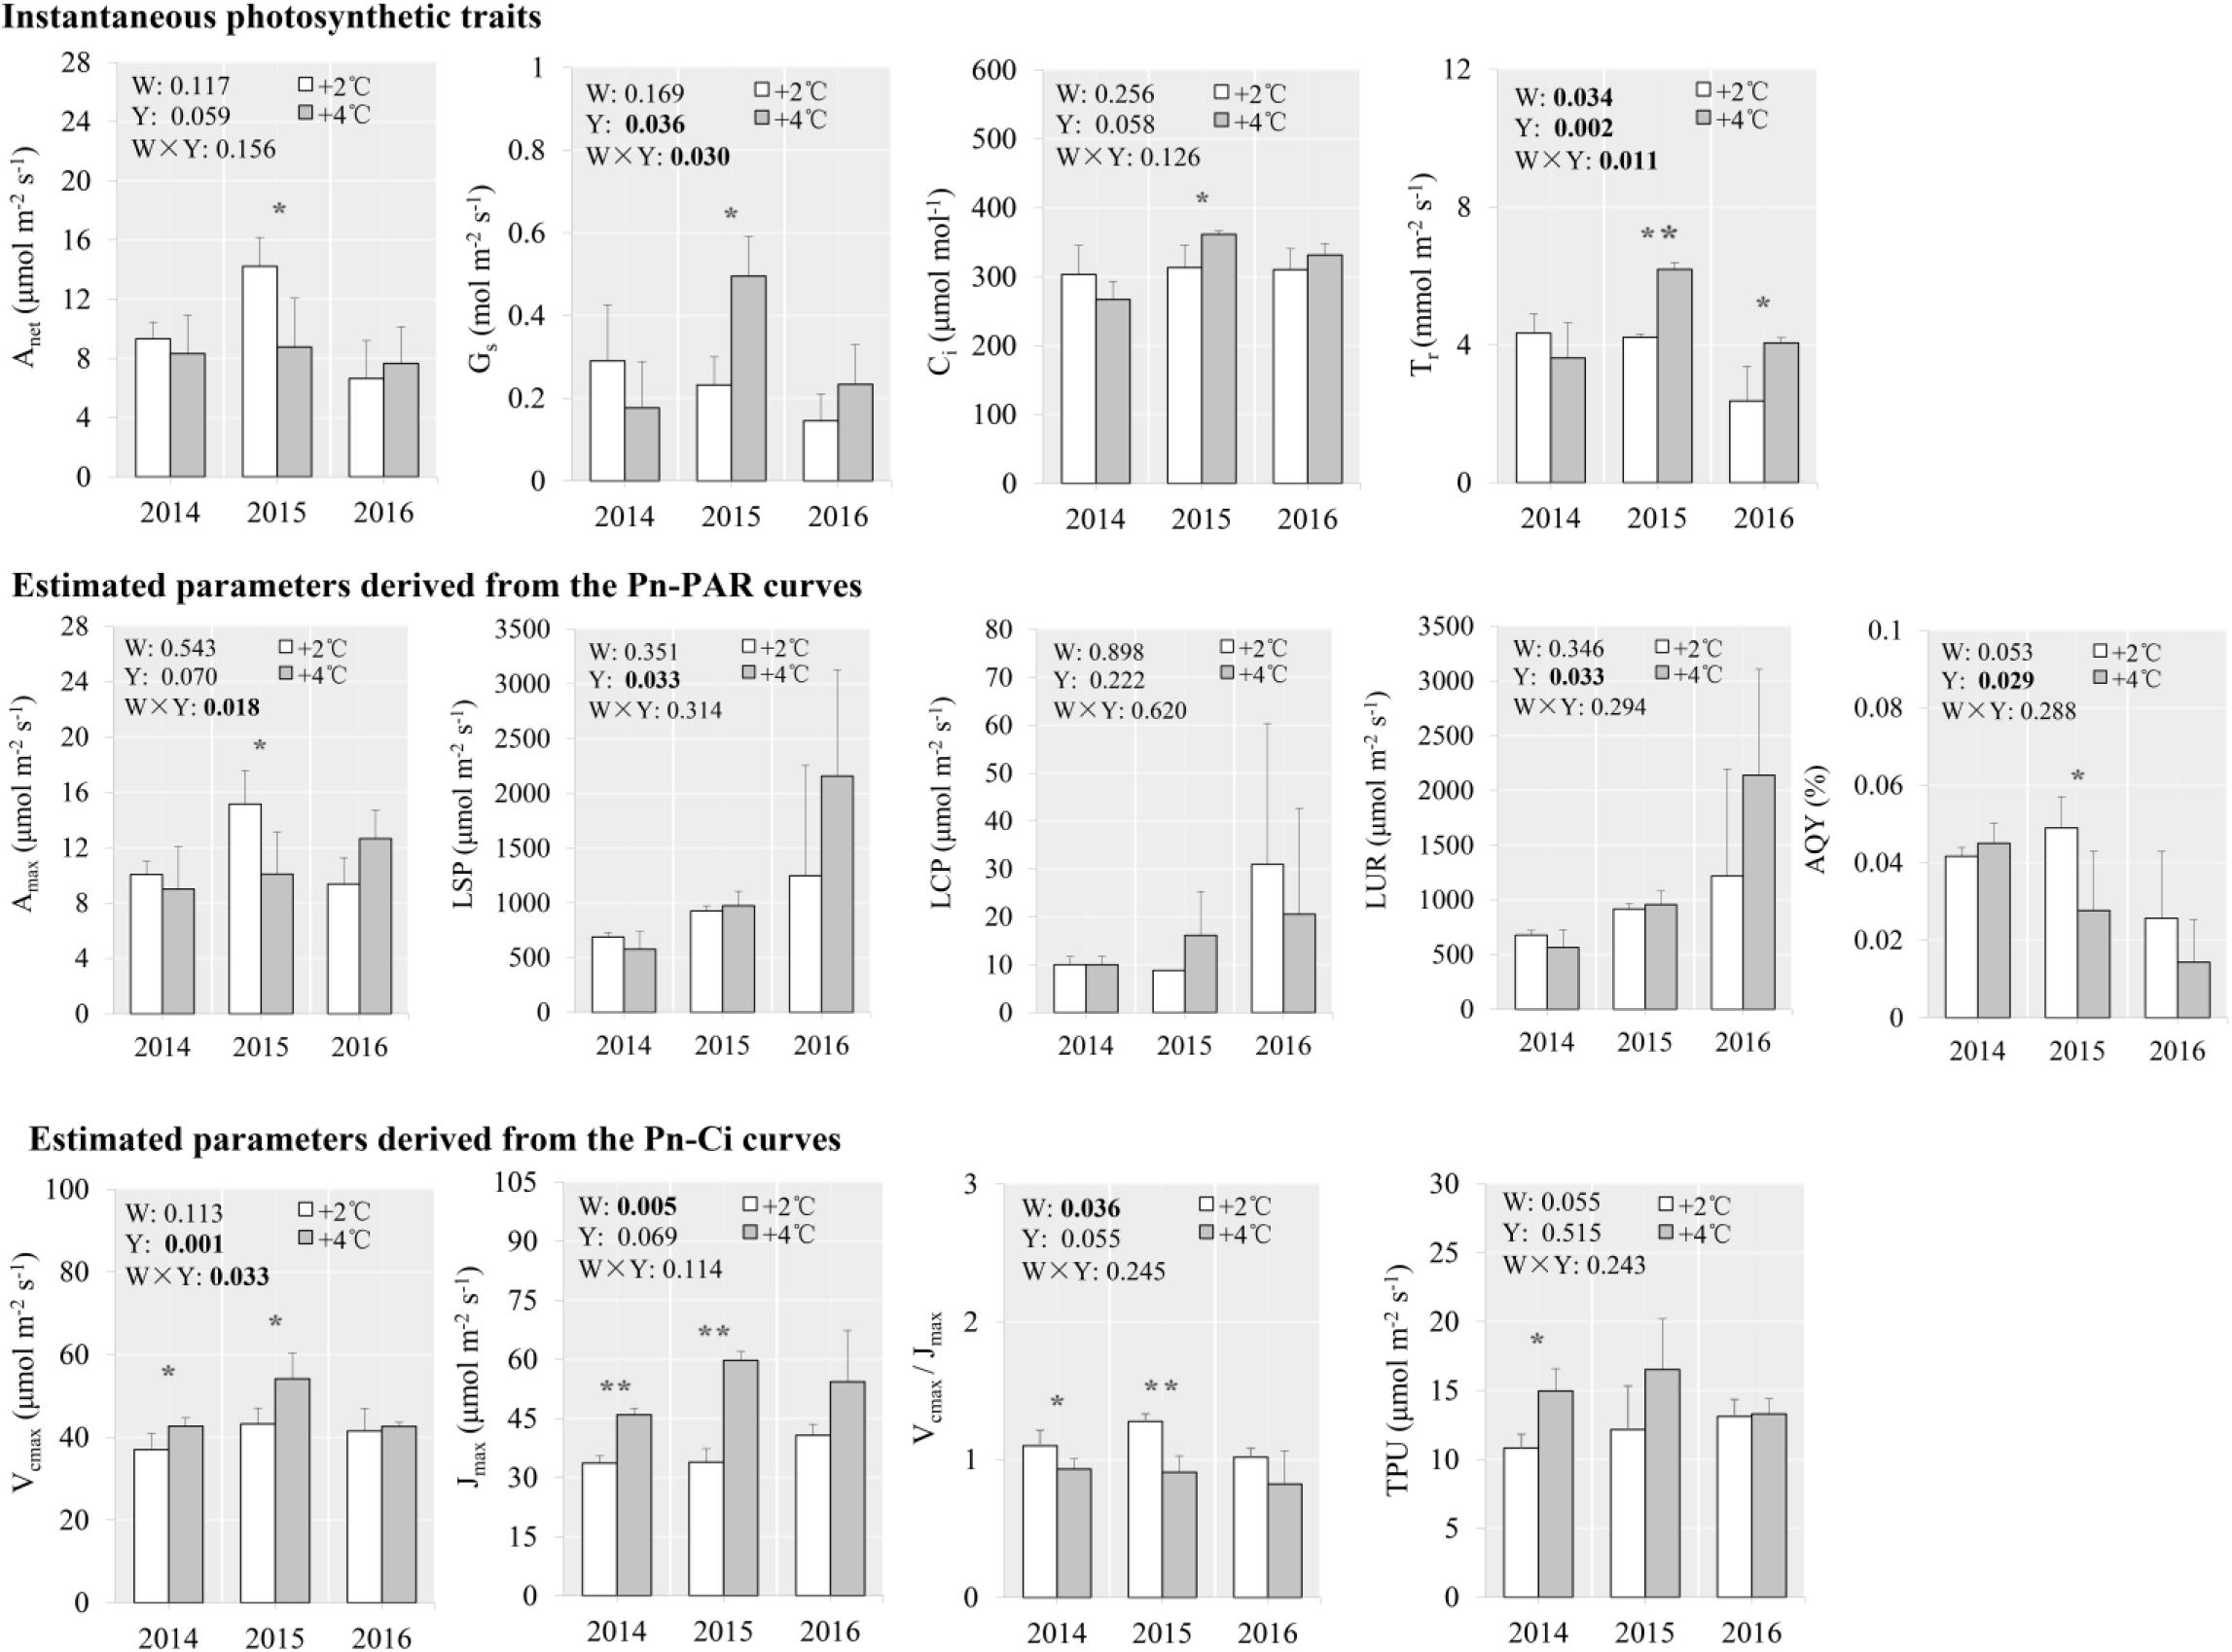
Figure 3. Photosynthetic traits of S. tabernaemontani leaves under +2°C and +4°C warming scenarios using OTCs. Significance tests for warming (W), observed year (Y), and the interaction term (W × Y) under repeated-measures ANOVA are presented for each variable integrated across the different years (p-values less than 0.05 are in bold). Within each year, variables that responded significantly to warming are indicated by asterisks (***p < 0.001; **p < 0.01; *p < 0.05). Error bars indicate standard deviations. See Figure 2 for descriptions of variables.
From the latitudinal gradient, higher net photosynthetic rate and transpiration rate were observed for S. tabernaemontani growing in Dianchi than those in Lashi in 2012 (Figure 4), and net photosynthetic rate and transpiration rate were also higher in Lashi than in Napa for the same year (Figure 5). This trend persisted and S. tabernaemontani plants grown in Dianchi still showed higher net photosynthetic rate (+11.0%, p < 0.001), stomatal conductance (+14.9%, p < 0.001), and intercellular CO2 concentration (+12.6%, p = 0.002) than those grown in Lashi in 2016, after 5 years of warming (Figure 4). Similarly, higher net photosynthetic rate (+11.0%, p < 0.001), stomatal conductance (+11.1%, p = 0.017), and intercellular CO2 concentration (+16.9%, p = 0.001) were also found in Lashi in 2016 as compared with Napa (Figure 5). More obviously, traits from Pn-PAR curves from Dianchi also showed higher values than those from Lashi in 2016, and maximum net photosynthetic rate was 252% higher in Lashi than in Napa. However, except for Vcmax/Jmax (+24.6%, p = 0.014), none of traits from the Pn-Ci curves showed any significant differences between Dianchi and Lashi in 2016. Likewise, apart from Jmax (+18.5%, p = 0.049), none of the traits from Pn-Ci curves showed any significant differences between Lashi and Napa in 2016. No significant effects of year on the traits derived from either Pn-PAR or Pn-Ci curves were detected. This differs from the results of the OTC warming experiments, and suggests that photosynthetic traits were relatively stable and similar among different years for the latitudinal experiments.
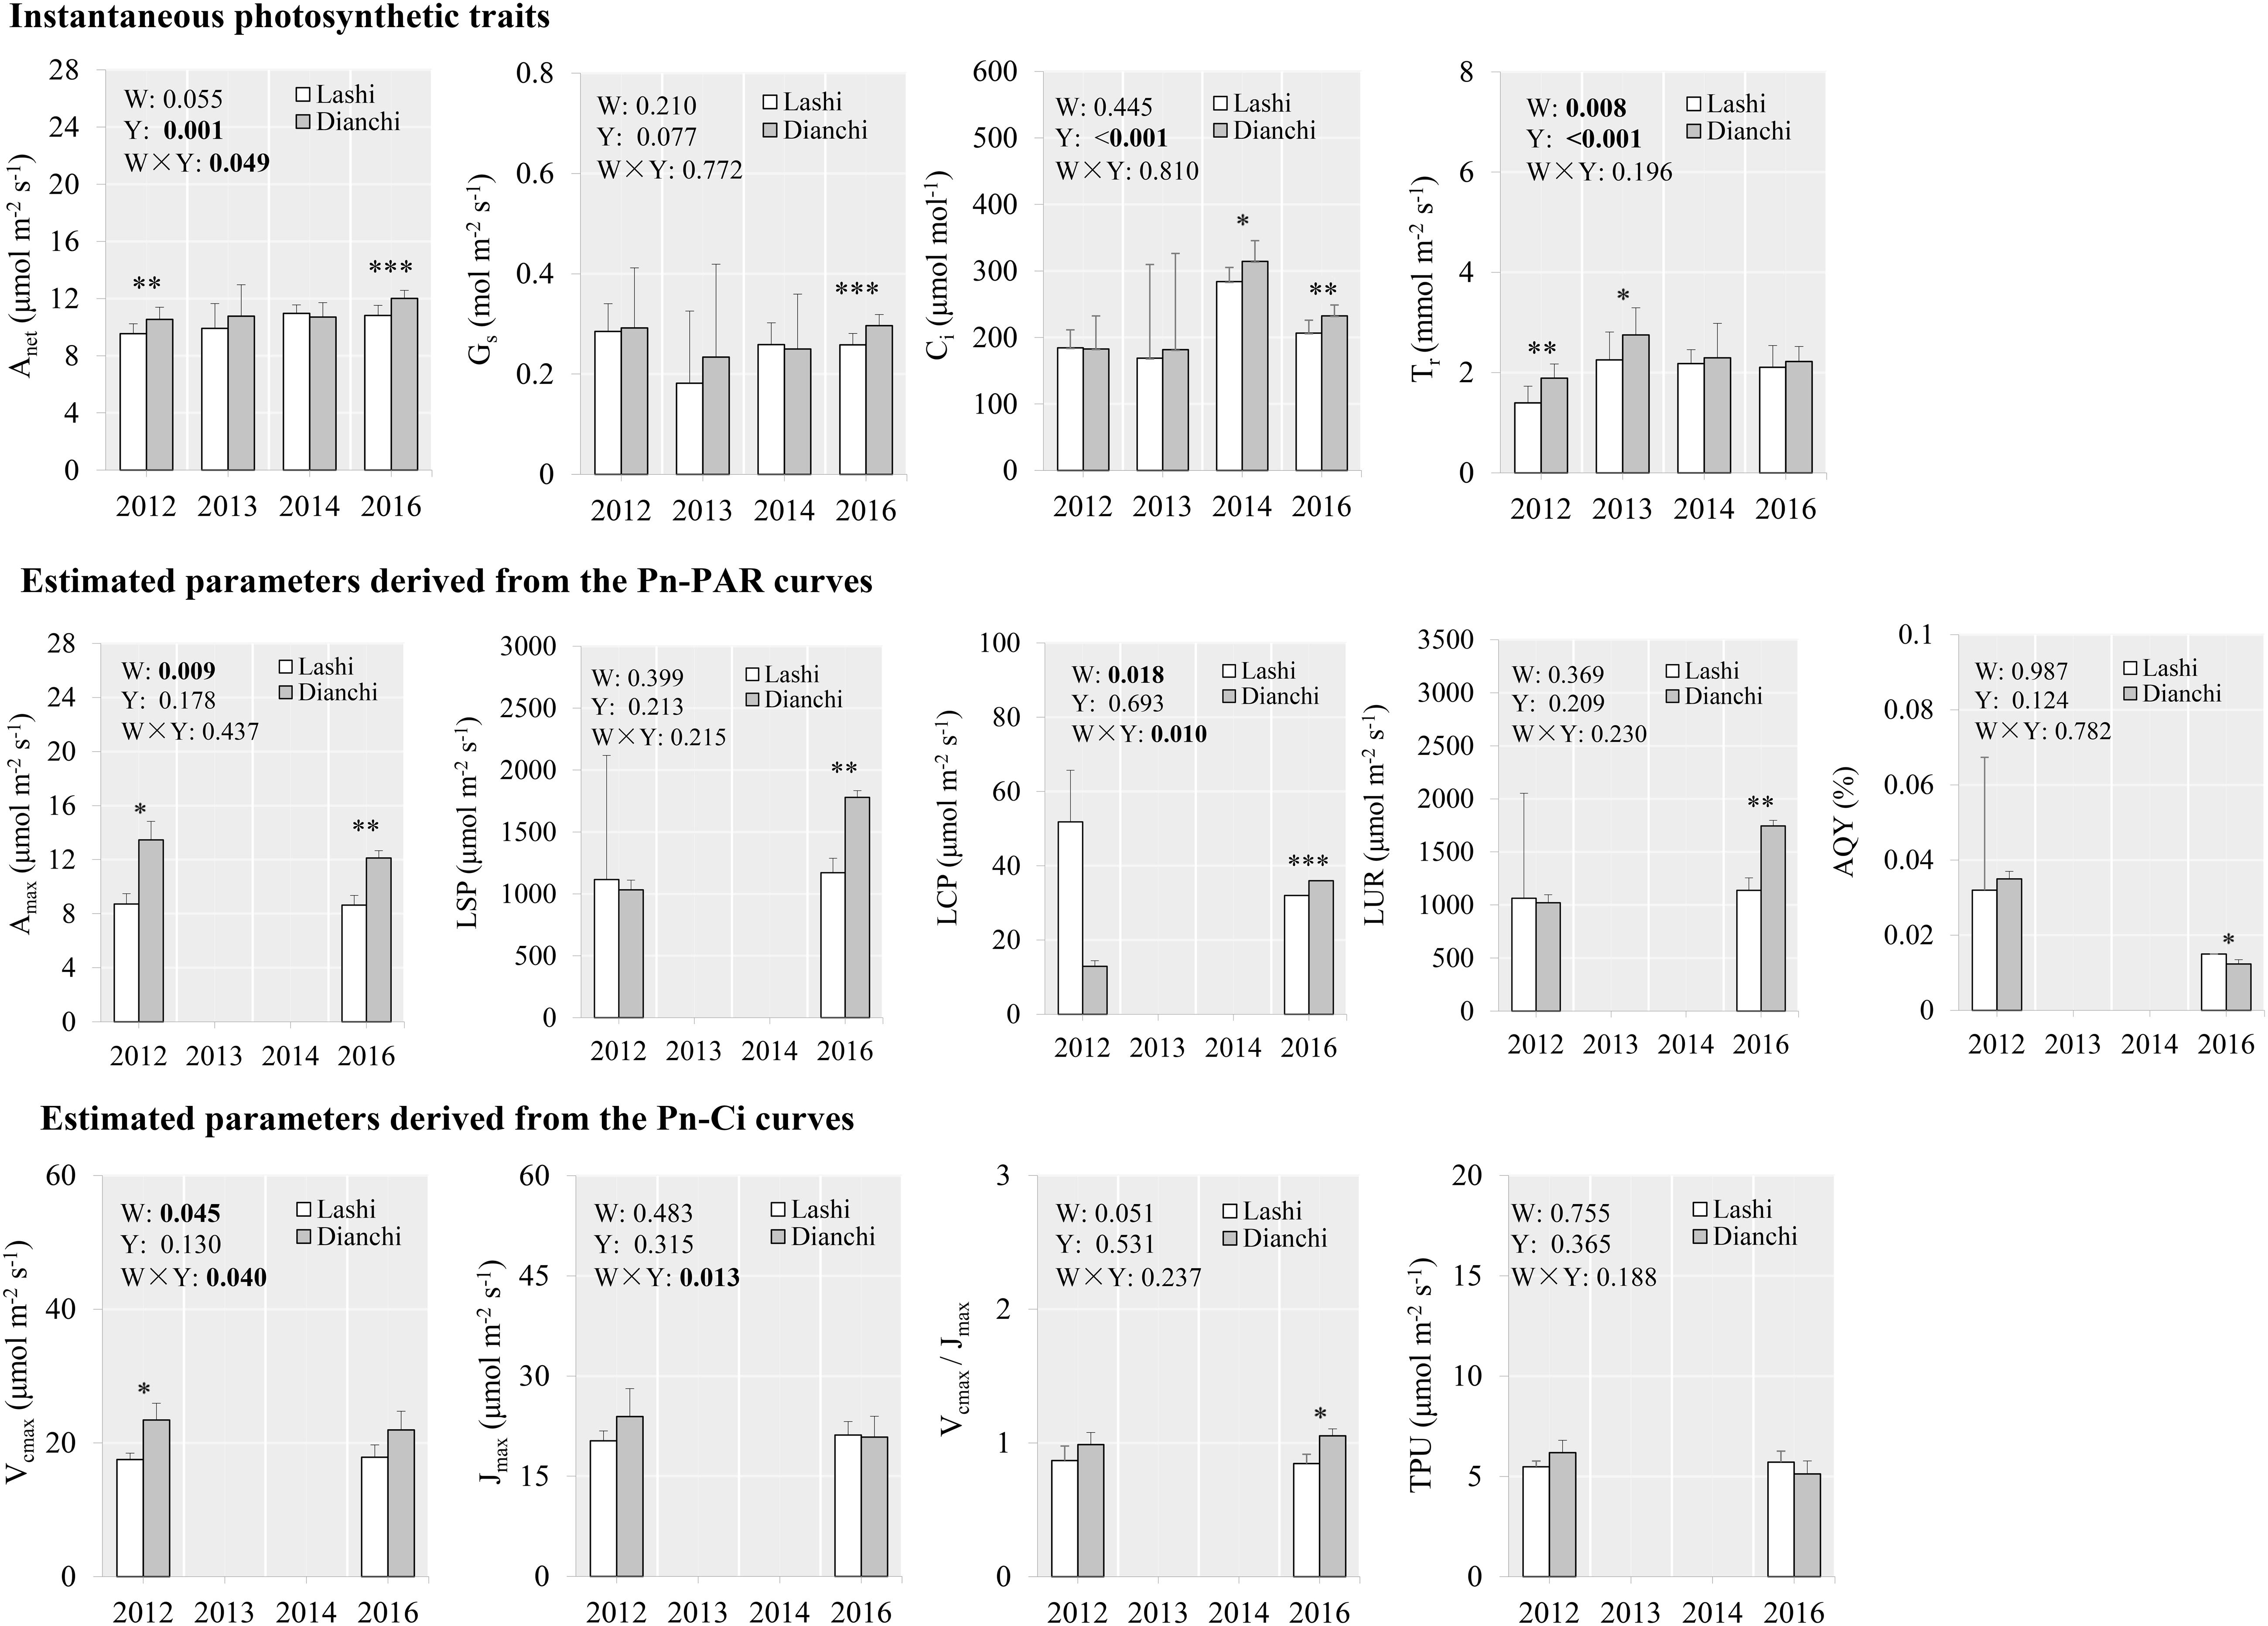
Figure 4. Photosynthetic traits of S. tabernaemontani leaves between Dianchi and Lashi using the natural latitudinal gradient. Significance tests for warming (W), observed year (Y), and the interaction term (W × Y) under repeated-measures ANOVA are presented for each variable integrated across the different years (p-values less than 0.05 are in bold). Within each year, variables that responded significantly to warming are indicated by asterisks (∗∗∗p < 0.001; ∗∗p < 0.01; ∗p < 0.05). Error bars indicate standard deviations. Pn-PAR and Pn-Ci curves were not determined in 2013 and 2014. See Figure 2 for descriptions of variables.
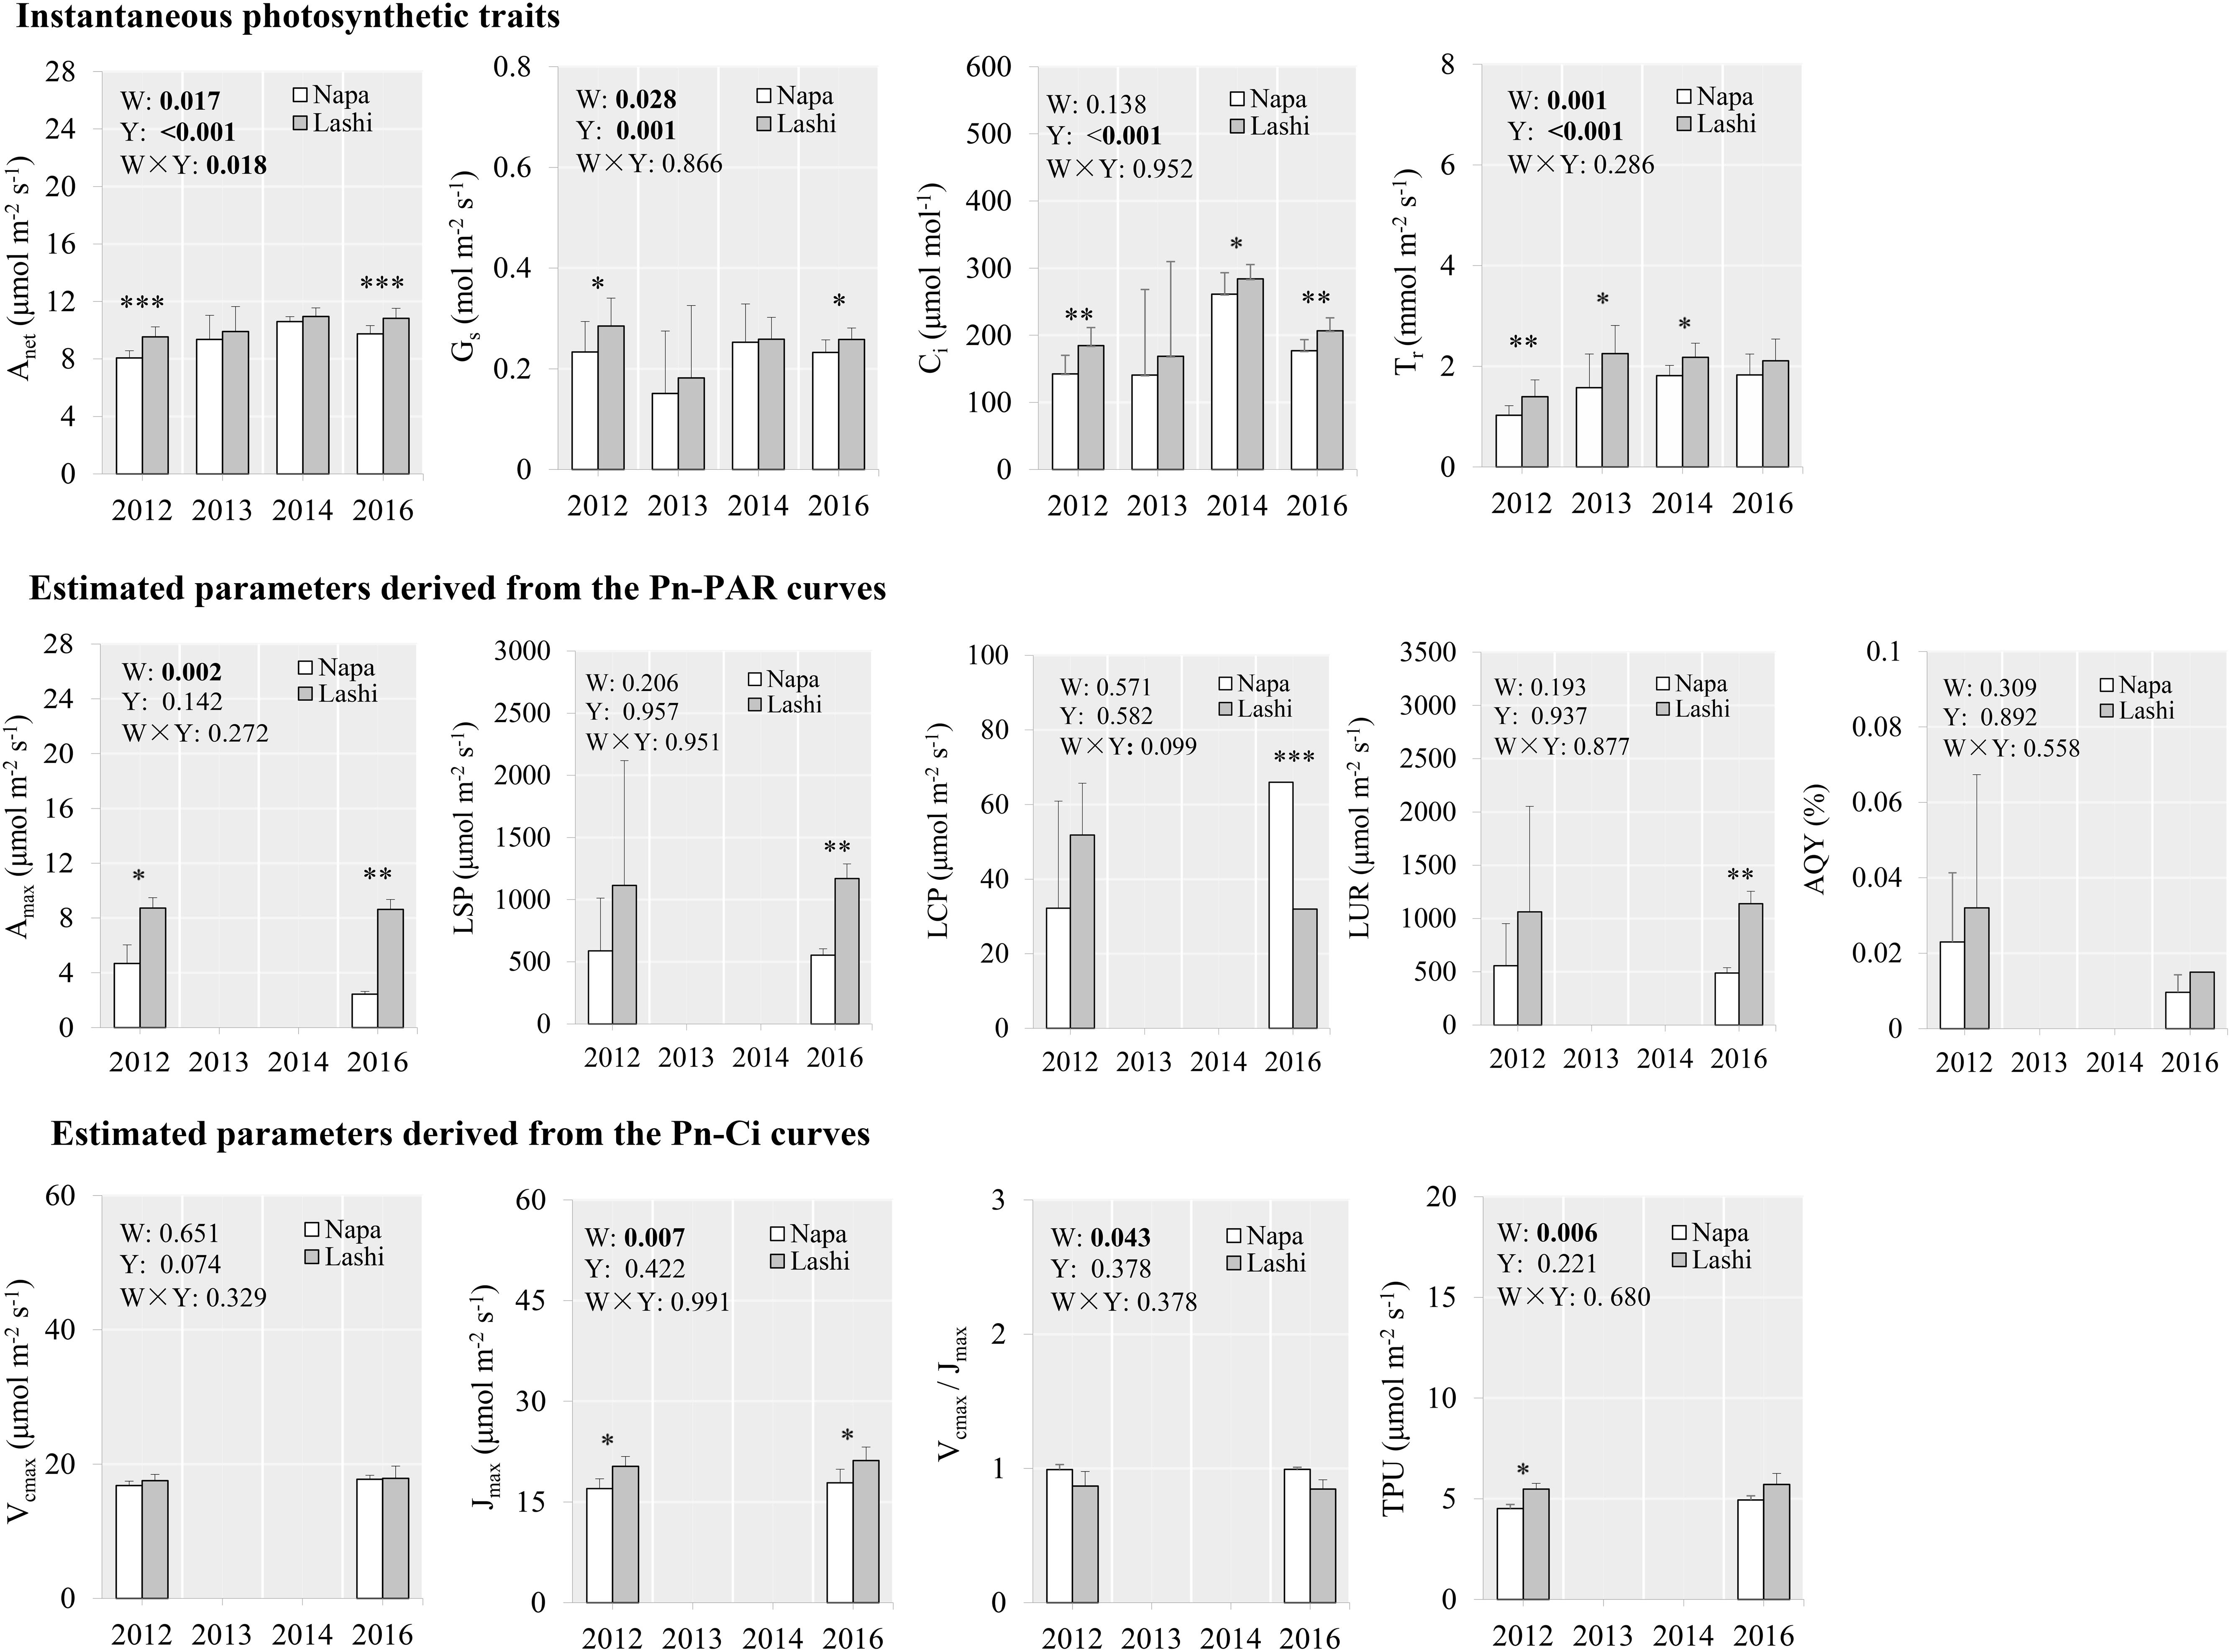
Figure 5. Photosynthetic traits of S. tabernaemontani leaves between Lashi and Napa using the natural latitudinal gradient. Significance tests for warming (W), observed year (Y), and the interaction term (W × Y) under repeated-measures ANOVA are presented for each variable integrated across the different years (p-values less than 0.05 are in bold). Within each year, variables that responded significantly to warming are indicated by asterisks (∗∗∗p < 0.001; ∗∗p < 0.01; ∗p < 0.05). Error bars indicate standard deviations. Pn-PAR and Pn-Ci curves were not determined in 2013 and 2014. See Figure 2 for descriptions of variables.
The photosynthetic responses of S. tabernaemontani to warming were similar to those of Z. latifolia (Supplementary Figure S7). Photosynthetic traits of Z. latifolia leaves were all lower under the +2°C scenario than CK, while comparison of the +4°C to +2°C warming scenarios, as well as comparison of Dianchi to Lashi and Lashi to Napa, all showed generally increased photosynthetic values. However, in contrast to S. tabernaemontani and Z. latifolia, the net photosynthetic rate of S. angustifolium was lower under +4°C than +2°C in 2016 (Supplementary Figure S8), and this was accompanied by lower stomatal conductance and transpiration rate.
Species Height, Basal Diameter, and Above-Ground Biomass
The height of S. tabernaemontani plants did not differ between the +2°C and CK scenarios in 2014 and 2015; however, it decreased over time and also became significantly lower under +2°C than CK in 2016 and 2017 (Figure 6). In contrast, species height was higher under the +4°C warming scenario than the +2°C scenario in 2014 and 2016. Moreover, those S. tabernaemontani plants growing in Dianchi were taller than those in Lashi for all years except for 2013, and those in Lashi were taller than those in Napa in 2014. A +2°C warming from the OTCs also decreased the basal diameter of S. tabernaemontani over the course of the experiment, except for 2014 (Figure 6), while no differences in basal diameters were detected for other treatments, except for 2012.
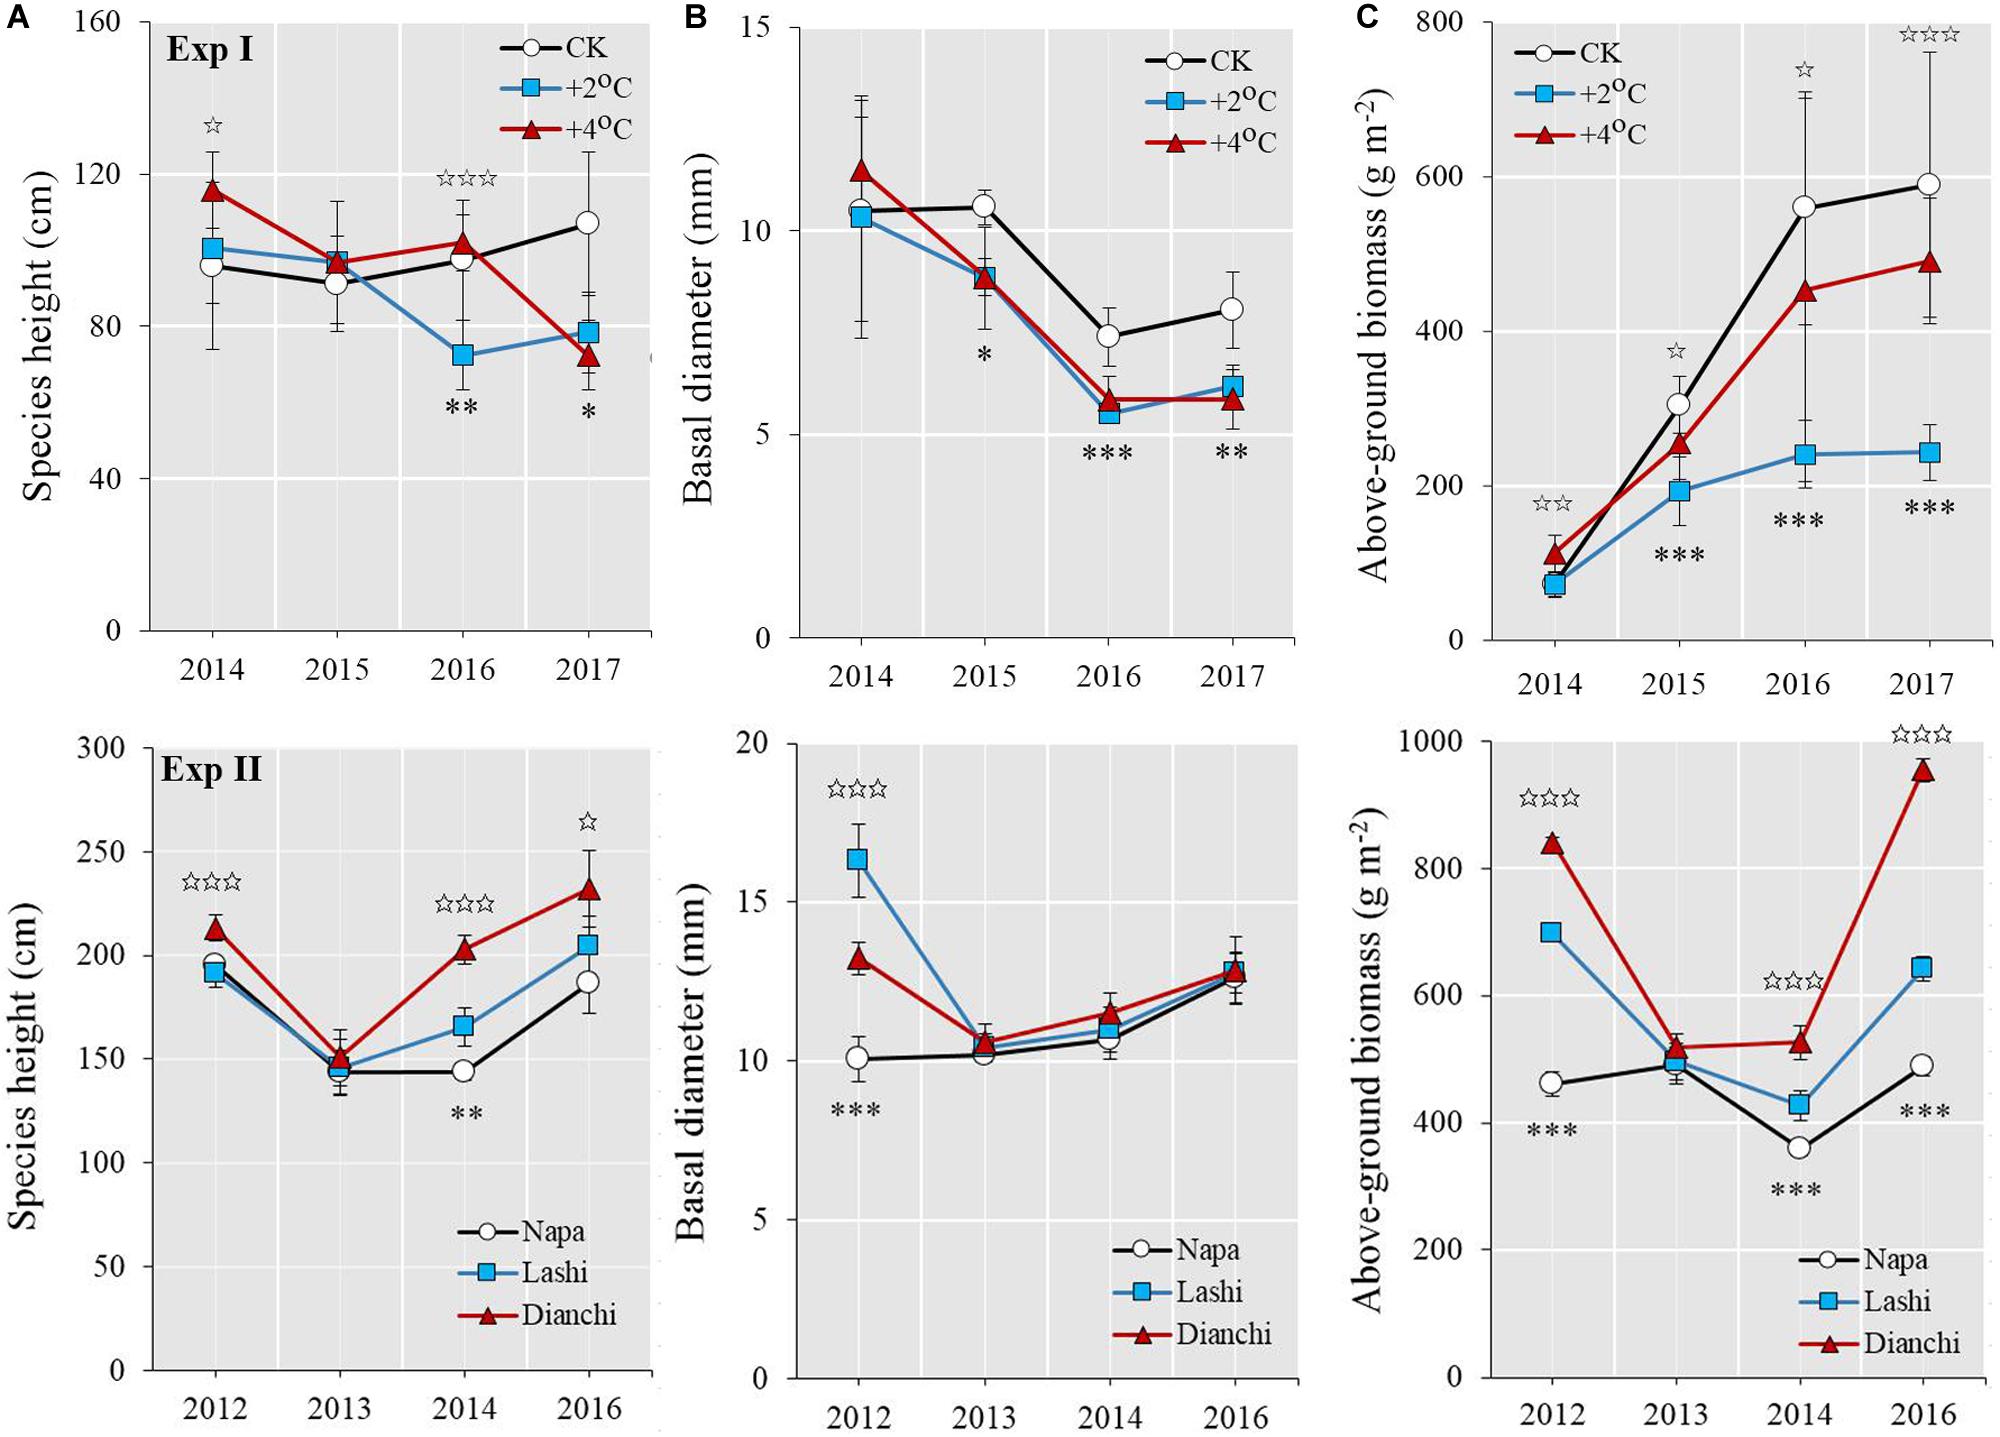
Figure 6. Growth and productivity variables of S. tabernaemontani over time between treatments. (A) Species height, (B) basal diameter, and (C) above-ground biomass. For Exp I, ambient conditions (CK), 2°C-warming (+2°C) as well as 4°C-warming (+4°C) are compared using OTCs. For Exp II, Napa, Lashi, and Dianchi are compared along a latitudinal gradient. Error bars indicate standard deviations. Significant differences between CK and +2°C as well as Napa and Lashi are indicated by close asterisks (∗∗∗p < 0.001; ∗∗p < 0.01; ∗p < 0.05). Significant differences between +2°C and +4°C as well as between Lashi and Dianchi are indicated by open asterisks (✩✩✩p < 0.001; ✩✩p < 0.01; ✩p < 0.05).
Above-ground biomass of S. tabernaemontani was lower under the +2°C scenario than under CK in 2015, and it remained low through 2016 and 2017 (Figure 6). In contrast, above-ground biomass under the +4°C scenario was much higher than under +2°C for all years. After transplanting, the above-ground biomass of the S. tabernaemontani plants in Dianchi was also much higher than that of those growing in Lashi. Similar patterns were detected when plants were transplanted from Napa to Lashi.
The other widely distributed species, Z. latifolia showed similar results (Supplementary Figure S9). Under the +2°C warming scenario, species height and above-ground biomass both decreased, while both the +4°C treatment and the transplant experiments resulted in an increase in these traits under warming (Supplementary Figure S9). For S. angustifolium, the species with narrow distribution, the +4°C-warming scenario decreased species height as compared with the +2°C scenario in 2016 and 2017 (Supplementary Figure S10), but no differences in above-ground biomass were found between the +2°C and +4°C-warming scenarios in those years, except for 2015. In the transplant experiments, in 2012, species height, basal diameter, and above-ground biomass were all lower for S. angustifolium plants growing in Dianchi than for those in Lashi. In 2014, 4 years following transplant, S. angustifolium even disappeared from Dianchi (Supplementary Figure S10). When transplanted from Napa to Lashi, the above-ground biomass of S. angustifolium remained unchanged throughout the 5-year study.
Below-Ground Biomass
At the end of the experiments, after 4–5 years of warming, we determined below-ground biomass. Compared to CK, the below-ground biomass of both S. tabernaemontani and Z. latifolia was higher under the +2°C scenario, while that of S. angustifolium was lower (Figure 7). Below-ground biomass of S. tabernaemontani and Z. latifolia was also higher under +4°C than under the +2°C scenario. Furthermore, Z. latifolia plants growing in Dianchi showed higher below-ground biomass than those in Lashi.
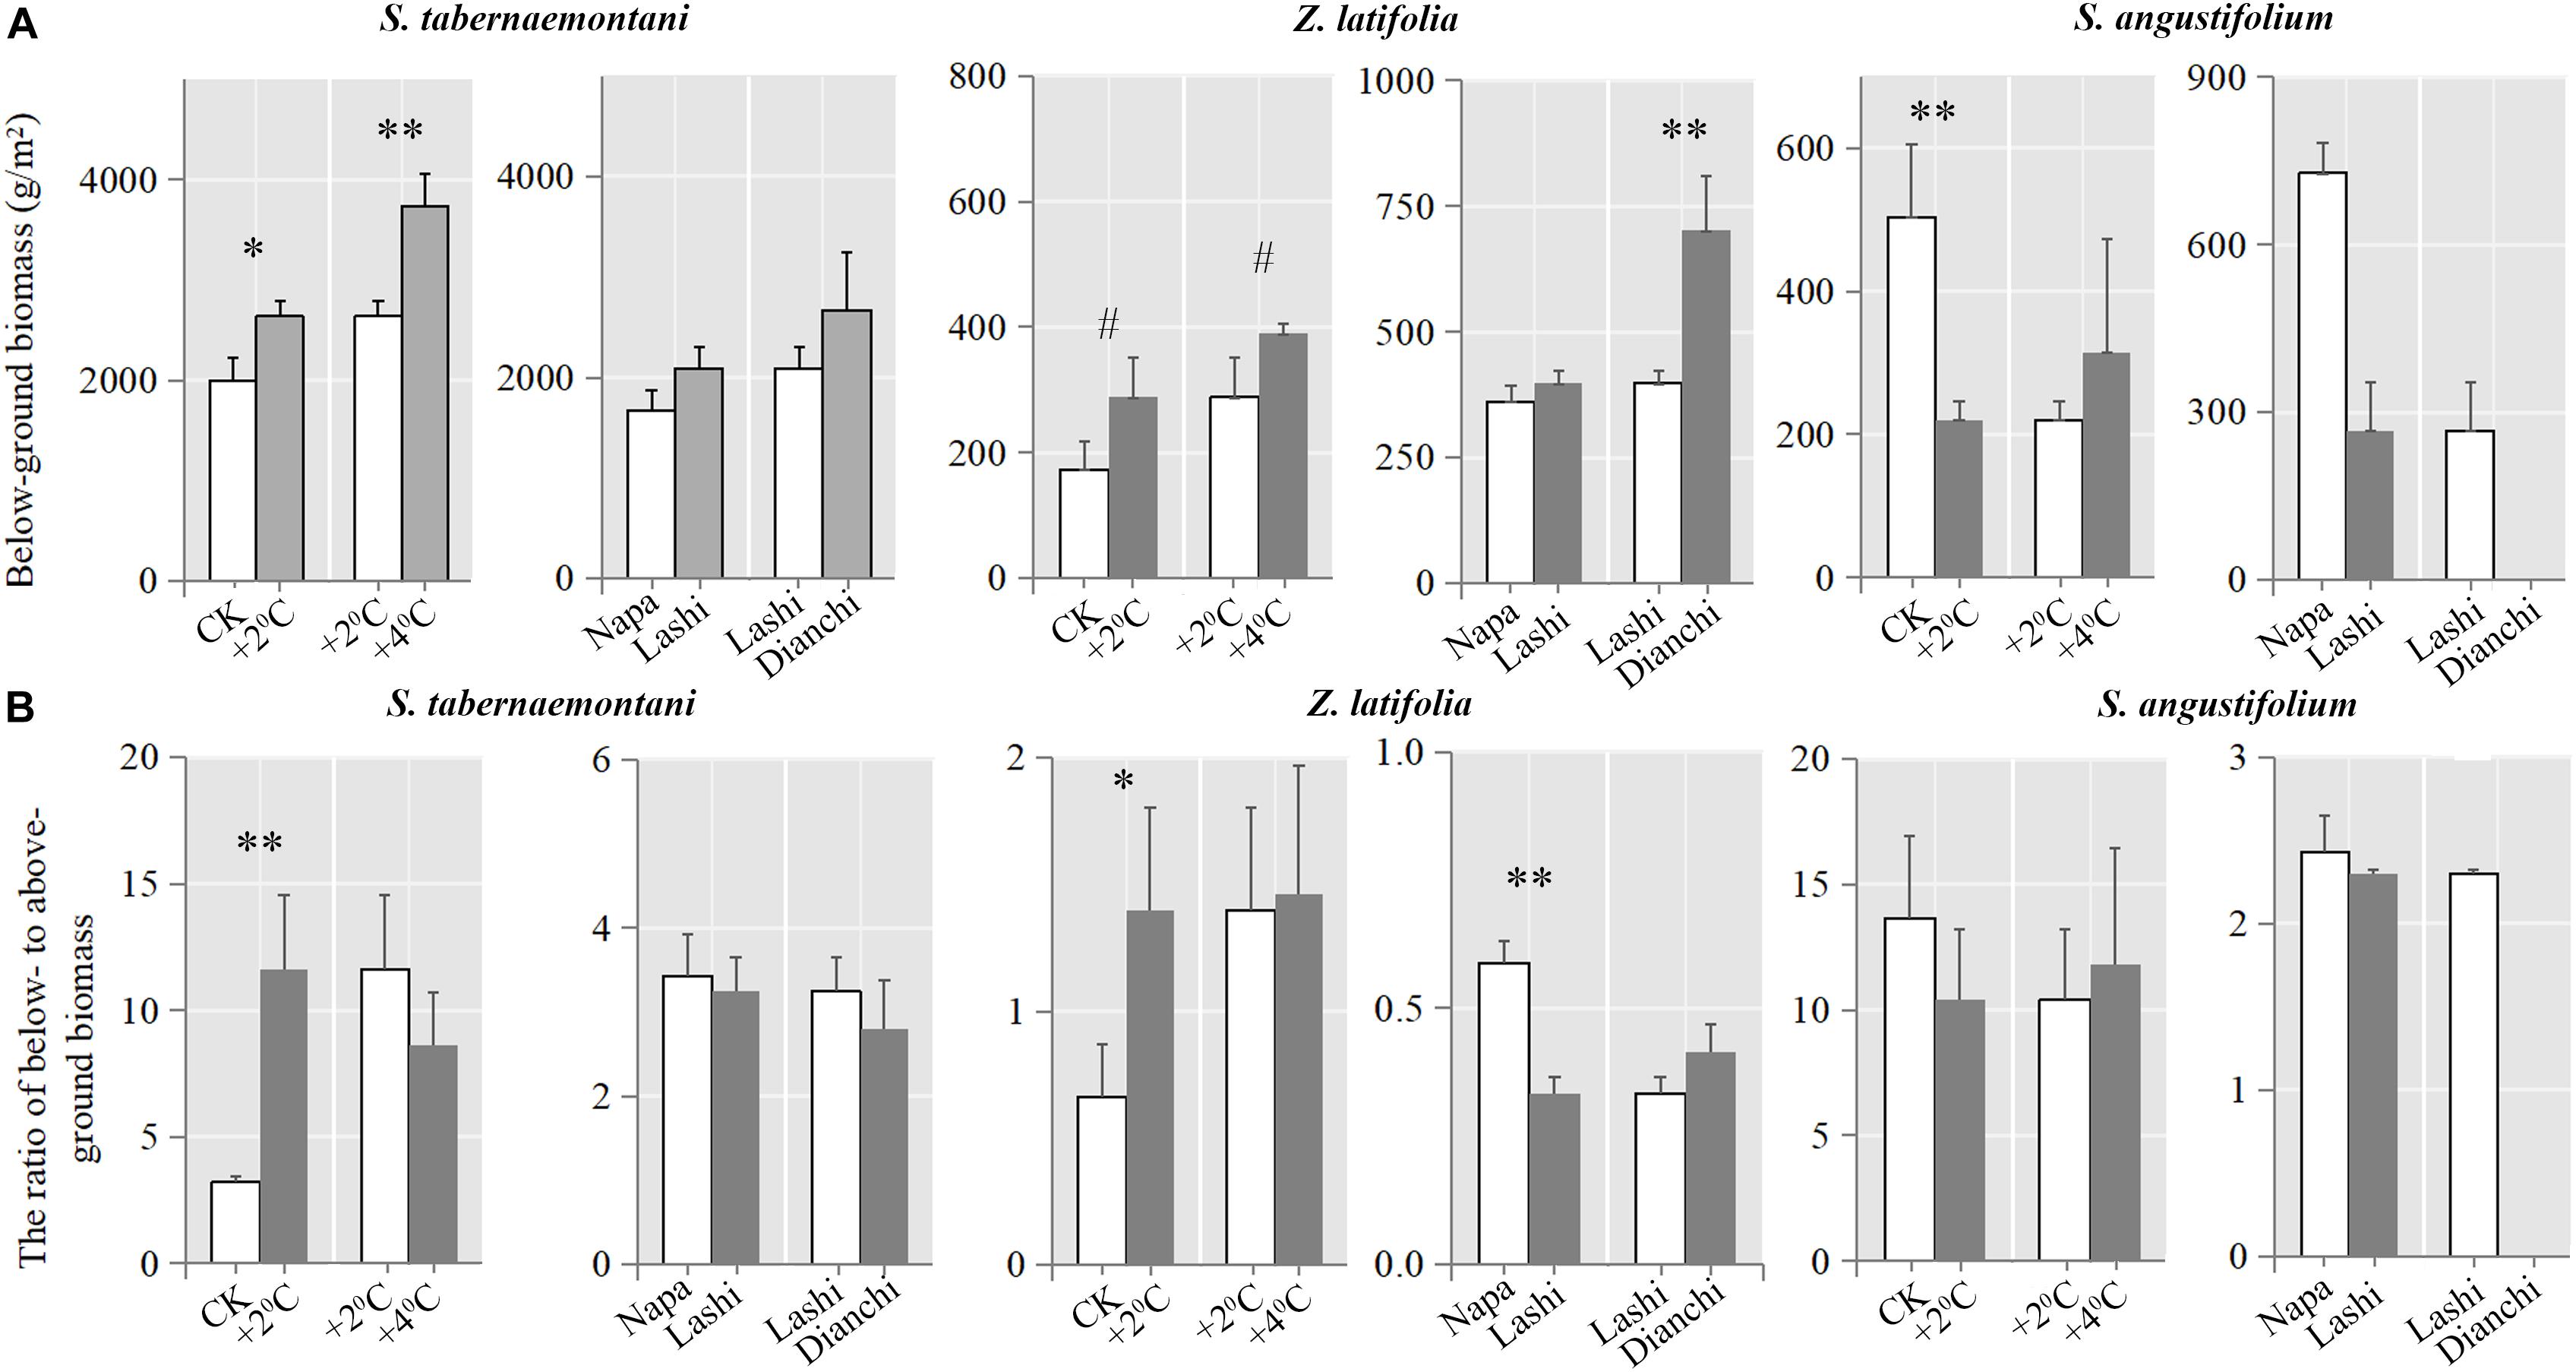
Figure 7. (A) Below-ground biomass and (B) the ratio of below- to above-ground biomass of the three species (S. tabernaemontani, Z. latifolia, and S. angustifolium) determined at the end of the warming experiments. Error bars indicate standard deviations. Significant differences between Treatments are indicated by asterisks (∗∗∗p < 0.001; ∗∗p < 0.01; ∗p < 0.05; #p < 0.1). Note that S. angustifolium disappeared in Dianchi at the end of the experiment, and comparisons between Lashi and Dianchi were not determined.
A higher ratio of below- to above-ground biomass for S. tabernaemontani and Z. latifolia was only found when comparing the +2°C scenario with CK (Figure 7). In addition, Z. latifolia growing in Lashi showed lower below-ground biomass than that growing in Napa.
Leaf Elements
At the end of experiments, leaf carbon content in S. angustifolium was lower (p < 0.05) under the +2°C scenario compared to CK, and leaf nitrogen content was lower under +2°C than CK for all species (Supplementary Table S1). We did not detect differences in either leaf carbon or nitrogen content between the +2°C and +4°C scenarios (except for a higher carbon content in Z. latifolia under +4°C), or between the three sites (except for a higher nitrogen content in S. tabernaemontani growing in Dianchi than in Lashi, Supplementary Table S1).
Discussion
Understanding the mechanisms that shape the responses of plant species to warming under semi-natural and natural conditions is central to the prediction of how rates of primary production and carbon sequestration, as well as community succession, could shift in the coming decades. Higher temperatures may impose a physiological constraint on plant growth and reproduction for species that cannot utilize higher temperatures effectively (Cui et al., 2018), or may also favor those with competitive fitness and high phenotypic plasticity (Schaum et al., 2017). Alternatively, divergent responses of species can be explained by their exposure to elevated temperature under persistent drought or wet conditions (Wertin et al., 2015). However, an attempt to understand these mechanisms should not be confounded by artifacts introduced by the use of warming devices.
Some abiotic constraints, such as soil drying, are easily to identify. Many studies have put great emphasis on warming-induced soil drying, and suggest that drops in soil moisture may reverse the observed positive impacts of warming on plants (Liu et al., 2018; Reich et al., 2018). For instance, plant stomatal conductance and net photosynthetic rates are strongly limited by soil water availability (León-Sánchez et al., 2016). In dry areas, where soil moisture was low, a +2°C increase in temperature caused dramatic reductions in plant photosynthesis and growth (Wertin et al., 2017). Nevertheless, unintended artifacts pertaining to dynamic temperature patterns as drivers of plant responses are obscure and thus tend to be ignored (Netten et al., 2008; Stef et al., 2012; Yang et al., 2018). Commonly, the standard relationships describing the effects of temperature on plant biological traits are assessed using mean temperature increments (e.g., +2°C) to characterize environmental conditions. However, there is also a risk that warming treatments could change temperature variability unexpectedly.
In this study, we first aimed to find out what temperature artifacts have been introduced by OTCs. To address this, we compared temperature patterns between different warming approaches. Our results suggest three key points. First, similar to previous reports (Marion et al., 1997; Stef et al., 2012), we found that OTC chambers altered temperature patterns greatly by invoking imbalanced maximum and minimum temperatures, asymmetrical warming between daytime and nighttime, as well as increased daily temperature fluctuations and hot extreme events. The indices introduced in our study provided a full assessment of the temperature records. Second, these artificial patterns did not exist in a natural context when we compared them under warming scenarios simulated by temperature differences along a latitudinal gradient. As previously demonstrated, latitudinal gradients may harbor a more stable temperature variability to reflect long-term evolutionary changes (De Frenne et al., 2013; Elmendorf et al., 2015; Nooten and Hughes, 2017). Third, as highlighted in this study, temperature artifacts could be alleviated to some extent by making comparisons between them when using different types of OTCs simulating different warming scenarios. Our experimental design employed two kinds of chambers, only differing in the sizes of the open window, in order to compare plant responses to manipulated warming, where mean warming effects could be separated from chamber-induced effects (such as temperature artifacts). However, it should be noted that our climate records were solely based on one climate logger per treatment or per site. Temperature recorded in a specific plot may reflect an outlier because there is the possibility that temperature extremes can differ plot by plot even under the same treatment. In future studies, temperature extremes could be more convincingly characterized and compared statistically between treatments if replicate data loggers are installed in different plots.
Plant phenotypic traits are strongly influenced by changes in temperature variability. Organisms inhabiting environments with variable temperature often have higher metabolic costs than those living in relatively stable environments (Estay et al., 2010). As a consequence, changes in individual and population-level processes may occur if the temperature variability is high enough to induce stress in the organisms. Temperature extremes, as one of the most noteworthy forms of variability, may place plants under thermal stress, which would greatly reduce the amount of resources/energy allocated to physiological maintenance, growth and reproduction (Cody, 1966; Reich et al., 2018). Based on this knowledge, we examined the responses of our study species’ photosynthetic, growth, and productivity traits to different warming treatments. Under a +2°C warming scenario, all species showed a reduction in photosynthetic rate, species height and above-ground biomass compared to CK, especially at the end of the warming experiments in 2016. Based on these, we then wanted to demonstrate empirically whether or not OTC-induced temperature artifacts are major factors causing negative responses of wetland plants to experimental warming. To answer this second question, we compared these results with other warming scenarios. In contrast to the results shown above, significant decreases in photosynthetic traits were not observed when comparing the +4°C and +2°C scenarios, and moreover, significant increases in these traits were observed when comparing Napa, Lashi, and Dianchi using transplant experiments along a natural latitudinal gradient. These direct multiple comparisons suggest that temperature artifacts may significantly distort our observations.
In one of our previous studies (Guan et al., 2018), the anatomical structure of the wetland species Hippuris vulgaris incubated in OTC chambers showed significant reductions in the size of conduits and screens for belowground plant stems under a +2°C warming scenario when compared with CK, while surprisingly, neither trait showed significant differences when comparing different types of chambers (+2°C and +4°C). The changes in vascular structure may affect the nutrient and water transmission capacity under warming; however, the fact that warming-chambers were used may raise doubts about these confusing results. In the present study, we also found a higher ratio of below- to above-ground biomass for wetland species under +2°C compared to CK, but this was not the case for other warming treatments. Plants in chambers are usually under “stress” due to imposed artifacts. It seems that warming itself may maintain the balance of above- and below-ground biomass allocation, while strong warming-induced stresses could promote plants to allocate carbon to below-ground accumulation (Liu et al., 2018).
We also noticed divergent responses to warming among the three studied species. Unlike S. tabernaemontani and Z. latifolia, when artifacts have been controlled, S. angustifolium still showed negative or non-significant responses to warming with respect to its photosynthesis, growth, and productivity attributes. In particular, a decrease in the net photosynthetic rate of S. angustifolium leaves was accompanied with reduced species height and unchanged biomass accumulation. This species even disappeared 2–3 years following transplant into Dianchi. This is of concern because if wetland species are unable to adapt to climate changes (e.g., because they are weak competitors for light), the remaining community may be more susceptible to the establishment of invasive alien plants, which can affect ecosystem services and cause further species extinctions in the long-term (Manea et al., 2016). Should the global warming trajectory follow the worse scenarios (e.g., >+4°C increment in temperature), these climatic changes would place certain species in great danger. Our observations of wetland species were consistent with previous reports from alpine grasslands (Cui et al., 2018), showing that wetland species with resource-conservative adaptations to cold climates in high-altitude regions cannot utilize higher temperatures effectively and thus face challenges and survival risks.
The dependency of realistic experimental outcomes on the quality of the manipulation suggests that warming experiments could be greatly improved by using more sophisticated designs. For instance, an improved hexagon OTC system has been reported (Godfree et al., 2011), which is capable of producing a stable daytime and nighttime warming scenario. Alternatively, active warming devices can also be used to make a more precise control on manipulated temperature (Klein et al., 2005; Netten et al., 2008). A recent study using active warming chambers, with temperatures being precisely controlled, suggests a generally positive response of leaf photosynthesis of two wetland species (S. tabernaemontani and Typha orientalis) to warming (Xu et al., 2018), and although this study was only performed over a single year of warming, it provides further evidence that temperature artifacts introduced by passive warming devices are important drivers of observed negative effects under warming.
Field transplant experiments allow us to mechanistically examine warming effect without artificial interference. The power of using latitudinal gradients as natural laboratories to infer species’ responses to temperature has been fully assessed (De Frenne et al., 2013). Our analyses of the temperature patterns along the gradient revealed a slightly greater nighttime warming than daytime warming, as well as the reduced monthly temperature range (Table 1), which were consistent with current climate warming models (e.g., preferentially enhanced night warming), implying the potential advantages of transplantation in warming experiments. However, one major concern is that this manipulation may also involve co-variations of multiple climatic drivers that existed intrinsically in natural systems along an elevation or latitudinal gradient (De Frenne et al., 2013). Although these co-variations cannot be ruled out, many studies recommend the tracking of these climatic factors over multiple years, to find out whether biological traits exhibit consistent responsive patterns to them (De Frenne et al., 2013; Nooten and Hughes, 2017; Liu et al., 2018). We examined this and showed that over a 5-year period of warming, air humidity and other climatic factors (such as rainfall, data not shown) did not vary systematically with latitude. Indeed, certain years showed an increase in air humidity and rainfall, and for others a decrease was observed. However, increments in temperature were persistent between these three sites over the course of experiments during 2012–2016, suggesting our selected sites are predominantly characterized by a distinct temperature gradient. Long-term warming experiments permit us to identify those climatic factors that show systematic variations over several years, providing insights into the dominant drivers of plant response to climate change (De Frenne et al., 2013; Liu et al., 2018). As evidence for this, our previous latitudinal observations showed that S. tabernaemontani originally growing in Dianchi (the low altitude site) had significantly longer leaves, taller stems and photosynthetic rates than those plants originally growing in Napa (the high altitude site), mostly due to temperature differences (Feng et al., 2019).
One of the limitations of this study is that we did not systematically examine the light conditions. Various aspects of light (photoperiod, light quality, and quantity) are likely to be important limiting resources for plant physiology and growth along the latitudinal gradients. The seasonality of photoperiods often increases with latitude, and the amount of solar ultraviolet radiation decreases toward lower elevations (De Frenne et al., 2013). There have also been reports showing that light quality, expressed as far-red to red ratios, may be enhanced at higher latitudes (Hay, 1990). Therefore, there may be variations in multiple light conditions among our three studied sites, and Napa is likely to have a longer photoperiod in summer and higher solar ultraviolet radiation than the Lashi and Dianchi sites. Although the plants growing at Napa were not obviously limited by light resources, their growth and photosynthesis were limited by cold temperature more than those at the other sites. The amount of light may not be a confounding factor, since it showed an opposite trend to temperature from Napa to Dianchi. However, given their biological relevance, light conditions do need to be considered in further transplant experiments. The incorporation of chamber controls (e.g., +2°C-warming scenario) into our experiments and comparison with a +4°C-warming scenario provides new perspectives in the field of passive warming experiments with regards to how rising temperatures can affect plant traits independently of chamber effects. However, warming from ambient temperature to +2°C, and from +2°C to +4°C would still be different changes for plants; therefore comparisons made between these scenarios should be treated with caution.
Conclusion
Long-standing discrepancies between small-scale chamber-based manipulations and large-scale transplant experiments have been reconciled to a great extent by considering the side effects of the chambers, with particular attention being paid to chamber-induced temperature artifacts. Asymmetrical warming between daytime and nighttime, increased daily temperature fluctuations, and hot extreme events are key temperature biases introduced by our use of OTCs. For the first time, we provided direct evidence that temperature artifacts are a main cause of the negative plant responses to artificial warming observed in wetlands. If this is true, it may be that certain biotic changes previously reported from experiments using passive warming chambers are partially due to undesirable temperature artifacts, confounding the interpretation of the data. Generally, robust outcomes obtained from one study should be further verified by other approaches, rather than weakened or conflicted by them. Here, along with alleviated temperature artifacts, the consistent plant responses to warming have been achieved for both approaches.
Data Availability Statement
The original contributions presented in the study are included in the article/Supplementary Material, further inquiries can be directed to the corresponding author/s.
Author Contributions
KT planned and designed the research. HL and JX performed experiments and conducted fieldwork. HW and HL analyzed data and wrote the manuscript. All authors contributed critically to the drafts and gave final approval for publication.
Funding
This work was supported by the National Natural Science Foundation of China (41877346), Yunnan Innovative Research Teams (2012HC007), Yunnan Fundamental Research Projects (2017FG001-018 and 2019FB036), and Yunnan Province young talents project (YNWR-QNBJ-2018-235).
Conflict of Interest
The authors declare that the research was conducted in the absence of any commercial or financial relationships that could be construed as a potential conflict of interest.
Acknowledgments
We give thanks to Guodong Liu and Xiaotang Zhang for their assistance in sampling.
Supplementary Material
The Supplementary Material for this article can be found online at: https://www.frontiersin.org/articles/10.3389/fevo.2020.524486/full#supplementary-material
Supplementary Figure 1 | Mean temperature over the whole of 2016.
Supplementary Figure 2 | Monthly based maximum and minimum temperature records over the whole of 2016.
Supplementary Figure 3 | Daytime and nighttime temperature records over the whole of 2016.
Supplementary Figure 4 | Extreme temperature records over the whole of 2016.
Supplementary Figure 5 | Air relative humidity records.
Supplementary Figure 6 | Relationship linking net photosynthetic rate (Anet) to photosynthetic traits.
Supplementary Figure 7 | Percent change for the effects of experimental warming on photosynthetic traits of Z. latifolia leaves.
Supplementary Figure 8 | Photosynthetic traits of S. angustifolium between CK and +2°C warming as well as between +2°C and +4°C warming.
Supplementary Figure 9 | Growth and productivity variables of Z. latifolia over time between treatments.
Supplementary Figure 10 | Growth and productivity variables of S. angustifolium over time between treatments.
Supplementary Table 1 | Leaf carbon and nitrogen content in three species (S. tabernaemontani, Z. latifolia, and S. angustifolium) measured at the end of warming experiments.
References
Bokhorst, S., Bjerke, J. W., Street, L. E., Callaghan, T. V., and Phoenix, G. K. (2011a). Impacts of multiple extreme winter warming events on sub-Arctic heathland: phenology, reproduction, growth, and CO2 flux responses. Global Change Biol. 17, 2817–2830. doi: 10.1111/j.1365-2486.2011.02424.x
Bokhorst, S., Convey, P., Sinclair, B. J., Lebouvier, M., Vijver, B. V. D., et al. (2011b). Microclimate impacts of passive warming methods in Antarctica: implications for climate change studies. Polar Biol. 34, 1421–1435. doi: 10.1007/s00300-011-0997-y
Cody, M. L. (1966). A general theory of clutch size. Evol. Int. J. Org. Evol. 20, 174–184. doi: 10.2307/2406571
Colesie, C., Büdel, B., Hurry, V., and Green, T. G. A. (2018). Can Antarctic lichens acclimatize to changes in temperature? Global Change Biol. 24, 1123–1135. doi: 10.1111/gcb.13984
Collins, M., Knutti, R. J., Arblaster, J., Dufresne, T., and Fichefet, P. (2013). Climate Change 2013: The Physical Science Basis. Contribution of Working Group I to the Fifth Assessment Report of the Intergovernmental Panel on Climate Change. Long-term Climate Change: Projections, Commitments and Irreversibility. Cambridge: Cambridge University Press.
Cui, H., Töpper, J. P., Yang, Y., Vandvik, V., and Wang, G. (2018). Plastic population effects and conservative leaf traits in a reciprocal transplant experiment simulating climate warming in the Himalayas. Front. Plant Sci. 9:1069. doi: 10.3389/fpls.2018.01069
De Frenne, P., Graae, B. J., Rodríguez-Sánchez, F., Kolb, A., Chabrerie, O., Decocq, G., et al. (2013). Latitudinal gradients as natural laboratories to infer species’ responses to temperature. J. Ecol. 101, 784–795. doi: 10.1111/1365-2745.12074
Elmendorf, S. C., Henry, H. R. G., Hollister, R. D., Fosaa, A. M., Gould, W. A., Hermanutz, L., et al. (2015). Experiment, monitoring, and gradient methods used to infer climate change effects on plant communities yield consistent patterns. Proc. Natl. Acad. Sci. U S A. 112, 448–452. doi: 10.1073/pnas.1410088112
Estay, S. A., Clavijo-Baquet, S., Lima, M., and Bozinovic, F. (2010). Beyond average: an experimental test of temperature variability on the population dynamics of Tribolium confusum. Population Ecol. 53, 53–58. doi: 10.1007/s10144-010-0216-7
Farquhar, G. D., von Caemmerer, S., and Berry, J. A. (1980). A biochemical model of photosynthetic CO2 assimilation in leaves of C3 species. Planta 149, 78–90. doi: 10.1007/bf00386231
Feng, C., He, Z., Tian, K., Guan, D., Liu, Z., and Mei, S. (2019). Comparative study of functional adaptability of scirpus validus under different elevations. J. Southwest Forestry University (in Chinese) 39, 172–177.
Godfree, R., Robertson, B., Bolger, T., Carnegie, M., and Young, A. (2011). An improved hexagon open-top chamber system for stable diurnal and nocturnal warming and atmospheric carbon dioxide enrichment. Global Change Biol. 17, 439–451. doi: 10.1111/j.1365-2486.2010.02276.x
Guan, D., Tian, K., Wang, Z., Zhang, Y., Feng, C., and Sun, M. (2018). Response of vascular structure of a lakeside dominant plant species Hippuris vulgaris L. to simulated warming in Napahai wetland of Northwestern Yunnan. Chinese J. Ecol. (in Chinese) 37, 65–72.
Hay, R. K. M. (1990). The influence of photoperiod on the dry-matter production of grasses and cereals. New Phytol. 116, 233–254. doi: 10.1111/j.1469-8137.1990.tb04711.x
King, A. W., Gunderson, C. A., Post, W. M., Weston, D. J., and Wullschleger, S. D. (2006). Atmosphere. plant respiration in a warmer world. Science 312, 536–537. doi: 10.1126/science.1114166
Kingsolver, J. G., Diamond, S. E., and Buckley, L. B. (2013). Heat stress and the fitness consequences of climate change for terrestrial ectotherms. Funct. Ecol. 27, 1415–1423. doi: 10.1111/1365-2435.12145
Klein, J. A., Harte, J., and Zhao, X.-Q. (2005). Dynamic and complex microclimate responses to warming and grazing manipulations. Global Change Biol. 11, 1440–1451. doi: 10.1111/j.1365-2486.2005.00994.x
León-Sánchez, L., Nicolás, E., Nortes, P. A., Maestre, F. T., and Querejeta, J. I. (2016). Photosynthesis and growth reduction with warming are driven by nonstomatal limitations in a Mediterranean semi-arid shrub. Ecol. Evol. 6, 2725–2738. doi: 10.1002/ece3.2074
Liu, H., Mi, Z., Lin, L., Wang, Y., Zhang, Z., Zhang, F., et al. (2018). Shifting plant species composition in response to climate change stabilizes grassland primary production. Proc. Natl. Acad. Sci. U S A. 115, 4051–4056. doi: 10.1073/pnas.1700299114
Manea, A., Sloane, D. R., and Leishman, M. R. (2016). Reductions in native grass biomass associated with drought facilitates the invasion of an exotic grass into a model grassland system. Oecologia 181, 175–183. doi: 10.1007/s00442-016-3553-1
Marion, G. M., Henry, G. H. R., Freckman, D. W., Johnstone, J., Jones, G., et al. (1997). Open-top design for manipulating field temperature in high latitude. Global Change Biol. 3, 20–32. doi: 10.1111/j.1365-2486.1997.gcb136.x
Martin, T. L., and Huey, R. B. (2008). Why “suboptimal” is optimal: Jensen’s inequality and ectotherm thermal preferences. Am. Nat. 171, E102–E118.
Mulder, C. P. H., Iles, D. T., and Rockwell, R. F. (2017). Increased variance in temperature and lag effects alter phenological responses to rapid warming in a subarctic plant community. Global Change Biol. 23, 801–814. doi: 10.1111/gcb.13386
Netten, J. J. C., van Nes, E. H., Scheffer, E. H., and Roijackers, M. M. R. (2008). Use of open-top chambers to study the effect of climate change in aquatic ecosystems. Limnol. Oceanography Methods 6, 223–229. doi: 10.4319/lom.2008.6.223
Nooten, S. S., and Hughes, L. (2017). The power of the transplant: direct assessment of climate change impacts. Climat. Change 144, 237–255. doi: 10.1007/s10584-017-2037-6
Peng, S., Piao, S., Ciais, P., Myneni, R. B., Chen, A., Chevallier, F., et al. (2013). Asymmetric effects of daytime and night-time warming on Northern Hemisphere vegetation. Nature 501, 88–92. doi: 10.1038/nature12434
Reeves, M. C., Moreno, A. L., Bagne, K. E., and Running, S. W. (2014). Estimating climate change effects on net primary production of rangelands in the United States. Climat. Change 126, 429–442. doi: 10.1007/s10584-014-1235-8
Reich, P. B., Sendall, K. M., Stefanski, A., Rich, R. L., Hobbie, S. E., and Montgomery, R. A. (2018). Effects of climate warming on photosynthesis in boreal tree species depend on soil moisture. Nature 562, 263–267. doi: 10.1038/s41586-018-0582-4
Sáez, P. L., Cavieres, L. A., Galmés, J., Gil-Pelegrín, E., Peguero-Pina, J. J., Sancho-Knapik, D., et al. (2018). In situ warming in the Antarctic: effects on growth and photosynthesis in Antarctic vascular plants. New Phytol. 218, 1406–1418. doi: 10.1111/nph.15124
Schaum, C. E., Barton, S., Bestion, E., Buckling, A., Garcia-Carreras, B., Lopez, P., et al. (2017). Adaptation of phytoplankton to a decade of experimental warming linked to increased photosynthesis. Nat. Ecol. Evol. 1:94.
Stef, B., Ad, H., Rien, A., Peter, C., Cooper, E. J., Linda, D., et al. (2012). Variable temperature effects of Open Top Chambers at polar and alpine sites explained by irradiance and snow depth. Global Change Biol. 19, 64–74. doi: 10.1111/gcb.12028
Wertin, T. M., Belnap, J., and Reed, S. C. (2017). Experimental warming in a dryland community reduced plant photosynthesis and soil CO2 efflux although the relationship between the fluxes remained unchanged. Funct. Ecol. 31, 297–305. doi: 10.1111/1365-2435.12708
Wertin, T. M., Reed, S. C., and Belnap, J. (2015). C 3 and C 4 plant responses to increased temperatures and altered monsoonal precipitation in a cool desert on the Colorado Plateau. USA. Oecol. 177, 997–1013. doi: 10.1007/s00442-015-3235-4
Wolkovich, E. M., Cook, B. I., Allen, J. M., Crimmins, T. M., Betancourt, J. L., Travers, S. E., et al. (2012). Warming experiments underpredict plant phenological responses to climate change. Nature 485, 494–497. doi: 10.1038/nature11014
Xu, J. P., Sun, M., Wang, H., Zhang, Y., Zhang, X. T., and Tian, K. (2018). Photosynthetic response of Scirpus validus and Typha orientalis to elevated temperatures in Dianchi Lake, Southwestern China. J. Mountain Sci. 15, 2666–2675. doi: 10.1007/s11629-018-4853-1
Keywords: biological response, experimental warming, open top chamber, transplant, temperature extreme
Citation: Wang H, Li H, Xu J and Tian K (2020) Negative Responses of Wetland Plant Species to Warming Linked to Temperature Artifacts. Front. Ecol. Evol. 8:524486. doi: 10.3389/fevo.2020.524486
Received: 17 April 2020; Accepted: 05 October 2020;
Published: 23 October 2020.
Edited by:
Marco A. Molina-Montenegro, University of Talca, ChileReviewed by:
Aud Helen Halbritter, University of Bergen, NorwayIan Sajid Acuña Rodriguez, Ecotropics Foundation, United States
Copyright © 2020 Wang, Li, Xu and Tian. This is an open-access article distributed under the terms of the Creative Commons Attribution License (CC BY). The use, distribution or reproduction in other forums is permitted, provided the original author(s) and the copyright owner(s) are credited and that the original publication in this journal is cited, in accordance with accepted academic practice. No use, distribution or reproduction is permitted which does not comply with these terms.
*Correspondence: Hang Wang, aHdhbmcxN0AxNjMuY29t; Kun Tian, dGxrdW5wQDEyNi5jb20= orcid.org/0000-0003-0881-0553