- 1Department of Evolution, Ecology and Organismal Biology, The Ohio State University, Columbus, OH, United States
- 2Translational Data Analytics Institute, The Ohio State University, Columbus, OH, United States
Pelage luminance has been found in many mammalian systems to follow patterns predicted by Gloger’s rule where darker colored animals are associated with environments that are warmer and more moist. Sciurids have one of the greatest diversities of color patterns and hues among mammalian families. We have used comparative methods to investigate whether the luminance of dorsal pelage in 137 species across Sciuridae conforms to prediction of Gloger’s rule and other background matching expectations. We found using phylogenetic multiple regression, as well as univariate regression, that Sciurids generally conform to the expectations of Gloger’s rule. Darker species are associated with environments with higher primary productivity, higher temperature, higher humidity, and lower solar radiation. Moreover, in support of the predictions of background matching, darker squirrel species were associated with environments with greater soil carbon content and higher fire frequency. Our macroevolutionary study sheds some light on selective pressures that are driving the evolution of coloration in Sciurids, but more comparative research is needed to fully understand other selective pressures that have led to the wide diversity of color patterns and hues.
Introduction
Gloger’s rule is an ecogeographic rule describing the tendency of animals living in warm and wet environments to be darker (Gloger, 1833; Rensch, 1929). This rule has been supported by several quantitative tests from a wide variety of taxa including birds, mammals, reptiles, amphibians, and insects (Delhey, 2019; Delhey et al., 2019; Stanchak and Santana, 2019). There are multiple mechanisms that have been proposed to explain the color patterns that conform to Gloger’s rule (Delhey, 2019) with the most common being that darker coloration is selected for in environments with lower light conditions to facilitate greater concealment from predators. Dark environments are often created by greater vegetative production, which is generally driven by higher temperatures and environmental moisture. Moreover, a high number of studies have found support for the UV protection hypothesis (Chaplin, 2004) by finding latitude, a strong correlate of solar radiation, to be significantly associated with pelage luminance (e.g., Stoner et al., 2003a, b, Caro, 2005; Santana et al., 2012). Thus, biologists that study Gloger’s rule often investigate how well multiple environmental variables (i.e., temperature, environmental moisture, primary productivity, solar radiation, and their surrogates) predict the brightness of animal color. Another possible mechanism is selection for pelage color to match that of the background substrate (Nachman et al., 2003; Vignieri et al., 2010), the color of which may be predicted by the variables mentioned above.
The rodent family Sciuridae is a fascinating group to study color-pattern evolution because, unlike most other rodent families, squirrels have evolved extremely diverse pelages that include many types of patterns (e.g., stripes, spots, and patches) and hues (e.g., red, brown, tan, and black), and a range of luminances from black to very light (Figure 1) (Thorington et al., 2012). This phenotypic diversity is likely related to the evolution of squirrels in many different terrestrial biomes worldwide (e.g., desert, tundra, and rainforest), as well as their evolution of a diverse range of lifestyles (terrestrial, arboreal, and fossorial), life histories (diurnal, nocturnal, social, and solitary), and body sizes (16 g up to 1200 g) (Thorington et al., 2012). For example, many species of desert squirrels have pale-colored fur that is likely related to living in habitats with lightly colored soils that contain minimal amounts of dark organic content.
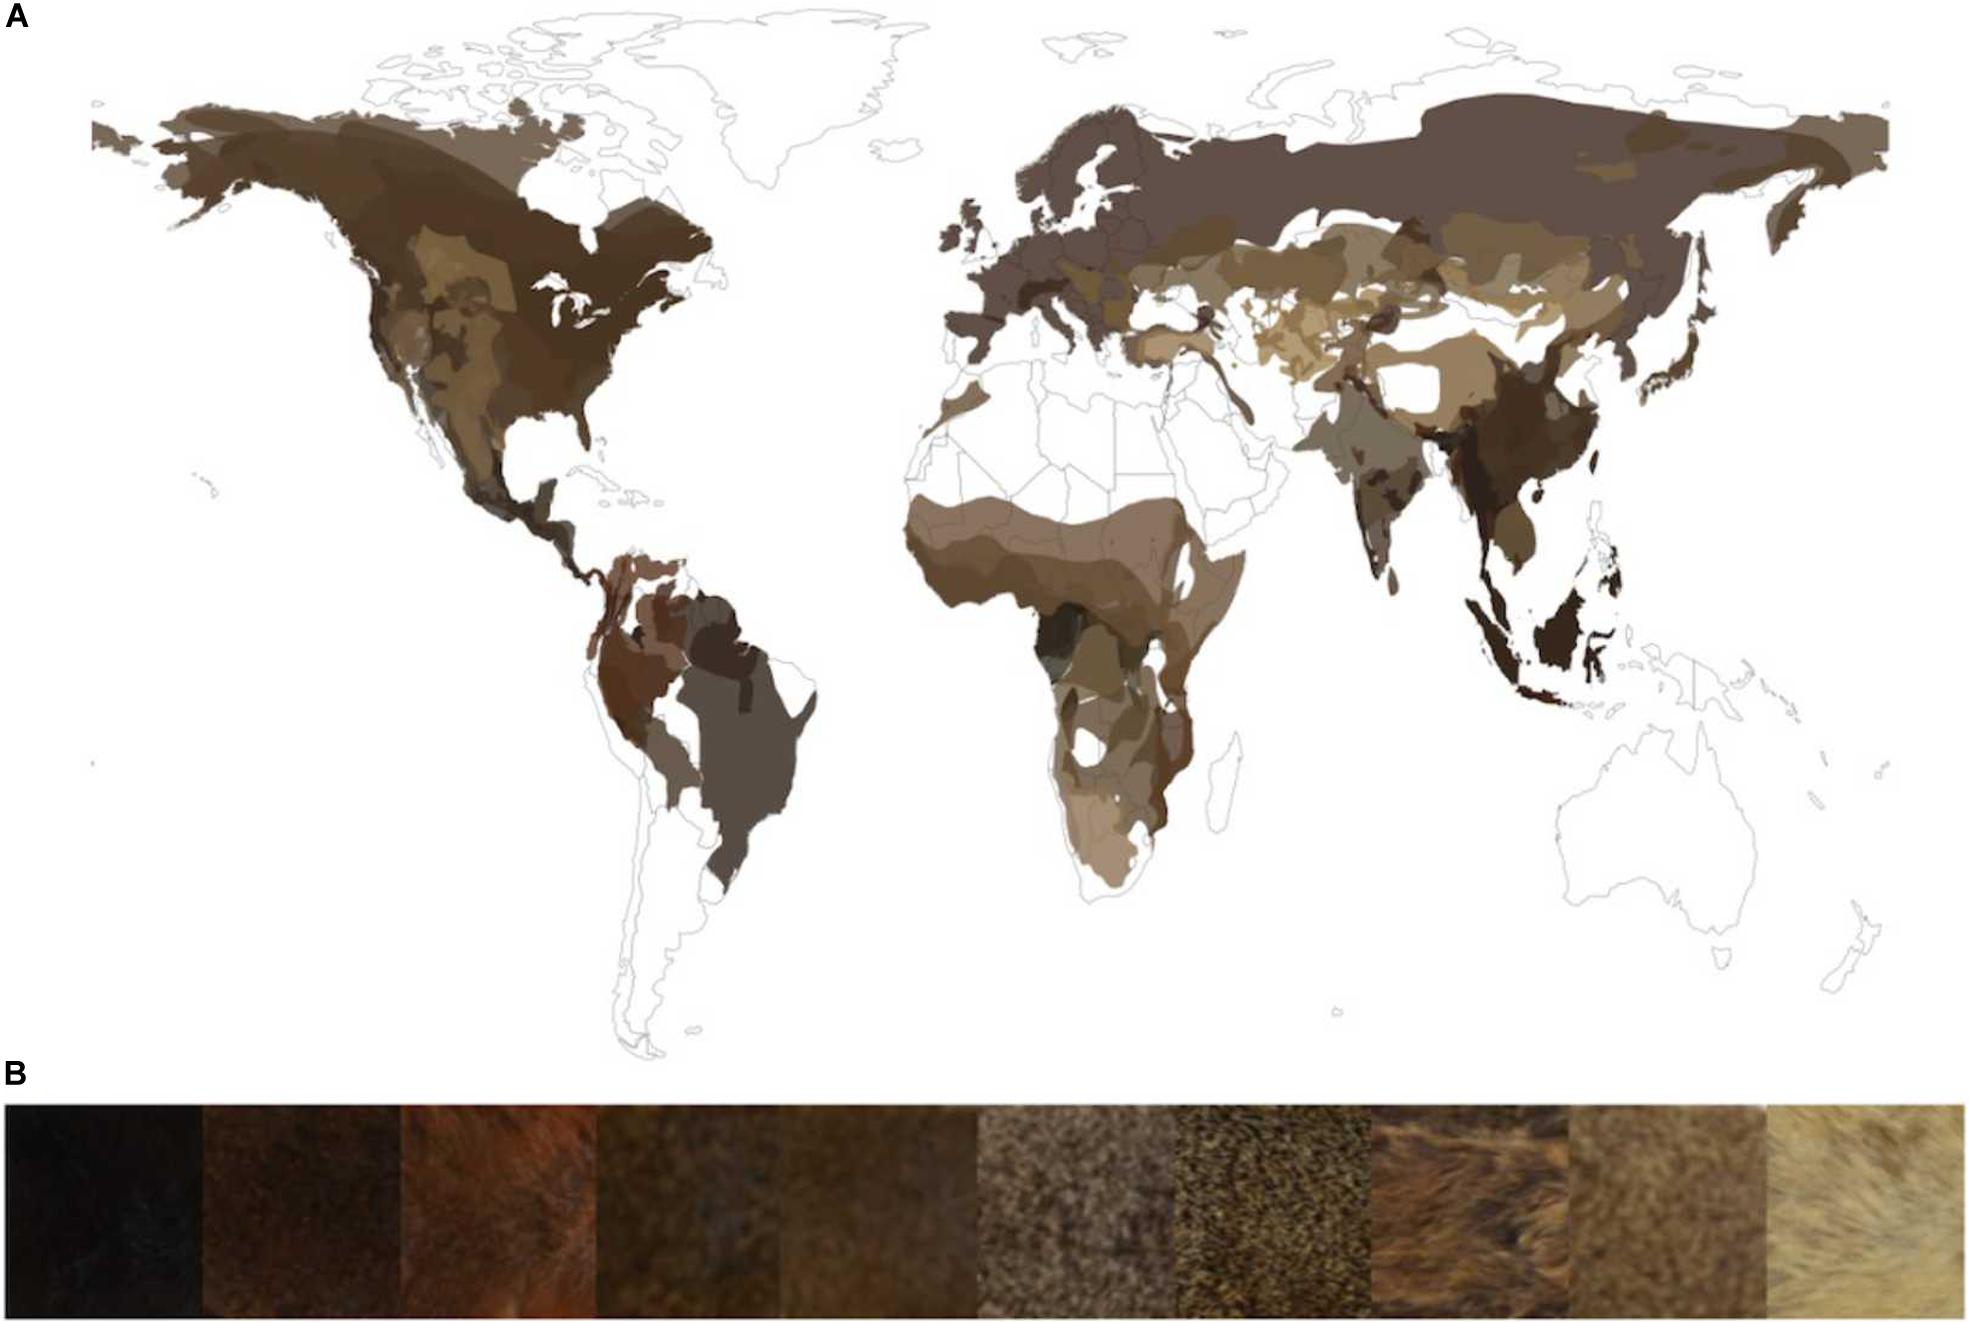
Figure 1. (A) Average dorsal color of all species for which we have photo and distribution data superimposed onto that species range map. (B) Dorsal regions of select squirrel species showing the distribution of pelage luminance across the Sciurid family. The representative species from left to right are as follows: Callosciurus finlaysonii, Sciurus aestuans, Sciurus vulgaris, Sundasciurus samarensis, Callosciurus nigrovittatus, Sciurus yucatanensis, Notocitellus adocetus, Petaurillus kinlochii, Urocitellus townsendii, Callosciurus finlaysonii.
Patterns of Gloger’s rule have been investigated in many mammal groups, but a large majority of these studies have been focused at the intraspecific level (Delhey, 2019). Studies of Gloger’s rule in squirrels are limited, but are also focused on intraspecific variation. A study in fox squirrels (Sciurus niger) with melanistic polymorphisms has identified elevation and humidity as positively correlated with pelage luminance, but also showed that precipitation and temperature were negatively correlated with pelage luminance (Kiltie, 1989). They also found fire frequency was positively correlated with darker pelage. A similar study of the African giant squirrel (Protoxerus stangeri) found a negative relationship between pelage luminance and mean annual precipitation and a positive correlation between pelage luminance and mean annual temperature.
Studies of Gloger’s rule in primates offer potentially intriguing insight to selective pressures that may drive color evolution in Sciurids because both mammalian groups have a wide diversity in color patterns and are similar in many other characteristics, such as possessing a mostly diurnal behavior, a range of both terrestrial and arboreal lifestyles, and a global distribution. A comparative study of Gloger’s rule in primates showed that pelage luminance was negatively correlated with actual evapo-transpiration (AET), which is a measure of the amount of water leaving an environment (Kamilar and Bradley, 2011). As AET is a composite measure of many environmental processes, this result implied a negative correlation between pelage luminance and precipitation, temperature, humidity, and primary productivity.
In this study, we used a comparative phylogenetic approach to investigate environmental predictors of dorsal-pelage luminance in Sciurids. We hypothesized that, in accordance with many other animal systems that conform to predictions by Gloger’s rule, pelage luminance will be significantly associated with variables related to environmental moisture, temperature, and light conditions. We also hypothesized that pelage luminance will be significantly associated with other environmental variables that are more directly associated with background matching (soil carbon content, soil density, and frequency of wildfires).
Materials and Methods
Phylogenetic Inference
To conduct phylogenetic comparative analyses, we constructed a phylogeny of 137 Sciuridae species across 51 genera. We downloaded all gene sequences from GenBank representing seven mitochondrial loci (12S, 16S, Cyt-b, COI, COII, COIII, mitochondrial control region) and four nuclear loci (C-myc, GHR, IRBP, RAG1). We then aligned all sequences using MUSCLE (Edgar, 2004) implemented in the EMBL web app (Madeira et al., 2019) and then manually edited egregious alignments. We then used Partition Finder (Lanfear et al., 2012) to find the best substitution model based on the Akaike Information Criterion. Finally, we inferred a phylogeny using Bayesian inference in MrBayes (Huelsenbeck and Ronquist, 2001) using Markov Chain Monte Carlo (MCMC) sampling. Two different runs (each with one cold and three heated chains) were analyzed for 3 × 10⁷ generations (with trees sampled every 100 generations). Branch lengths were than calibrated according to the dates used by Zelditch et al. (2015).
Luminance Data From Museum Study Skins
To obtain color measurements of the 137 squirrels used in our phylogenetic analysis, we photographed the dorsal profile of museum study skins from the Division of Mammals at the Smithsonian National Museum of Natural History. We used a Sony Alpha 5000 to take digital photographs of specimens against a gray matte background. Two light-boxes containing ESDDI 85 W 5500K Day Light Florescent bulbs were positioned at opposing ends of the specimen stage in an interior, windowless room. All images were processed the MacOS image editing software Paintbrush 2.1 to exclude any region of the image depicting the specimen stage. We then processed masked images through a custom python script that converted the image data to CIE LAB colorspace. Average luminance was then calculated from all unmasked pixels of the image, thus capturing information from the entire dorsal region of the study skin. Higher luminance values indicate lighter pelage color.
Environmental Data
Our study largely used environmental variables that have been shown to be important predictors in Gloger’s rule in other animal systems where studies have typically shown that animals are darker where environmental conditions are warmer, wetter, and darker (Delhey, 2019). The variables directly related to Gloger’s rule that were used in our study can be grouped into three categories: (1) temperature (mean annual temperature), (2) environmental moisture (mean annual precipitation and humidity), and (3) light conditions (insolation, canopy closure, and net primary productivity). Given that more direct background matching with surrounding substrates can also be an important selective pressure on pelage color in rodents (Caro, 2005; Vignieri et al., 2010), we also included a fourth category of variables associated with the background environment (soil carbon content, soil density, and fire frequency). Soil density was included because sandy soils, which are generally lightly colored, have higher bulk densities than fine silts and clays because they have larger, but fewer, pore spaces (Ayres et al., 1973). Soil carbon content was included because soils with higher carbon content have higher rates of decomposition and thereby produce darker substrates (Schulze et al., 1993). Fire frequency was included because higher frequency of fires was shown in fox squirrels (Kiltie, 1989) to be an important predictor of darker pelage.
The environmental data for the nine predictor variables (mean annual temperature, mean annual precipitation, humidity, insolation, canopy closure, net primary productivity, soil density, soil carbon, and fire frequency) for all 137 squirrel species were acquired from multiple databases. Both mean annual precipitation and mean annual temperature values were acquired across each species range from the PanTHERIA database, which provides point estimates at species level resolution for a range of environmental and life history characteristics of mammals (Jones et al., 2009) (PanTHERIA metadata available at http://esapubs.org/archive/ecol/E090/184/metadata.htm). Canopy closure raster data, which serves as a proxy measure for environmental light conditions, were acquired from high-resolution global maps of forest cover (Hansen et al., 2013). This dataset provides world-wide canopy closure data at 1 m by 1 m resolution. Due to memory constraints we reduced this dataset to a 5 m by 5 m resolution using the “aggregate” function in the raster package in R (R Core Team, 2013; Hijmans and van Etten, 2014). Both soil carbon content and soil density raster data at a 5-km resolution was acquired from the ISRIC Soil Grids web app (Batjes et al., 2019). Humidity (column water vapor amount), net primary productivity, fire frequency, and solar radiation were obtained from the NASA MODIS satellite hosted on NASA Earth Observations1. These data represent time averaged values for each month for approximately the past 20 years. We downloaded these data at an 11 km by 11 km resolution and averaged the monthly values into a single raster file. All raster data was clipped with extant range maps of all 137 species downloaded from the IUCN (2019) using the raster and rgdal packages in R (R Core Team, 2013; Hijmans and van Etten, 2014; Bivand et al., 2019) to obtain species level averages.
Model Selection
Following the recommendations of Cooper et al. (2016), we used an MCMC based approach to fit both a Brownian motion and Ornstein Uhlenbeck model of evolution to our data. This was implemented by the “fitContinuousMCMC” function in the R package geiger (Pennell et al., 2014). This was run for 1 × 10⁶ generations with posterior likelihood values sampled every 100 generations.
Phylogenetic Generalized Least Squares
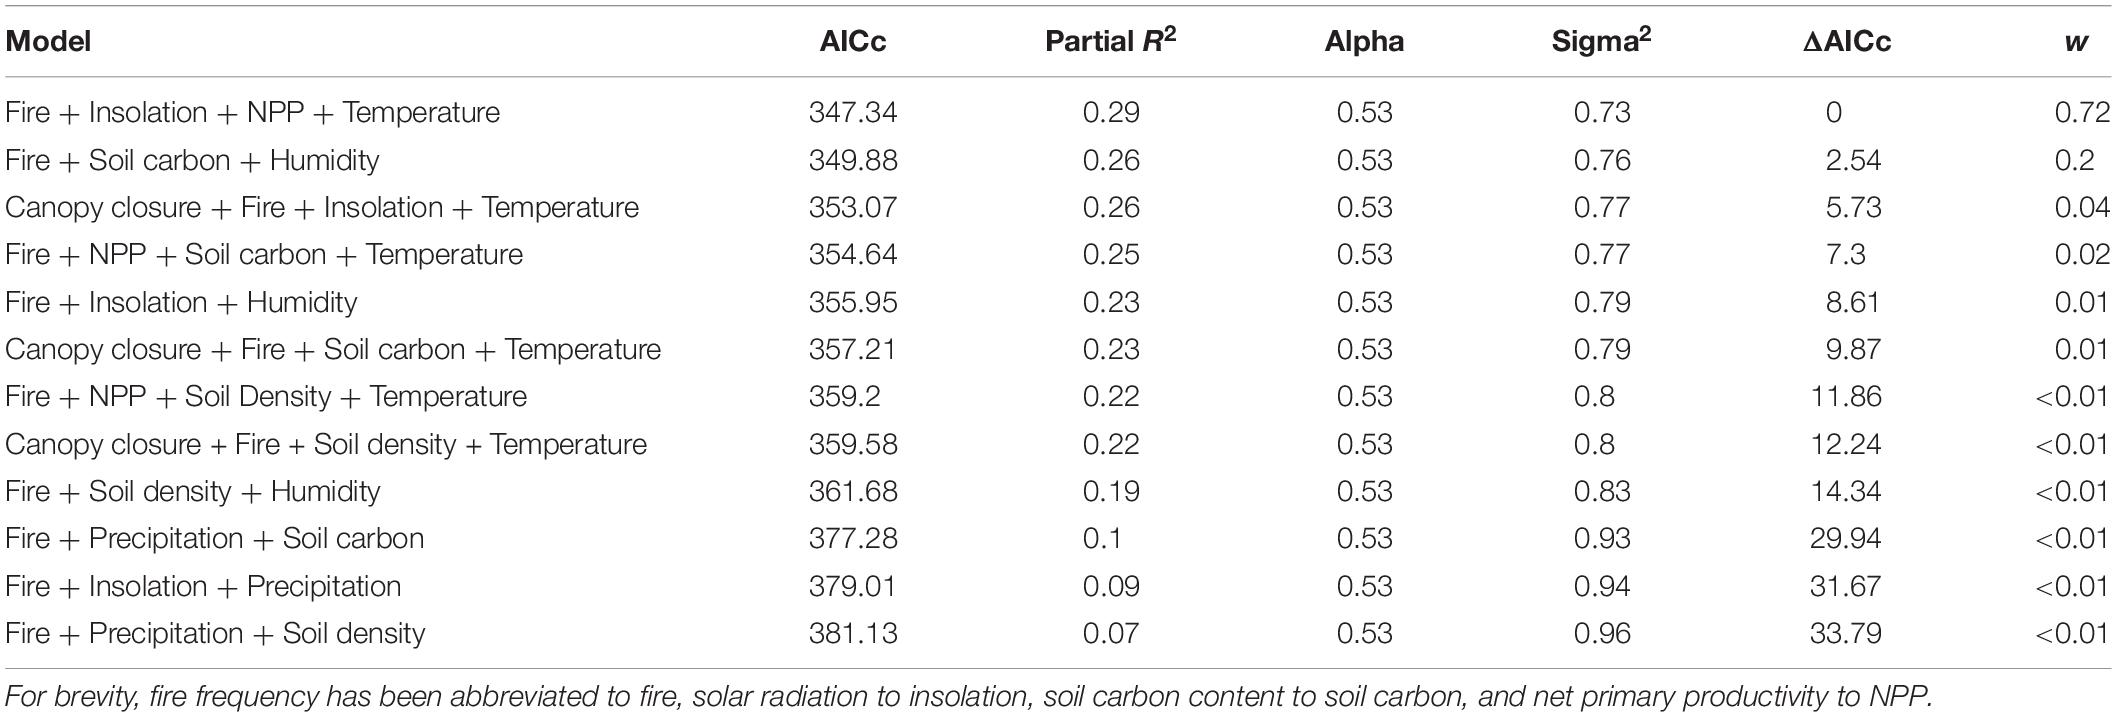
All data for our phylogenetic generalized least square (PGLS; Martins and Hansen, 1997) analyses were centered by subtracting the mean and scaled by dividing by the standard deviation. We then ran pairwise phylogenetic regressions using phylolm with the model specified as “OUfixedRoot” between each environmental variable and the phenotype with 1000 bootstrap replicates. Next, we ran 36 pairwise phylogenetic regressions using the same approach between each of the nine environmental variable and each of the eight other environmental variable to assess multicollinearity among the data. Variables were considered collinear if their correlation coefficient was greater than 0.7. Finally, we constructed 12 regression models representing all possible combinations of non-collinear variables (Table 1). As above, this was implemented with the function “phylolm” from the R package phylolm (Ho and Ane, 2014). Model weights were then calculated according to Symonds and Moussalli (2011). Partial R2 values were calculated using “R2.resid” function of the R package rr2 (Ives and Li, 2018).
Results
Phylogenetic Tree
Partition Finder selected the GTR + I + G substitution model for nearly all partitions, expecting the wobble positions of GHR and CMYC being better modeled by K80 + G and HKY + G, respectively. Our Bayesian phylogenetic inference of Sciuridae revealed 57 nodes with significant (>0.95) posterior probabilities (Figure 2).
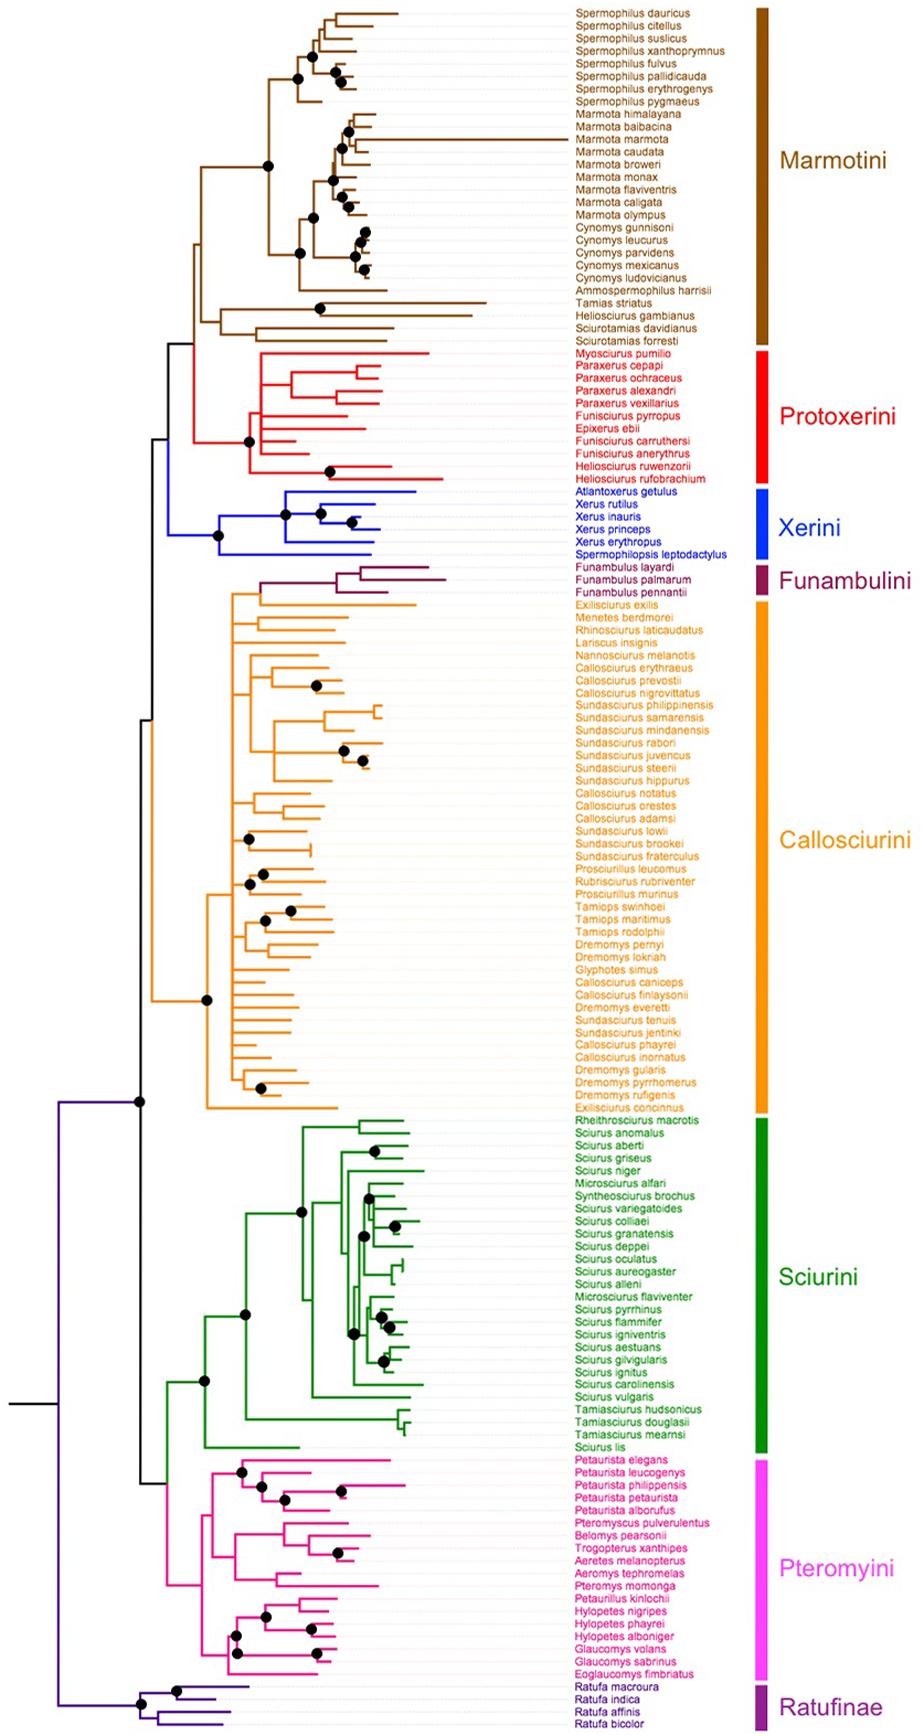
Figure 2. Phylogeny representing 137 species within Sciuridae. Branch lengths are proportional to the expected number of changes per site. Dark circles represent nodes with >95% posterior probability.
Model Selection for Comparative Phylogenetic Analysis
Both runs of the MCMC converged as evidenced by the stationarity of the trace plots. The Ornstein Uhlenbeck model (Log likelihood −883) had a consistently higher likelihood than Brownian motion (Log likelihood −918) after burn-in and was therefore used for all comparative analyses.
Phylogenetic Generalized Least Squares
The univariate regression analysis revealed that seven out of nine environmental variables exhibit a significant correlation with the phenotype (Table 2 and Figure 3). Pelage luminance is negatively correlated with soil carbon content, humidity, primary productivity, canopy closure, temperature, and precipitation. Soil density is the only variable to have a significantly positive correlation with pelage luminance. Solar radiation and fire frequency exhibit no significant correlation with pelage luminance.
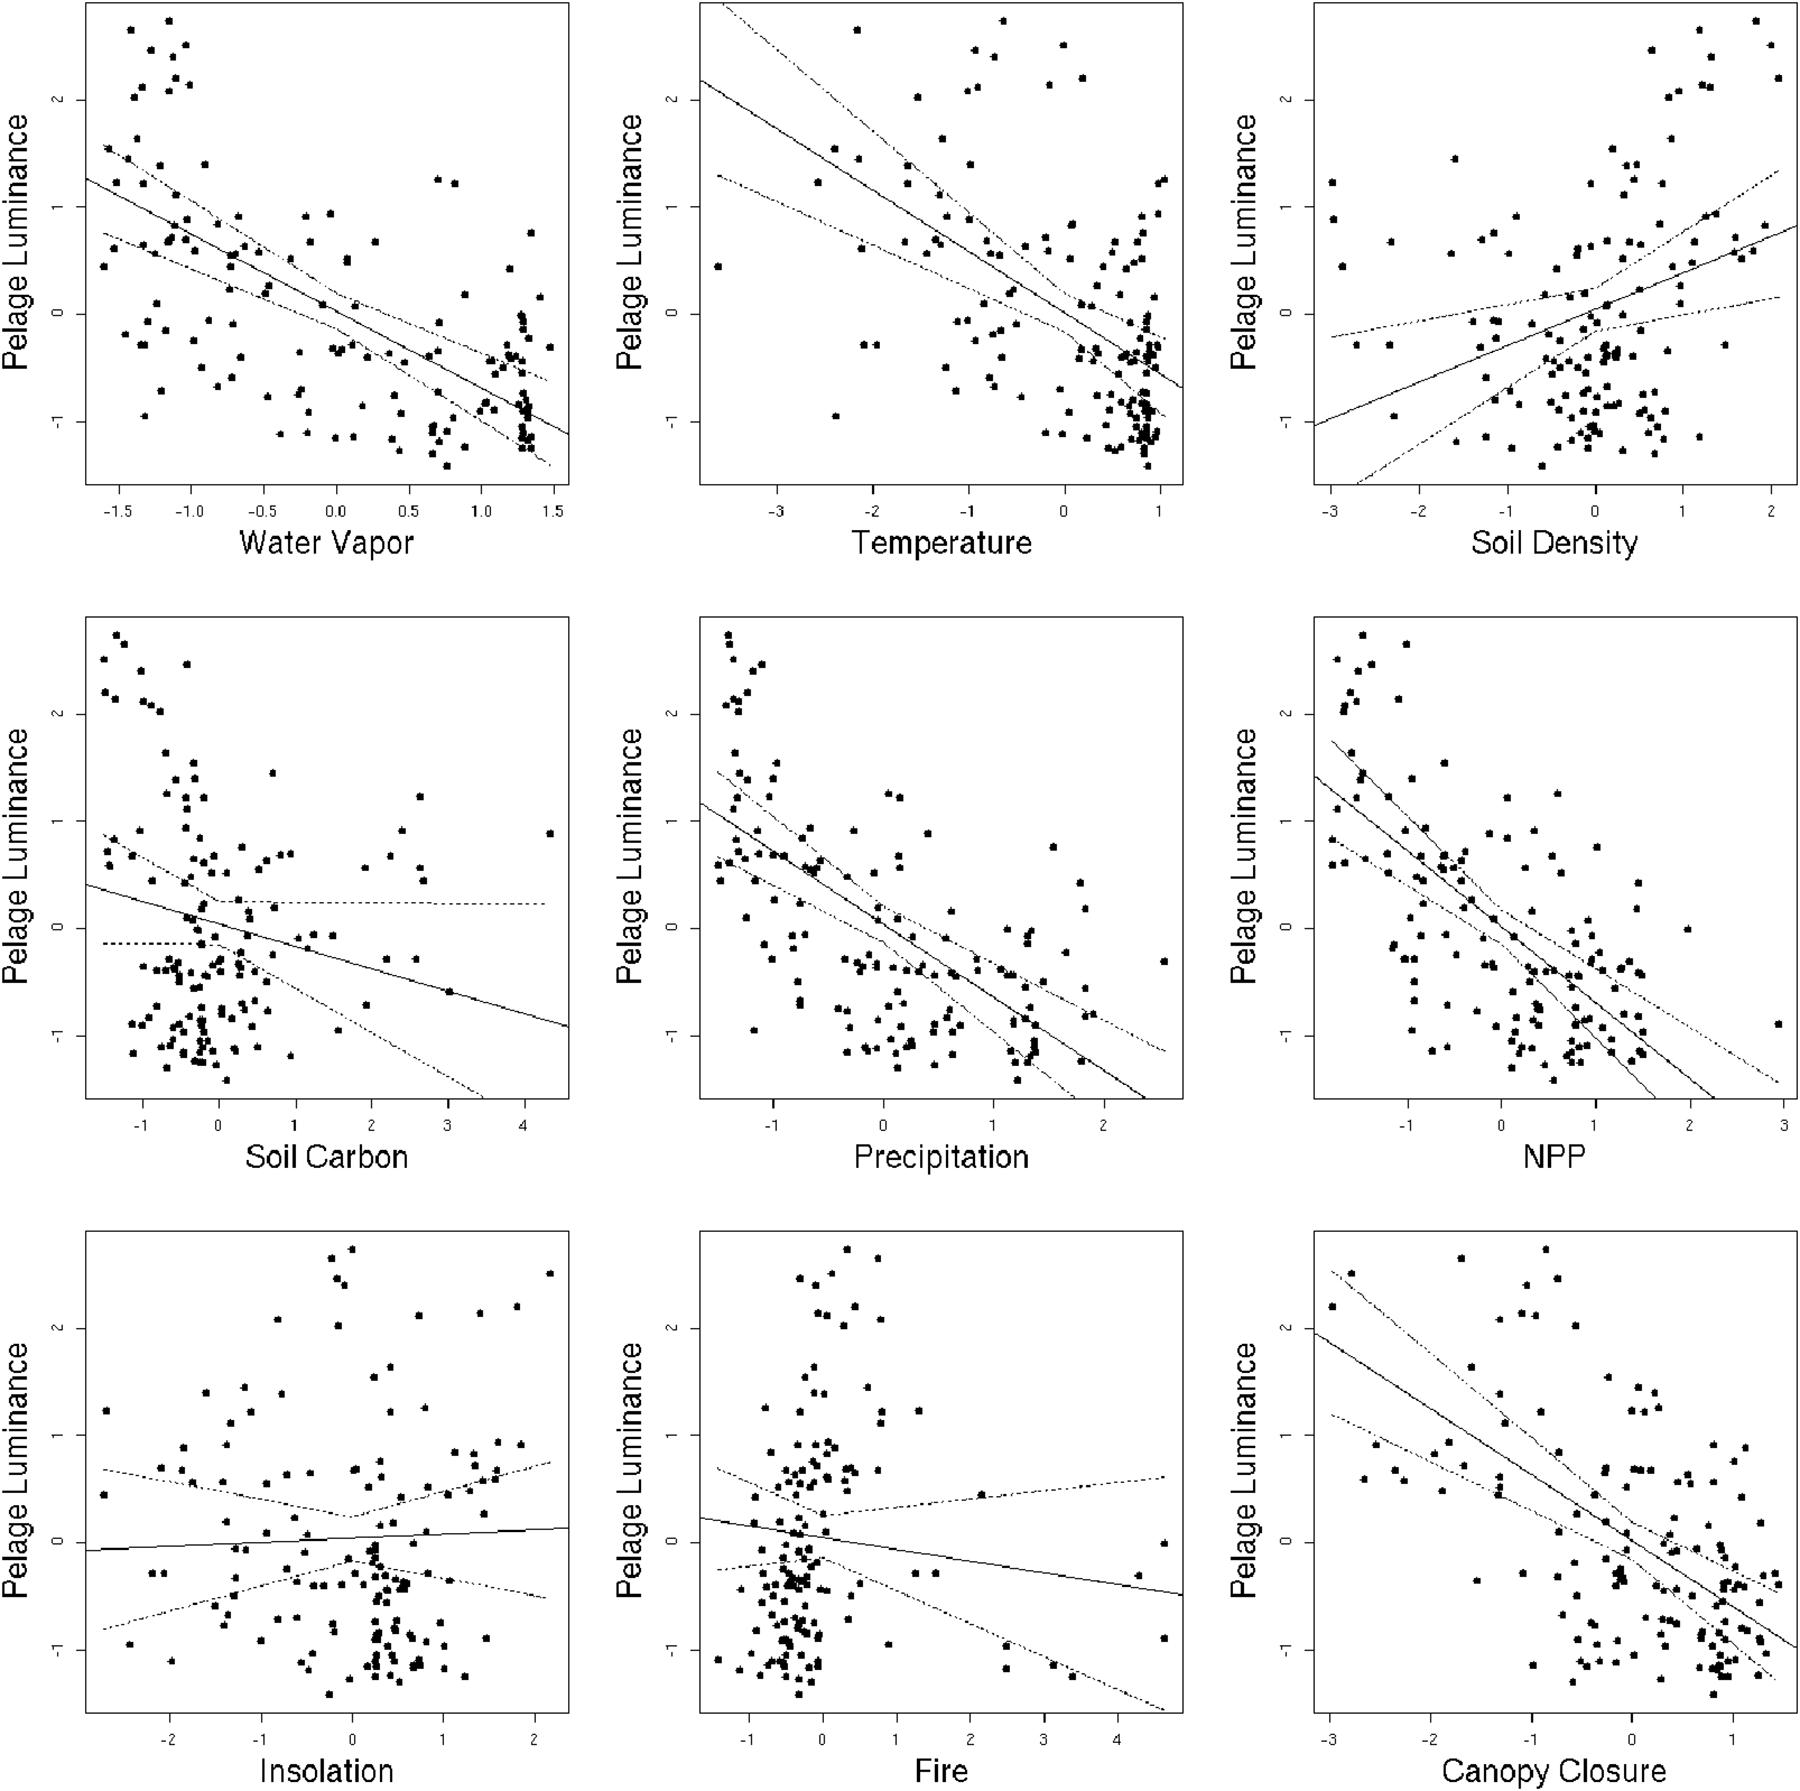
Figure 3. Plots showing the relationship between pelage luminance and each of the nine environmental variables included in this analysis. The solid line represents the line of best fit, while the dashed lines represent 95% confidence intervals from 1000 bootstrap replicates.
The regressions among environmental variables revealed that soil density is collinear with soil carbon content and insolation. Soil carbon content is also collinear with insolation. Water vapor is collinear with primary productivity, canopy closure, temperature and precipitation. Primary productivity is collinear with canopy closure and precipitation. Canopy closure is also collinear with precipitation.
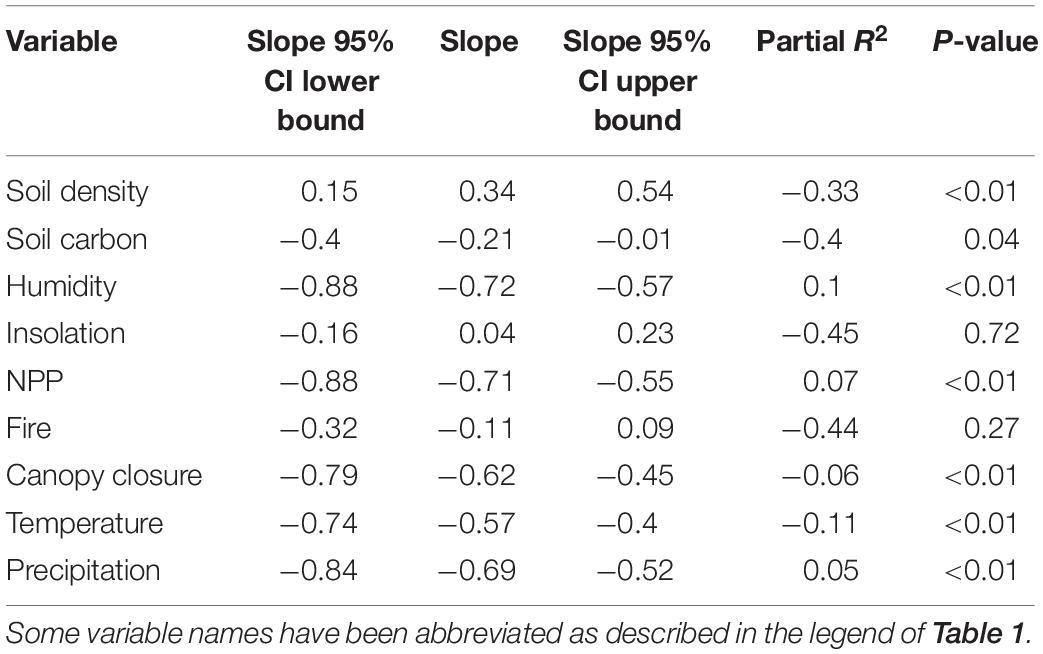
The top three multiple regression models form the credible set, the set whose cumulative model weight exceeds 0.95 (Symonds and Moussalli, 2011) and we reject the remaining models. Model one finds significant negative effects between pelage luminance and fire frequency, primary productivity, and mean annual temperature as well as a significant positive correlation between the phenotype and solar radiation. Model three differs from model one only in the replacement of primary productivity with canopy closure, where the correlation is likewise significantly negative. Model two includes significant negative correlations between pelage luminance and soil carbon content and humidity, while the correlation with fire frequency is non-significant (Table 3). It is worth noting that mean annual precipitation, commonly found to be a significant correlate of pelage luminance, does not appear in the credible set.
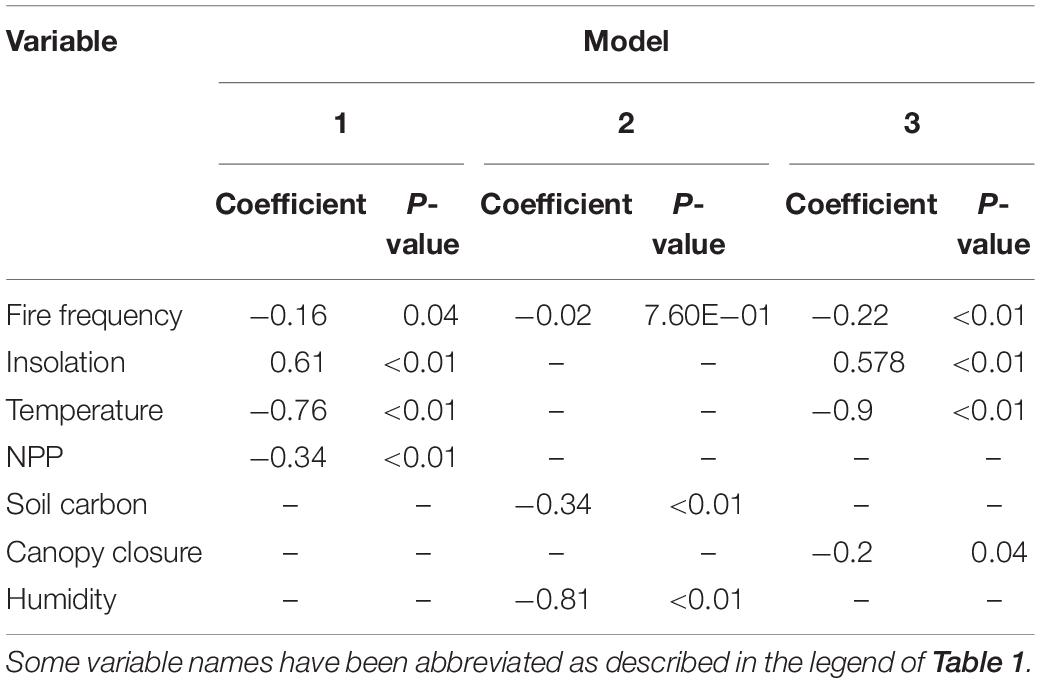
Table 3. Coefficients of top three models from Table 1.
Discussion
Our comparative study of dorsal pelage luminance across Sciuridae based on multiple regression found support for the predictions of Gloger’s rule and other background matching expectations. The dorsal pelage of squirrel species become darker in environments with greater mean annual temperature, greater environmental moisture (humidity), lower light conditions (lower levels of solar radiation, greater primary productivity, and greater canopy closure), and darker background environments (greater soil carbon content and greater fire frequency). Our univariate regression analyses further supported these relationships. These findings are consistent with most predictions of Gloger’s rule that have been observed in mammals, including carnivores (da Silva et al., 2016; Caro et al., 2017), artiodactyls (Stoner et al., 2003b), Palearctic shrews (Stanchak and Santana, 2019), primates (Kamilar and Bradley, 2011; Santana et al., 2012), rodents (Lai et al., 2008), and marsupials (Nigenda-Morales et al., 2018; Cerezer et al., 2020). These empirical studies have commonly used temperature, precipitation, latitude, and vegetation to explain patterns of color variation that are associated with climatic factors or surrogates of those factors. Our study extended the general predictions of Gloger’s rule by also revealing that environmental variables related to background matching to surrounding substrates also contribute to pelage luminance.
Our results largely agreed with other quantitative investigations of Gloger’s rule in other Sciurids that were focused on intraspecific variation in Scirus niger (Kiltie, 1989) and Protoxerus stangeri (Amtmann, 1965). The former investigated several populations within S. niger and found support for darker squirrels being associated with greater temperature, moisture, and fire frequency. The mechanism proposed by Kiltie (1989) for the role of fire frequency is that wildfires leave behind a dark charred substrate, which may provide greater concealment for darker squirrels. However, they also stated that the lasting effect of this mechanism may be tenuous because of the rapid regrowth of vegetation following fires usually obscures the dark background of charred wood. Perhaps the mechanism is not fire frequency, but other environmental characteristics that are associated with habitats that burn frequently. More research is needed to determine if there are other probable mechanistic explanations for the association of fire frequency with pelage luminance and whether this trend is generalizable beyond Sciuridae. Amtmann (1965) analyzed samples from across the range of P. stangeri and similarly found a negative relationship between mean annual precipitation and pelage luminance. However, contrary to our study, P. stangeri was found to exhibit a positive correlation between pelage luminance and mean annual temperature.
Primates and squirrels present an interesting opportunity to study parallel evolution in animal color patterns. Primates, like Sciurids, possess exceptional diversity in color patterns (Bradley and Mundy, 2008; Santana et al., 2012) and share many other attributes, including wide-spread diurnality, many species exhibiting an arboreal lifestyle, having similar predators (carnivores, raptors, and snakes), and having global distributions that span a range of biomes. Our results are consistent with prior work on primates (Kamilar and Bradley, 2011) that found pelage luminance across primates corresponded negatively with AET. AET measures the amount of water leaving an environment and is affected by temperature, precipitation, humidity and primary productivity. This result implies that primates are darker in areas with higher precipitation, higher temperature, higher humidity and higher primary productivity. The one major difference between primates and Sciurids with regards to color pattern evolution is that many primate species have evolved striking sexual dimorphisms in pelage coloration that are related to social signaling and sexual condition (Setchell, 2005; Dubuc et al., 2009; Marty et al., 2009). Squirrels do not exhibit sexual dimorphism in pelage coloration and thus the selective pressures on pelage coloration are likely to be strictly due to ecological and environmental factors.
The range of color patterns and hues in the family Sciuridae are incredibly broad and diverse (Thorington et al., 2012). This diversity includes species with patterns that are patchy (e.g., Sciurus variegatoides), striped (e.g., Tamias striatus), spotted (e.g., Xerospermophilus spilosoma), mottled (e.g., Otospermophilus beecheyi), and uniform (e.g., Microsciurus mimulus), as well as species with colors that are very light (e.g., Callosciurus finlaysonii), very dark (e.g., Callosciurus prevostii), orangish-red (e.g., Sciurus vulgaris), reddish-maroon (e.g., Ratufa indica), reddish-brown (e.g., Tamiasciurus douglasii), and gray (e.g., Sciurus griseus). Furthermore, color patterns can vary tremendously just within a single animal (e.g., tail colors are often distinct from body colors). The evolutionary forces shaping this diversity of color patterns and hues across species and on different body parts are not well studied in Sciurids, but may include selection to enhance conspecific and heterospecific signaling, despite camouflage also likely being another important driver of pelage color evolution. Squirrels often vocalize and exhibit tail-flagging when they detect potential predators (Owings and Coss, 1977; McRae and Green, 2014). Thus, it is possible that striking color patterns on tails or even the main body may improve visual communication with predators during precarious encounters. We suspect that multiple types of selective pressures are shaping the evolution of fur color in squirrels and our study sheds some light that precipitation-related and background matching pressures may be shaping one dimension (pelage luminance) of these color patterns.
One of the general statistical challenges in studies of Gloger’s rule is that many of the hypothesized explanatory variables are inherently correlated with each other and may be directly or indirectly related to animal-color patterns that conform to Gloger’s rule. Ideally, studies can illuminate which variables are directly driving variation in pelage luminance and which variables may be mediated through others. Unfortunately, univariate or multiple regression approaches do not offer the ability to distinguish between direct and mediated effects when questions are ecologically complex. As an example, such approaches cannot distinguish between a model in which temperature and moisture drive primary productivity, which in turn drives pelage luminance; or one in which temperature and moisture drive primary productivity and pelage luminance simultaneously. One possible approach to differentiating between these two hypotheses is through statistical methods like path analysis, which has recently been extended for use with comparative phylogenetic data (von Hardenberg and Gonzalez-Voyer, 2013; van der Bijl, 2018). However, one limitation of path analysis is that it requires the hypotheses to be tested to explicitly specify all relationships among included variables. Given the complicated interconnectedness of variables typically included in Gloger’s rule studies, this specificity is difficult to attain without further methodological development. We recommend that future research explores how path analysis can be effectively applied to questions concerning Gloger’s rule.
Data Availability Statement
The datasets generated for this study can be found in the Dryad repository 10.5061/dryad.tqjq2bvv8.
Author Contributions
AS and AC contributed to the conception and design of the study, and draft and revision of the manuscript. AS was responsible for the data acquisition, analysis, and data interpretation. Both authors approved the publication.
Funding
AS was supported by the Mayer’s Undergraduate Research Summer Fellowship and the Undergraduate Research Scholarship through the Ohio State University. AC was supported by startup funds through the Ohio State University.
Conflict of Interest
The authors declare that the research was conducted in the absence of any commercial or financial relationships that could be construed as a potential conflict of interest.
Acknowledgments
We thank D. Lunde and the Smithsonian National Museum of Natural History for access to specimens. We thank R. Zenil-Ferguson and L. Kubatko for their invaluable advice on phylogenetic comparative methods as well as K. Delhey and S. Nigenda-Morales for their helpful comments. We also thank T. Piko for help with data collection and figure formatting.
Footnotes
References
Amtmann, E. (1965). Zur geographischen farbvariation des Afrikanischen Riesenhörnchens Protoxerus stangeri (Waterhouse 1842). Eine quantitative untersuchung zur glogerschen regel. Z. Morphol. Ökol. Tiere 55, 515–529. doi: 10.1007/bf00407475
Ayres, K. W., Button, R. G., and De Jong, E. (1973). Soil morphology and soil physical properties. II. Mechanical impedance and moisture retention and movement. Can. J. Soil Sci. 53, 9–19. doi: 10.4141/cjss73-002
Batjes, N. H., Ribeiro, E., and van Oostrum, A. (2019). Standardised soil profile data to support global mapping and modelling (WoSIS snapshot 2019). Earth Syst. Sci. Data 12, 299–320. doi: 10.5194/essd-12-299-2020
Bivand, R., Keitt, T., and Rowlingson, B. (2019). rgdal: Bindings for the ‘Geospatial’ Data Abstraction Library. R package Version 1.4-8. Available online at: https://CRAN.R-project.org/package=rgdal
Bradley, B. J., and Mundy, N. I. (2008). The primate palette: the evolution of primate coloration. Evol. Anthropol. 17, 97–111. doi: 10.1002/evan.20164
Caro, T., Walker, H., Rossman, Z., Hendrix, M., and Stankowich, T. (2017). Why is the giant panda black and white? Behav. Ecol. 28, 657–667. doi: 10.1093/beheco/arx008
Cerezer, F. O., Ribeiro, J. R. I., Graipel, M., and Cáceres, N. C. (2020). The dark side of colouration: ecogeographical evidence supports Gloger’s rule in American marsupials. Evolution. doi: 10.1111/evo.13989 [Epub ahead of print].
Chaplin, G. (2004). Geographic distribution of environmental factors influencing human skin coloration. Am. J. Phys. Anthropol. 125, 292–302. doi: 10.1002/ajpa.10263
Cooper, N., Thomas, G. H., Venditti, C., Meade, A., and Freckleton, R. P. (2016). A cautionary note on the use of Ornstein Uhlenbeck models in macroevolutionary studies. Biol. J. Linn. Soc. 118, 64–77. doi: 10.1111/bij.12701
da Silva, L. G., de Oliveira, T. G., Kasper, C. B., Cherem, J. J., Moraes, E. A. Jr., Paviolo, A., et al. (2016). Biogeography of polymorphic phenotypes: mapping and ecological modelling of coat colour variants in an elusive Neotropical cat, the jaguarundi (Puma yagouaroundi). J. Zool. 299, 295–303. doi: 10.1111/jzo.12358
Delhey, K. (2019). A review of Gloger’s rule, an ecogeographical rule of colour: definitions, interpretations and evidence. Biol. Rev. 94, 1294–1316.
Delhey, K., Dale, J., Valcu, M., and Kempenaers, B. (2019). Reconciling ecogeographical rules: rainfall and temperature predict global colour variation in the largest bird radiation. Ecol. Lett. 22, 726–736. doi: 10.1111/ele.13233
Dubuc, C., Brent, L. J. N., Accamando, A. K., Gerald, M. S., MacLarnon, A., Semple, S., et al. (2009). Sexual skin color contains information about the timing of the fertile phase in free-ranging Macaca mulatta. Int. J. Primatol. 30, 777–789. doi: 10.1007/s10764-009-9369-7
Edgar, R. C. (2004). MUSCLE: multiple sequence alignment with high accuracy and high throughput. Nucleic Acids Res. 32, 1792–1797. doi: 10.1093/nar/gkh340
Gloger, C. W. L. (1833). Das Abändern der Vögel durch Einfluss des Klima’s, etc. Breslau: Schulz & Co.
Hansen, M. C., Potapov, P. V., Moore, R., Hancher, M., Turubanova, S. A., Tyukavina, A., et al. (2013). High-resolution global maps of 21st-century forest cover change. Science 342, 850–853. doi: 10.1126/science.1244693
Hijmans, R. J., and van Etten, J. (2014). raster: raster: Geographic Data Analysis and Modeling. R package version 2.3–12. Available online at: https://mran.microsoft.com/snapshot/2014-11-17/web/packages/raster/index.html (accessed May 19, 2019).
Ho, L. S. T., and Ane, C. (2014). A linear-time algorithm for Gaussian and non-Gaussian trait evolution models. Syst. Biol. 63, 397–408. doi: 10.1093/sysbio/syu005
Huelsenbeck, J. P., and Ronquist, F. (2001). MRBAYES: Bayesian inference of phylogenetic trees. Bioinformatics 17, 754–755. doi: 10.1093/bioinformatics/17.8.754
IUCN (2019). The IUCN Red List of Threatened Species. Version 2019-2. Available online at: http://www.iucnredlist.org (accessed July 18, 2019).
Ives, R. A., and Li, D. (2018). rr2: an R package to calculate R2s for regression models. J. Open Source Softw. 3:1028. doi: 10.21105/joss.01028
Jones, K. E., Bielby, J., Cardillo, M., Fritz, S. A., O’Dell, J., Orme, C. D. L., et al. (2009). PanTHERIA: a species-level database of life history, ecology, and geography of extant and recently extinct mammals: ecological Archives E090-184. Ecology 90, 2648–2648. doi: 10.1890/08-1494.1
Kamilar, J. M., and Bradley, B. J. (2011). Interspecific variation in primate coat colour supports Gloger’s rule. J. Biogeogr. 38, 2270–2277. doi: 10.1111/j.1365-2699.2011.02587.x
Kiltie, R. A. (1989). Wildfire and the evolution of dorsal melanism in fox squirrels, Sciurus niger. J. Mammal. 70, 726–739. doi: 10.2307/1381707
Lai, Y.-C., Shiroishi, T., Moriwaki, K., Motokawa, M., and Yu, H.-T. (2008). Variation of coat color in house mice throughout Asia. J. Zool. 274, 270–276. doi: 10.1111/j.1469-7998.2007.00382.x
Lanfear, R., Calcott, B., Ho, S. Y., and Guindon, S. (2012). PartitionFinder: combined selection of partitioning schemes and substitution models for phylogenetic analyses. Mol. Biol. Evol. 29, 1695–1701. doi: 10.1093/molbev/mss020
Madeira, F., Park, Y. M., Lee, J., Buso, N., Gur, T., Madhusoodanan, N., et al. (2019). The EMBL-EBI search and sequence analysis tools APIs in 2019. Nucleic Acids Res. 47, W636–W641.
Martins, E. P., and Hansen, T. F. (1997). Phylogenies and the comparative method: a general approach to incorporating phylogenetic information into the analysis of interspecific data. Am. Nat. 149, 646–667. doi: 10.1086/286013
Marty, J. S., Higham, J. P., Gadsby, E. L., and Ross, C. (2009). Dominance, coloration, and social and sexual behavior in male drills Mandrillus leucophaeus. Int. J. Primatol. 30:807. doi: 10.1007/s10764-009-9382-x
McRae, T. R., and Green, S. M. (2014). Joint tail and vocal alarm signals of gray squirrels (Sciurus carolinensis). Behaviour 151, 1433–1452. doi: 10.1163/1568539x-00003194
Nachman, M. W., Hoekstra, H. L., and D’Agostino, S. L. (2003). The genetic basis of adaptive melanism in pocket mice. Proc. Natl. Acad. Sci. U.S.A. 100, 5268–5273. doi: 10.1073/pnas.0431157100
Nigenda-Morales, S. F., Harrigan, R. J., and Wayne, R. K. (2018). Playing by the rules? Phenotypic adaptation to temperate environments in an American marsupial. PeerJ 6:e4512. doi: 10.7717/peerj.4512
Owings, D. H., and Coss, R. G. (1977). Snake mobbing by California ground squirrels: adaptive variation and ontogeny. Behaviour 50–69.
Pennell, M. W., Eastman, J. M., Slater, G. J., Brown, J. W., Uyeda, J. C., FitzJohn, R. G., et al. (2014). geiger v2. 0: an expanded suite of methods for fitting macroevolutionary models to phylogenetic trees. Bioinformatics 30, 2216–2218. doi: 10.1093/bioinformatics/btu181
R Core Team (2013). R: A Language and Environment for Statistical Computing. Vienna: R Foundation for Statistical Computing.
Rensch, B. (1929). Prinzip geographischer Rassenkreise und das Problem der Artbildung. Berlin: Borntraeger.
Santana, S. E., Lynch Alfaro, J., and Alfaro, M. E. (2012). Adaptive evolution of facial colour patterns in Neotropical primates. Proc. R. Soc. B Biol. Sci. 279, 2204–2211. doi: 10.1098/rspb.2011.2326
Schulze, D. G., Nagel, J. L., Van Scoyoc, G. E., Henderson, T. L., Baumgardner, M. F., and Stott, D. E. (1993). Significance of organic matter in determining soil colors. Soil Color 31, 71–90. doi: 10.2136/sssaspecpub31.c5
Setchell, J. M. (2005). Do female mandrills prefer brightly colored males? Int. J. Primatol. 26, 715–735. doi: 10.1007/s10764-005-5305-7
Stanchak, K. E., and Santana, S. E. (2019). Do ecogeographical rules explain morphological variation in a diverse, Holarctic genus of small mammals? J. Biogeogr. 46, 110–122. doi: 10.1111/jbi.13459
Stoner, C. J., Bininda-Emonds, O. R. P., and Caro, T. (2003a). The adaptive significance of coloration in lagomorphs. Biol. J. Linn. Soc. 79, 309–328. doi: 10.1046/j.1095-8312.2003.00190.x
Stoner, C. J., Caro, T. M., and Graham, C. M. (2003b). Ecological and behavioral correlates of coloration in artiodactyls: systematic analyses of conventional hypotheses. Behav. Ecol. 14, 823–840. doi: 10.1093/beheco/arg072
Symonds, M. R. E., and Moussalli, A. (2011). A brief guide to model selection, multimodel inference and model averaging in behavioural ecology using Akaike’s information criterion. Behav. Ecol. Sociobiol. 65, 13–21. doi: 10.1007/s00265-010-1037-6
Thorington, R. W. Jr., Koprowski, J. L., Steele, M. A., and Whatton, J. F. (2012). Squirrels of the World. Baltimore, MD: JHU Press.
van der Bijl, W. (2018). phylopath: easy phylogenetic path analysis in R. PeerJ 6:e4718. doi: 10.7717/peerj.4718
Vignieri, S. N., Larson, J. G., and Hoekstra, H. E. (2010). The selective advantage of crypsis in mice. Evolution 64, 2153–2158.
von Hardenberg, A., and Gonzalez-Voyer, A. (2013). Disentangling evolutionary cause-effect relationships with phylogenetic confirmatory path analysis. Evolution 67, 378–387. doi: 10.1111/j.1558-5646.2012.01790.x
Keywords: Gloger’s rule, Sciuridae, multiple regression, pelage, phylogenetic comparative methods, ecogeographic rule
Citation: Sheets AD and Chavez AS (2020) Evolution of Pelage Luminance in Squirrels (Sciuridae). Front. Ecol. Evol. 8:249. doi: 10.3389/fevo.2020.00249
Received: 01 February 2020; Accepted: 08 July 2020;
Published: 05 August 2020.
Edited by:
Jane Waterman, University of Manitoba, CanadaReviewed by:
Kaspar Delhey, Monash University, AustraliaSergio F. Nigenda-Morales, Center for Research and Advanced Studies of the National Polytechnic Institute, Mexico
Copyright © 2020 Sheets and Chavez. This is an open-access article distributed under the terms of the Creative Commons Attribution License (CC BY). The use, distribution or reproduction in other forums is permitted, provided the original author(s) and the copyright owner(s) are credited and that the original publication in this journal is cited, in accordance with accepted academic practice. No use, distribution or reproduction is permitted which does not comply with these terms.
*Correspondence: Alec D. Sheets, c2hlZXRzLjI1NkBvc3UuZWR1
 Alec D. Sheets
 Andreas S. Chavez