
94% of researchers rate our articles as excellent or good
Learn more about the work of our research integrity team to safeguard the quality of each article we publish.
Find out more
ORIGINAL RESEARCH article
Front. Ecol. Evol., 10 July 2019
Sec. Paleoecology
Volume 7 - 2019 | https://doi.org/10.3389/fevo.2019.00245
 Eric Capo1*†
 Johan Rydberg1†
 Julie Tolu1,2†
 Isabelle Domaizon3Didier Debroas4Richard Bindler1Christian Bigler1
To assess the sensitivity of lakes to anthropogenically-driven environmental changes (e.g., nutrient supply, climate change), it is necessary to first isolate the effects of between-year variability in weather conditions. This variability can strongly impact a lake's biological community especially in boreal and arctic areas where snow phenology play an important role in controlling the input of terrestrial matter to the lake. Identifying the importance of this inherent variability is difficult without time series that span at least several decades. Here, we applied a molecular approach (metabarcoding on eukaryotic 18S rRNA genes and qPCR on cyanobacterial 16S rRNA genes) to sedimentary DNA (sed-DNA) to unravel the annual variability of microbial community in 40 years' sediment record from the boreal lake Nylandssjön which preserve annually-laminated sediments. Our comparison between seasonal meteorological data, sediment inorganic geochemistry (X-ray fluorescence analyses) and organic biomarkers (pyrolysis-gas chromatography/mass spectrometry analyses), demonstrated that inter-annual variability strongly influence the sediment composition in Nylandssjön. Spring temperature, snow and ice phenology (e.g., the percentage of snow loss in spring, the timing of lake ice-off) were identified as important drivers for the inputs of terrestrial material to the lake, and were therefore also important for shaping the aquatic biological community. Main changes were detected in the late-80s/mid-90s and mid-2000s associated with increases in algal productivity, in total richness of the protistan community and in relative abundances of Chlorophyta, Dinophyceae as well as Cyanobacteria abundance. These changes could be linked to a decline in terrestrial inputs to the lake during the snow melt and run-off period, which in turn was driven by warmer winter temperatures. Even if our data shows that meteorological factors do affect the sediment composition and microbial communities, they only explain part of the variability. This is most likely a consequence of the high inter-annual variability in abiotic and biotic parameters highlighting the difficulty to draw firm conclusions concerning drivers of biological changes at an annual or sub-annual resolution even with the 40-year varved sediment record from Nylandssjön. Hence, it is necessary to have an even longer time perspective in order to reveal the full implications of climate change.
Lake ecosystems are sensitive to anthropogenically-driven environmental changes such as modifications in nutrient supply or climate change (Carpenter et al., 1999; Williamson et al., 2009; Moss, 2012). However, it is often challenging to isolate lake ecosystem responses that are the consequence of local factors (i.e., nutrient supply) and regional/global drivers (i.e., climate) using only short-term monitoring data due to the inherent seasonal and between-year variability in factors such as solar irradiance, temperature and precipitation. In boreal and arctic regions, the inter-annual variability in seasonal conditions influences the timing, duration and strength of snow and lake-ice phenology, which in turn control catchment hydrology and the export of terrestrial matter to the lake. Variations in snow cover, ice-off and run-off may also influence directly and indirectly aquatic communities (e.g., timing, length, and intensity of diatom growing seasons and community composition; Rühland et al., 2015; Warner et al., 2018; Maier et al., 2019). Analyzing changes of complex aquatic communities over a relatively long-term period could facilitate separating such inter-annual variability from longer-term changes in anthropogenic pressures and climate.
Among aquatic communities, the microbial community may be particularly useful in teasing apart the responses of lake ecosystems to inter-annual variations and long-term changes. Microbes act at the base of lake trophic networks, as phototrophs, bacterivores, saprotrophs and parasites, and are thus fundamental for ecosystem functioning (Sherr and Sherr, 1988; Caron et al., 2009; Newton et al., 2011). Among them, the diversity and community composition of aquatic protistan communities (i.e., unicellular eukaryotes) have been well studied using DNA sequencing methods (Simon et al., 2015; Filker et al., 2016; Debroas et al., 2017). However, their temporal dynamics have been studied mostly on short timescales, i.e., from days to seasons (Debroas et al., 2015; Mukherjee et al., 2017; Princiotta and Sanders, 2017), and rarely over timescales relevant to investigate their responses to inter-annual variability (except Cram et al., 2015 for marine bacterial communities) or longer-term pressures. The longest DNA-based monitoring time series—which extend up to one decade (e.g., BATS, HOT, SPOT and BBMO; Fuhrman et al., 2015; Giner et al., 2018) – have been useful to identify day length (e.g., luminosity) and temperature as major drivers of community turnover. These studies spanning up to 10 years showed that the aquatic community is strongly influenced by factors with a strong seasonal variability. Such work illustrate the necessity to look at even longer timescales in to effectively separate seasonal and inter-annual variability from longer-term drivers.
Application of DNA-based analysis to sedimentary archives can be a powerful tool to extract long-term data on lake aquatic communities (see Domaizon et al., 2017 for review). These archives can reveal the responses of key components of aquatic food webs to environmental changes over longer timeframes (Capo et al., 2016, 2017a; Monchamp et al., 2018; Tse et al., 2018; Vuillemin et al., 2018). For example, sedimentary DNA (sed-DNA) was used to identify the responses of protistan communities over centennial to millennial timescales to long-term forcing factors such as eutrophication and climate change (Capo et al., 2016, 2017a).
In the present study, we investigate annually resolved changes in the microbial community from the boreal lake Nylandssjön over a 40-year period (1973-2012). In a previous study, Capo et al. (2017b) demonstrated that microbial eukaryotic DNA was well preserved in the recent sediment of Nylandssjön despite significant diagenetic changes such as the rapid loss of carbon (Gälman et al., 2009). In combination with inorganic geochemistry (wavelength dispersive X-ray fluorescence spectroscopy; as used in Rydberg and Martínez-Cortizas (2014), biomarkers for terrestrial and algal organic matter [pyrolysis-gas chromatography/mass spectrometry; as described in Tolu et al. (2015)] and meteorological monitoring data (SMHI)1 the questions we sought to address were: (1) To what extent is the aquatic ecosystem influenced by the inter-annual variability in environmental conditions (e.g., snow and ice phenology, modifications in the export of terrestrial matter into the lake)? (2) How has the aquatic microbial community, particularly protistan and cyanobacterial communities, changed over this 40-year period? (3) Can we discern superimposed local or global drivers of ecosystem change over this timeframe, such as land use or climate?
Nylandssjön (62°57′N, 18°17′E) is a circum-neutral, mesotrophic, and dimictic lake in which distinct well preserved annual laminations (varves) covered the past c. 100 year (Renberg, 1986, Figure 1). The lake, which is located at 34 m above the current sea level, was formed as a result of isostatic rebound about 3,000 years ago. Lake and catchment areas are 0.28 and 0.95 km2, respectively. A number of sediment freeze cores have been collected over the years (1978–2015; cf Supplementary Material). During the period 2004–2015, the freeze cores were then manually sub-sampled into annually resolved samples following the dark winter layer using a scalpel under magnifying lamp in a freezer room. The varves from Nylandssjön thus provide an accurate timescale to date each sediment layer over the 1973–2012 time period.
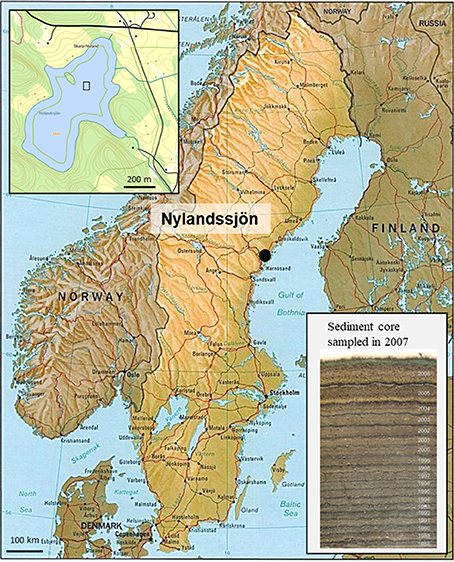
Figure 1. Location of Nylandssjön (Sweden), with an inset map of the lake on the top-left. The 50 × 50 m area where sediment cores were retrieved is marked with a square box. Inset photograph on bottom-right shows a sediment frozen core sampled in 2007; the dark winter layer separates each varve year (end of winter to following end of winter).
A total of 40 individual varves covering the years 1973–2012 were sub-sampled from a sediment core collected in 2013 for the DNA-based analysis. DNA extraction, PCR amplification, library preparation and bioinformatics were performed as described in Supplementary Material. Briefly, DNA extraction was performed in duplicate for each of the 40 varved samples (i.e., 80 samples) using approximately 500 mg of wet sediment with the NucleoSpin® Soil kit (Macherey-Nagel, Düren, Germany). Total Cyanobacteria abundance was quantified by performing qPCR analysis using a SYBRGreen assay by targeting the 16S rRNA-ITS region. The values obtained were the mean values of the duplicates from each sediment layer and expressed as the abundance of Cyanobacteria (copies/g sed). For the high-throughput sequencing of eukaryotic DNA, the V7 region of 18S rRNA gene was PCR amplified by targeting a 260 bp long fragment, from ~25 ng of environmental DNA extract for each sample and using the general eukaryotic primers 960f (5′-GGCTTAATTTGACTCAACRCG-3′) (Gast et al., 2004) and NSR1438 (5′-GGGCATCACAGACCTGTTAT-3′) (Van de Peer et al., 2000). Library preparations and paired-end (2 × 250 bp) sequencing (MiSeq Illumina instrument, San Diego, CA, USA) were performed at Fasteris SA (Geneva, Switzerland). The raw data were deposited in FigShare2 and processed as described in the Supplementary Material. Briefly, the paired-end reads were merged and cleaned (no undefined bases, minimum sequence length of 200 bp, no sequencing error in primers, removing of chimera) using UPARSE and UCHIME (Edgar et al., 2011; Edgar, 2013) tools allowing to obtain a total of 5,847,791 raw sequences. The remaining DNA sequences were clustered into OTUs (i.e., Operational Taxonomic Units) at a 95% similarity threshold. The taxonomic affiliation was performed by BLAST against an SSURef SILVA database (Pruesse et al., 2007) enriched by lacustrine DNA sequences originating from various studies on lacustrine systems. For each sample, OTUs detected in only one of the two duplicates were removed from the analysis. Finally, the number of DNA sequences obtained for each of the 40 varves was standardized at 75,000 resulting in a total number of 12,311 OTUs. The final OTU abundance table was used to calculate the diversity metrics of protistan community [i.e., Hill's numbers: the species richness (q = 0, OTU richness), the exponential form of Shannon entropy (q = 1, transformed Shannon index); and the transformation of Gini–Simpson measures (q = 2, transformed Simpson index)]; R package iNEXT (Hsieh et al., 2016).
The geochemical analyses were made in part to extend the time series previously used (1948–2003) by Rydberg and Martínez-Cortizas (2014). Samples from 1953–2002 and new samples for 2004–2014 were (re-)analyzed using wavelength dispersive X-ray fluorescence spectroscopy (WD-XRF). Prior to analysis, freeze-dried samples were weighed to calculate the bulk density (BD) and dry-mass accumulation rate (DMAR). All samples were analyzed for (i) C and N contents, using a Perkin-Elmer 2400 CHNS/O analyzer operated in CHN-mode (cf. Gälman et al., 2006); and (ii) 23 elements, using a Bruker S8 Tiger wavelength dispersive X-ray fluorescence spectrometer (WD-XRF) instrument. Elemental concentrations were calculated using a calibration method suitable to small sample sizes (50 mg) as developed by Rydberg (2014) (cf. Supplementary Material). To facilitate comparison with organic biomarkers and DNA data, the geochemical data were subjected to a principal component analysis (PCAgeo) in order to reduce the 25 geochemical variables to a few components that are related to underlying processes controlling the sediment geochemistry (Figure S1). The geochemical data was standardized (z-scores) prior to PCA. Because this multivariate technique considers the inorganic sediment matrix as a whole rather than the single variables, the resulting PCs are less sensitive to the analytical uncertainties and spatial heterogeneity that might affect the down-core record of a single variable in a specific core.
Biomarkers of terrestrial and algal organic matter (OM) were determined using pyrolysis-gas chromatography/mass spectrometry (py-GC/MS) for sediment samples retrieved from a core collected in 2006, which covers the period 1973–2005. The py-GC/MS analysis, peak integration and identification follow the method optimized by Tolu et al. (2015), and is described in detail in Supplementary Material. The pyrolytic organic products used in this study include: (i) 16 lignin oligomers and 4 phenolic compounds described as biomarkers for terrestrial OM (Meyers and Ishiwatari, 1993); and (ii) 6 specific Py-products of chlorophyll (i.e., prist-1-ene, phytenes, and phytadienes; Nguyen et al., 2003), 6 specific Py-products of proteins (i.e., 2,5-diketopiperazines; Fabbri et al., 2012) and 13 steroids described as biomarkers for algal OM (Ishiwatari et al., 1991; Nguyen et al., 2003; Ninnes et al., 2017; Tolu et al., 2017). Changes in their fluxes to the sediment were estimated by dividing their signal intensity (i.e., peak area) by the dry mass accumulation rate (DM-AR). The parameters are thus referred to as: DM-AR-normalized signal intensity of lignin oligomers, phenolic compounds, chlorophylls, proteins, and steroids. Detailed information about the identified compounds are given in Table S1.
Meteorological data (daily air temperature, precipitation, and snow depth) covering the period 1972–2012 were obtained from the Swedish Meteorological and Hydrological Institute1 for the weather station in Härnösand, 40 km south of Nylandssjön. For each year, daily air temperature and precipitation values were converted to seasonal resolution (mean and sum values, respectively). The seasons were defined as follows: winter, November-March; spring, April-May; summer, June-August; and autumn, September-October. Daily snow depth data was used to calculate the daily snow gain and loss and the annual snow accumulation (Snowgain) during the winter-spring period (i.e., 20 October to 10 May). The percentage of spring snow loss (SSL) was determined by dividing the amount of snow loss during the spring period by the snow accumulation for the entire winter-spring period. We also calculated the annual sum of precipitation during snowfall days (Snowprec) accounting for the quantity of water released during melting events. The ice off timing (tIOT) of Nylandssjön was calculated by applying a model from Weyhenmeyer et al. (2004) using meteorological data (for the whole period) coupled with monitoring data of ice-off timing in Nylandssjön over the 2002–2012 period (cf. Supplementary Material).
A change point analysis was performed on univariate and multivariate data using the function e.divisive from the R package ecp (parameters: R = 999, alpha = 1, min.size = 2; James and Matteson, 2013). A Bray-Curtis dissimilarity matrix was built from the OTU relative abundance table and used to assess (i) the temporal variation in community structure via the use of a principle coordinates analysis (PCoA) and (ii) the clustering of samples by hierarchical clustering tree analysis (iii) the relationships between the community structure and environmental parameters. This analysis was performed using the functions wcmdscale (k = 2, eig = T), hclust and env.fit (permutations = 999, type = series) from the vegan R package (Oksanen et al., 2015) was employed based on the goodness-of-fit statistic (defined as r2 = 1-ssw/sst, where ssw and sst are within-group and total sums of squares). Bivariate correlations were calculated between environmental and biological parameters as Spearman rank using a 2-tailed test of significance. Because of relatively high autocorrelation in the data, i.e., the observations are not independent, the effective sample size was reduced according to Dawdy and Matalas (1964) prior to calculating the p-values (i.e., adj-p in the text). Adjusted p-values were not determined for correlations with PC1geo-scores and transformed Shannon index values due to two low effective sample size for these variables. Finally, an analysis using generalized additive models (GAMs) (Hastie and Tibshirani, 1986) was performed to investigate when and to what extent environmental parameters contribute to the changes in biological parameters (structure, richness and diversity of protistan communities, richness and relative abundance of the 11 most abundant protistan groups and the abundance of Cyanobacteria), as detailed by Capo et al. (2017a). The response variables that do not follow Gaussian distribution were log-transformed prior to modeling. The intervals do not correct for multiple comparisons and do not have 95% coverage. The functions gam and predict.gam from the “mgcv” package in R (Wood, 2015) were used and GAM parameterization was performed following technical recommendations from Simpson and Anderson (2009); Simpson (2018) GAMS were fitted using restricted marginal likelihood (REML), a continuous-time first-order autoregressive [CAR(1)] process in the residuals and the parameters select = TRUE and family = Gaussian(link = “identity”). Certain figures were made with ggplot2 R package (Wickham, 2016).
The protistan community from the 40-year Nylandssjön sediment record was characterized by a total richness of 12,311 OTUs. The OTU number in a single varve ranged from 1,234 to 3,371 OTUs with the lowest and highest values recorded in 1976 and 2011, respectively (Figure 2; Datasheet S1). Among the 47 taxonomical groups, 11 accounted for more than 55% of the total richness and 97% of the total number of DNA sequences, with Chlorophyta and Ciliophora as major groups (Table 1; Figure S2). The abundance of Cyanobacteria, measured using qPCR analysis, ranged from 4.5*105 to 3.7*106 copies per g wet sediment, with the lowest and highest values in 1989 and 2008, respectively (Figure 2; Datasheet S1).
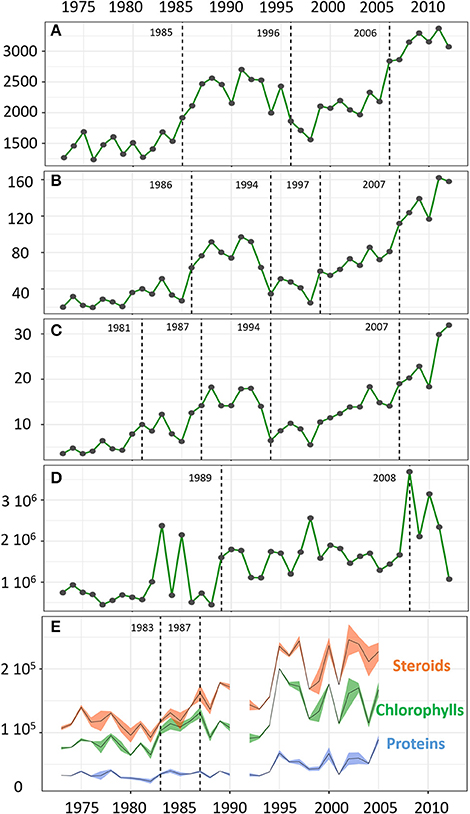
Figure 2. Temporal changes in the OTU richness (A), the transformed Shannon index (B), and transformed Simpson index (C), the abundance of Cyanobacteria (copies/g sed) over the period 1973–2012 (D) and the mean values of DM-AR normalized signal intensity for the biomarkers of algal OM (steroids, chlorophylls, proteins) with bands representing the standard deviations (over the period 1973–2005) (E). Change points are indicated by dashed lines.
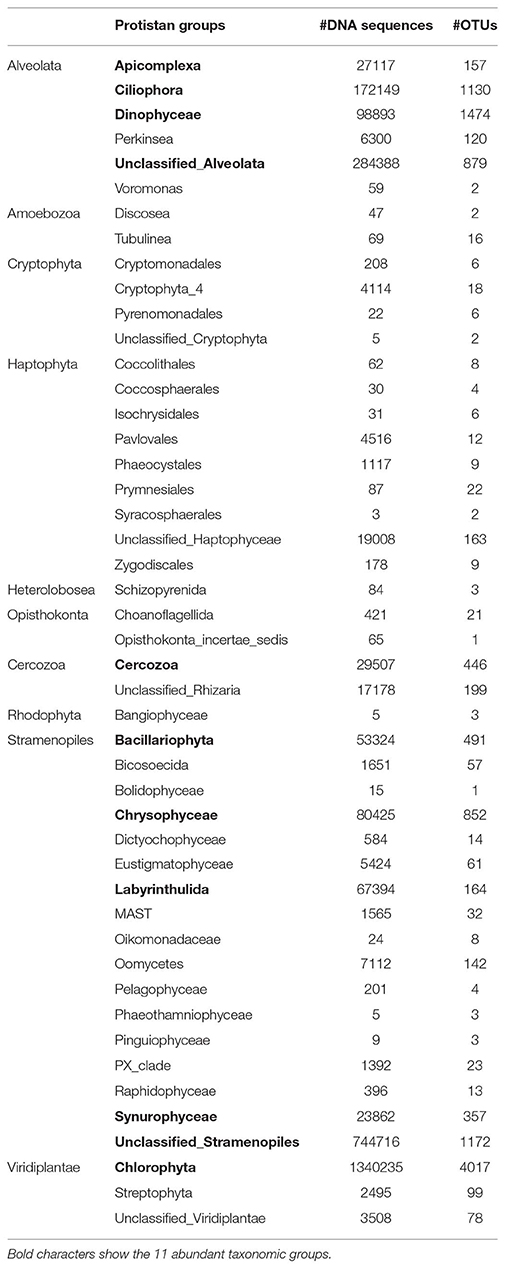
Table 1. Number of DNA sequences and OTUs within taxonomic groups of the protistan community.
In terms of composition, diversity and structure of the whole protistan community, the change point analysis separated the record into five periods which is consistent with the change points detected for the richness and relative abundance of protistan groups as well as Cyanobacteria abundance (Figures 2, 3; Figure S3). The shift from the first period (1973–1981) to the second period (1982–1993) was marked by an increase in OTU number and relative abundance of Chlorophyta (notably in Chlamydomonaceae; Figure S4). The third period (1994–2006 based on protistan community structure, but 1996–2006 based on change points for OTU richness) was marked by an increase of prominent OTUs (i.e., values of transformed Shannon index) such as Apicomplexa and Chrysophyceae followed by a return to the pre-dominance of Chlorophyta (unclassified and Trebouxiophyceae) alongside an increase in Dinophyceae relative abundance. The last change point in the mid to late 2000s (i.e., 2007) was concomitant with an increase in total OTU richness, more particularly within Alveolate (e.g., Ciliophora, Dinophyceae), Stramenopiles (e.g., Chrysophyceae, Bacillariophyta, and Syrunophyceae) as well as the relative abundance of Scenedesmaceae (from Chlorophyta, Figure S4) and Cyanobacteria (i.e., 2008, Figure 2). Change point analysis on biomarkers of algal OM (DM-AR-normalized intensity of chlorophylls, proteins and steroids) indicated three periods: lower values with lower variability for the first period, 1973–1983; followed by increasing values for steroids and chlorophylls during the 1983–1987 period; and in the most recent period, 1987–2005, higher values and greater variability of all three biomarker groups (Figure 2). Finally, a varve with a thick layer of algal material was observed in 2006 (Figure 1), which corresponds with the 2006–2008 change detected for the protistan and cyanobacterial communities, as well as an observed algal bloom in the autumn of 2006.
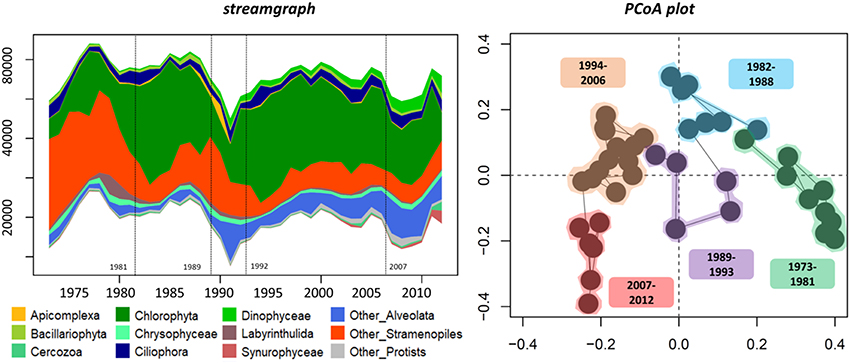
Figure 3. Temporal changes in relative abundance of protistan groups (streamgraph) and the structure of the protistan community from 1973 to 2012 ordination plot based on the first two principal coordinates of the PCoA. Change points are indicated in the streamgraph by dashed lines. The PCoA plot is based on Bray-Curtis indices calculated from the OTU relative abundance table. Sample groups were identified using a hierarchical clustering tree-based analysis.
The first three principal components (PC1-3geo) of the PCA made on the geochemical dataset (spanning 1953–2014) explained 75.5% of the total variance (Figure S1; Datasheet S1). PC1geo (30.4% of total variance) reflected variations in the relative proportions of mineral matter and organic matter, because it separates variables associated with the heavy mineral fraction (e.g., DM-AR, Si, Al, Na, K, Ti; positive loadings), from elements of organic matter (i.e., C, N, S; negative loadings). PC2geo (30.1% of total variance) separated samples rich in the fine-grained detrital fraction, i.e., clay minerals (Y, Ca, Zr, Mg, Sr, Ti, Rb, Al; positive loadings; Peinerud et al., 2001), from samples with high biogenic silica content (represented by the Si:Al-ratio; negative loadings). PC3geo (15% of total variance) was characterized by positive loadings for P, Fe and Mn, indicating a relationship with nutrient supply and redox conditions in the water column.
When examining temporal trends in the three main principal components, we identified three change points in the PC1geo-scores; first in 1977, when the PC1geo-scores dropped below the long-term average, then in 1993, when the decreasing trend is temporarily halted, and finally in 2006 when the decreasing trend resumes (Figure 4A). Prior to the 1970s, PC1geo-scores were relatively stable (around +1; Figure 4A), indicating that a higher proportion of the material reaching the sediment was mineral rather than organic material. In the early to mid-1970s, the PC1geo-scores decreased, indicating a transition to a more organic rich sediment. This decreasing trend continued toward the top of the record, except for two periods, during the late-1980s and early-2000s, when the PC1geo-scores temporarily increased. Because the Ti-accumulation rate (Ti-AR) closely followed the PC1geo-scores, while the C-accumulation rate (C-AR) didn't show any increasing trend (Figure S1), the change in sediment composition toward a more organic rich sediment was driven by a decreased input of mineral material rather than an increase in the input of organic material.
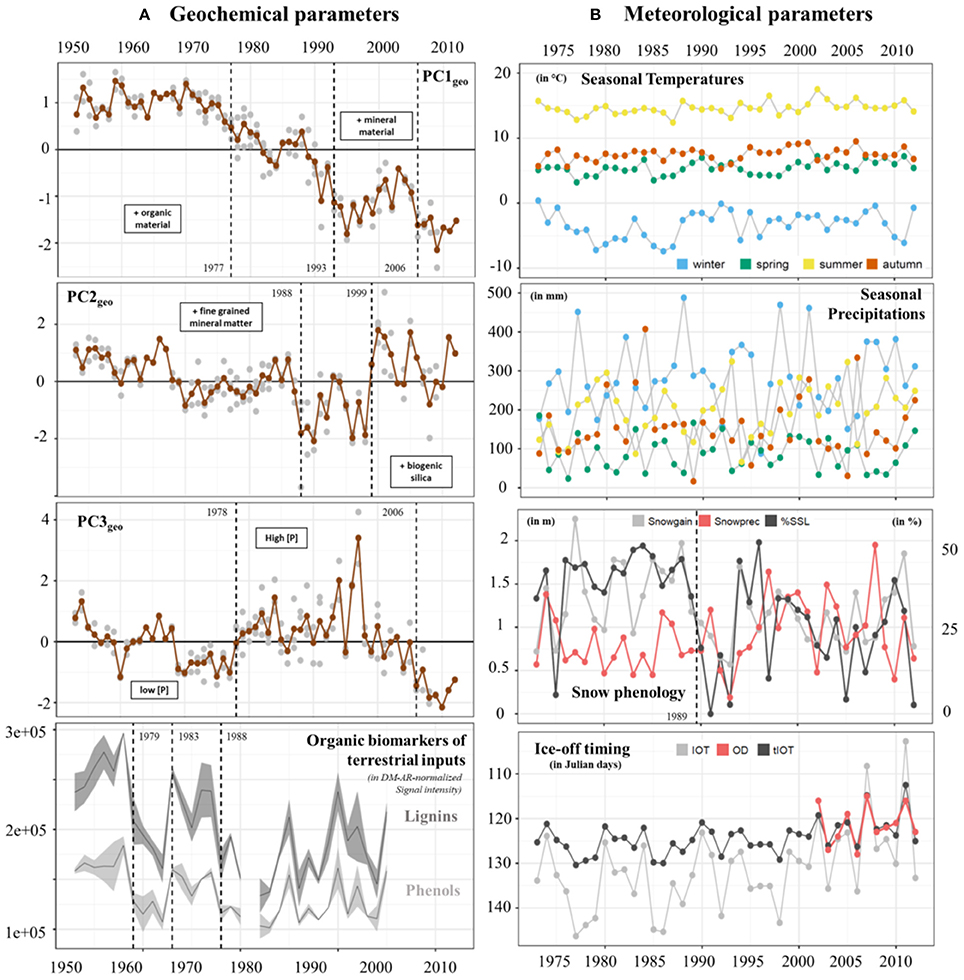
Figure 4. Temporal changes in (A) geochemical parameters: PC1geo, PC2geo, and PC3geo scores over the period 1953-2012 and biomarkers of terrestrial OM (DM-AR normalized signal intensity of lignin and phenolic compounds) over the period 1953–2005 (for each parameter, the lines and bands correspond to the mean value and the standard deviation, respectively). In plots PC1geo, PC2geo, and PC3geo, gray circles indicate PC scores obtained from each sample for the seven sediment cores while brown circles indicate the mean values of PC scores for each year. Main differences between positive and negative values of the 3 axis were described by the keywords within boxes. (B) Meteorological parameters including seasonal mean air temperature (in °C), seasonal sum precipitation (in mm), total snow gain (Snowgain in m), sum of precipitation during snowfall days (Snowprec in m), percentage of spring snow loss (SSL in %), and the timing of lake ice-off (OD, observed data; IOT, modeled data; tIOT, transformed modeled data, in Julian days) over the period 1973–2012. Change points are indicated by dashed lines. For the snow phenology panel, the dashed line corresponds to the %SSL values.
Change point analysis identified two shifts in the PC2geo-scores; 1988 and 1999. Prior to the first change point, no clear trend was detected. The PC2geo-scores then dropped sharply in the mid-1980s and mid-1990s, indicating a higher proportion of biogenic Si relative to detrital fine grained mineral material. These periods with low PC2geo-scores were followed by a period with high PC2geo-scores around the year 2000, and then a return to average PC2geo-scores.
The change point analysis of the third PC (PC3geo) identify two shifts, one in 1978 and the second in 2006. The temporal trend of PC3geo-scores was marked by a distinct shift to higher scores around 1977–1978. At this time, the P concentration increased from on average 3200 μg g−1 for the period prior to 1977, to about 5,100 μg g−1 for the period from 1978 to 2000. According to local farmers, this shift coincided with a shift in farming practices, from a more traditional style of farming relying mainly on manure to a more intense farming using also commercial fertilizers. The PC3geo-scores then remain high until the early 2000s when they decrease.
In agreement with PC1geo and PC2geo scores, change point analysis on the biomarkers of terrestrial OM, i.e., DM-AR-normalized signal intensity of lignin oligomers (specific of vascular plants) and phenolic compounds (in high abundance in vascular and non-vascular plants), indicates a decrease from the early-80s and late-80s (Figure 4A).
Seasonal air temperatures ranged around a mean summer temperature of 14.6 ± 1.0°C (range: 10–19°C) to a mean winter temperature of −3.3 ± 2.2°C (range: −16 to −5°C) (Figure 4B; Datasheet S1). Winter mean air temperatures exhibit the highest amplitude from the lowest mean temperature of −7.4°C in 1986 to the warmest mean temperature of 0.4°C in 1973. Precipitation was similar for all seasons with mean values of 181 ± 101 mm, but higher values generally occurred in winter and autumn (488 and 407 mm, respectively).
For each year, we used snow accumulation (Snowgain), sum of precipitation during snowfall days (Snowprec) and percentage of spring snow loss (SSL) to investigate temporal changes in snow phenology for the lake and its catchment (Figure 4B; Figure S5). Some years or time periods (e.g., 1990 to 1993 and 2005) were characterized by low Snowgain, Snowprec and spring snow loss while others (e.g., 1977 and late 1990s) show high Snowgain, Snowprec and spring snow loss values. A change point was detected for spring snow loss values in 1989. Over the 40-year period, the modeled lake ice-off timing (tIOT index) ranged from the Julian day 112 (25 April) to day 130 (8 May) (Figure 4B). Three years were characterized by early ice-off timing within the observational period of study (i.e., 2002–2012): 2002, 2007, and 2011. The years 2002 and 2007 were marked by late snowfalls (see Snowgain values in mid-December 2002 and mid-January 2007) and relatively weak percentage of snow loss during spring. The year 2011 was instead characterized by a long period of negative air temperature values with a high accumulation of snow and strong loss of snow during spring (Figure S5).
In boreal systems, a warmer winter and spring is characterized by lower snow accumulation (Snowgain) and lower percentage of spring snow loss (SSL), which results in less intense spring run-off events as compared to cold winters (Renberg, 1981). The meteorological data for Nylandssjön were consistent with this hypothesis, where negative correlations occur between winter temperature and Snowgain (ρ = −0.70, adj-p < 0.001) as well as between winter temperature and spring snow loss (ρ = −0.59, adj-p < 0.001) (Table S2). In turn, spring snow loss was dependent on both spring temperatures (ρ = −0.41; adj-p < 0.014) and Snowgain (ρ = 0.63, adj-p < 0.001).
Nylandssjön has only small ephemeral inlets that flow during periods with a very high groundwater table. Such conditions were almost exclusively confined to the snowmelt period, and thus, the transport of terrestrial matter from the catchment to the lake was highly dependent on the intensity of spring run-off during the snowmelt period (Romero-Viana et al., 2008; Petterson et al., 2010). A lower spring snow loss would imply a less intense spring run-off, and thus, a lower transport of mineral material from the catchment to the lake. For Nylandssjön, Rydberg and Martínez-Cortizas (2014) found such a link between the input of coarse grained mineral material to the winter conditions, and such a relationship between PC1geo and spring snow loss can also be observed in the 40 years record used in this study, i.e., during the mid-1990s when both spring snow loss and PC1geo scores are low. Similarly, an early ice-off would indicate a longer, and thus, less intense spring run-off period and a lower transport of heavy mineral material to the lake. In our data we see periods with coinciding early ice-off timing and low PC1geo scores several times in the most recent period (2002, 2007, and 2011). The PC2geo-scores — where positive scores represent a higher proportion of fine grained detrital material and negative scores a higher proportion of biogenic silica — were not related to spring snow loss, but they are weakly, but non-significantly, negatively correlated to the timing of ice-off (ρ = −0.30, adj-p < 0.085). An early ice-off (low numbers) might imply a prolonged and less intense spring run-off, which will be enough to transport the fine-grained detrital material that give positive PC2geo-scores but not the heavier mineral particles responsible for higher PC1geo-scores. The timing of ice-off might also affect the biogenic silica production by diatoms in the lake, and thus, also the PC2geo-scores (Maier et al., 2019). The PC3geo-scores were not significantly correlated to any of the tested environmental variables, which supports the interpretation that it is a non-weather related factor. This is consistent with the observation that farming practice was the main driver of PC3geo-scores variation. Altogether, our results indicate that weather conditions do affect the amount and type of terrestrial matter that reached Nylandssjön sediment, however, the relatively weak correlations also imply that there are other factors driving the transport of minerogenic material and nutrients to the lake.
The biomarkers for terrestrial OM inputs were not significantly correlated to any of the tested meteorological variables (Table S2). However, both lignin and phenolic compounds were positively correlated to PC2geo-scores (Table S2). This shows that concentrations of both lignin and phenolic compounds—which are primarily associated with terrestrial and more degraded organic material (Tolu et al., 2017) – are favored by a larger input of material from the catchment even if this also implies a higher input of mineral material and reduced total organic matter concentrations in the sediment. In contrast, chlorophyll, protein and steroid concentrations—which were primarily associated with fresh organic material produced within the lake (Tolu et al., 2017) – increased when the mineral material input decrease and the total organic material concentrations in the sediment increase. This pattern is consistent with previous evaluation of C:N-ratios in fresh sediment material from Nylandssjön showing that most of the organic material deposited in the sediment is produced within the lake (Gälman et al., 2006).
The present study brings new insights about the long-term temporal dynamics of the aquatic microbial community (i.e., 40 year) and its regulators at annual resolution. Thus far, most DNA-based monitoring studies have focused on the response to seasonality (Debroas et al., 2015) and timeframes covering <1 decade (Fuhrman et al., 2015 for a review focused on marine systems).
We identified the inputs of terrestrial material (i.e., PC1geo scores) as the only regulator of the structure of Nylandssjön's protistan community based on the results from the env.fit analysis (Table 2). Two biomarkers of algal OM (chlorophyll and proteins) were correlated with changes in cyanobacterial abundance (ρ = 0.49–0.53; adj-p < 0.015; Table S2). Among them, chlorophyll compounds, which are often used as proxy for algal productivity (e.g., Huot et al., 2007), were also found to correlate with fall mean temperatures (ρ = 0.48; adj-p = 0.025, Table S2), which may be explained by the peaks in primary productivity observed during fall (Maier, 2017). PC1geo and spring snow loss were identified the main parameters reflecting processes occurring in lake catchment that may shape the structure, composition and diversity of microbial communities, the change point analysis capturing the occurrence of their major changes over the 40 years' time series. They were thus selected as predictor's variable for the GAMs analysis, the responses variables selected being the scores of the PCoA axis 1 and 2 (that were reflecting the community structure temporal changes), the diversity metrics of the protistan communities and the richness and relative abundances of the 11 most abundant protistan groups and the Cyanobacteria abundance. The GAMs analysis showed that PC1geo and spring snow loss explained together 86 and 49% of changes in, respectively, PCoA axis 1 and PCoA axis 2 (Figure 5; Figure S6). Their contributions to changes in the biological community, were detected mainly during the late-80s/mid-90s (for both predictors) and mid-2000s (for PC1geo only), concomitantly with an increase of total richness and the occurrence of abundant OTUs within Chlorophyta and Dinophyceae showing that they were the main drivers of community structure changes at these change points, more particularly the PC1geo while spring snow loss appear to have weak or no effect on shaping the community. Thus, the decrease of terrestrial inputs from the early-80s, and even stronger decline in the mid-90s and mid-2000s, was a key factor shaping Nylandssjön microbial community within the 40-year period studied.
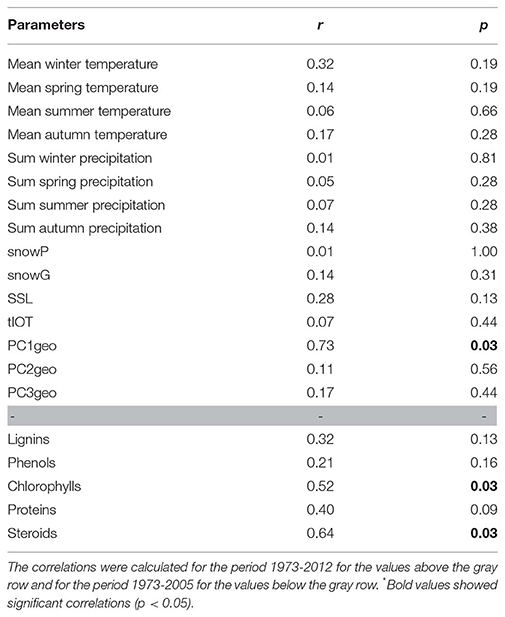
Table 2. Correlations between the community structure and environmental parameters calculated using the env.fit function.
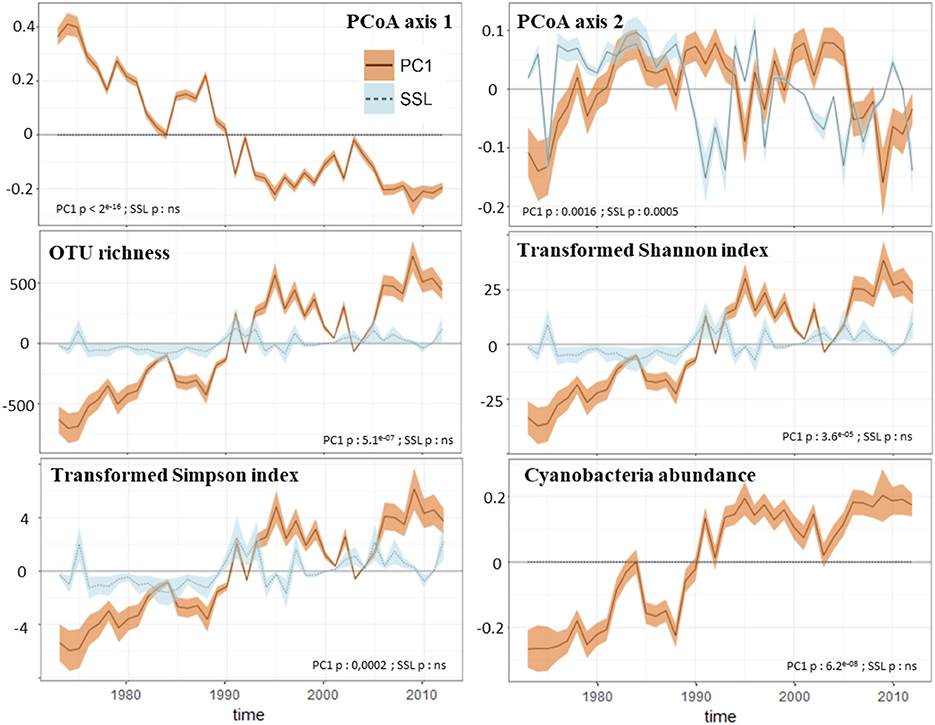
Figure 5. GAMs analysis results of the microbial community. The figure presents the contribution (lines) of PC1 (PC1geo-scores, brown values) and SSL (percentage of spring snow loss, light blue values) to the temporal changes in response variables. The shaded bands are 95% confidence intervals on the estimated effect. These intervals do not correct for multiple comparisons and have <95% coverage over the whole time series. The response variables selected are structure indices of the protistan community (values of the first and second axes of the PCoA plot), diversity metrics of the protistan community (Hill's numbers) and the Cyanobacteria abundance. Significant correlations with predictors are shown for each response variable.
We have considered the occurrence of alternative stable states, as conceptualized in Beisner et al. (2003), in Nylandssjön's microbial community in relation to environmental disturbance. We suggest that the presence of consecutive years with low spring snow loss and thus low inputs of terrestrial material caused a shift in the structure, diversity and composition of the community from late-80s followed by a resilience period to the mid-90s (Figures 2, 3). As defined by Shade et al. (2012), environmental conditions may have acted as a press disturbance on the lake community that reached a break point in late-80s. The short period of change is particularly marked by the decrease of Chlorophyta relative abundance in favor of unclassified taxa from Alveolata and Stramenopiles groups (note that the OTUs from those two last groups were not clearly identified due to incomplete coverage in the reference DNA sequence databases). Interestingly, Apicomplexa becomes highly abundant in this period, but never before or after. Little is known about the ecology of Apicomplexa in lakes except their capability to be fish parasites (e.g., Whipps et al., 2012), and changes in fish populations may also have enhanced such a shift in the trophic network. After the mid-1990s (i.e., end of the resilience period), we may have recorded a new stable state marked by the increase of Chlorophyta relative abundance as well as Dinophyceae, this last taxonomic group being not abundant before the resilience period.
The mid-2000s is marked by the increase of photosynthetic groups such as Scenedesmaceae (within Chlorophyta), Dinophyceae (unclassified and may thus also be heterotrophic taxa) and Cyanobacteria. Consistent with this, the varve deposited in 2006 visually appears enriched in algal matter given its strong green color (Figure 1). Altogether, these results highlight the presence of unidirectional changes in the phytoplanktonic community during this time period (as shown by the PCoA plot, Figure 3). While snow phenology appears to be one of the driver of community change—as this change was related to modifications of terrestrial inputs—the lake ice phenology, identified by the presence of several years of early lake ice-off in the 2000s, is a second factor that may have indirectly shaped the temporal dynamics of Nylandssjön's aquatic community. This is consistent with studies that have highlighted the winter/spring transition as a key event for the temporal dynamics of aquatic communities (Lizotte, 2008; Salmi and Salonen, 2016; Grosbois et al., 2017; Hampton et al., 2017; Warner et al., 2018; Maier et al., 2019). The increases of the recurrence of such environmental changes (e.g., early lake ice off, low spring snow loss) and their consequences on Nylandssjön's phytoplanktonic community may be early warnings of the current warming. These factors could result in an increased occurrence and intensity of algal blooms in this lake, a phenomenon already well known to occur in various type of lakes (Paerl and Huisman, 2008; Kosten et al., 2012; Posch et al., 2012).
Due to increasing global warming, a better understanding of the role of climate in past and current changes in lake ecosystems is of key interest. For instance, Capo et al. (2016) showed that protistan communities were driven by the large climatic fluctuations over the last 2000 years, including the Medieval Warm Period, the Little Ice Age and current warming. The long-term effects of an increasing warming trend on phytoplanktonic groups was also shown for several peri-alpines lakes at a centennial timescale (Capo et al., 2017a; Monchamp et al., 2018). However, our findings suggest that the high inter-annual variability of key environmental variables (e.g., weather, snow and ice phenology, terrestrial inputs) may dominate relative to those from global climatic pressures in the Nylandssjön 40-year record. This highlights the limit of drawing firm conclusions concerning drivers of environmental and biological changes at an annual or even sub-annual resolution, and suggests the necessity to study even longer time periods to reveal the effects of climate change.
Anthropogenic pressures, including agriculture and forestry, are identified in the literature as major forcing factors for lake aquatic communities (Jeppesen et al., 2000; Paerl, 2006; Ibelings et al., 2007; Dubois et al., 2018). Although Nylandssjön has not experienced a clear eutrophication, the increase of Chlamydomonaceae in the early-80s may be linked to the transition of local agriculture practices from old-style farming (i.e., natural manure) to industrial farming (with the use of fertilizers) in the late-70s (from 1978 according to information provided by local farmers). This is coherent with the knowledge of the relationships between P concentration and Chlorophyta abundance (Naselli-Flores and Barone, 2000; Soares et al., 2013). Furthermore, using sed-DNA analysis, Capo et al. (2017a) showed significant correlations between high P concentrations (up to 80 μg.L−1) and Chlorophyta abundance and more particularly within the Chlamydomonaceae family. Despite the correlations between PC3geo scores (reflecting changes in P concentrations in sediments) and biological parameters (e.g., diversity metrics of protistan communities), the effects of this local anthropogenic pressures on aquatic communities appear to be overshadowed by the effects of terrestrial inputs in Nylandssjön.
The temporal dynamics of Nylandssjön's biological community appear to be driven mainly by the modifications of the inputs of terrestrial matter in the lake that changed between years due to weather variability. Such findings may prevent the use of annual and sub-annual data to predict the changes of biological communities in response to relatively long-term pressures such as climate change or eutrophication. This may be even more important in boreal and arctic lakes in which the snow phenology is a key factor regulating this underlying factor. While calibrations are still required to validate the use of sed-DNA signals as a reflection of the past, as largely discussed in previous papers (Capo et al., 2015, 2017b; Domaizon et al., 2017), this study confirms the potential of sed-DNA to address specific ecological questions. The data here provide evidence about a key time point of changes in boreal lake biological communities: the winter/spring transition, previously shown to affect diatom community (Warner et al., 2018; Maier et al., 2019). The field of microbial ecology would also benefit from DNA-based studies that compare the temporal dynamics of lake communities over contrasting time scales (from days to millennia) to improve our understanding of their adaptive responses to a changing environment.
CB, ID, and EC designed and supervised the study. EC, JR, and JT performed the lab work for the sed-DNA based analysis, inorganic geochemistry, and organic geochemistry, respectively and provided input to the interpretation of results and contributed to the writing of the manuscript. DD provided inputs for bioinformatics. All authors contributed to the revision of the manuscript, read, and approved the submitted version.
Funding for this project was provided by a grant from the Région Rhône-Alpes, the EC2CO INSU program (France) supporting the program REPLAY and the Swedish Research Council (VR, contract nr. 90432301).
The authors declare that the research was conducted in the absence of any commercial or financial relationships that could be construed as a potential conflict of interest.
We thank Cécile Chardon for her technical help in molecular biology and Pr Gesa Weyhenmeyer for her guidance to model lake ice-off timing from meteorological data. We also thank the Région Rhône-Alpes for their financial support of the Ph.D. thesis of EC through the ARC Environnement as well as the Umeå Plant Science Center for making the Py–GC–MS available to us. We are grateful for the useful comments and suggestions from the two reviewers and the Associate Editor, Gavin L. Simpson.
The Supplementary Material for this article can be found online at: https://www.frontiersin.org/articles/10.3389/fevo.2019.00245/full#supplementary-material
Beisner, B., Haydon, D., and Cuddington, K. (2003). Alternative stable states in ecology. Front. Ecol. Environ. 1, 376–382. doi: 10.1890/1540-9295(2003)001[0376:ASSIE]2.0.CO;2
Capo, E., Debroas, D., Arnaud, F., and Domaizon, I. (2015). Is planktonic diversity well recorded in sedimentary DNA? Toward the reconstruction of past protistan diversity. Microb. Ecol. 70, 865–875. doi: 10.1007/s00248-015-0627-2
Capo, E., Debroas, D., Arnaud, F., Guillemot, T., Bichet, V., Millet, L., et al. (2016). Long-term dynamics in microbial eukaryotes communities : a palaeolimnological view based on sedimentary DNA. Mol. Ecol. 25, 5925–5943. doi: 10.1111/mec.13893
Capo, E., Debroas, D., Arnaud, F., Perga, M.-E., Chardon, C., and Domaizon, I. (2017b). Tracking a century of changes in microbial eukaryotic diversity in lakes driven by nutrient enrichment and climate warming. Environ. Microbiol. 19, 2873–2892. doi: 10.1111/1462-2920.13815
Capo, E., Domaizon, I., Maier, D., Debroas, D., and Bigler, C. (2017a). To what extent is the DNA of microbial eukaryotes modified during burying into lake sediments? A repeat-coring approach on annually laminated sediments. J. Paleolimnol. 58, 479–495. doi: 10.1007/s10933-017-0005-9
Caron, D. A., Worden, A. Z., Countway, P. D., Demir, E., and Heidelberg, K. B. (2009). Protists are microbes too: a perspective. ISME J. 3, 4–12. doi: 10.1038/ismej.2008.101
Carpenter, S. R., Ludwig, D., and Brock, W. A. (1999). Management of eutrophication for lakes subject to potentially irreversible change. Ecol. Appl. 9, 751–771. doi: 10.1890/1051-0761(1999)009[0751:MOEFLS]2.0.CO;2
Cram, J. A., Chow, C.-E. T., Sachdeva, R., Needham, D. M., Parada, A. E., Steele, J. A., et al. (2015). Seasonal and interannual variability of the marine bacterioplankton community throughout the water column over ten years. ISME J. 9, 563–580. doi: 10.1038/ismej.2014.153
Dawdy, D. R., and Matalas, N. C. (1964). “Statistical and probability analysis of hydrologic data, part III: analysis of variance, covariance and time series,” in Handbook of Applied Hydrology, a Compendium of Water-Resources Technology, ed C. VenTe (New York, NY: McGraw-Hill Company), 8–68.
Debroas, D., Domaizon, I., Humbert, J.-F., Jardillier, L., Lepère, C., Oudart, A., et al. (2017). Overview of freshwater microbial eukaryotes diversity: a first analysis of publicly available metabarcoding data. FEMS Microbiol. Ecol. 93, 1–14. doi: 10.1093/femsec/fix023
Debroas, D., Hugoni, M., and Domaizon, I. (2015). Evidence for an active rare biosphere within freshwater protists community. Mol. Ecol. 24, 1236–1247. doi: 10.1111/mec.13116
Domaizon, I., Winegardner, A., Capo, E., Gauthier, J., and Gregory-Eaves, I. (2017). DNA-based methods in paleolimnology: new opportunities for investigating long-term dynamics of lacustrine biodiversity. J. Paleolimnol. 58, 1–21. doi: 10.1007/s10933-017-9958-y
Dubois, N., Saulnier-Talbot, É., Mills, K., Gell, P., Battarbee, R., Bennion, H., et al. (2018). First human impacts and responses of aquatic systems: a review of palaeolimnological records from around the world. Anthr. Rev. 5, 28–68. doi: 10.1177/2053019617740365
Edgar, R. C. (2013). UPARSE: highly accurate OTU sequences from microbial amplicon reads. Nat. Methods 10, 996–998. doi: 10.1038/nmeth.2604
Edgar, R. C., Haas, B. J., Clemente, J. C., Quince, C., and Knight, R. (2011). UCHIME improves sensitivity and speed of chimera detection. Bioinformatics 27, 2194–2200. doi: 10.1093/bioinformatics/btr381
Fabbri, D., Adamiano, A., Falini, G., De Marco, R., and Mancini, I. (2012). Analytical pyrolysis of dipeptides containing proline and amino acids with polar side chains. Novel 2,5-diketopiperazine markers in the pyrolysates of proteins. J. Anal. Appl. Pyrolysis 95, 145–155. doi: 10.1016/j.jaap.2012.02.001
Filker, S., Sommaruga, R., Vila, I., and Stoeck, T. (2016). Microbial eukaryote plankton communities of high-mountain lakes from three continents exhibit strong biogeographic patterns. Mol. Ecol. 25, 2286–2301. doi: 10.1111/mec.13633
Fuhrman, J. A., Cram, J. A., and Needham, D. M. (2015). Marine microbial community dynamics and their ecological interpretation. Nat. Rev. Microbiol. 13, 133–146. doi: 10.1038/nrmicro3417
Gälman, V., Petterson, G., and Renberg, I. (2006). A comparison of sediment varves (1950–2003 AD) in two adjacent lakes in northern sweden. J. Paleolimnol. 35, 837–853. doi: 10.1007/s10933-005-5952-x
Gälman, V., Rydberg, J., and Bigler, C. (2009). Decadal diagenetic effects on d13C and d15N studied in varved lake sediment. Limnol. Oceanogr. 54, 917–924. doi: 10.4319/lo.2009.54.3.0917
Gast, R. J., Dennett, M. R., and Caron, D. A. (2004). Characterization of protistan assemblages in the ross sea, antarctica, by denaturing gradient gel electrophoresis. Appl. Environ. Microbiol. 70, 2028–2037. doi: 10.1128/AEM.70.4.2028-2037.2004
Giner, C. R., Balagu,é, V., Krabberød, A. K., Ferrera, I., Re,ñé, A., Garcés, E., et al. (2018). Quantifying long-term recurrence in planktonic microbial eukaryotes. Mol. Ecol. 28, 923–935. doi: 10.1111/mec.14929
Grosbois, G., Mariash, H., Schneider, T., and Rautio, M. (2017). Under-ice availability of phytoplankton lipids is key to freshwater zooplankton winter survival. Sci. Rep. 7:11543. doi: 10.1038/s41598-017-10956-0
Hampton, S. E., Galloway, A. W., Powers, S. M., Ozersky, T., Woo, K. H., Batt, R. D., et al. (2017). Ecology under lake ice. Ecol. Lett. 20, 98–111. doi: 10.1111/ele.12699
Hastie, T., and Tibshirani, R. (1986). Generalized additive models. Stat. Sci. 1, 297–310. doi: 10.1214/ss/1177013604
Hsieh, T. C., Ma, K. H., and Chao, A. (2016). iNEXT: an R package for interpolation and extrapolation of species diversity (Hill numbers). Methods Ecol. Evol. 7, 1451–1456. doi: 10.1111/2041-210X.12613
Huot, Y., Babin, M., Bruyant, F., Grob, C., Twardowski, M. S., and Claustre, H. (2007). Does chlorophyll a provide the best index of phytoplankton biomass for primary productivity studies? Biogeosci. Discuss. 4, 707–745. doi: 10.5194/bgd-4-707-2007
Ibelings, B. W., Portielje, R., Lammens, E. H. R. R., Noordhuis, R., Van Den Berg, M. S., Joosse, W., et al. (2007). Resilience of alternative stable states during the recovery of shallow lakes from eutrophication: Lake Veluwe as a case study. Ecosystems 10, 4–16. doi: 10.1007/s10021-006-9009-4
Ishiwatari, M., Ishiwatari, R., Sakashita, H., Tatsumi, T., and Tominaga, H. (1991). Pyrolysis of chlorophyll a after preliminary heating at a moderate temperature: Implications for the origin of prist-1-ene on kerogen pyrolysis. J. Anal. Appl. Pyrolysis 18, 207–218. doi: 10.1016/0165-2370(91)87002-4
James, N. A., and Matteson, D. S. (2013). ecp: An R Package for Nonparametric Multiple Change Point Analysis of Multivariate Data. Available online at: http://arxiv.org/abs/1309.3295 (accessed November 8, 2018).
Jeppesen, E., Jensen, J. P., Sondergaard, M., Lauridsen, T., and Landkildehus, F. (2000). Trophic structure, species richness and biodiversity in Danish lakes: changes along a phosphorus gradient. Freshw. Biol. 45, 201–218. doi: 10.1046/j.1365-2427.2000.00675.x
Kosten, S., Huszar, V. L. M., Bécares, E., Costa, L. S., Donk, E., Hansson, L.-A., et al. (2012). Warmer climates boost cyanobacterial dominance in shallow lakes. Glob. Chang. Biol. 18, 118–126. doi: 10.1111/j.1365-2486.2011.02488.x
Lizotte, M. (2008). “Phytoplankton and primary production,” in Polar Lakes and Rivers: Limnology of Arctic and Antarctic Aquatic Ecosystems, eds W. F. Vincent and J. Laybourn-Parry (Oxford: Oxford University Press), 157–178.
Maier, D. (2017). Combining Limnology and Paleolimnology: A Refined Understanding of Environmental Sediment Signal Formation in a Varved Lake. Available online at: http://www.diva-portal.org/smash/record.jsf?pid=diva2:1097345
Maier, D., Diehl, S., and Bigler, C. (2019). Inter-annual variation in seasonal diatom sedimentation reveals the importance of late winter processes and their timing for sediment signal formation. Limnol. Ocean. 64, 1186–1199. doi: 10.1002/lno.11106
Meyers, P. A., and Ishiwatari, R. (1993). Lacustrine organic geochemistry—an overview of indicators of organic matter sources and diagenesis in lake sediments. Org. Geochem. 20, 867–900. doi: 10.1016/0146-6380(93)90100-P
Monchamp, M. E., Spaak, P., Domaizon, I., Dubois, N., Bouffard, D., and Pomati, F. (2018). Homogenization of lake cyanobacterial communities over a century of climate change and eutrophication. Nat. Ecol. Evol. 2, 317–324. doi: 10.1038/s41559-017-0407-0
Moss, B. (2012). Cogs in the endless machine: Lakes, climate change and nutrient cycles: a review. Sci. Total Environ. 434, 130–142. doi: 10.1016/j.scitotenv.2011.07.069
Mukherjee, I., Hodoki, Y., and Nakano, S. (2017). Seasonal dynamics of heterotrophic and plastidic protists in the water column of Lake Biwa, Japan. Aquat. Microb. Ecol. 80, 123–137. doi: 10.3354/ame01843
Naselli-Flores, L., and Barone, R. (2000). Phytoplankton dynamics and structure : a comparative analysis in natural and man-made water bodies of different trophic state. Hydrobiologia 438, 65–74. doi: 10.1023/A:1004109912119
Newton, R. J., Jones, S. E., Eiler, A., McMahon, K. D., and Bertilsson, S. (2011). A guide to the natural history of freshwater lake bacteria. Microbiol. Mol. Biol. Rev. 75, 14–49. doi: 10.1128/MMBR.00028-10
Nguyen, R. T., Harvey, H. R., Zang, X., van Heemst, J. D., Hetényi, M., and Hatcher, P. G. (2003). Preservation of algaenan and proteinaceous material during the oxic decay of Botryococcus braunii as revealed by pyrolysis-gas chromatography/mass spectrometry and 13C NMR spectroscopy. Org. Geochem. 34, 483–497. doi: 10.1016/S0146-6380(02)00261-9
Ninnes, S., Tolu, J., Meyer-Jacob, C., Mighall, T. M., and Bindler, R. (2017). Investigating molecular changes in organic matter composition in two Holocene lake-sediment records from central Sweden using pyrolysis-GC/MS. J. Geophys. Res. Biogeosciences 122, 1423–1438. doi: 10.1002/2016JG003715
Oksanen, A. J., Blanchet, F. G., Kindt, R., Legendre, P., Minchin, P. R., Hara, R. B. O., et al. (2015). The vegan Package. Community Ecology Package. Available online at: http://CRAN.R-project.org/package=vegan
Paerl, H. W. (2006). Assessing and managing nutrient-enhanced eutrophication in estuarine and coastal waters: interactive effects of human and climatic perturbations. Ecol. Eng. 26, 40–54. doi: 10.1016/j.ecoleng.2005.09.006
Paerl, H. W., and Huisman, J. (2008). Climate. Blooms like it hot. Science 320, 57–58. doi: 10.1126/science.1155398
Peinerud, E., Ingri, J., and Pontér, C. (2001). Non-detrital Si concentrations as an estimate of diatom concentrations in lake sediments and suspended material. Chem. Geol. 177, 229–239. doi: 10.1016/S0009-2541(00)00378-8
Petterson, G., Renberg, I., de Luna, S. S., Arnqvist, P., and John Anderson, N. (2010). Climatic influence on the inter-annual variability of late-Holocene minerogenic sediment supply in a boreal forest catchment. Earth Surf. Process. Landforms 35, 390–398. doi: 10.1002/esp.1933
Posch, T., Köster, O., Salcher, M. M., and Pernthaler, J. (2012). Harmful filamentous cyanobacteria favoured by reduced water turnover with lake warming. Nat. Clim. Chang. 2, 809–813. doi: 10.1038/nclimate1581
Princiotta, S. D., and Sanders, R. W. (2017). Heterotrophic and mixotrophic nanoflagellates in a mesotrophic lake: abundance and grazing impacts across season and depth. Limnol. Oceanogr. 62, 632–644. doi: 10.1002/lno.10450
Pruesse, E., Quast, C., Knittel, K., Fuchs, B. M., Ludwig, W., Peplies, J., et al. (2007). SILVA: a comprehensive online resource for quality checked and aligned ribosomal RNA sequence data compatible with ARB. Nucleic Acids Res. 35, 7188–7196. doi: 10.1093/nar/gkm864
Renberg, I. (1981). Improved methods for sampling, photographing and varve-counting of varved lake sediments. Boreas 10, 255–258. doi: 10.1111/j.1502-3885.1981.tb00486.x
Renberg, I. (1986). Photographic demonstration of the annual nature of a varve type common in N. Swedish lake sediments. Hydrobiologia 140, 93–95. doi: 10.1007/BF00006731
Romero-Viana, L., Juli,à, R., Camacho, A., Vicente, E., and Miracle, M. R. (2008). Climate signal in varve thickness: Lake La Cruz (Spain), a case study. J. Paleolimnol. 40, 703–714. doi: 10.1007/s10933-008-9194-6
Rühland, K. M., Paterson, A. M., and Smol, J. P. (2015). Lake diatom responses to warming: reviewing the evidence. J. Paleolimnol. 54, 1–35. doi: 10.1007/s10933-015-9837-3
Rydberg, J. (2014). Wavelength dispersive X-ray fluorescence spectroscopy as a fast, non-destructive and cost-effective analytical method for determining the geochemical composition of small loose-powder sediment samples. J. Paleolimnol. 52, 265–276. doi: 10.1007/s10933-014-9792-4
Rydberg, J., and Martínez-Cortizas, A. (2014). Geochemical assessment of an annually laminated lake sediment record from northern Sweden: a multi-core, multi-element approach. J. Paleolimnol. 51, 499–514. doi: 10.1007/s10933-014-9770-x
Salmi, P., and Salonen, K. (2016). Regular build-up of the spring phytoplankton maximum before ice-break in a boreal lake. Limnol. Oceanogr. 61, 240–253. doi: 10.1002/lno.10214
Shade, A., Peter, H., Allison, S. D., Baho, D. L., Berga, M., Bürgmann, H., et al. (2012). Fundamentals of microbial community resistance and resilience. Front. Microbiol. 3:417. doi: 10.3389/fmicb.2012.00417
Sherr, E., and Sherr, B. (1988). Role of microbes in pelagic food webs: a revised concept. Limnol. Oceanogr. 33, 1225–1227. doi: 10.4319/lo.1988.33.5.1225
Simon, M., López-García, P., Deschamps, P., Moreira, D., Restoux, G., Bertolino, P., et al. (2015). Marked seasonality and high spatial variability of protist communities in shallow freshwater systems. ISME J. 9, 1941–1953. doi: 10.1038/ismej.2015.6
Simpson, G., and Anderson, N. (2009). Deciphering the effect of climate change and separating the influence of confounding factors in sediment core records using additive models. Limnol. Ocean. 54, 2529–2541. doi: 10.4319/lo.2009.54.6_part_2.2529
Simpson, G. L. (2018). Modelling palaeoecological time series using generalised additive models. Front. Ecol. Evol. 6:149. doi: 10.3389/fevo.2018.00149
Soares, E. M., Figueredo, C. C., Gücker, B., and Boëchat, I. G. (2013). Effects of growth condition on succession patterns in tropical phytoplankton assemblages subjected to experimental eutrophication. J. Plankton Res. 35, 1141–1153. doi: 10.1093/plankt/fbt061
Tolu, J., Gerber, L., Boily, J.-F., and Bindler, R. (2015). High-throughput characterization of sediment organic matter by pyrolysis–gas chromatography/mass spectrometry and multivariate curve resolution: a promising analytical tool in (paleo)limnology. Anal. Chim. Acta 880, 93–102. doi: 10.1016/j.aca.2015.03.043
Tolu, J., Rydberg, J., Meyer-Jacob, C., Gerber, L., and Bindler, R. (2017). Spatial variability of organic matter molecular composition and elemental geochemistry in surface sediments of a small boreal Swedish lake. Biogeosciences 14, 1773–1792. doi: 10.5194/bg-14-1773-2017
Tse, T. J., Doig, L. E., Tang, S., Zhang, X., Sun, W., Wiseman, S. B., et al. (2018). Combining high-throughput sequencing of sedaDNA and traditional paleolimnological techniques to infer historical trends in cyanobacterial communities. Environ. Sci. Technol. 52, 6842–6853. doi: 10.1021/acs.est.7b06386
Van de Peer, Y., Rijk, P., Wuyts, J., Winkelmans, T., and De Wachter, R. (2000). The european small subunit ribosomal RNA database. Nucleic Acids Res. 28, 175–176. doi: 10.1093/nar/28.1.175
Vuillemin, A., Ariztegui, D., Horn, F., Kallmeyer, J., and Orsi, W. D. (2018). Microbial community composition along a 50 000-year lacustrine sediment sequence. FEMS Microbiol. Ecol. 94, 1–14. doi: 10.1093/femsec/fiy029
Warner, K. A., Fowler, R., Northington, R., and Malik, H. (2018). Comparison using two years with ice-out that differed by more than three how does changing ice-out affect arctic versus ice-out that differed by more than three weeks. Water 10, 1–20. doi: 10.3390/w10010078
Weyhenmeyer, G. A., Meili, M., and Livingstone, D. M. (2004). Nonlinear temperature response of lake ice breakup. Geophys. Res. Lett. 31, 6–9. doi: 10.1029/2004GL019530
Whipps, C. M., Fournie, J. W., Morrison, D. A., Azevedo, C., and Matos, E. (2012). Phylogeny of fish-infecting Calyptospora species (Apicomplexa: Eimeriorina). Parasitol. Res. 111, 1331–1342. doi: 10.1007/s00436-012-2969-8
Wickham, H. (2016). ggplot2: Elegant Graphics for Data Analysis, ed H. Wickham. New York, NY: Springer, 9–26. doi: 10.1007/978-0-387-98141-3_2
Williamson, C. E., Saros, J. E., Vincent, W. F., and Smol, J. P. (2009). Lakes and reservoirs as sentinels, integrators, and regulators of climate change. Limnol. Oceanogr. 54, 2273–2282. doi: 10.4319/lo.2009.54.6_part_2.2273
Wood, S. (2015). Package ‘mgcv.’ Available online at: https://cran.r-project.org/web/packages/mgcv/
Keywords: varved sediment record, sedimentary DNA, protists, metabarcoding, meteorological data, inorganic geochemistry, organic proxies, paleolimnology
Citation: Capo E, Rydberg J, Tolu J, Domaizon I, Debroas D, Bindler R and Bigler C (2019) How Does Environmental Inter-annual Variability Shape Aquatic Microbial Communities? A 40-Year Annual Record of Sedimentary DNA From a Boreal Lake (Nylandssjön, Sweden). Front. Ecol. Evol. 7:245. doi: 10.3389/fevo.2019.00245
Received: 19 January 2019; Accepted: 13 June 2019;
Published: 10 July 2019.
Edited by:
Gavin L. Simpson, University of Regina, CanadaReviewed by:
Zofia Ecaterina Taranu, University of Ottawa, CanadaCopyright © 2019 Capo, Rydberg, Tolu, Domaizon, Debroas, Bindler and Bigler. This is an open-access article distributed under the terms of the Creative Commons Attribution License (CC BY). The use, distribution or reproduction in other forums is permitted, provided the original author(s) and the copyright owner(s) are credited and that the original publication in this journal is cited, in accordance with accepted academic practice. No use, distribution or reproduction is permitted which does not comply with these terms.
*Correspondence: Eric Capo, ZXJpYy5jYXBvQGhvdG1haWwuZnI=
†These authors have contributed equally to this work
Disclaimer: All claims expressed in this article are solely those of the authors and do not necessarily represent those of their affiliated organizations, or those of the publisher, the editors and the reviewers. Any product that may be evaluated in this article or claim that may be made by its manufacturer is not guaranteed or endorsed by the publisher.
Research integrity at Frontiers
Learn more about the work of our research integrity team to safeguard the quality of each article we publish.