 Tarik C. Gouhier
 Pradeep Pillai
A Commentary on
Nonlinear averaging of thermal experience predicts population growth rates in a thermally variable environment
by Bernhardt, J. R., Sunday, J. M., Thompson, P. L., and O'Connor, M. I. (2018). Proc. R. Soc. B Biol. Sci. 285:20181076. doi: 10.1098/rspb.2018.1076
Bernhardt et al. (2018) sought to determine whether historical effects associated with the temporal sequence of temperatures needed to be accounted for when predicting population growth under fluctuating temperature regimes. To do so, the authors asked the following questions: (i) Does the “fallacy of the averages” apply to algae experiencing fluctuating temperatures due to the non-linear relationship between growth and temperature? (ii) Does accounting for this non-linear relationship but not historical effects allow algal growth under fluctuating temperatures to be predicted from their growth under the relevant constant temperature conditions? (iii) How does natural temperature variability affect algal growth in populations around the globe?
To answer these questions, the authors devised an experiment whereby they exposed an algal species to a series of constant temperature regimes to determine how its growth varied as a function of temperature. They then conducted a second experiment where they exposed the same algal species to a series of fluctuating temperature regimes, each consisting of alternating, equal-length periods of low and high temperatures. Using this experimental data, the authors showed that the growth of algae exposed to fluctuating temperatures could not be predicted by their growth at the corresponding constant average temperature (the “fallacy of the averages”). However, growth under fluctuating temperatures could be predicted by taking the (non-linear) average of the growth observed under the relevant constant temperatures. The authors then went on to show how the “fallacy of the averages” could lead to biases when estimating algal growth from constant temperatures for different species around the globe.
Although this paper superficially checks all the right boxes (i.e., it ostensibly combines experiments and observations to test theory), it suffers from several fundamental issues. First and foremost, the experiment used by Bernhardt et al. was poorly designed because it was unlikely to detect the historical effects of temperature and thus unable to provide a rigorous test of the central premise of their paper: that “non-linear averaging” of constant temperature TPCs can predict growth under fluctuating temperatures. This is because the authors only tested the effects of a single type of temperature fluctuation: a square waveform whose 1-day period corresponds to the generation time of the algae (Peña and Villegas, 2005; Bernhardt et al., 2018). Hence, the fast-growing algae were very likely able to track the relatively slow temperature fluctuations, thereby preventing the emergence of any potential historical effects.
To illustrate this issue, we used simulations of a stage-structured version of the continuous-time model presented in Kremer et al. (2018) under a fluctuating temperature regime whose period was either smaller than, equal to or greater than the generation time of an organism that partially tracked temperature over time (i.e., had the potential to exhibit historical effects because of its relatively slow response to temperature variation). The growth rate of the organism, r, at each temperature as well as both the amplitude and the mean of the temperature fluctuations used in the simulations were identical to those in Bernhardt et al. The simulations show a consistent and unsurprising pattern: when the period of the fluctuations is larger than or equal to the generation time, (non-linear) averaging the growth rate observed under the relevant constant temperature regimes is more likely to accurately predict the growth rate observed under fluctuating temperatures because the organism is able to track the temperature variation (Figure 1A). However, variation in r exists, and reductions in the period of the temperature fluctuations lead to larger discrepancies between the observed population growth rate and that expected based on non-linear averaging. Here, reducing the period of the temperature fluctuations decreases the accuracy of non-linear averaging because the organism is unable to keep up with the increasingly rapid pace of the temperature changes (Figure 1A). These simulations thus show that historical effects are less likely to emerge when the period of the fluctuations is large because the organism is able to track such relatively slow temperature variation. Hence, by experimentally choosing conditions that made the emergence of historical effects less likely, Bernhardt et al. were unable to provide a robust test of the hypothesis that the temporal sequence of temperature fluctuations could be safely ignored when predicting population growth under fluctuating temperatures via non-linear averaging.
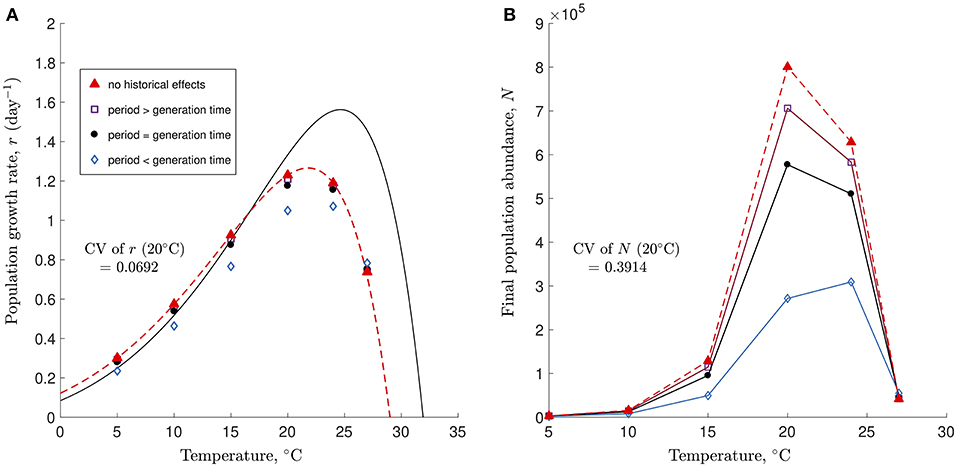
Figure 1. Simulation of a stage-structured version of the continuous-time model presented in Kremer et al. (2018) with an initial density of 500 individuals and an experiment duration of 6 days. (A) Thermal Performance Curves based on population growth rate r are shown for constant temperatures (solid line) and fluctuating temperatures based on non-linear averaging (dashed red line). Simulations were run for temperature fluctuations whose period was greater than (open squares), equal to (filled circles), or smaller than (open diamonds) the generation time of the organism. Filled triangles falling on the dashed line (non-linear averaging curve) are for simulations with no historical effects. The acclimatization rate was set to σ = 10 (simulations with a slower acclimatization rate of σ = 0.8 were qualitatively identical, with the points being slightly more spread-out vertically). (B) Final abundances from the same simulations show the extreme variation in N (orders of magnitude). Coefficients of variation (CV) for r and N across all temperature fluctuation periods at 20°C shown in (A,B).
Even if historical effects could emerge despite the use of a single long-period fluctuation, additional critical issues in both the experimental design and the statistical properties of the metric used to assess organismal performance would have made their detection unlikely. Indeed, Bernhardt et al. grew their algae at 16°C for 1 year and then conducted both their 7-day constant and variable temperature experiments without acclimatizing their organism, a procedure that is not standard even in studies focusing on quantifying the effects of acute temperature change (Kremer et al., 2018). This means that their constant temperature regime was not actually constant. Instead, it represented a single “asymmetrical” temperature fluctuation with a very large period (365 days at 16°C followed by 7 days at a new constant temperature). Additionally, their variable temperature regime consisted of two different temperature fluctuations with distinct periods: the same “asymmetrical” large period temperature fluctuation that was present in the constant treatment (365 days at 16°C followed by 7 days of fluctuations around a new average temperature) and a small 1-day period fluctuation. Hence, it is likely that the fluctuation with the large period, which was a hidden treatment common to both the constant and the variable temperature regimes, masked the effects of the small period fluctuations, thus making it more likely that (non-linear) averaging growth under constant temperatures would accurately predict growth under variable temperatures. Finally, the use of the average population growth rate r as a metric for determining the accuracy of non-linear averaging under variable temperatures is problematic because small differences in these rates can mask extremely large differences in population densities between the constant and variable temperature regimes (Figure 1B).
Hence, although Bernhardt et al. sought to explicitly test whether historical effects could be ignored when predicting population growth rate under variable temperature regimes via non-linear averaging, the suite of experimental and statistical issues outlined above led them instead to implicitly test a set of trivial hypotheses. Specifically, by preventing the emergence of historical effects, Bernhardt et al.'s experiment ended up being reduced to a test of the “fallacy of the averages” and the accuracy of “non-linear averaging,” which are not testable hypotheses but mathematical inevitabilities associated with the properties of the arithmetic mean. For instance, the “fallacy of the averages” is a direct consequence of Jensen's inequality (Jensen, 1906) which states that if f(x) is a non-linear function of x, then the function of the average is not equal to the average of the function . This is because the additivity and homogeneity properties defining linear functions do not hold for non-linear functions, so the order of the operations matters: averaging and then taking the function is not the same as taking the function and then averaging. Hence, the only way for the “fallacy of the averages” not to play-out in these experiments is for algal growth f(x) to be a linear function of temperature x. In that case, linearity would ensure that the order of the operations does not matter so the function of the average would be equal to the average of the function . However, decades of research on thermal performance across a multitude of organisms and environments demonstrates that the relationship between growth and temperature is almost universally non-linear (specifically unimodal and asymmetrical). Hence, contrary to the authors' claims, the “fallacy of the averages” does not represent a hypothesis that needs to be tested but an inevitable result that was already well-established and whose implications for the field of ecology were reviewed over 20 years ago (Ruel and Ayres, 1999).
The second hypothesis, which posits that non-linear averaging accurately predicts growth under fluctuating temperatures, is equally flawed. This is because the “fallacy of the averages” and “non-linear averaging” are not independent hypotheses but complements. Hence, if not accounting for the non-linear relationship between growth and temperature ensures inaccurate predictions due to the “fallacy of the averages,” then accounting for it via non-linear averaging guarantees accurate predictions in the absence of historical effects. Indeed, non-linear averaging amounts to nothing more than taking the arithmetic mean of a non-linear function, and the arithmetic mean applies equally well to linear and non-linear functions. In this case, if an organism's growth is f(x1) under constant temperature x1 and f(x2) under constant temperature x2, then its average growth under a variable temperature regime consisting of two time periods of equal length characterized by temperatures x1 and x2, respectively, will simply be the arithmetic mean . This will be true regardless of the non-linearity of function f(x) with respect to temperature x. Hence, in the absence of historical effects, there was never any doubt that (non-linear) averaging algal growth under the relevant constant temperature regimes would accurately predict algal growth under fluctuating temperatures. Framing the results of the experiment in terms of Jensen's inequality simply served to obscure their obvious and trivial nature. Overall, this entire exercise boils down to (1) selecting a biological function that is known to be non-linear so that the order of the operations matters, (2) performing the operations in the wrong order and thus getting the wrong results (“fallacy of the averages”), and then (3) performing the operations in the right order and thus getting the right results (“non-linear averaging”).
The only way that the outcome of the experiment could have been interesting is if the predicted mean growth under variable temperatures were not equal to the arithmetic mean of the growth observed under the relevant constant temperature regimes. This could happen if temperature fluctuations had sufficiently large historical effects so as to shift the growth curve from f(x) under constant temperatures to g(x) under variable temperatures. Here, the predictions could fail because one would be applying the arithmetic mean to function f(x) in order to estimate the mean of function g(x). However, the authors ensured that this would not be likely by selecting an organism with a high growth rate and a short generation time relative to the period of the temperature fluctuations. This and other experimental decisions ensured the triviality of their results.
The final issue with the paper is that the authors used non-linear averaging to show how variable temperatures are likely to affect growth in several algal species around the globe. However, these results are based on the assumption that temperature is the sole driver of growth. Their approach does not account for differences in food availability or other factors such as light limitation that are likely to affect growth. These results thus constitute a trivial “proof” that non-linear averaging can predict growth under the assumptions that (1) temperature is the rate limiting step with respect to growth and (2) that historical effects are completely absent. Although the authors acknowledged some of these issues and thus referred to their results as “first-order predictions,” they failed to recognize the extent and severity of the limitations inherent in their approach. At best, their results provide unnecessary “strategic” evidence for the “fallacy of the averages” and the accuracy of non-linear averaging, both of which are well-established and widely understood mathematical laws. At worst, they provide inaccurate and downright misleading “tactical” predictions about the particularities of algal growth that fail to account for other biotic and abiotic factors. In other words, these predictions are not even useful as null hypotheses.
Overall, this paper represents an atypical use of mathematics in the natural sciences. In general, it is perfectly valid to conduct experiments in order to test model predictions because the latter make simplifying assumptions about the natural world that can lead to systematic discrepancies between theory and reality. However, Jensen's inequality and non-linear averaging are not theoretical models or hypotheses, but simple mathematical properties of the arithmetic mean whose inescapability makes them untestable in the classical sense. For hypotheses to be useful, they must have a non-zero probability of being false. Otherwise, such hypotheses are merely trivial inevitabilities masquerading as scientific uncertainties.
Author Contributions
TG and PP co-wrote the manuscript.
Conflict of Interest Statement
The authors declare that the research was conducted in the absence of any commercial or financial relationships that could be construed as a potential conflict of interest.
Acknowledgments
We acknowledge support from the National Science Foundation (OCE-1458150, OCE-1635989, and CCF-1442728).
References
Bernhardt, J. R., Sunday, J. M., Thompson, P. L., and O'Connor, M. I. (2018). Nonlinear averaging of thermal experience predicts population growth rates in a thermally variable environment. Proc. R. Soc. B Biol. Sci. 285:20181076. doi: 10.1098/rspb.2018.1076
Jensen, J. L. W. V. (1906). Sur les fonctions convexes et les inégalités entre les valeurs moyennes. Acta Math. 30, 175–193. doi: 10.1007/BF02418571
Kremer, C. T., Fey, S. B., Arellano, A. A., and Vasseur, D. A. (2018). Gradual plasticity alters population dynamics in variable environments: thermal acclimation in the green alga Chlamydomonas reinhartdii. Proc. R. Soc. B Biol. Sci. 285:20171942. doi: 10.1098/rspb.2017.1942.
Peña, M. R., and Villegas, C. T. (2005). Cell growth, effect of filtrate and nutritive value of the tropical Prasinophyte Tetraselmis tetrathele (Butcher) at different phases of culture. Aquac. Res. 36, 1500–1508. doi: 10.1111/j.1365-2109.2005.01371.x.
Keywords: non-linear averaging, historical effects, Jensen's inequality, temperature fluctuations, thermal performance curve, trivial pursuits
Citation: Gouhier TC and Pillai P (2019) Commentary: Nonlinear averaging of thermal experience predicts population growth rates in a thermally variable environment. Front. Ecol. Evol. 7:236. doi: 10.3389/fevo.2019.00236
Received: 06 April 2019; Accepted: 06 June 2019;
Published: 21 June 2019.
Edited by:
Su Wang, Beijing Academy of Agricultural and Forestry Sciences, ChinaReviewed by:
Sergio Andrés Estay, Austral University of Chile, ChileCopyright © 2019 Gouhier and Pillai. This is an open-access article distributed under the terms of the Creative Commons Attribution License (CC BY). The use, distribution or reproduction in other forums is permitted, provided the original author(s) and the copyright owner(s) are credited and that the original publication in this journal is cited, in accordance with accepted academic practice. No use, distribution or reproduction is permitted which does not comply with these terms.
*Correspondence: Tarik C. Gouhier, dGFyaWsuZ291aGllckBnbWFpbC5jb20=