 Stephen J. Dinsmore
 Rachel A. Vanausdall
 Kevin T. Murphy
 Karen E. Kinkead
 Paul W. Frese
94% of researchers rate our articles as excellent or good
Learn more about the work of our research integrity team to safeguard the quality of each article we publish.
Find out more
ORIGINAL RESEARCH article
Front. Ecol. Evol. , 16 May 2019
Sec. Population, Community, and Ecosystem Dynamics
Volume 7 - 2019 | https://doi.org/10.3389/fevo.2019.00169
This article is part of the Research Topic North American Monarch Butterfly Ecology and Conservation View all 35 articles
The monarch butterfly (Danaus plexippus) is the focus of large-scale habitat restoration efforts because of recent population declines. From 2006-2017 we monitored monarchs at >400 sites throughout Iowa to link site occupancy and colonization/extinction dynamics to the presence of milkweed, site-specific habitat metrics, and landscape context at differing spatial scales. We used a robust design occupancy model in Program MARK and a hierarchical model selection approach to estimate site occupancy, extinction and colonization probabilities, and detection probability. Occupancy models revealed that monarchs responded differently to landscape features, environmental conditions, and local habitat conditions for site occupancy, extinction, and colonization probabilities. For site occupancy, the mean patch size of grassland at the 1-km spatial scale had a positive effect (βGrassPS1K = 0.94, SE = 0.54) while the percent of the landscape in woodland at the 200-m spatial scale had a negative effect (βWoodPL200 = −1.68, SE = 0.34). For extinction, there were additive effects of the percent of the landscape in woodland at the 100-m spatial scale (βWoodPLAND100 = 2.70, SE = 0.63), the interspersion of grassland at the 1-km spatial scale (βGrassIJI1K = −2.30, SE = 0.63), and litter depth (βLitter = 0.46, SE = 0.13). Finally, there were negative effects of the percent of the landscape in woodland at the 200-m spatial scale (βWoodPLAND200 = −4.67, SE = 1.37) and the interspersion of grassland at the 100-m spatial scale (βGrassPS1K = −2.02, SE = 0.70) on colonization probability. Detection probability was affected by the additive effects of canopy cover and monarch density; no other detection model was competitive. In the top model there was a positive effect of monarch density (βDensity = 0.28, SE = 0.05) and a negative effect of canopy cover (βCanopy = −0.18, SE = 0.03) on detection probability. In Iowa, monarchs are widespread on conservation lands where they avoid sites with lots of canopy cover. Colonization and extinction processes are influenced by an interplay of landscape attributes across multiple spatial scales and site habitat attributes. Our study provides the first comprehensive insight into monarch use of conservation lands in Iowa, and predicted responses to important covariates may be useful for future conservation efforts.
The theory of Island Biogeography (MacArthur and Wilson, 1967) suggests that species diversity is a function of the processes of immigration and extinction, in addition to attributes of the habitat patch such as size (the species-area relationship) and distance from the nearest source population (the species-distance relationship). The concept of metapopulations (Levins, 1969) arose from this work to suggest how populations of the same species interact at some spatial scale. Through time, a metapopulation is generally thought to be stable while its distinct populations occupy suitable habitat patches and are subject to fluctuations resulting from the processes of extinction and colonization (Levins, 1969). Occupancy modeling estimates the probability a species is present in a habitat patch and is increasingly used as a long-term monitoring tool (MacKenzie et al., 2003; Manley et al., 2004; Bailey et al., 2007). Much work has focused on how to manage these populations for a species' long-term persistence. Some important considerations include the quality of habitat and degree of loss of habitat (Thomas, 1994), the size of the patch (Tscharntke et al., 2002), and the number and spatial arrangement of patches (Burkey, 1988; Hanski and Thomas, 1994; Hanski and Ovaskainen, 2000; Ouin et al., 2004). The spatial scale at which these effects operate is also an important consideration for butterflies (Loos et al., 2014; Olivier et al., 2016) and other pollinators (Murray et al., 2012), although few studies have addressed this topic. Understanding these processes is vital to the conservation of a species.
Efforts to manage the size of a habitat patch or the spatial arrangement of habitat patches are often not possible for economic reasons or because of land-use restrictions (Thomas, 1999; Zingg et al., 2018). Improving habitat quality in a patch is often the most feasible conservation measure available, and this applies to butterflies and also other taxa. Therefore, understanding species-habitat relationships is critical for management and conservation efforts of butterflies (Arnold, 1983; Dover and Settele, 2009). Grassland butterfly species respond to a host of local and landscape-level factors when selecting habitats for feeding and reproduction. In fragmented, agricultural landscapes such as the Midwestern U.S., butterflies must seek out patches of suitable grassland habitat from large areas of unsuitable habitat. This landscape can include native remnant grasslands (Davis et al., 2007), road right-of-ways (Ries et al., 2001), and other types of habitat patches. Attributes of these grasslands that are important include patch size (Tscharntke et al., 2002; Davis et al., 2007), permeability of the edge habitat (Ries and Debinski, 2001; Luppi et al., 2018), and measures of nectar sources and host plants (Clausen et al., 2001; Schneider and Fry, 2001; Pywell et al., 2004; Curtis et al., 2015; Luppi et al., 2018). It is also important to consider a multi-scale approach to habitat selection (McGarigal et al., 2016), although there are still relatively few examples for butterfly communities (Bergman et al., 2004; Olivier et al., 2016). Despite a widespread belief that selection factors operate at multiple spatial scales, many studies continue to consider just a single spatial scale (Bergerot et al., 2011; Öckinger et al., 2012) or use categorical local and landscape scales (Loos et al., 2014; Luppi et al., 2018). In a metapopulation context, management or conservation actions on even a subset of habitat patches may be important for a species' persistence.
The monarch butterfly (Danaus plexippus) has been the focus of intensive conservation efforts because of an estimated 80% decline in the eastern population in the last 20 years (Semmens et al., 2016; Oberhauser et al., 2017). Threats and causes for this population decline are many and include the loss and degradation of breeding habitat and resulting impacts on fecundity (Pleasants and Oberhauser, 2013; Flockhart et al., 2015; Pleasants, 2015), climate change (Zipkin et al., 2012; Zalucki et al., 2015), and threats on their wintering grounds (Oberhauser and Peterson, 2003; Brower et al., 2012). Much of the recent recovery focus has been directed at habitat restoration efforts on the breeding grounds (Thogmartin et al., 2017), especially by planting milkweed (primarily Asclepias sp.), which is the obligate host plant along with other nectar sources. Recent work suggests that most milkweed currently occurs on publicly owned grasslands, road right-of-ways, and in areas enrolled in conservation programs within the primary U.S. breeding range (Pleasants and Oberhauser, 2013; Pleasants, 2017; Thogmartin et al., 2017); the remaining milkweed occurs in marginal habitat such as agricultural fields. Adding 1.3–1.7 billion milkweed stems in the Midwestern region of the U.S. has been identified as a conservation priority to reduce quasi-extinction probability of the monarch (Pleasants et al., 2017; Thogmartin et al., 2017). This recommendation is informed by an extensive knowledge of monarch natural history (Zalucki and Kitching, 1982; Bull et al., 1985; Oberhauser, 1997; Flockhart et al., 2012; Zhan et al., 2014; Jepsen et al., 2015; Pitman et al., 2018) and emerging information about their movement patterns during the breeding season (Zalucki et al., 2016; Grant et al., 2018). Several authors have developed demographic models to predict future changes in the monarch population, ranging from full-life-cycle models (Flockhart et al., 2015; Oberhauser et al., 2017) to those restricted to just the breeding season (Yakubu et al., 2004; Flockhart et al., 2013). An additional complexity is the annual cycle of the monarch, which includes multiple generations each year that are temporally and spatially explicit but with some overlap (Nail et al., 2015). But what is needed is a greater understanding of metapopulation dynamics—what proportion of habitat patches in a region are occupied during the breeding season, and at what rates do monarchs use (“colonize”) and not use (“disappear from”) those habitat patches between years?
In this paper we describe the metapopulation dynamics of monarch butterflies at >400 public and private properties in Iowa, USA. We investigate how local- and landscape-scale factors affect site occupancy by monarchs, and how those same factors influence the probability of colonization and extinction across our sample of sites. Collectively, this information provides greater insight into how monarchs exploit habitat patches in a region of intensive agriculture, and what attributes of those patches might benefit from future conservation efforts.
We studied monarchs at public and private properties located throughout Iowa (Figure 1) as part of the Iowa Multiple Species Inventory and Monitoring (MSIM) program (Iowa Department of Natural Resources, 2016). More than 60% of Iowa is comprised of agricultural cropland, with about 13% in grassland, 7% in woodland, and 0.7% in wetland (Iowa Department of Natural Resources, 2015). The state is comprised of seven landform regions (Northwest Iowa Plains, Missouri Alluvial Plain, Western Loess Hills, Des Moines Lobe, Southern Iowa Drift Plain, Iowan Surface, Paleozoic Plateau, and Mississippi Alluvial Plain; Prior, 1991). Most of the MSIM study sites are located on public land, which encompasses only about 2% of the state. Study sites were selected using a stratified random design (Kinkead, 2006), and this process is described in further detail in Harms et al. (2014). Briefly, sites that were >97 ha were classified based upon 19 different habitat classes according to the original Iowa Wildlife Action Plan (Kinkead, 2006; Zohrer, 2006). To ensure equal representation across the entire state, we split the state into four relatively equal management districts (northeast, southeast, northwest, and southwest). Each year, sites were randomly chosen without replacement within each habitat type within each management district. We also randomly selected a subset of “permanent” sites to be surveyed every year. In addition to sites on public land, a few of the sites were located on private land and were surveyed as part of the Landowner Incentive Program (https://wsfrprograms.fws.gov/subpages/grantprograms/lip/lip.htm). Finally, a small number of sites (n = 88) were non-randomly selected for a variety of management reasons and are included in our analyses. These non-random sites were not chosen with any expectation that they were more or less likely to be occupied by monarchs, and they included a similar range of habitat types to the randomly-chosen sites. At each site, primary habitat was delineated by a 10.4-ha area in the shape of a hexagon oriented in a north-south direction. Hereafter, we refer to this area of primary habitat as the “core area,” and butterfly and habitat surveys always took place within this core area.
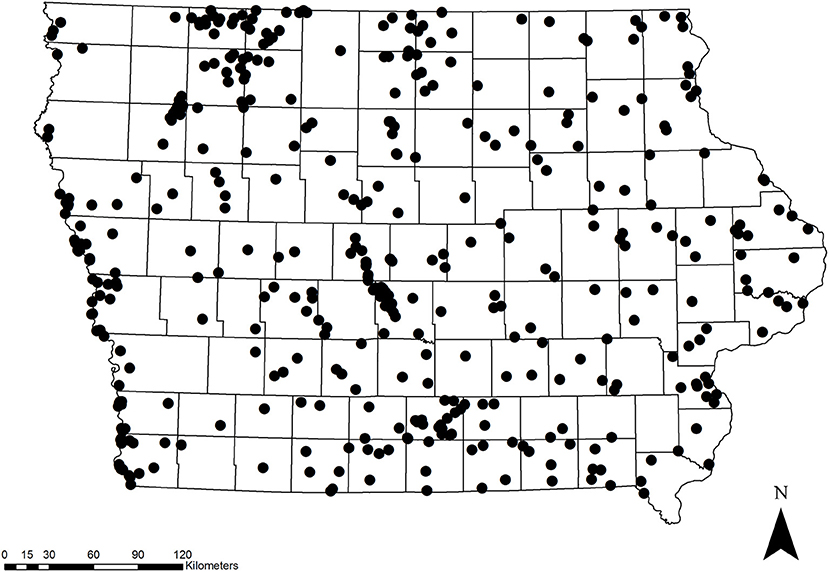
Figure 1. Location of the 417 properties that were surveyed for monarchs in Iowa, 2006-2017.
We utilized line transects to survey monarchs between 2006 and 2017 following a modified approach of Pollard and Yates (1993). These transects were used to survey all butterfly species, including monarchs. Transects were 400 m in length and mostly situated in a north-south direction so as to dissect the core habitat of the site. However, in some cases transects were placed to avoid barriers (e.g., rivers, major roads), so they were split or oriented in an east-west direction. Transects were divided into 10-m sections, resulting in 40 sections per transect. Observers slowly walked each section, taking ~1 min per section, and counted all butterflies seen within 2.5 m of each side of the transect (so a 5 m transect width). There were typically 3–5 observers every year, and observers often differed between years. Observers usually remained consistent throughout a season and received training to identify butterflies to species prior to start of surveys. We assumed that training efforts combined with the ease of identifying a monarch in the field were sufficient to minimize observer effects, which we did not consider in our models. At the beginning of each survey we recorded temperature (°C), wind speed (km/h), and percent cloud cover. We conducted surveys between 1000 h and 1830 h when the temperature was between 21 and 35°C and wind speed was < 16 km/h. For most properties we conducted four surveys between June 1 and August 31 with at least 2 weeks in between surveys, but in some years a cold spring or early summer resulted in a delay in the start of surveys and some surveys occasionally continued into September.
A primary focus of our work was to understand how site-specific habitat attributes of a site influenced monarch use. To estimate these local-scale (or habitat) variables, we conducted annual vegetation surveys during the growing season (month of August) within the core area of each site. We were interested in three local-scale variables: average litter depth (cm), frequency of milkweed, and percent canopy cover. Vegetation surveys were conducted at eight plots within the core area: six were situated at each corner of the hexagonal core area, one was placed in the center of the core area, and another was randomly chosen each year at each site. During the early years of the MSIM program, three additional plots were surveyed instead of one, but we reduced the number of plots due to time constraints. Each plot had a radius of 17.3 m and vegetation transects were established at three aspects (30°, 150°, and 270°) from the center of the plot. Different measurements were taken along each transect. For the first transect we measured litter depth (cm) at three distances (2.5, 5.0, and 7.5 m) from the center of the plot. We averaged litter depth across each of these distances for each site and year. Along the first and second transect we placed 1-m2 quadrats at 4.6 m from the plot center. We estimated the percent aerial coverage of all plants. Most plants were identified to species but some were identified only to family or genus. We identified additional plant taxa by completing a 5-min search of the entire plot after each survey. Milkweed frequency was estimated by averaging the number of the larger plots that had milkweed of any species present. Finally, we measured the presence of canopy at the four cardinal directions 7.3 m from the center of each plot. The observer did this by looking up and recording the presence or absence of any visual vegetative obstruction. Canopy cover at each site was then estimated as the frequency at which canopy was recorded as present at those four sampling points within each larger plot (Iowa Department of Natural Resources, 2016).
The local-scale habitat attributes were paired with landscape-level covariates to provide a clearer picture of how monarchs used each site. Unlike the local-scale variables, we calculated landscape-level variables using remotely-sensed data. Landscape data were calculated from the 2009 high resolution Iowa Landcover file (Ensminger et al., 2016) and analyzed using ArcMap 10.5.1 and FRAGSTATS (ver. 4.2; McGarigal et al., 2012). The 2009 Iowa Landcover file has a 3-m resolution and includes 16 landcover classifications, some of which we merged into broader categories of woodland (merged 4 classifications), grassland (merged 3 classifications), and agriculture (merged 2 classifications). We assessed all landscape covariates at four different spatial scales: 100, 200, 500 m, and 1 km. Our choice of this range of spatial scales was based on previous work illustrating how butterflies select habitat at differing scales (Bergman et al., 2004; Davis et al., 2007; Luppi et al., 2018). We generated buffers (Analysis Tools, Proximity, Buffer) at these four radii around each transect and clipped the landcover layer using the clip tool (Dana Management Tools, Raster, Raster Processing, Clip). The resulting raster layers were used in FRAGSTATS to estimate class specific covariates at each spatial scale. Specifically, we were interested in landscape metrics for “grassland,” “woodland,” and “agriculture” in the 2009 Iowa Landcover file. We were interested in six measurements for each landcover type: largest patch index (LPI), percentage of landscape (PLAND), edge density (ED), patch density (PD), mean patch size (PS), and interspersion-juxtaposition index (IJI). LPI measures the percentage of the landscape made up of the largest patch of the respective landcover type. PLAND is a measure of the percentage of the landscape made up the landcover type. ED is equal to the total length (m) of the edge of the landcover type in the landscape per ha, and PD is the number of patches in the landscape per ha. PS is the mean patch size (ha) within the landscape. IJI measures the degree of interspersion of the landcover type within all other landcover types in the landscape. High values of IJI result from landscapes in which the patch types are interspersed (i.e., equally adjacent to each other) while low values result from landscapes in which the patch types are poorly interspersed (McGarigal et al., 2012). Collectively, these metrics allowed us to characterize the landscape within which each site was situated, albeit for just a single year (2009) of classified habitat data. Remotely-sensed data were not available for all years of the study, nor were 3-m resolution data available for other years of the study than 2009. This is an important assumption of the landscape-level analyses, and we think it is reasonable because (a) the landscape classes are coarse and merge multiple landcover classes, (b) the likelihood of switching between these classes during the 12-year study seems rather small (e.g., it would be unlikely for a pixel to switch from agriculture to forest in 12 years because of limitations in plant succession), and (c) any changes that did occur were probably rare and thus unlikely to alter overall patterns. Thus, we assume this single year, situated in year four of our 13-year study, is representative of all years of the study.
We used the robust design occupancy model (MacKenzie et al., 2003) in Program MARK (White and Burnham, 1999) to examine the effects of local- and landscape-scale variables on site occupancy and dynamics of monarchs. The model data are summarized in presence-absence encounter histories and do not make use of actual counts. This model produces estimates of site occupancy (ψ) while accounting for imperfect detection (p) over multiple primary sampling occasions (i.e., years). As with single-season occupancy estimation, the assumption of population closure applies within the sampling timeframe (i.e., secondary sampling occasions) but is relaxed between primary occasions in the robust design model (MacKenzie et al., 2002, 2003). From this model we can estimate site dynamics between years. This estimation is done by calculating site extinction probability (ε, the probability a site is unoccupied at time t + 1 given that it was occupied at t), and site colonization probability (γ, the probability a site is occupied at t + 1 given that it was unoccupied at t; MacKenzie et al., 2003). We acknowledge that all monarchs disappear from a site between years because they are migratory, so the interpretation of these two parameters differs slightly from the usual explanation. Both essentially represent changes in state (occupied to unoccupied, or unoccupied to occupied) as a rate change between years. In our study, the primary sampling occasions were the years 2006 to 2017 (12 primary occasions). The secondary sampling occasions were the surveys that occurred within each year.
A major challenge for our analysis was how to best approach the closure assumption that is required for the secondary sampling occasions. The monarch has a unique life cycle that involves multiple generations produced in quick succession as the species migrates north each spring (Batalden et al., 2007). The first generation is produced in spring in the southern U.S. (generally prior to 1 June; Nail et al., 2015) and their progeny move north to Iowa and the Midwest beginning in May (Schlict et al., 2007). An additional 2–3 generations are produced in Iowa during the summer (generally mid-May through September; Nail et al., 2015), the last of which eventually migrates to Mexico to overwinter and then migrate north in the spring (Solensky, 2004). There is also annual variation in the phenology of these generations, which further complicates the problem (Nail et al., 2015). This overlap of generations technically violates closure because new individuals can emerge during the sampling period. We argue that by restricting our sampling season we can minimize this assumption violation sufficiently to result in an analysis that is of value. To meet the assumption of population closure within years, we truncated the secondary sampling occasions to just the primary breeding season of monarchs (primarily second and third generations) in Iowa, which is between 1 June and 31 August on average (see Schlict et al., 2007). This timeframe excludes most migrant monarchs from the fourth and possible fifth generations (Nail et al., 2015).
We used two parameterizations of the robust design occupancy model: one that estimates occupancy, extinction probability, and detection probability, and another that estimates occupancy, colonization probability, and detection probability. These parameterizations are necessary because the likelihood function cannot include all estimates of occupancy, extinction, and colonization in a single model that allows covariates on each parameter (MacKenzie et al., 2006). Therefore, multiple formulations must be used to have covariates on each parameter. Luckily, different formulations of the model are directly comparable using model-selection procedures (e.g., Akaike's Information Criterion; AIC) because they have the same model likelihood. For each parameter and to determine important covariates, we used a step-wise modeling approach similar to Harms et al. (2014) and evaluated models using AIC adjusted for small sample sizes (AICc; Burnham and Anderson, 2002). We examined each parameter separately and in the following order: detection probability, occupancy, then extinction, and colonization probabilities. For each parameter, a suite of models was run (see below for details about what was included and in what combinations), keeping all other parameters constant. Detection probability was first, and the best model structure for detection probability was then used in the two model formulations that allowed us to model the remaining three parameters. All analyses were done using the “RMark” package (Laake, 2013) in Program R (R Core Team, 2018).
We first modeled covariates on detection probability while keeping all other parameters constant. We were interested in the effects of wind speed, temperature, and cloud cover on detection, along with canopy cover and yearly estimates of monarch densities. Because of their small size, the activity and behavior of butterflies can be greatly impacted by environmental covariates, including temperature and wind speed (Wikström et al., 2009; Cormont et al., 2011; Bried and Pellet, 2012). For example, butterflies are not as active in cooler temperatures (Wikström et al., 2009) and there is evidence that monarchs will avoid shaded regions during the breeding season (Zalucki and Kitching, 1982). Canopy cover may also affect detection for this reason, but it may also affect the ability of observers to see monarchs. Thus, we expected temperature, cloud cover, and canopy cover to each negatively influence detection probability. Alternatively, monarchs are strong flyers and we attempted to survey on days with calm winds (< 16 km/h), so we did not expect wind speed to affect detection of monarchs. Additionally, detection probability tends to increase with an increasing number of individuals, and this has been demonstrated for several taxa, including insects (Mercader et al., 2012). We calculated a simple count, unadjusted for imperfect detection, for each year of the study as a simple index of monarch density. Counts were first averaged for all visits to a site within a year (typically four visits), and then averaged again across all sites sampled in a year. We used this as a covariate on detection probability, similar to the justification outlined by Royle and Nichols (2003) for a density-dependent effect on detections. We ran all possible combinations of single and additive covariate effect models, except that we did not include temperature and cloud cover in the same model because they were highly correlated. We used the highest-ranked model from this procedure as the detection probability structure in all further analyses.
Next, we examined the effects of three local-scale habitat covariates and five landscape-level covariates (each at four different spatial scales) on site occupancy, extinction, and colonization. We first assessed the main effects of each covariate on occupancy probability with extinction probability fixed with no effects. Because we were interested in the potential interaction between patch size and patch density, we also examined the interaction between these two metrics for each habitat variable within the same spatial scale. We identified covariates with strong (95% confidence intervals did not contain zero) coefficients. These covariates were combined into two- and three-factor additive models (four-factor for multiplicative interactions) for occupancy, but we did not include highly correlated variables (r > 0.60) in the same model. We used the top models (all those with ΔAICc < 2) for occupancy in subsequent analyses for extinction and colonization, where we used the same methods described above for the main effects and additive models. At each step for all parameters, we scrutinized the model results and removed any models with uninformative parameters or numerical convergence problems. We also excluded models from the competitive model set if they were more complicated versions of nested models (Burnham and Anderson, 2002; Devries et al., 2008; Arnold, 2010). Based on preliminary analyses and concerns about the inability of models to numerically converge, we did not consider models with more than three covariates for occupancy and four covariates for extinction and colonization. This resulted in a moderate number of models for occupancy (n = 1,217), extinction (n = 1,478), colonization (n = 2,333), and detection probability (n = 21). We used the top model from each step to evaluate predictive patterns, which we illustrated only for strong effects (e.g., those with a 95% CI that did not include zero).
For each parameter we developed specific hypotheses concerning the local and landscape effects (Table 1). We expected grassland patch metrics to be particularly important to monarchs (Jepsen et al., 2015). Not only do grasslands harbor host plants, but they provide a greater diversity of nectar sources than agricultural land or woodlands, which has been shown to have a positive effect on abundance for other butterfly species (Clausen et al., 2001; Ries et al., 2001; Pywell et al., 2004; Luppi et al., 2018). In contrast, with the increased use of herbicide-tolerant corn and soybeans, large patches and a high density of agricultural land may negatively affect occupancy and colonization. However, the edges of agricultural fields still harbor milkweeds (Pitman et al., 2018), so we expected the edges of agricultural patches to positively affect monarch occupancy and colonization. Smaller patches of agriculture also have more edge and less interior habitat relative to larger patches, so we hypothesized that agricultural patch size would also influence occupancy and colonization. This may also be true for grassland habitat. The edges of grassland habitat may be more susceptible to disturbance, which could increase the amount of milkweed. Indeed, increased patch size tends to have a negative effect on disturbance-tolerant species, such as the monarch (Davis et al., 2007; Pitman et al., 2018). We expected woodland cover to negatively affect occupancy and colonization and to increase the probability of extinction. Woodlands may not have abundant host plants compared to grasslands or agricultural edges for breeding monarch butterflies (Bhowmik and Bandeen, 1976; Pleasants, 2017). Furthermore, woodland edges tend to decrease monarch crossings when they are adjacent to prairies (Ries and Debinski, 2001), which may indicate that increased woodland within the surrounding landscape decreases colonization.
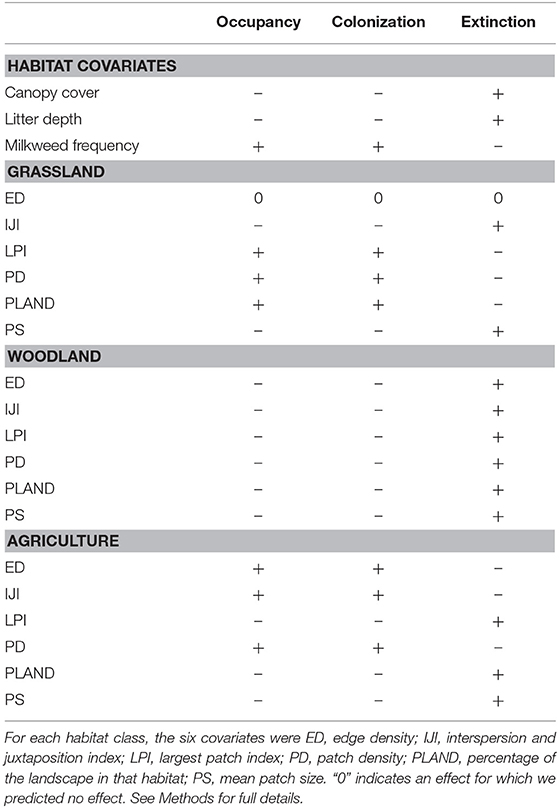
Table 1. Hypothesized effects of habitat and landscape-level covariates on the occupancy, colonization, and extinction probabilities of monarchs in Iowa, 2006–2017.
We surveyed for monarchs at 417 sites across Iowa during the 12-year study (Figure 1). The total number of site × year visits totaled 787 (Table 2; mean = 65, range was 14–126). By year, the percentage of surveyed properties with monarchs ranged from 43 to 100%, but the percentage of surveys that detected one or more monarchs was much lower and ranged from 20 to 56% (Table 2). Most properties in this study were visited just 1 year (n = 259) with fewer properties visited more years; two properties were surveyed for 11 years (Table 3). Yearly means of the three habitat covariates were variable (Table 4) with canopy cover ranging from 32 to 52%, litter depth from 1.19 to 6.10 cm, and milkweed frequency from 0 to 100%. Estimates (mean, SD, and range) for six landscape-level covariates at four spatial scales calculated using the 2009 land-cover data for Iowa showed considerable variation between grassland, woodland, and agricultural habitats (Table 5).
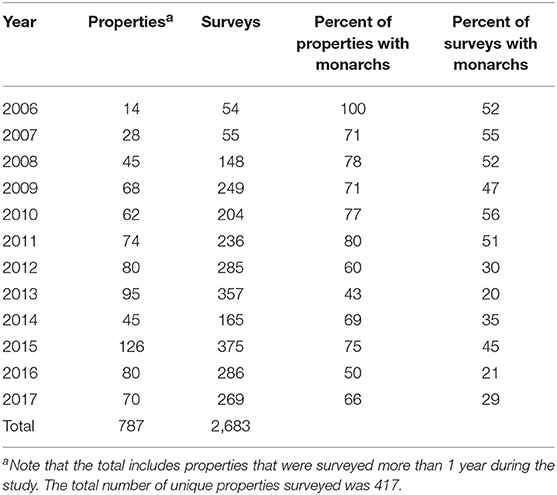
Table 2. Number of properties, number of butterfly surveys, and frequency of each with monarchs, Iowa, 2006–2017.
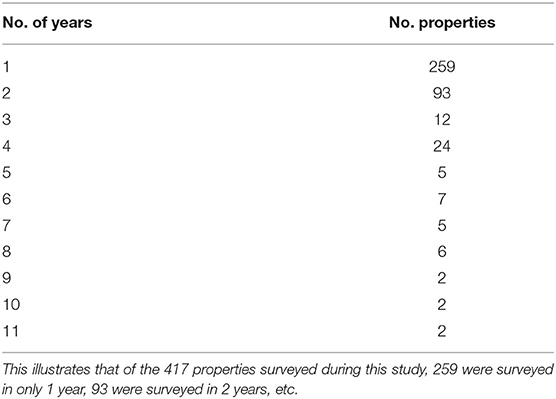
Table 3. Frequency of butterfly surveys at each site, Iowa, 2006–2017.
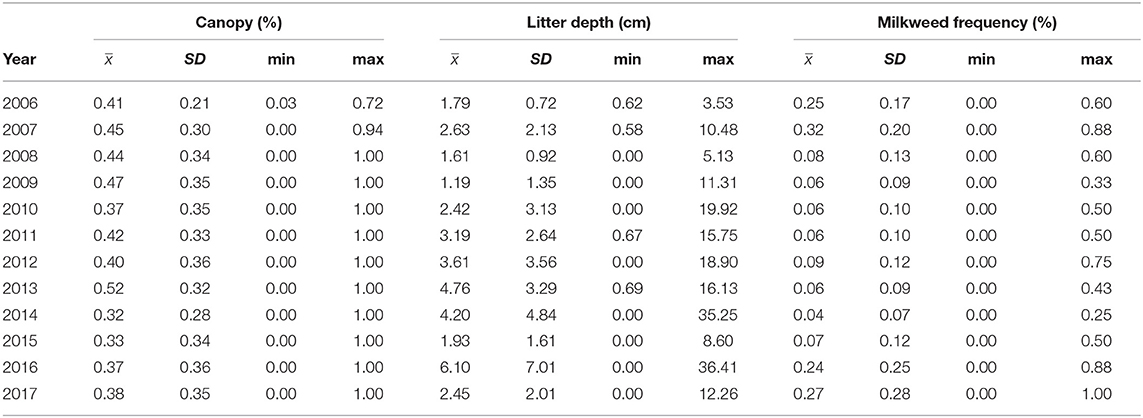
Table 4. Yearly estimates (mean, SD, and range) of the average measures of three site-specific covariates (canopy cover [%], litter depth [cm], and milkweed frequency [%]) at all sites surveyed in that year, Iowa, 2006–2017.
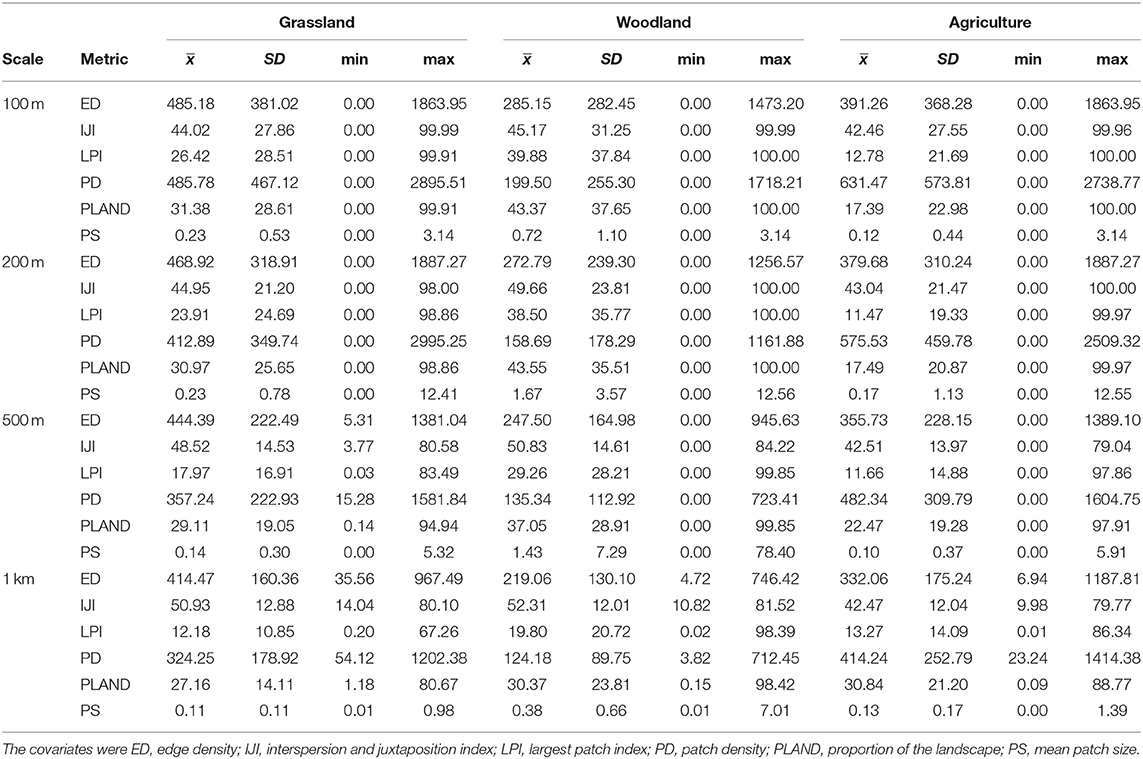
Table 5. Estimates (mean, SD, and range) for six landscape-level covariates at four spatial scales calculated in each of three habitat classes for an occupancy analysis of monarchs, Iowa, 2006–2017.
Occupancy models revealed that monarchs responded differently to landscape features, environmental conditions, and local habitat conditions for site occupancy, extinction, and colonization probabilities. For site occupancy, there were three competitive models (Table 6) but some uncertainty about covariate effects. These three models all had additive positive effects of grassland (patch size, percent of landscape, and patch density) at larger spatial scales, a negative effect of the percent of the landscape in woodland at the 200-m spatial scale, and a negative effect of canopy cover. In the best model, the mean patch size of grassland at the 1-km spatial scale had a positive effect (βGrassPS1K = 0.94, SE = 0.54) while the percent of the landscape in woodland at the 200-m spatial scale had a negative effect (βWoodPL200 = −1.68, SE = 0.34). For extinction there were also just three competitive models (Table 6), which showed a similar uncertainty in covariate effects to site occupancy. All three models contained an effect of grassland interspersion at the 1-km spatial scale; woodland effects at small spatial scales were in all three models, litter depth was in two models, and an effect of agriculture at the 1-km spatial scale was in one model. In the best model, there were additive effects of the percent of the landscape in woodland at the 100-m spatial scale (βWoodPLAND100 = 2.70, SE = 0.63), the interspersion of grassland at the 1-km spatial scale (βGrassIJI1K = −2.30, SE = 0.63), and litter depth (βLitter = 0.46, SE = 0.13). Finally, there were just two competitive models for colonization and both contained a woodland effect at the 200-m spatial scale (percent of landscape and largest patch index) and an effect for the interspersion of grassland at the 100-m spatial scale (Table 6). In the best model, there were negative effects of the percent of the landscape in woodland at the 200-m spatial scale (βWoodPLAND200 = −4.67, SE = 1.37) and the interspersion of grassland at the 100-m spatial scale (βGrassPS1K = −2.02, SE = 0.70). In general, across all models and parameters grassland effects occurred at larger spatial scales than woodland effects.
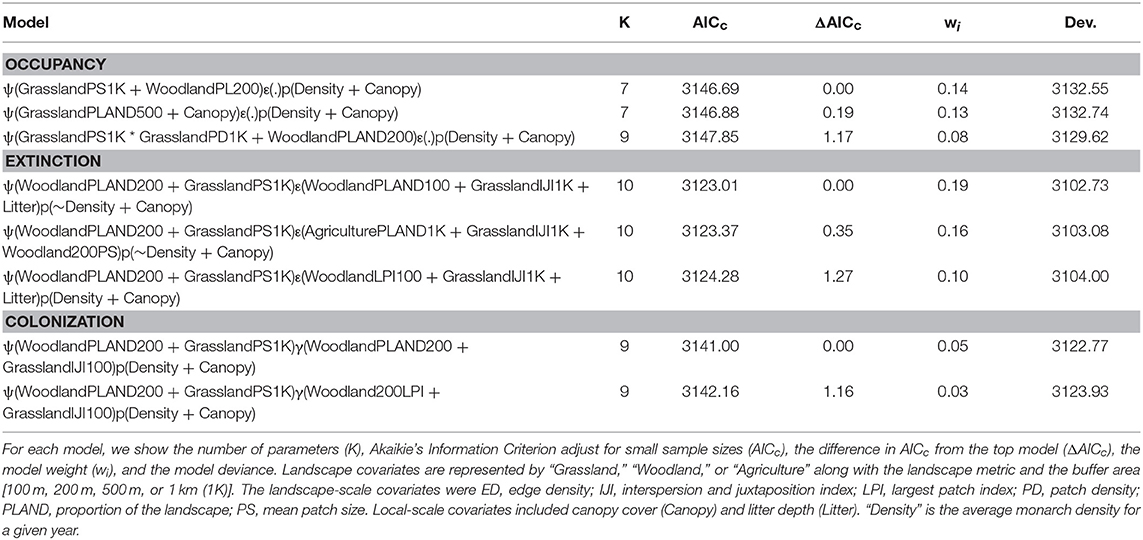
Table 6. Model selection results for site occupancy (ψ), site extinction (ε), site colonization (γ), and detection probability (p) for monarchs surveyed in Iowa, 2006–2017.
Detection probability was most affected by the additive effects of canopy cover and monarch density; no other detection model was competitive. In the top site occupancy model there was a positive effect of monarch density (βDensity = 0.28, SE = 0.05) and a negative effect of canopy cover (βCanopy = −0.18, SE = 0.03) on detection probability (Table 6). The direction and magnitudes of these effects were almost identical in the top extinction and colonization models. Estimates of detection probability were generally >0.40 for mean covariate values (range was 0.33–0.62). There was no support for the effect of wind, cloud cover, or temperature on detection probability. The slope parameter estimates for all of these weather variables were small (< 0.03) and confidence intervals on the estimates included zero.
Using the best model for each parameter, we developed predictive relationships for key covariates of interest. First, we predicted the probability of site occupancy as a function of the percent of the landscape in woodland at the 200-m spatial scale (Figure 2). Next, we predicted the probability of site extinction as a function of the percent of the landscape in woodland at the 100-m spatial scale (Figure 3). Finally, we predicted the probability of site colonization as a function of the interspersion of grassland at the 100-m spatial scale (Figure 4). These three figures illustrate the primary drivers of occupancy, extinction, and colonization parameters in our study and illustrate how each responds to a particular landscape-level covariate.
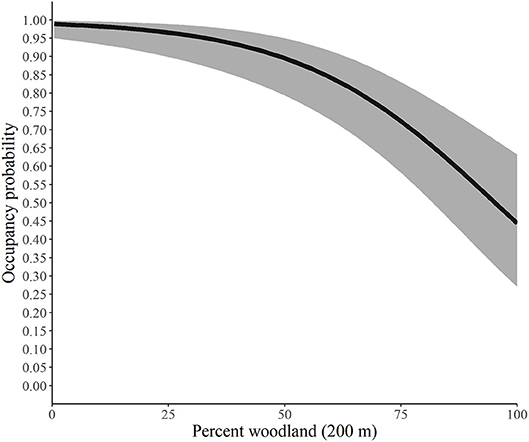
Figure 2. Predicted probability of site occupancy by monarchs as a function of the percent of the landscape in woodland at the 200-m spatial scale, Iowa, 2006-2017. The solid line represents the predicted probabilities and the gray region is the 95% confidence envelope. Predictions are based on the model Psi(GRS1KPS + WOD200PLAND) Epsilon(WOD100PLAND + GRS1KIJI + Litter) p(dapl.density + Canopy).
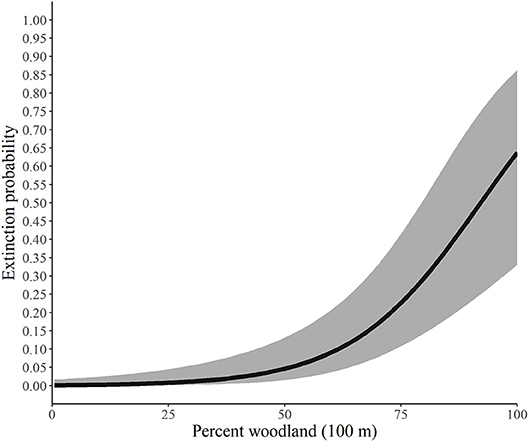
Figure 3. Predicted probability of extinction by monarchs as a function of the percent of the landscape in woodland at the 100-m spatial scale, Iowa, 2006-2017. The solid line represents the predicted probabilities and the gray region is the 95% confidence envelope. Predictions are based on the model Psi(GRS1KPS + WOD200PLAND) Epsilon(WOD100PLAND + GRS1KIJI + Litter) p(dapl.density + Canopy).
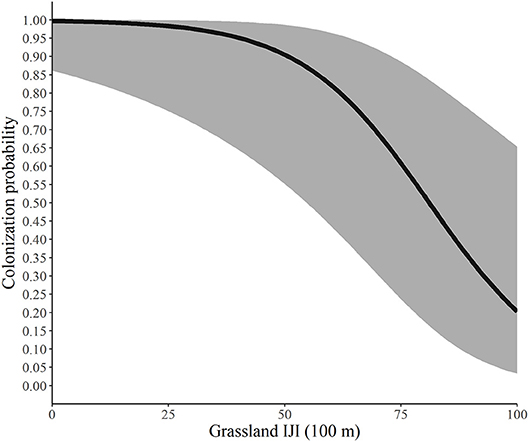
Figure 4. Predicted probability of colonization by monarchs as a function of the interspersion of grassland at the 100-m spatial scale, Iowa, 2006-2017. The solid line represents the predicted probabilities and the gray region is the 95% confidence envelope. Predictions are based on the model Psi(GRS1KPS + WOD200PLAND) Gamma(WOD200PLAND + GRS100IJI) p(dapl.density + Canopy).
The monarch butterfly responds to a suite of local- and landscape-level habitat features that collectively describe its occupancy and colonization/extinction dynamics at sites in the core of its U.S. breeding range. Our study is the first to investigate these patterns for the monarch in an occupancy modeling framework within a metapopulation context. We believe the results provide further insight into patterns of habitat selection for the monarch, and relate directly to future management and conservation efforts. Below, we place our findings in a larger context with monarch and other butterfly literature and discuss important model assumptions and how deviations from them may have impacted our findings.
Occupancy analyses have not been previously conducted for the monarch across any large portion of its breeding range. Such an analysis requires repeat visits to many sites, preferably selected at random, which is logistically challenging. Citizen Science efforts such as the Monarch Larva Monitoring Project (MLMP; Prysby and Oberhauser, 2004; Nail et al., 2015) offer large datasets with appropriate survey data, but the non-random site selection limits inferences. Occupancy analyses have only rarely been used for other butterfly species, most often single-season models where only site occupancy and detection probability are estimated (Puntenney and Schorr, 2016). However, logistic regression analyses where presence-absence is correlated with habitat and other covariates is a common butterfly research methodology (recent examples include Powniatowski et al., 2018; Seidel et al., 2018; Zhang and Miyashita, 2018). In these types of analyses, the detection process is ignored and the focus is on the occupancy process and associated correlates. A potential pitfall of using just logistic regression is that the detection probability is either assumed to be perfect (1.0) or constant across all surveys and is not estimated directly from the data. This assumption may work for certain species, in open habitats where butterflies are not obscured, and for surveys where the area being covered is small (e.g., narrow line transects). However, our estimated detection probability for the monarch, a large, visible, and easily identified butterfly, was still < 1.0 suggesting that this is not a good assumption. Patterson (2016) estimated a detection probability of 0.79 for monarchs sampled using Pollard-Yates transects on grasslands in central Iowa, which was similar to many of our estimates. It is important to note that detection probability is seldom estimated for any butterfly species, although all published studies indicate that it is often substantially < 1.0 and few recommend estimating it directly (see Table 1 in Lindzey and Conner, 2011; Henry and Anderson, 2016; Ribiero et al., 2016).
Our results reveal that monarchs overall had a high probability of occupancy of our sites during the breeding season (>0.90), and that this was correlated with landscape covariates as opposed to local covariates. It was surprising that we found no strong support for the local-scale covariates, which we hypothesized would be useful predictors of these parameters. This is surprising given what is known about habitat preferences of the monarch. The preferred breeding sites are thought to be open areas with a mix of nectar-rich resources for adults to feed along with milkweed for oviposition sites (Zalucki and Kitching, 1982). We found that woodland at relatively small scales tended to decrease occupancy and colonization probabilities and increase extinction probabilities. This could be attributed to the cooler conditions of woodlands as monarchs tend to utilize areas that receive sunlight (Zalucki and Kitching, 1982). Additionally, the potential lack of feeding sources and oviposition sites may explain the low occupancy and colonization probabilities and high extinction probabilities.
While woodlands likely contain some nectar sources, they do not harbor the high densities of milkweeds like grasslands or agricultural areas (Bhowmik and Bandeen, 1976; Hartzler and Buhler, 2000). Indeed, the probability of an area being occupied and colonized by monarchs decreased as woodland cover increased but this never reached zero. Similarly, extinction probability never reached 1.00. We hypothesize that even with 100% woodland cover, monarchs may still be found depending upon the presence of understory forbs and milkweed plants. This hypothesis agrees with Brower's (1995) assessment that the Upper Midwest prior to conversion to agriculture contained abundant milkweed and other diverse nectar sources. Seitz (1924) noted that milkweeds were capable of easily colonizing disturbed forests, suggesting that even heavily forested regions may be occupied by monarchs.
Our findings suggest that as the percent of woodland increases within the 200-m buffer, the probability of an area being occupied by monarchs decreased yet never reached 0. The average percentage of woodland for our study across all sites at the 200-m scale was 43.35% and ranged from 0 to 100%. Similarly, extinction, or the likelihood that a site that contained monarchs in year one would not have monarchs in year two, was also heavily influenced by the percentage of woodland (Figure 3), although for this parameter the scale was 100 m. Our site average for woodland at the 100-m scale was 43.37% and ranged from 0 to 100%, and as the percentage increased, the likelihood that the site would not have monarchs also increased, yet again, never reached 100%.
Lastly, we illustrate the impact of the interspersion-juxtaposition index (IJI) of grassland at the 100-m scale on colonization probability. Our findings suggest that as patches of grassland became smaller and more mixed throughout patches of agriculture, woodland or other landcover types, the probability of colonization decreased; as these grassland patches became larger and more clumped together colonization increased. This seems to be in contrast to findings that monarchs tend to use smaller patches of available habitat (Davis et al., 2007) and have higher egg densities in smaller patches than in larger patches (Pitman et al., 2018). Our findings could be due to the scale at which this metric was measured. Monarchs can fly long distances in a single day (up to 15 km/d according to Zalucki et al., 2016), so “large” patches at a 100-m scale may still be comparatively small for this species. Furthermore, greater connectivity among grassland patches, particularly at this small scale, may be beneficial to the monarch for finding more nectar sources and oviposition sites. For example, other landscape covariates, such as woodland edges, can act as barriers to monarch movement (Ries and Debinski, 2001). Monarchs are highly mobile and females in particular travel frequently among patches to find more milkweed (Zalucki and Kitching, 1982; Grant et al., 2018). Thus, more contiguous grassland patches may be preferable to more interspersed habitat. Note, however, that this parameter did not begin to drop from above 90 until the IJI was above 50 and that it had a wide confidence interval. Conversely, it never dropped to zero, indicating that many factors are influencing whether adult monarchs choose to use a patch.
Associations between landscape features and presence-absence of butterflies have been widely investigated (Dover and Settele, 2009; Bergerot et al., 2011; Öckinger et al., 2012; Luppi et al., 2018). Bergman et al. (2004) noted that large spatial scales were needed for predicting landscape effects on butterfly communities in agricultural regions. Other studies (Luppi et al., 2018) emphasized the importance of examining these effects at multiple spatial scales because of scale-dependent effects. As a taxon, butterflies may be especially sensitive to increasing human presence across a wide range of ecosystems (Gross, 2016; Van Swaay et al., 2016). This is especially relevant in Iowa, where native habitat occurs in small, fragmented patches that are embedded within a primarily agricultural landscape. Indeed, Iowa has < 0.01% of its native grasslands remaining, many of them isolated from other grasslands (Samson and Knopf, 1994). Ries and Debinski (2001) noted that at 26 prairies in central Iowa an estimated 50% of their total perimeter of prairie edges consisted of row crops and 38% had a road or treeline as an intersecting boundary feature.
Occupancy models have the assumption of demographic closure for the secondary sampling periods (MacKenzie et al., 2002), which in our study was the main breeding season of the monarch in Iowa. This means that there are assumed to be no population additions (births or immigrants) or losses (deaths or emigrants) during the secondary sampling period. In the strictest sense, this is seldom true for most wildlife studies, and the primary goal shifts to strategies to minimize violating this assumption. The multi-generational life cycle of the monarch makes this especially challenging because (a) some generations overlap, (b) there is no single time period within the broad breeding season when a local population is not subject to population additions or losses, (c) the timing of generations shifts to an unknown and unpredictable extent between years, and (d) there is no accurate field method for identifying an individual monarch to a specific generation. Like any model, occupancy models produce biased parameter estimates if model assumptions are violated, key among them the assumption of closure (MacKenzie et al., 2003). Puntenney and Schorr (2016) discussed similar challenges meeting the closure assumption, especially as they related to flight times and the mobility of their focal species. Rota et al. (2009) noted that estimates of occupancy tended to be biased when detection probability was low (p < 0.30), the initial occupancy rate was low, and extinction was high. In our study, detection probability was higher (p > 0.40), site occupancy was high, and extinction probability was very low. MacKenzie et al. (2006) noted that when there were random changes in occupancy within a season, the occupancy estimator was approximately unbiased. We believe that movements by monarchs within a season are random because this is a wide-ranging, highly mobile species, and thus the estimates of occupancy in our study should be approximately unbiased. Finally, we note that if the movement of monarchs (immigration and emigration) occurring during the secondary sampling period is random, then occupancy can be interpreted simply as use of patches (Bailey et al., 2007).
An important aspect of occupancy models is that they make use of presence-absence data rather than counts or density (MacKenzie et al., 2002, 2003). Thus, an occupied site contains >1 monarch in our study; no distinction is made between sites occupied by a single individual vs. those with more individuals. There are other models that can integrate site occupancy with measures of abundance (Royle and Nichols, 2003). Occupancy modeling has become popular for monitoring populations and understanding habitat associations because there is no need to mark and re-encounter individuals. The models require both temporal and spatial replication (Bailey et al., 2007), which creates a trade-off between adding more sites and sampling existing sites more often. The feasibility of conducting a large number of surveys is enhanced when there is no need to capture and mark individuals (as in a mark-recapture study) and this allowed us to have good temporal replication (approximately four surveys per breeding season per site) while still visiting a large number of sites each year. The limitation of using only presence-absence data is that there is no information on abundance, density-dependent effects on parameters can be hard to model, and the ultimate assessment of a site's importance rests on something other than the number of individuals that are present.
We present the first estimates of the meta-population dynamics of the monarch using a 12-year dataset from Iowa. Our findings suggest that monarchs occupy sites using landscape-level habitat cues, but these cues differ for occupancy, colonization, and extinction. Local site variables such as the amount of milkweed were unimportant in our models. Detection probability was a function of monarch density and canopy cover and exceeded 0.40 in our models. Our models were useful for making predictions about the effects of key covariates on these parameters, which in turn may be useful for monarch conservation efforts in the Midwest and elsewhere.
This work involved the study of invertebrates, which are not covered by the Iowa State University IACUC committee. Therefore, no IACUC permit was required for this work.
KK and SD conceived the idea. SD, RV, KM, KK, and PF collected the data. SD, RV, and KM analyzed the data and took the lead on writing the paper with contributions from all co-authors.
The authors declare that the research was conducted in the absence of any commercial or financial relationships that could be construed as a potential conflict of interest.
This work was funded by various State Wildlife Grants (grant numbers T-6-R-1, T-6-R-2, T-6-R-3, T-6-R-4, T-6-R-5, F15AF00269, and F15AF00257), Iowa State University, the Iowa Department of Natural Resources, the U.S Army Corps of Engineers, and a Landowner Incentive Program Grant under the U.S. Fish and Wildlife Service Wildlife and Sport Fish Restoration Program. This paper is a product of the Iowa Agriculture and Home Economics Experiment Station, Ames, Iowa. Project No. IOW05438 is sponsored by Hatch Act and State of Iowa funds.
Arnold, R. A. (1983). Ecological studies of six endangered butterflies (Lepidoptera, Lycaenidae): island biogeography, patch dynamics, and the design of nature reserves. Univ. California Public. Entomol. 99, 1–161. doi: 10.1111/j.1937-2817.2010.tb01236.x
Arnold, T. W. (2010). Uninformative parameters and model selection using Akaike's Information Criterion. J. Wildl. Manag. 74, 1175–1178. doi: 10.2193/2009-367
Bailey, L. L., Hines, J. E., Nichols, J. D., and Mackenzie, D. I. (2007). Sampling design trade-offs in occupancy studies with imperfect detection: examples and software. Ecol. Appl. 17, 281–290. doi: 10.1890/1051-0761(2007)017[0281:SDTIOS]2.0.CO;2
Batalden, R. V., Oberhauser, K., and Peterson, A. T. (2007). Ecological niches in sequential generations of eastern North American monarch butterflies (Lepidoptera: Danaidae): The ecology of migration and likely climate change implications. Environ. Entomol. 36, 1365–1373. doi: 10.1603/0046-225X(2007)36[1365:ENISGO]2.0.CO;2
Bergerot, B., Fontaine, B., Julliard, R., and Baguette, M. (2011). Landscape variables impact the structure and composition of butterfly assemblages along an urbanization gradient. Landsc. Ecol. 26, 83–94. doi: 10.1007/s10980-010-9537-3
Bergman, K.-O., Askling, J., Ekberg, O., Ignell, H., Wahlman, H., and Milberg, P. (2004). Landscape effects on butterfly assemblages in an agricultural region. Ecography 27, 619–628. doi: 10.1111/j.0906-7590.2004.03906.x
Bhowmik, P. C., and Bandeen, J. D. (1976). The biology of Canadian weeds. 19. Asclepias syriaca L. Can. J. Plant Sci. 56, 579–589. doi: 10.4141/cjps76-09
Bried, J. T., and Pellet, J. (2012). Optimal design of butterfly occupancy survey and testing if occupancy converts to abundance for sparse populations. J. Insect Conserv. 16, 489–499. doi: 10.1007/s10841-011-9435-2
Brower, L. P. (1995). Understanding and misunderstanding the migration of the monarch butterfly (Nymphalidae) in North America, 1857-1995. J. Lepidopterists Soc. 49, 304–385.
Brower, L. P., Taylor, O. R., Williams, E. M., Slayback, D. A., Zubieta, R. R., and Ramirez, M. I. (2012). Decline of monarch butterflies overwintering in Mexico: is the migratory phenomenon at risk? Insect Conserv. Divers. 5, 95–100. doi: 10.1111/j.1752-4598.2011.00142.x
Bull, C. M., Zalucki, M. P., Suzuki, Y., Mackay, D. A., and Kitching, R. L. (1985). An experimental investigation of patch use by female monarch butterflies, Danaus plexippus (L.). Aust. J. Ecol. 10, 391–398. doi: 10.1111/j.1442-9993.1985.tb00901.x
Burkey, T. V. (1988). Extinction in nature reserves: the effect of fragmentation and the importance of migration between reserve fragments. Oikos 55, 75–81.
Burnham, K. P., and Anderson, D. R. (2002). Model Selection and Multimodel Inference: A Practical Information-Theoretical Approach, 2nd Edn. New York, NY: Springer-Verlag.
Clausen, H. D., Holbeck, H. B., and Redderson, J. (2001). Factors influencing abundance of butterflies and burnet moths in the uncultivated habitats of an organic farm in Denmark. Biol. Conserv. 98, 167–178. doi: 10.1016/S0006-3207(00)00151-8
Cormont, A., Malinowska, A. H., Kostenko, O., Radchuk, V., Hemerik, L., WallisDevries, M. F., et al. (2011). Effect of local weather on butterfly flight behavior, movement, and colonization: significance for dispersal under climate change. Biodivers. Conserv. 20, 483–503. doi: 10.1007/s10531-010-9960-4
Curtis, R. J., Brereton, T. M., Dennis, R. L. H., Carbone, C., and Isaac, N. J. B. (2015). Butterfly abundance is determined by food availability and is mediated by species traits. J. Appl. Ecol. 52, 1676–1684. doi: 10.1111/1365-2664.12523
Davis, J. D., Debinski, D. M., and Danielson, B. J. (2007). Local and landscape effect on the butterfly community in fragmented Midwest USA prairie habitats. Landsc. Ecol. 22, 1341–1354. doi: 10.1007/s10980-007-9111-9
Devries, J. H., Armstrong, L. M., MacFarlane, R. J., Moats, L., and Thoroughgood, P. T. (2008). Waterfowl nesting in spring-seeded and fall-seeded cropland in Saskatchewan. J. Wildl. Manag. 72, 1790–1797. doi: 10.2193/2007-513
Dover, J., and Settele, J. (2009). The influences of landscape structure on butterfly distribution and movement. J. Insect Conserv. 13, 3–27. doi: 10.1007/s10841-008-9135-8
Ensminger, C. I., Kollasch, R. P., and Kohrt, C. A. (2016). High Resolution Land Cover of Iowa in 2009. Iowa Geodata. Available online at: https://geodata.iowa.gov/dataset/high-resolution-land-cover-iowa-2009.
Flockhart, D. T., Martin, T. G., and Norris, D. R. (2012). Experimental examination of intraspecific density-dependent competition during the breeding period in monarch butterflies (Danaus plexippus). PLoS ONE 7:e45080. doi: 10.1371/journal.pone.0045080
Flockhart, D. T., Pichancourt, J. B., Norris, D. R., and Martin, T. (2015). Unravelling the annual cycle in a migratory animal: breeding-season habitat loss drives population declines of monarch butterflies. J. Anim. Ecol. 84, 155–165. doi: 10.1111/1365-2656.12253
Flockhart, D. T., Wassenaar, L. I., Martin, T. G., Hobson, K. A., Wunder, M. B., and Norris, D. R. (2013). Tracking multi-generational colonization of the breeding grounds by monarch butterflies in eastern North America. Proc. R. Soc. Lond. Ser. B 80:20131087. doi: 10.1098/rspb.2013.1087
Grant, T. J., Parry, H. R., Zalucki, M. P., and Bradbury, S. P. (2018). Predicting monarch butterfly (Danaus plexippus) movement and egg-laying with a spatially-explicit agent-based model: The role of monarch perceptual range and spatial memory. Ecol. Modell. 374, 37–50. doi: 10.1016/j.ecolmodel.2018.02.011
Gross, M. (2016). Butterflies take a well-studied tumble. Curr. Biol. 26, R823–R825. doi: 10.1016/j.cub.2016.09.008
Hanski, I., and Ovaskainen, O. (2000). The metapopulation capacity of a fragmented landscape. Nature 404, 755–758. doi: 10.1038/35008063
Hanski, I., and Thomas, C. D. (1994). Metapopulation dynamics and conservation: a spatially explicit model applied to butterflies. Biol. Conserv. 68, 167–180.
Harms, T. M., Kinkead, K. E., and Dinsmore, S. J. (2014). Evaluating effects of landscape configuration on site occupancy and movement dynamics of odonates in Iowa. J. Insect Conserv. 18, 307–315. doi: 10.1007/s10841-014-9638-4
Hartzler, R. G., and Buhler, D. B. (2000). Occurrence of common milkweed (Asclepias syriaca) in cropland and adjacent areas. Crop Prot. 19, 363–366. doi: 10.1016/S0261-2194(00)00024-7
Henry, E. H., and Anderson, C. T. (2016). Abundance estimates to inform butterfly management: double-observer versus distance sampling. J. Insect Conserv. 20, 505–514. doi: 10.1007/s10841-016-9883-9
Iowa Department of Natural Resources (2015). Iowa's Wildlife Action Plan: Securing a Future for Fish and Wildlife. eds K. Reeder, and J. Clymer, Des Moines, IA: Iowa Department of Natural Resources.
Iowa Department of Natural Resources (2016). Iowa Multiple Species Inventory and Monitoring Program Technical Manual. Des Moines, IA: Iowa Department of Natural Resources. 172.
Jepsen, S., Schweitzer, D. F., Young, B., Sears, N., Ormes, M., and Black, S. H. (2015). Conservation Status and Ecology of the Monarch Butterfly in the United States. Arlington, VA; Portland, OR: NatureServe; the Xerces Society for Invertebrate Conservation, 36.
Kinkead, K. E. (2006). Iowa Multiple Species Inventory and Monitoring Program Technical Manual. Des Moines, IA: Iowa Department of Natural Resources.
Laake, J. L. (2013). RMark: An R Interface for Analysis of Capture-Recapture Data With MARK. AFSC Processed Rep. 2013-01, 25 p. Alaska Fish. Sci. Cent., NOAA, Natl. Mar. Fish. Serv., 7600 Sand Point Way NE, Seattle WA 98115.
Levins, R. (1969). Some demographic and genetic consequences of environmental heterogeneity for biological control. Bull. Entomol. Soc. Am. 15, 237–240.
Lindzey, S., and Conner, E. F. (2011). Monitoring the mission blue butterfly using immature eggs. J. Insect Conserv. 15, 765–773. doi: 10.1007/s10841-010-9375-2
Loos, J., Dorresteijn, I., Hanspach, J., Fust, P., Rakosy, L., and Fischer, J. (2014). Low-intensity agricultural landscapes in Transylvania support high butterfly diversity, implications for conservation. PLoS ONE 9:e103256. doi: 10.1371/journal.pone.0103256
Luppi, M., Dondina, O., Orioli, V., and Bani, L. (2018). Local and landscape drivers of butterfly richness and abundance in a human-dominated area. Agric. Ecosyst. Environ. 254, 138–148. doi: 10.1016/j.agee.2017.11.020
MacArthur, R. A., and Wilson, E. (1967). The Theory of Island Biogeography. Princeton, NJ: Princeton University Press.
MacKenzie, D. I., Nichols, J. D., Hines, J. E., Knutson, M. G., and Franklin, A. B. (2003). Estimating site occupancy, colonization, and local extinction when a species is detected imperfectly. Ecology 84, 2200–2207. doi: 10.1890/02-3090
MacKenzie, D. I., Nichols, J. D., Lachman, G. B., Droege, S., Royle, J. A., and Langtimm, C. A. (2002). Estimating site occupancy rates when detection probabilities are less than one. Ecology 83, 2248–2255. doi: 10.1890/0012-9658(2002)083[2248:ESORWD]2.0.CO;2
MacKenzie, D. I., Nichols, J. D., Royle, J. A., Pollock, K. H., Bailey, L. L., and Hines, J. E. (2006). Occupancy Estimation and Modeling Inference Methods for Patterns and Dynamics of Species Occupancy. San Diego, CA: Elsevier, Inc.
Manley, P. N., Zielinski, W. J., Schlesinger, M. D., and Mori, S. R. (2004). Evaluation of a multiple-species approach to monitoring species at the ecoregional scale. Ecol. Appl. 14, 296–310. doi: 10.1890/02-5249
McGarigal, K., Cushman, S. A., and Ene, E. (2012). FRAGSTATS v4: Spatial Pattern Analysis Program for Categorical and Continuous Maps. Computer software program produced by the authors at the University of Massachusetts, Amherst. Available online at the following web site: < http://www.umass.edu/landeco/research/fragstats/fragstats.html>.
McGarigal, K., Wan, H. Y., Zeller, K. A., Timm, B. C., and Cushman, S. A. (2016). Multi-scale habitat selection modeling: a review and outlook. Landsc. Ecol. 31, 1161–1175. doi: 10.1007/s10980-016-0374-x
Mercader, R. J., Siegert, N. W., and McCullough, D. G. (2012). Estimating the influence of population density and dispersal behavior on the ability to detect and monitor Agrilus planipennis (Coleoptera: Buprestidae) populations. J. Econ. Entomol. 105, 272–281. doi: 10.1603/EC11172
Murray, T. E., Fitzpatrick, U., Byrne, A., Fealy, R., Brown, M. J. F., and Paxton, R. J. (2012). Local-scale factors structure wild bee communities in protected areas. J. Appl. Ecol. 49, 998–1008. doi: 10.1111/j.1365-2664.2012.02175.x
Nail, K. R., Stenoien, C., and Oberhauser, K. S. (2015). Immature monarch survival: effects of site characteristics, density, and time. Ann. Entomol. Soc. Am. 108, 680–690. doi: 10.1093/aesa/sav047
Oberhauser, K., and Peterson, A. T. (2003). Modeling current and future potential wintering distributions of eastern North American monarch butterflies. Proc. Natl. Acad. Sci. 100, 14063–14068. doi: 10.1073/pnas.2331584100
Oberhauser, K., Wiederholt, R., Diffendorfer, J. E., Semmens, D., Ries, L., Thogmartin, W. E., et al. (2017). A trans-national monarch butterfly population model and implications for regional conservation priorities. Ecol. Entomol. 42, 51–60. doi: 10.1111/een.12351
Oberhauser, K. S. (1997). Fecundity, lifespan and egg mass in butterflies: effects of male-derived nutrients and female size. Funct. Ecol. 11, 166–175.
Öckinger, E., Bergman, K., Franzén, M., and Kadlec, T. (2012). The landscape matrix modifies the effect of habitat fragmentation in grassland butterflies. Landsc. Ecol. 27, 121–131. doi: 10.1007/s10980-011-9686-z
Olivier, T., Schmucki, R., Fontaine, B., Villemey, A., and Archaux, F. (2016). Butterfly assemblages in residential gardens are driven by species' habitat preference and mobility. Landsc. Ecol. 31, 865–876. doi: 10.1007/s10980-015-0299-9
Ouin, A., Aviron, S., Dover, J., and Burel, F. (2004). Complementation/supplementation of resources for butterflies in agricultural landscapes. Agric. Ecosyst. Environ. 103, 473–479. doi: 10.1016/j.agee.2003.11.003
Patterson, S. S. (2016). Local and Landscape Effects on Population Dynamics of Birds and Butterflies in Iowa. (MS Thesis) Iowa State University, Ames, IA. 95.
Pitman, G. M., Flockhart, D. T., and Norris, D. R. (2018). Patterns and Causes of oviposition in monarch butterflies: Implications for milkweed restoration. Biol. Conserv. 217, 54–65. doi: 10.1016/j.biocon.2017.10.019
Pleasants, J. (2017). Milkweed restoration in the Midwest for monarch butterfly recovery: estimates of milkweeds lost, milkweeds remaining and milkweeds that must be added to increase the monarch population. Insect Conserv. Divers. 10, 42–53. doi: 10.1111/icad.12198
Pleasants, J. M. (2015). “Monarch butterflies and agriculture,” in Monarchs in a Changing World: Biology and Conservation of an Iconic Butterfly, eds K. S. Oberhauser, K. R. Nail, and S. Altizer (Ithaca, NY: Cornell University Press), 169–178.
Pleasants, J. M., and Oberhauser, K. S. (2013). Milkweed loss in agricultural fields because of herbicide use: effect on the monarch butterfly population. Insect Conserv. Divers. 6, 135–144. doi: 10.1111/j.1752-4598.2012.00196.x
Pleasants, J. M., Zalucki, M. P., Oberhauser, K. S., Brower, L. P., Taylor, O. R., and Thogmartin, W. E. (2017). Interpreting surveys to estimate the size of the monarch butterfly population: pitfalls and prospects. PLoS ONE 12:e0181245. doi: 10.1371/journal.pone.0181245
Pollard, E., and Yates, T. J. (1993). Monitoring Butterflies for Ecology and Conservation: The British Butterfly Monitoring Scheme. London: Chapman and Hall.
Powniatowski, D., Stuhldreher, G., Löffler, F., and Fartmann, T. (2018). Patch occupancy of grassland specialists: Habitat quality matters more than habitat connectivity. Biol. Conserv. 225, 237–244. doi: 10.1016/j.biocon.2018.07.018
Prysby, M., and Oberhauser, K. S. (2004). “Temporal and geographical variation in monarch densities: citizen scientists document monarch population patterns,” in The Monarch Butterfly: Biology and Conservation, eds K. S. Oberhauser and M. J. Solensky (Ithaca, NY: Cornell University Press), 9–12.
Puntenney, C. P., and Schorr, R. A. (2016). Patch occupancy and habitat of the hops azure (Celastrina humulus), a rare North American endemic butterfly: insights for monitoring and conservation. J. Insect. Conserv. 20, 215–222. doi: 10.1007/s10841-016-9855-0
Pywell, R. F., Warman, E. A., Sparks, T. H., Greatorex-Davies, J. N., Walker, K. J., Meek, W. R., et al. (2004). Assessing habitat quality for butterflies on intensively managed arable farmland. Biol. Conserv. 118, 313–325. doi: 10.1016/j.biocon.2003.09.011
R Core Team (2018). R: A Language and Environment for Statistical Computing. Vienna: R Foundation for Statistical Computing.
Ribiero, D. B., Williams, M. R., Specht, A., and Freitas, A. V. L. (2016). Vertical and temporary variability in the probability of detection of fruit-feeding butterflies and moths (Lepidoptera) in tropical forest. Austral Entomol. 55, 112–120. doi: 10.1111/aen.12157
Ries, L., and Debinski, D. M. (2001). Butterfly responses to habitat edges in the highly fragmented prairies of Central Iowa. J. Anim. Ecol. 70, 840–852. doi: 10.1046/j.0021-8790.2001.00546.x
Ries, L., Debinski, D. M., and Wieland, M. L. (2001). Conservation value of roadside prairie restoration to butterfly communities. Conserv. Biol. 15, 401–411. doi: 10.1046/j.1523-1739.2001.015002401.x
Rota, C. T., Fletcher, R. J., Dorazio, R. M., and Betts, M. G. (2009). Occupancy estimation and the closure assumption. J. Appl.Ecol. 46, 1173–1181. doi: 10.1111/j.1365-2664.2009.01734.x
Royle, J. A., and Nichols, J. D. (2003). Estimating abundance from repeated presence-absence data or point counts. Ecology 84, 777–790. doi: 10.1890/0012-9658(2003)084[0777:EAFRPA]2.0.CO;2
Schlict, D. W., Downey, J. C., and Nekola, J., C (2007). The Butterflies of Iowa. Iowa City, IA: University of Iowa Press. 233.
Schneider, C., and Fry, G. L. (2001). The influence of landscape grain size on butterfly diversity in grasslands. J. Insect Conserv. 5, 163–171. doi: 10.1023/A:1017932931192
Seidel, K. M., Lamb, E. G., Bedard-Haughn, A., and J.-DeVink, M. (2018). Environmental associations of Hesperia dacotae (Lepidoptera: Hesperiidae) in southeastern Saskatchewan, Canada. Can. Entomol. 150, 652–662. doi: 10.4039/tce.2018.33
Seitz, A. (1924). The Macrolepidoptera of the World: The American Rhopalocera. Stuttgart: Alfred Kernen. 1139 p. Available online at: https://archive.org/details/macrolepidoptera51seit/page/n175.
Semmens, B. X., Semmens, D. J., Thogmartin, W. E., Wiederholt, R., López-Hoffman, L., Diffendorfer, J. E., et al. (2016). Quasi-extinction risk and population targets for the Eastern, migratory population of monarch butterflies (Danus plexippus). Sci. Rep. 6, 23265. doi: 10.1038/srep23265
Solensky, M. J. (2004). “Overview of monarch overwintering biology,” in The Monarch Butterfly: Biology and Conservation, eds K. S. Oberhauser, and M. J. Solensky (Ithaca, NY: Cornell University Press), 117–120.
Thogmartin, W. E., López-Hoffman, L., Rohweder, J., Diffendorfer, J., Drum, R., Semmens, D., et al. (2017). Restoring monarch butterfly habitat in the Midwestern US: ‘all hands on deck'. Environ. Res. Lett. 12:074005. doi: 10.1088/1748-9326/aa7637
Thomas, C. (1994). Extinction, colonization, and metapopulations: Environmental tracking by rare species. Conserv. Biol. 8, 373–378.
Tscharntke, T., Steffan-Dewenter, I., Kruess, A., and Thies, C. (2002). Contribution of small habitat fragments to conservation of insect communities of grassland-cropland landscapes. Ecol. Appl. 12, 354–363. doi: 10.1890/1051-0761(2002)012[0354:COSHFT]2.0.CO;2
Van Swaay, C. A. M., Van Strien, A. J., Aghababyan, K., Åström, S., Botham, M., Brereton, T., et al. (2016). The European Grassland Butterfly Indicator 1990-2015, Report VS2016.019, De Vlinderstichting. Wageningen.
White, G. C., and Burnham, K. P. (1999). Program MARK: Survival estimation from populations of marked animals. Bird Study 46, 120–139.
Wikström, L., Milberg, P., and Bergman, K.-O. (2009). Monitoring of butterflies in semi-natural grasslands: diurnal variation and weather effects. J. Insect Conserv. 13, 203–211. doi: 10.1007/s10841-008-9144-7
Yakubu, A. A., Sáenz, R., Stein, J., and Jones, L. E. (2004). Monarch butterfly spatially discrete advection model. Math. Biosci. 190, 183–202. doi: 10.1016/j.mbs.2004.03.002
Zalucki, M. P., Brower, L. P., Malcolm, S. B., and Slager, B. H. (2015). “Estimating the climate signal inmonarch population decline: no direct evidence for an impact of climate change?,” in Monarchs in a Changing World: Biology and Conservation of an Iconic Butterfly, eds K. S. Oberhauser, K. R. Nail, and S.,Altizer, (Ithaca, NY: Cornell University Press). 130–142
Zalucki, M. P., and Kitching, R. L. (1982). The analysis and description of movement in adult Danus plexippus L. (Lepidoptera: Danainae). Behaviour 80, 174–198.
Zalucki, M. P., Parry, H. R., and Zalucki, J. M. (2016). Movement and egg laying in monarchs: to move or not to move, that is the equation. Austral Ecol. 41, 154–167.
Zhan, S., Zhang, W., Niitepõld, K., Hsu, J., Fernández-Haeger, J., Zalucki, M. P., et al. (2014). The genetics of monarch butterfly migration and warning coloration. Nature 514, 317–321. doi: 10.1038/nature1381
Zhang, X., and Miyashita, T. (2018). Effects of local and landscape factors on the abundance of an endangered multivoltine butterfly at riverbanks. Entomol. Sci. 21, 133–141. doi: 10.1111/ens.12291
Zingg, S., Grenz, J., and Humbert, J.-Y. (2018). Landscape-scale effect of land use intensity on birds and butterflies. Agric. Ecosyst. Environ. 267, 119–128. doi: 10.1016/j.agee.2018.08.014
Zipkin, E. F., Ries, L., Reeves, R., Regetz, J., and Oberhauser, K. S. (2012). Tracking climate impacts on the migratory monarch butterfly. Glob. Change Biol. 18, 3039–3049. doi: 10.1111/j.1365-2486.2012.02751.x
Keywords: butterfly, colonization, detection probability, extinction, habitat selection, Iowa, monarch, occupancy
Citation: Dinsmore SJ, Vanausdall RA, Murphy KT, Kinkead KE and Frese PW (2019) Patterns of Monarch Site Occupancy and Dynamics in Iowa. Front. Ecol. Evol. 7:169. doi: 10.3389/fevo.2019.00169
Received: 01 January 2019; Accepted: 26 April 2019;
Published: 16 May 2019.
Edited by:
Wayne E. Thogmartin, United States Geological Survey, United StatesReviewed by:
Andrew William Byrne, Department of Agriculture, Food and the Marine, IrelandCopyright © 2019 Dinsmore, Vanausdall, Murphy, Kinkead and Frese. This is an open-access article distributed under the terms of the Creative Commons Attribution License (CC BY). The use, distribution or reproduction in other forums is permitted, provided the original author(s) and the copyright owner(s) are credited and that the original publication in this journal is cited, in accordance with accepted academic practice. No use, distribution or reproduction is permitted which does not comply with these terms.
*Correspondence: Stephen J. Dinsmore, Y29vdGpyQGlhc3RhdGUuZWR1
Disclaimer: All claims expressed in this article are solely those of the authors and do not necessarily represent those of their affiliated organizations, or those of the publisher, the editors and the reviewers. Any product that may be evaluated in this article or claim that may be made by its manufacturer is not guaranteed or endorsed by the publisher.
Research integrity at Frontiers
Learn more about the work of our research integrity team to safeguard the quality of each article we publish.