 Zerina Johanson
 Kyle Martin
 Gareth Fraser2
 Katherine James
94% of researchers rate our articles as excellent or good
Learn more about the work of our research integrity team to safeguard the quality of each article we publish.
Find out more
ORIGINAL RESEARCH article
Front. Ecol. Evol., 05 February 2019
Sec. Evolutionary Developmental Biology
Volume 7 - 2019 | https://doi.org/10.3389/fevo.2019.00012
Evolutionary variation in anteroposterior patterning of the axial skeleton is a major contributor to the evolution of the vertebrate body plan, with five canonical vertebral types in tetrapods (cervical, thoracic, lumbar, sacral, caudal). However, less is known about the evolutionary origin and variation in vertebral regionalization patterns outside of tetrapods where described vertebral types range from as few as two in some chondrichthyans to eight or more in some teleost fishes. The synarcual is a specialized adaptation of the anterior axial skeleton comprising a putatively fused array of vertebral elements characteristic of jawed vertebrate (gnathostome) clades such as batoid and chimaeroid chondrichthyans where they support enlarged pectoral fins and dorsal fin spines respectively, as well as a fossil group known as the placoderms. Placoderms represent the phylogenetically most basal jawed vertebrates and the presence of a synarcual in these and chondrichthyans may suggest a conserved vertebral type for jawed vertebrates, predating the divergence of stem and crown gnathostomes. Alternatively, synarcuals may have evolved independently in these lineages, exhibiting a remarkable case of morphological convergence. In order to address this question, we investigated the early development of the cervicothoracic synarcual of an emerging model chondrichthyan: the Little skate Leucoraja erinacea. By combining x-ray computed tomography, and classical histology, we show that the skate synarcual is a complex composite element which develops from a hollow, continuous cartilaginous element devoid of any vertebral centra anterior to the pectoral girdle, and fusion/remodeling of initially distinct vertebrae posteriorly. A de novo transcriptome assembly for two developmental stages of the skate synarcual and post-synarcual axial skeletal elements supported this two-phase development, with differences in expression levels of several developmental genes, including Hox family transcription factors, which suggest anterior-posterior regionalization along the vertebral column, potentially linked to the synarcual. In addition, multiple genes related to skeletal remodeling were found to be more highly expressed at stage 33, including genes related to osteoclast activity, normally associated with removal of bone, a tissue absent in chondrichthyans. These genes are potentially related to loss of mineralization as vertebral elements are incorporated into the synarcual.
The vertebral column is a defining feature of the vertebrates, comprising a rostrocaudal series of serially repeated units. Although individual vertebrae are modified in various vertebrate groups, and different components can be present or absent, the basic building blocks include a central element (centrum) along with dorsal (neural), ventral (haemal), and transverse elements (Arratia et al., 2001; Criswell et al., 2017). Modifications of the vertebrae can result from regionalization (morphologically distinct sections of the vertebral column), which is linked to the anteriorly staggered expression boundaries of Hox genes (nested expression, Burke et al., 1995; Mallo et al., 2010). For example, in mammals, nested Hox expression produces the morphologically and functionally distinct cervical, thoracic (with ribs), lumbar, sacral, and caudal regions. Vertebrae can also be modified via fusion, for example in the tetrapod sacrum, which involves the transformation of intervertebral tissue into bone (Moran et al., 2015). As well, in a variety of tetrapods, chondrichthyans (cartilaginous fishes) and a fossil group of early vertebrates known as the placoderms, the anterior region of the vertebral column forms a structure known as the synarcual (Johanson et al., 2009, 2013, 2015; Claeson, 2010, 2011; syncervical in tetrapods, see review by van Buren and Evans (2017).
In placoderms, the synarcual is thought to result from the fusion of separately developed and discrete vertebral elements composed of thin perichondral bone; these remain clearly visible within the synarcual itself (Johanson et al., 2009, 2013). Fusion of originally separate vertebral elements also appears to occur in one group of chondrichthyans, the chimaeroids (Holocephali; Johanson et al., 2015). In the other major chondrichthyan group, the Batoidea (skates and rays), synarcual development appears more complicated; previously, the batoid synarcual was also thought to develop from the fusion of separate vertebra (Miyake, 1988; Claeson, 2010), with vertebrae added to the synarcual posteriorly, indicated by the presence of distinct vertebral elements thought to be in the process of being incorporated into the synarcual (Johanson et al., 2013). Batoid synarcuals are also unusual in that mineralized centra appear to be substantially reduced in size within the synarcual (absent in placoderms and holocephalans; Fleming et al., 2015), and absent from most of the synarcual, more anteriorly (Claeson, 2011; Johanson et al., 2013).
However, Criswell et al. (2017) recently demonstrated that in the ray Leucoraja erinacea (Little skate; Figure 1), vertebral development began as a continuous rostrocaudal cartilaginous sheath from which vertebrae were formed via division of this sheath into separate elements. One implication of this is that the synarcual in Leucoraja represents the anterior or rostral remains of this cartilaginous sheath, rather than resulting from vertebral fusion. Another implication is that chondrichthyans possess the ability to resorb cartilage in order to form the separate vertebra, however, resorption is generally thought to be absent in chondrichthyans (Dean et al., 2015).
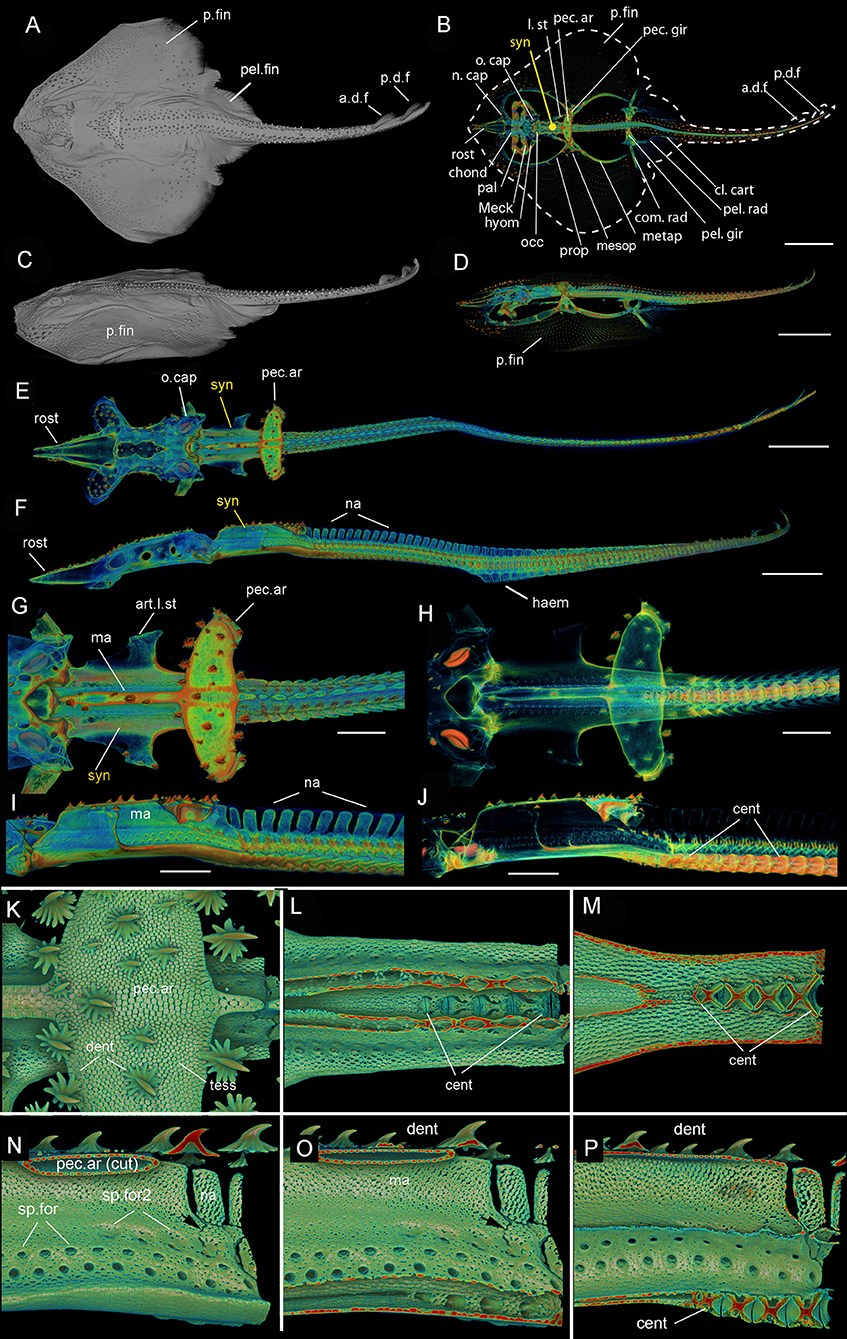
Figure 1. Leucoraja erinacea, adult (BMNH 2018.9.26.1), 3D rendered μCT scans (A,C–P), grayscale (A,C), and false colored (D–P). (A) Dorsal view, (C) lateral view of entire individual; (B) outline of dorsal view showing general morphology; (D) lateral view of entire individual; (E) dorsal view, (F) lateral view, of entire individual, pectoral fins virtually removed; (G) dorsal view of posterior chondrocranium, synarcual and anterior unfused vertebrae, (H) with mineralized tissues partially virtually removed; I, lateral view of posterior chondrocranium, synarcual and anterior unfused vertebrae, (J) with mineralized tissues partially virtually removed; (K) dorsal view of pectoral arch, mineralized tesserae and denticles; (L,M) dorsal view, dorsoventral section through pectoral arch and median ridge of the synarcual to expose anteriormost centra; (N–P) posterior synarcual, (N) lateral view, (O,P) sagittal section through synarcual to expose anteriormost centra. Black arrows indicate separated vertebral elements being incorporated into the synarcual. a.d.f, anterior dorsal fin; art.l.st, articulation for the lateral stay; cent, centrum; chond, chondrocranium; cl.cart, clasper cartilage; dent, denticles; haem, haemal arch; hyom, hyomandibular; l.st, lateral stay; ma, median ridge; Meck, Meckel's cartilage; mesop, mesopterygium; metap, metapterygium; n.cap, nasal capsules; na, neural arch; o.cap, otic capsules; occ, occipital; p.d.f, posterior dorsal fin; p.fin, pectoral fin; pal, palatoquadrate; pec.ar, pectoral arch; pec.ar(cut), pectoral arch, cut; pec.gir, pectoral girdle; pel.rad, pelvic fin radial; pel.fin, pelvic fin; pel.gir, pelvic girdle; prop, proterygium; rost, rostrum; sp.for, spinooccipital foramen; sp.for2, second series of spinoccipital foramina; syn, synarcual; tess, tesserae. Anterior to the left.
Another consideration is the extent to which the synarcual represents axial regionalization resulting from nested expression of Hox genes. As demonstrated by Burke et al. (1995), the anterior cervical region is associated with an anterior expression boundary of Hoxc6 marking the cervico-thoracic boundary, across a variety of vertebrates, including zebrafish (Morin-Kensicki et al., 2002). Chondrichthyans were previously thought to lack the HoxC gene cluster (Oulion et al., 2010; King et al., 2011), which would seem to accord with the work of Criswell et al. (2017), which claims that the synarcual is the remnant of a resorbing cartilaginous sheath rather than a specified region of the vertebral column. However, as described further below, we found multiple Hoxc genes expressed in Leucoraja, with some notable differentiation between the synarcual and more posterior vertebrae, suggesting anterior regionalization in the vertebral column.
To investigate these hypotheses, we examined multiple ontogenetic stages of Leucoraja erinacea via x-ray computed tomography (μCT-scanning), classic histology and tissue staining, as well as transcriptomes from the synarcual region and a more posterior region of the vertebral column, from two ontogenetic stages (28, 33; Ballard et al., 1993; Maxwell et al., 2008). In particular, histological sections from two early developmental stages suggest that the synarcual is a separate structure compared to the rest of the vertebral column, supported by the distinct Hoxc gene expression in the synarcual relative to the more posterior column.
The University of Sheffield is a licensed establishment under the Animals (Scientific Procedures) Act 1986. All animals were culled by approved methods cited under Schedule 1 to the Act. Embryos of the Little Skate, Leucoraja erinacea, were purchased from the Marine Biological Laboratory, Woods Hole MA, USA, and maintained in artificial seawater aquariums at the University of Sheffield Department of Animal and Plant Sciences at 12°C under a 12 h light/dark cycle. Embryos were removed from their eggcases and sacrificed with the anesthetic MS-222 (tricaine) at 300 mg/L in artificial seawater.
The synarcual and post-synarcual regions of the axial skeleton of two males at stage 28 and stage 33, respectively (Ballard et al., 1993; Maxwell et al., 2008) were dissected in PBS at 4°C. The central nervous system and axial musculature was removed and the remaining skeletal tissue was flash frozen in liquid N2 in aluminum foil envelopes. Frozen tissue was pulverized with a hammer and total RNA was extracted using the Trizol® method employing a Qiagen TissueLyser II to complete the dissociation. The resulting total RNA was further purified using the Qiagen RNeasy kit. Quality and quantity were assessed with the Agilent Tapestation High Sensitivity RNA Screen Tape and only samples with RIN values > 8.0 were processed for sequencing. In total, four RNA samples were prepared: stage 28 synarcual (28Syn), stage 28 post-synarcual (28PSyn), stage 33 synarcual (33Syn), stage 33 post-synarcual (33PSyn). Total RNA from these four samples was sent for Illumina next-generation sequencing by the Sheffield Diagnostic Genetics Service at the Sheffield Children's Hospital. Libraries were prepared using the Truseq RNA library preparation kit v2 (2 × 100 bp, unstranded) and sequenced in a pooled lane on a HiSeq2000 sequencer on high-throughput mode generating 132,470,224 reads and 12.32 Gbp (average read length = 93 bp). The raw sequences have been deposited in the Gene Expression Omnibus (GEO) database, https://www.ncbi.nlm.nih.gov/geo (accession no. GSE121572).
Prior to assembly, prinseq-lite was used to filter and trim raw read data by quality score (>20), length (>50), sequence complexity and duplication levels using the following parameters [–min_qual_mean 20 -min_len 50 -min_qual_mean 20 -ns_max_p 5 -trim_qual_left 20 -trim_qual_right 20 -trim_ns_left 1 -trim_ns_right 1 -trim_qual_type min -trim_qual_rule lt -trim_tail_left 10 -trim_tail_right 10 –lc_method dust –lc_threshold 7 -out_format 3]. Trinity v2.2.0 (Grabherr et al., 2011) was used to assemble all four libraries into a single reference assembly, Ler_Trinity_raw, using both paired, and unpaired data which passed QC, default kmer value (k = 25), and retaining all contigs with a minimum length of 300 bp. DETONATE v1.11 (Li et al., 2014) and Transrate v1.0.0 (Smith-Unna et al., 2016) were used to filter chimeric, fragmented, or locally misassembled transcripts. Using empirically determined thresholds for RSEM-EVAL scores and Transrate contig scores, transcripts which ranked below the threshold for both methods were removed. The cd-hit-est algorithm (Li and Godzik, 2006; Fu et al., 2012) was used to cluster isoforms at a similarity threshold of 95% over at least 50% length of the shortest sequence (-c 0.95 –aS 50).
To retain only putative chordate protein-coding sequences and assign preliminary “Best-Blast” annotations to transcripts, the Trinotate pipeline v 3.0.1 (https://trinotate.github.io) was executed using a chordate-only subset of the Uniprot/Swiss-Prot (UPSP_chord) database for all blastx and blastp steps (Altschul et al., 1990). Transcripts were further subject to blastx searches against seven NCBI Refseq proteomes, including three sarcopterygians (Homo sapiens, Mus musculus, Latimeria chalumnae) two actinopterygians (Danio rerio and Lepisosteus oculatus) and two chondrichthyans (Callorhinchus milii, and Rhincodon typus). Contigs with blast e-values < 1 × 10⁻¹⁰ against either UPSP_chord or one of the 7 Refseq proteomes were retained in the Ler_Trinity_cDNA transcriptome.
In order to improve homology assignment, we used Conditional Reciprocal Best Blast (CRBB) (Aubry et al., 2014). It was run against each of the seven NCBI Refseq transcriptomes and each transcript in the Ler_Trinity_cDNA transcriptome was annotated with a single gene name, official gene symbol (numbered if more than one homolog was predicted), and corresponding Refseq ID. Priority was given to references with the most comprehensive GO annotations for functional annotation in the order: H. sapiens > M. musculus > D. rerio > L. oculatus > L. chalumnae > C. milii > R. typus. The resulting filtered, parsed and annotated transcriptome, Ler_Trinity_CRBB, was used for all downstream analyses.
Using the unique Refseq ID assigned via CRBB, the DAVID knowledgebase v 6.8 (Sherman et al., 2007) was used to extract functional annotations associated with the corresponding reference sequences, and these were extended to the L. erinacea transcripts. GO molecular function (GO_MF), cellular component (GO_CC), and biological process (GO_BP) annotations were annotated to all transcripts. Annotations were mapped to GO terms and to GOslims using the GO.db v3.6.0 R package. Multiple sequence alignments were created using MAFFT v7.397 (Katoh and Standley, 2013) and visualized using ESPript v3.0 (Robert and Gouet, 2014).
Expression analyses were conducted via the pipeline packaged with Trinity v2.2.0. Unfiltered read data for the 28Syn, 28PSyn, 33Syn, and 33PSyn reads were aligned to the reference Ler_Trinity_CRBB transcriptome using bowtie2 (Langmead and Salzberg, 2012). RSEM (Li and Dewey, 2011) was used to estimate transcript abundance by calculating TMM-corrected TPM values for each transcript. Scatterplots and heatmaps were generated from these data in R.
Scanning of L. erinacea specimens was performed at the Imaging and Analysis Center, Natural History Museum, London. The adult specimen was scanned using the Metris X-Tek HMX ST 225 CT scanner, while embryonic specimens (whole) and synarcual regions (scout-and-zoom) were scanned on the ZEISS Xradia 520 Versa CT-scanner using 0.1X and 4X apertures, respectively. Embryonic samples for contrast-enhanced micro-CT analysis were stained with 0.1% phosphotungstic acid (PTA) wt/vol in 100% EtOH for 3 days with gentle agitation, and washed with 70% EtOH for at least 2 days prior to imaging in 70% EtOH. Three-dimensional reconstructions and color visualizations were made using Avizo 9.0 (https://www.fei.com/software/amira-avizo/) using either opaque grayscale (Adult, Figures 1A,C; hatchling Figures 3B,D,E; embryos Figures 4E,H,J, 5D,F) or semi-transparent rainbow (Adult and hatchling, Figures 1B,D,E–J, 2, 3A,C; embryos Figures 4A–D,F,G,I, 5A–C, E) transfer functions. Further reconstructions (Figures 1K–P) were made with Drishti (github.com/AjayLimaye/drishti).
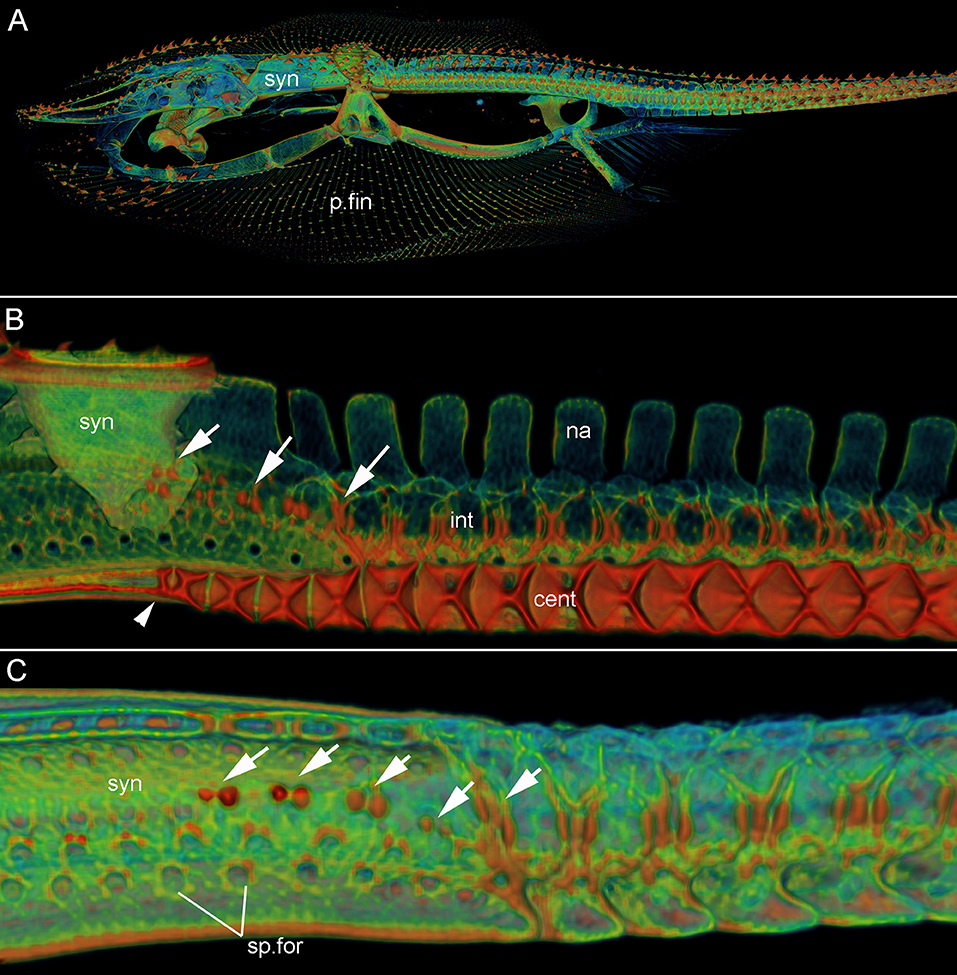
Figure 2. Leucoraja erinacea, adult (BMNH 2018.9.26.1), 3D rendered μCT scans, false colored. (A) Lateral view, entire specimen; (B) lateral view, sagittal section through synarcual and anterior vertebrae; (C) lateral view, synarcual and anterior vertebrae. White arrows indicate vertebral mineralization within the synarcual (marking sp.for2), continuous with mineralization in unfused vertebrae more posteriorly. Abbreviations as in Figure 1, also: int, intervertebral element. Anterior to the left.
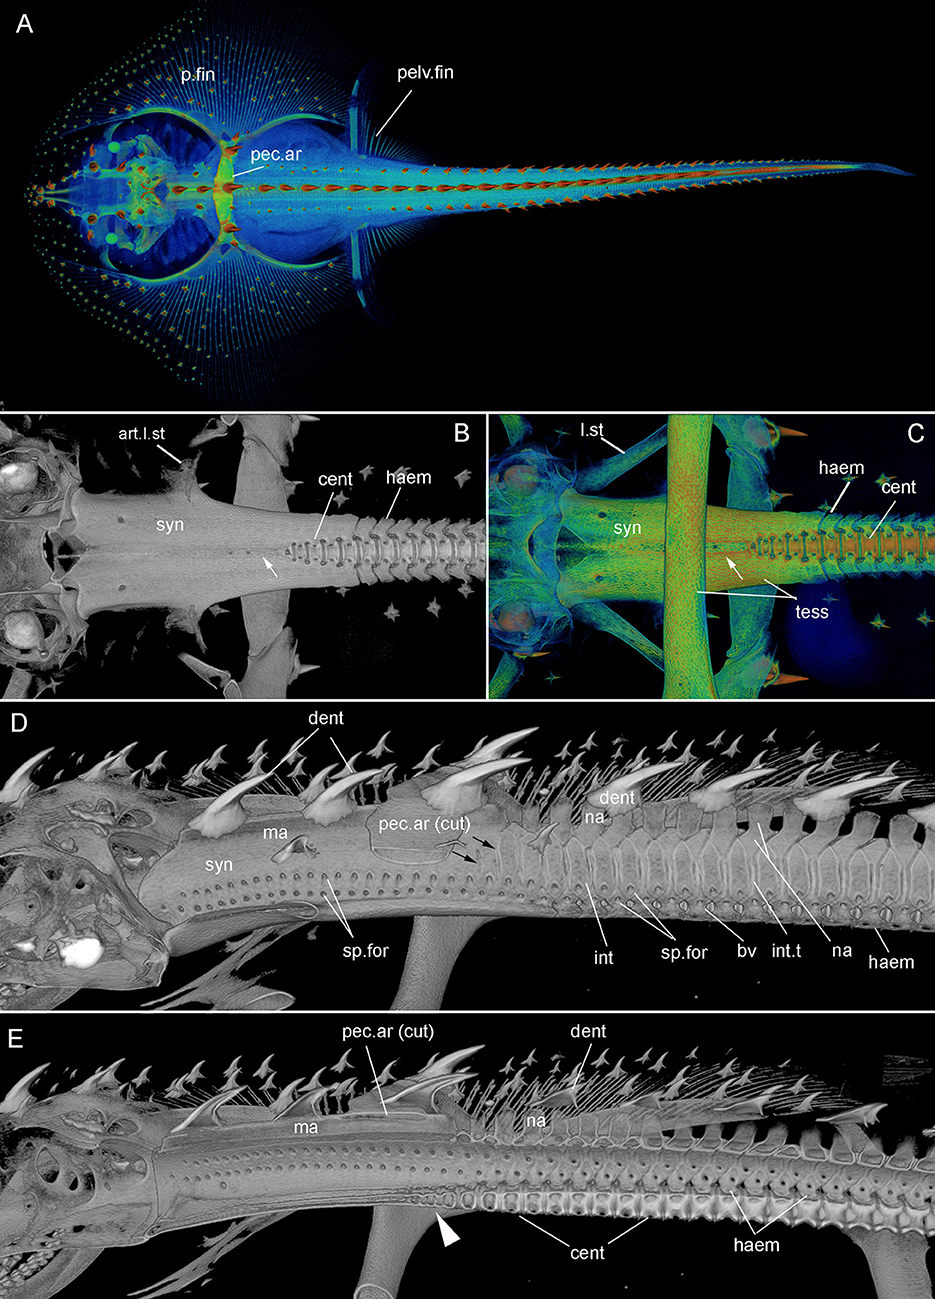
Figure 3. Leucoraja erinacea, hatchling (BMNH 2018.9.26.2), 3D rendered μCT scans, false colored (A,C), grayscale (B,D,E). (A) Dorsal view of entire specimen; (B, C) ventral view of posterior braincase, synarcual and anterior unfused vertebrae. White arrows indicate shallow furrow in ventral surface of the synarcual; (D,E) lateral view, of posterior braincase, synarcual and anterior unfused vertebrae; (E) sagittal section. Black arrows (D) indicate separation of vertebral elements within the posterior synarcual. White arrowhead (E) indicates reduced centra within the posterior synarcual. Abbreviations as in Figures 1, 2, also: bv, basiventral; int.t, intervertebral tissue. Anterior to the left.

Figure 4. Leucoraja erinacea, PTA staining, 3D rendered μCT scans, false colored (A–D,F,G) grayscale (E, H, J). (A, B) st. 24, Dorsal view of entire individual, (B) dorsal view including developing cranium, pharyngeal arches, pectoral fin; (C–E) st. 28 (BMNH 2018.9.26.5), (C) dorsal view of individual, (D) lateral view of developing pharyngeal arches, pectoral fin; (E) virtual sagittal section showing internal morphology; (F–J) st. 30 (BMNH 2018.9.26.4). (F,G) Posterior cranium, synarcual and more posterior vertebrae, white arrowheads indicate separation of vertebrae within synarcual; (H–J) virtual sagittal section showing internal morphology (cartilages as black spaces), (J) white arrowheads indicate separation of vertebrae within synarcual. Abbreviations as in Figures 1–3, also: drg, dorsal spinal nerve root ganglia; int.t, intervertebral tissues; m, musculature; nc, notochord; ot, otic region; p.a, pharyngeal arches. Anterior to the left. Scale bars: (A,C) = 1 mm; (B,D,E–J) = 500 um.
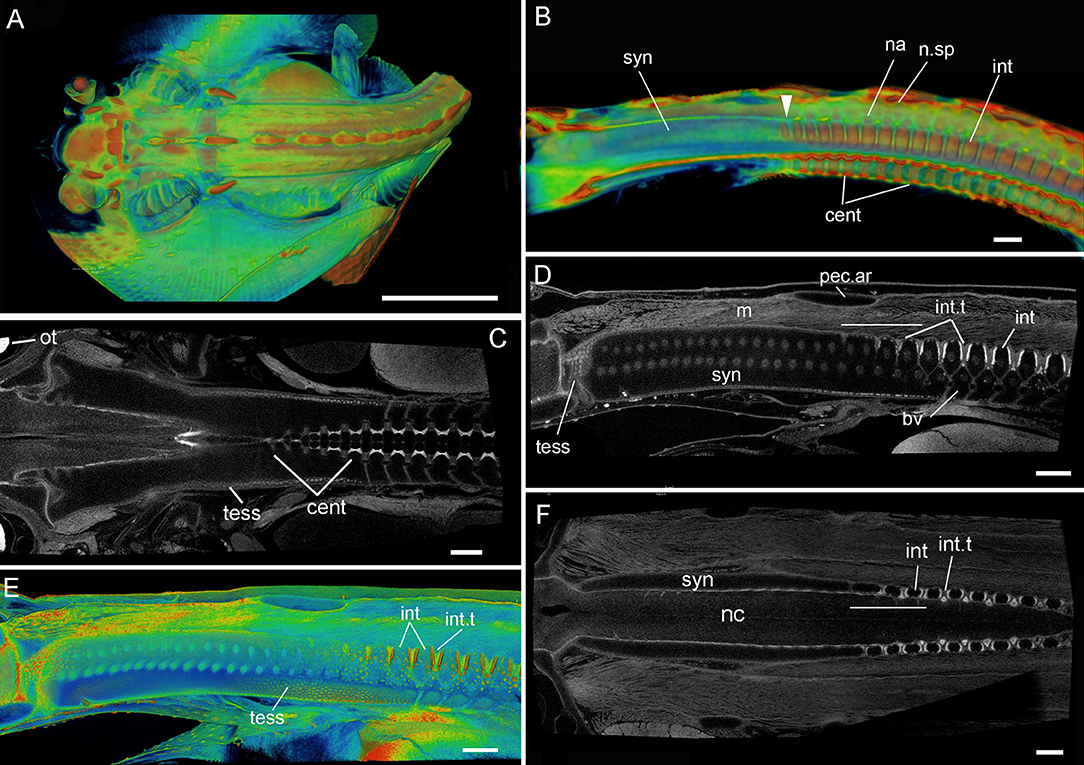
Figure 5. Leucoraja erinacea, st. 33 (BMNH 2018.9.26.3), PTA staining, 3D rendered μCT scans, false colored (A,B,E) grayscale (C,D,F). (A) Dorsal view of individual; (B) virtual sagittal section showing internal morphology of synarcual and more posterior vertebrae; (C,F) dorsoventral virtual section through synarcual; (D,E) virtual sagittal section showing internal morphology (with respect to vertebral column, cartilages= black spaces; intervertbral tissue=light gray, mineralization=white). Abbreviations as in Figures 1–4, as well, n.sp, neural spines. Scale bars: (A) = 1 cm; (B) = 1 mm; (C–F) = 500 um.
Little skate embryos sacrificed as described above were fixed in fresh 4% paraformaldehyde in PBS overnight at 4°C. Embryos were dehydrated in an ethanol series and retained at least overnight in 100% EtOH at −20°C. Samples were vacuum-embedded in paraffin by the Histology Hub Service, Dept. of Infection, Immunity and Cardiovascular Disease at the University of Sheffield according to standard protocols. Sections (14 μm) were cut using a Leica RM2145 microtome. Rehydration was carried out with graded xylene/ethanol/water series according to standard methods. Trichrome staining was carried out during progressive rehydration first with 0.01% Alcian blue in 70% EtOH for 1–2 h, followed by standard haematoxylin and eosin staining. Slides were imaged using an Olympus BX63 compound microscope in the Sackler Imaging Suite at the Natural History Museum, London. Images were captured using an Olympus BX63 microscope, with Olympus DP73 camera and Cell Sens Dimension software, with images modified (Adobe Photoshop) to improve contrast.
BMNH: Life Sciences Collection, Natural History Museum, London.
The synarcual forms the anterior region of the vertebral column and articulates to the rear of the braincase via an extended lip or odontoid process (Miyake, 1988; Claeson, 2011; da Silva and de Carvalho, 2011; Moreira et al., 2011). In batoids like Leucoraja, characterized by enlarged pectoral fins (Figures 1A–D (adult), Figure 3A (hatchling), p.fin), one of the functions of the synarcual is to support these fins via lateral stays, which are rectangular rods articulating to the synarcual and pectoral girdle (Figures 1B,G (adult), Figures 3B,C (hatchling), l.st, art.l.st). Dorsally, an anteroposterior median ridge is present (Figures 1G,I,O (adult), Figures 3D,E (hatchling), ma), which supports a series of large thorn-shaped dermal denticles (Figures 1K,N–O (adult), Figures 3A,D,E (hatchling), dent). These denticles continue more posteriorly, atop the neural arches, covering pairs of these arches (Figure 3D, na). The median ridge also supports the pectoral girdle via the pectoral arch, contacting the arch ventrally [Figures 1G,H,K,N,O (adult), Figures 3A,D,E (hatchling), pec.ar, pec.ar(cut)].
In ventral view, the edges of the synarcual meet medially, but not posteriorly, where a shallow furrow is present (Figures 3B,C, small white arrow). In Leucoraja, the synarcual incorporates a small number of mineralized centra posteriorly, although these are absent from most of the anteroposterior length of the synarcual (Figures 1L,M,P, 2B (adult), Figure 3E (hatchling), cent). More posteriorly, the edges of the synarcual can be seen to surround the centra, which decrease in size anteriorly (Figures 1P, 2B, 3E). These edges are aligned with the more posterior, separate, haemal arches (Figures 2B,C, haem).
In lateral view, the synarcual is pierced by foramina for the spinal nerves; these are organized in pairs (Figures 1I,N–P (adult), Figures 3D,E (hatchling), sp.for). More posteriorly, these foramina pierce the interdorsal and basiventral vertebral elements (Figure 3D, int, bv). At the posterior edge of the synarcual, three to four distinct vertebrae are visible, although these are not completely separate (compared to more posterior vertebrae), and can be considered part of the synarcual. The most anterior of these is the least distinct, with only anterior and posterior vertebral boundaries visible, representing the interdorsal (Figures 1N,O, 3D, black arrows). In Figures 1N,O, a second series of spinal foramina is present (sp.for2), dorsal to the regular pairs of spinal foramina in the synarcual, representing the foramina piercing the interdorsal elements incorporated into the posterior synarcual. These elements can also be seen in visualizations where more highly mineralized tissue is shown in red, the foramina are represented by small red dots (mineralization around their edges), arranged serially in register with the foramina in the interdorsal elements more posteriorly (Figures 2B,C, white arrows).
In sagittal section through the synarcual, the vertebral centra are visible, being better developed posteriorly. These show the “double cone” morphology that characterizes the areolar mineralization in the centrum (Figures 1P, 2B (adult), Figure 3E (hatchling), cent), and differs from the surficial polygonal tesselate mineralization seen in the rest of the skeleton (e.g., Figure 1K, tess). Centra decrease notably in size anteriorly, within the posterior synarcual, but still maintain the double cone morphology (Figures 1M,P, 2B, 3B,C,E). The most anterior centrum is substantially reduced (Figures 1L,M (sections in ventral view), Figure 1P (lateral view), Figures 3B,C,E, arrowhead). The anteroposterior extent of these reduced centra matches the three to four incompletely separate vertebral elements at the posterior margin of the synarcual, described above (Figure 2B).
Stages 24 (Figures 4A,B), 28 (Figures 4C–E): At these early embryonic stages (specimens PTA stained), the pharyngeal arches are developing, as are the pectoral and pelvic fins (Figures 4B–D, p.a, p.fin, pelv.fin). The pectoral fins are posterior to the pharyngeal arches, and have not yet expanded anteriorly (Figures 1, 2). The otic region is developing (Figure 4B, ot). External dermal denticles are absent. The dorsal root ganglia of the spinal nerves are visible (Figures 4B,D,E, drg), but there is little indication that the vertebrae or synarcual are developing. These are not apparent until the next available embryonic stage, stage 30 (Figures 4F–J). Because PTA staining does not stain cartilage, these elements are represented by black spaces (e.g., pec.ar, syn, int, Figures 4H–J), although colorized manipulation of the CT-scan images makes these structures clearer (Figures 4F,G,I).
At stage 30 (Figures 4F–J), the synarcual has developed anteriorly (Figures 4F–H,J, syn), with individual and distinct vertebrae developing more posteriorly (Figures 4F,G-I,J, na, int, bv), the transition between these marked by the position of the pectoral arch (Figures 4F–I, pec.ar). Associated musculature is also visible (Figures 4H–J, m). The centra are situated ventral to the neural tube (Figures 4I,J, cent, nt), and as described above, decrease in size anteriorly.
Notably at this stage, the synarcual appears to be divided at multiple points (Figures 4G,H,J, white arrowheads), but primarily ventrally (between the two ventral arrowheads, Figures 4G,H). The degree of separation in this ventral region is uneven, appearing stronger anteriorly (lines of separation just anterior to the more posterior arrowhead being shallower, Figure 4G). These deeper lines of separation are irregular (Figure 4G), which can also be seen in black and white images in Figures 4H,J (arrowheads), where separation between cartilaginous elements (black spaces) is represented by gray lines. In Figures 4G,H, the separation between the distinct more posterior vertebral elements is clear and regular, while more anteriorly between the white arrowheads, lines of separation are weaker and more irregular. This is also seen in Figure 4J, with cartilages below the pectoral arch (pa) more irregular in size and shape (white arrowheads), compared to more posterior vertebrae with thicker and more regular intervertebral tissues (int.t).
In stage 33 (Figure 5), this division within the synarcual is largely absent, with more posterior vertebral elements more clearly separated into interdorsal, neural arch and neural spines (Figure 5B, int, na, n.sp). These elements and the centra are mineralizing, with the anteriormost 3-4 interdorsal vertebrae and centra being smaller than those more posterior (Figures 5B,C). In Figure 5C, this anterior reduction in the centra appears regular, along with an absence of mineralization that characterizes more posterior centra (lighter gray represents higher mineralisation). Ongoing mineralization of the synarcual is represented by the appearance of distinct tesserae on the cartilage surfaces (Figures 5C–E, tess). The anterior and posterior margins of the interdorsals are also mineralizing (white edges, Figure 5D, red edges, Figure 5E), with the interdorsal separated by intervertebral tissue (Figures 5D–F, int.t). The thickness of this tissue, and degree of mineralization of the interdorsal margins decreases anteriorly toward the pectoral arch and the posterior margin of the synarcual, involving 3-4 elements (transverse white line, Figures 5D,F). Distinct basiventrals are also visible ventrally (Figure 5D, bv).
Sections in the horizontal plane provide dorsal-ventral sections through individuals of stages 31 and 33, which illuminate the development of the synarcual as well as the more posterior axial skeleton, particularly the vertebral centra (Criswell et al., 2017).
In stage 31 (Figures 6C–F), the development of the synarcual relative to the axial skeleton is best shown at the posterior margin of the synarcual. Here, there are two distinct cartilaginous regions forming. The first is a central axis of cartilage associated with the notochord (nc; Criswell et al., 2017), and a second, large region of cartilage more anteriorly, representing the synarcual. The separation between these two regions is indicated by a strip of less strongly stained (Alcian) cartilage anteriorly (black arrowheads, Figure 6C). Posteriorly, the developing synarcual surrounds the central cartilage axis and notochord (Figures 6C–F, white arrows). The synarcual cartilage is surrounded by a stained layer of cells, representing the perichondrium (Figures 6C–F, pc). It appears that mesenchymal cells in the perichondrium are transforming to distinct cells, chondroblasts (Figures 6D,F, black asterisk), contributing to the posterior growth of the synarcual.
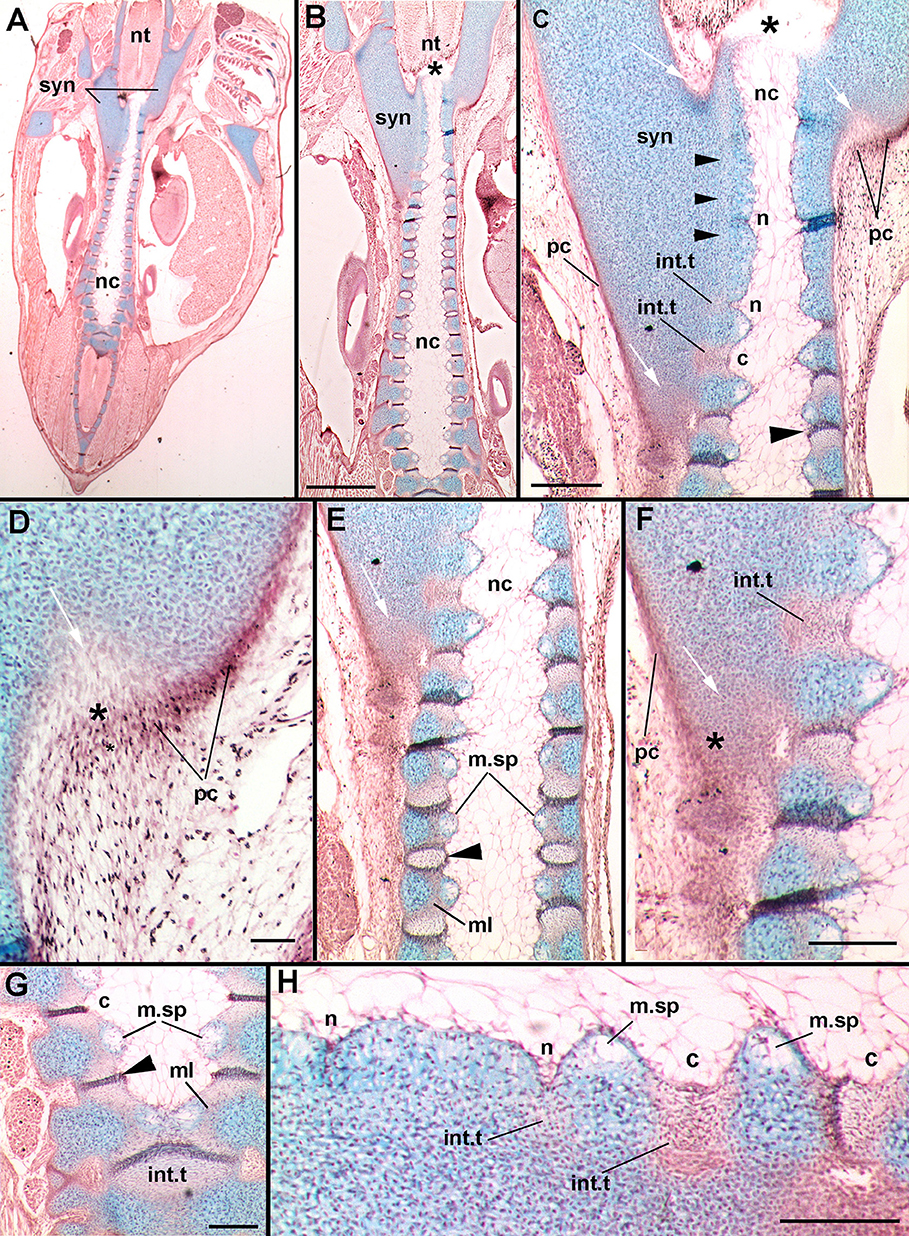
Figure 6. Leucoraja erinacea, st. 31, horizontal histological sections, stained with alcian blue, haematoxylin, and eosin. (A) overview of vertebral column and synarcual; (B) closeup of posterior synarcual and separate vertebral column (central axis); (C) closeup of posterior synarcual and anterior vertebral axis, white arrows indicate developing cartilaginous cells (also C–F) black arrowhead indicates developing intervertebral tissue; asterisk in (B,D) indicates anterior end of central vertebral axis; (D), closeup of area indicated in (C); (E) closeup of posterior synarcual and central vertebral axis, black arrowhead indicates developing intervertebral tissue; (F) closeup of area indicated in (E); (G) more posterior central vertebral axis, showing medial spaces and intervertebral tissues fusing to become single units, black arrowhead indicates developing intervertebral tissue; (H) closeup of anterior vertebral axis indicated in (C) rotated, showing developing notches (developing into intervertebral tissue) and protrusions (developing into centra). Abbreviations as in Figures 1–4, also: c, concavity; ml, middle layer; m.sp, medial space; n, notch; pc, perichondrium. Scale bars: (B,C,F–H) = 2 mm; (D) = 0.05 mm.
Within the confines of the synarcual, the central cartilaginous axis continues anteriorly and appears to end at a boundary between the notochord and neural tube, where it curves slightly medially (Figures 6B,C, black asterisk). More anteriorly, the cartilage of the axis is continuous, and the boundary between the cartilage and the notochord is straight (Figures 6C,E,F). However, more posteriorly, this boundary becomes wavy, with a notch forming in the boundary that subsequently widens into a concavity (Figures 6C,H, n, c). The effect of this is to create cartilage protrusions medially and to constrict the notochord at regular intervals (Figure 6B; Criswell et al., 2017). The cells lateral to the notch appear to be transforming into new cells (eosin-staining a reddish color), suggested to be cells that will form the intervertebral tissue (Figures 6C,F,H, int.t).
These regions of eosin-staining cells enlarge along with the enlargement of the notch into a wider and deeper concavity. A distinctly staining ridge of cells forms within this region, originally in proximity to the cartilage, but then separating the concavity into two sections more posteriorly along the central vertebral axis (Figures 6C,E vs. Figure 6G, large black arrowheads). As well, a medial space appears within the cartilage separated by the concavities (m.sp, Figures 6C,E,F–H) filled with mesenchymal cells surrounded by alcian-staining matrix, distinct from the cartilaginous chondroblasts (e.g., Figures 6H, 7C). More posteriorly, these opposing spaces and their cells meet in the midline (Figure 7C), as do the eosin-staining regions bisected by the distinctly staining ridge (Figures 6G, 7C, black arrowheads). Differences between the lateral and medial cartilages (chondrocytes vs. mesenchymal cells) suggest that these are two separate layers of cartilage, previously identified as inner and outer layers associated with the development of the centrum (cf. Criswell et al., 2017), with the outer layer developing first. Between these two layers, a separate region is developing, called the middle layer (Criswell et al., 2017; eosin-staining, Figures 6E,G, ml). Given these observations, it appears that the development of the distinct cartilaginous axis proceeds from posterior to anterior.
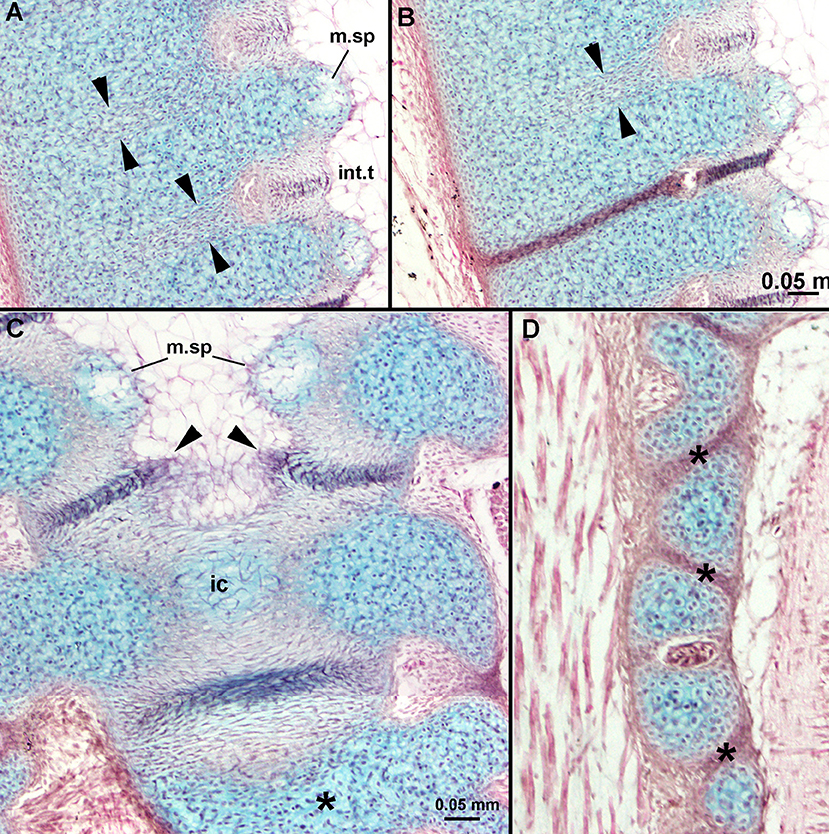
Figure 7. Leucoraja erinacea, st. 31, horizontal histological sections, stained with alcian blue, haematoxylin and eosin. (A,B) Showing developing intervertebral tissue, along with aligned and differentiating cells extending from developing intervertebral tissue to lateral margin of the cartilage (between black arrowheads), these staining with haemotoxylin more posteriorly (B); (C) more posteriorly along central vertebral axis, showing developing internal cartilage (ic), resulting from midline fusion of medial spaces filled with mesenchymal cells. More posteriorly, extracellular matrix (staining blue) is being deposited (asterisk); (D) separation of vertebral elements (asterisks) from originally continous cartilage sheath. Abbreviations as in previous figures, also, ic, internal layer of cartilage. Scale bars: (B,C) = 0.05 mm.
In sections taken slightly more ventrally, a line of cells extending within the cartilage is apparent, running laterally from the concavity filled with eosin-staining cells (Figures 7A,B, cells between the black arrowheads). We suggest this line of cells also represents the intervertebral tissue, marking a point of developing separation within the cartilage (Figure 7B). Separation of the cartilages of the central vertebral axis into smaller interdorsal and basiventral elements is also occurring (Figure 7D, asterisk).
In stage 33 (Figure 8), the synarcual, the separate vertebral elements and centra have begun to mineralize. In the synarcual and vertebral elements, this mineralization involves the formation of tesserae (tess, Figures 8C–E; Dean et al., 2015; Criswell et al., 2017; Seidel et al., 2017). At this stage, these tesserae are surficial, although more than one layer can be present (Dean and Summers, 2006), and are rounded, with no visible intertesserae connections yet formed (Dean et al., 2015). The cartilage beneath the tesserae appears to be regular hyaline cartilage, rather than globular cartilage (Dean et al., 2009).
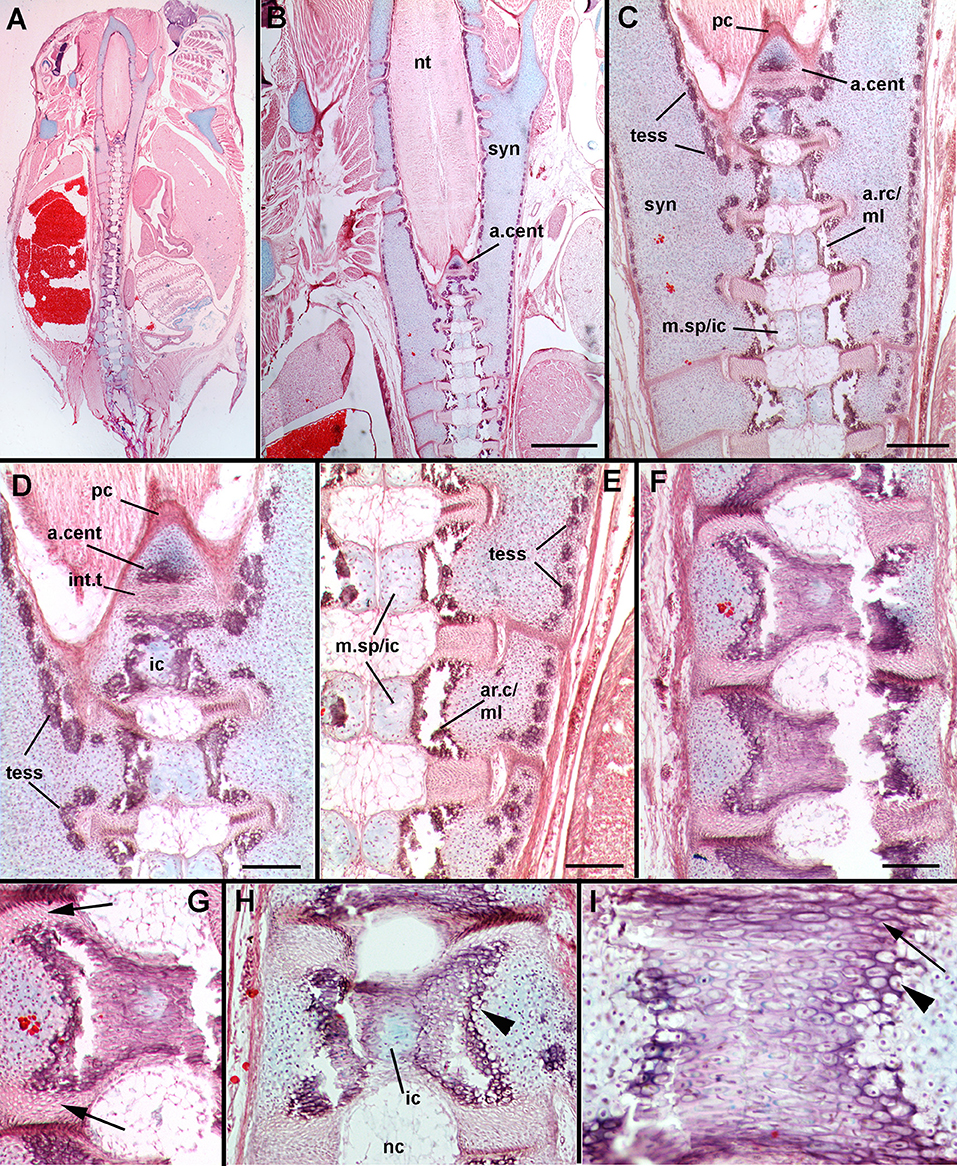
Figure 8. Leucoraja erinacea, st. 33, horizontal sections, stained with alcian blue, haematoxylin and eosin. (A) Overview of vertebral column and synarcual; (B) closeup of posterior synarcual and separate vertebral column (central axis), including anteriormost centrum; (C) closeup of posterior synarcual and anterior vertebral axis, with anteriormost centrum and surrounding perichondrium; (D) closeup of area indicated in (C) showing differences between internal cartilage and anteriormost centrum, tesserae developing along cartilage surfaces; (E) closeup of central vertebral axis, with internal cartilage developing within medial cartilages and meeting in midline, areolar mineralization in centra occuring in middle layer; (F–I) mineralizing centra, showing contribution of cells from the outer layer of cartilage (H,I, black arrowheads) and intervertebral tissue (G,I, black arrow). Mineralization is occurring around inner layer of cartilage (H). Abbreviations as in Figures 1–7, also: a.cent, anteriormost centrum; ar.c/ml, areolar cartilage/middle layer; ic, internal cartilage layer; m.sp/ic, medial space/internal cartilage layer. Scale bars: (B–F) = 2 mm.
With respect to the centra, more posterior vertebrae show that the medial spaces in stage 31 have increased in size (m.sp, Figures 8C,E), with the cells within the space now having transformed into chondroblasts. Cartilage matrix (staining blue, Alizarin) continues to be deposited. Again, this represents the inner layer of cartilage, closest to the notochord (Criswell et al., 2017), differing from the more lateral outer cartilage layer in having relatively more extracellular matrix. Mineralization is occurring within the middle layer, representing areolar mineralization of the centra (ar.c/ml, Figures 8C,E), with more lateral tissues, including the cartilage and intervertebral tissue appearing to also contribute to the increasing mineralization of these centra. This includes cells from the more laterally positioned hyaline cartilage (Figures 8H,I, black arrowheads), which are rounded, mineralized (staining reddish, with haematoxylin and eosin), and appear continuous morphologically with the more lateral chondroblasts of the hyaline cartilage (staining blue). In addition, cells forming the intervertebral tissue also contribute; these are more elongated cells, again, mineralized within the centrum (Figure 8I, black arrow), and are morphologically continuous with the elongate cells of the intervertebral tissue (Figure 8G, black arrow). As well, the centrum develops and mineralizes external to the inner layer of cartilage (Figure 8H, ic).
Continuing anteriorly, the medial cartilages forming the internal cartilage layer are reducing in size, as are the mineralized areolar cartilages (Figures 8B,C). The size and shape of the anterior two vertebral elements appears to be controlled by the shape of the V-shaped perichondrium (eosin-stained layer of cells, Figure 8C, pc). In particular, the anteriormost vertebral element is associated with a triangular cartilage, and areolar mineralization. Following the description above, this should represent the internal cartilage layer next to the notochord and the developing centrum, separated from the more posterior vertebra by a thick intervertebral tissue (a.cent, iv, Figures 8B–D). However, the most anterior cartilage resembles the outer layer of hyaline cartilage, with less extracellular matrix, compared to the internal layer, which has fewer cells and more matrix (Figure 8D, a.cent vs. ic). The shape and size of these anterior vertebrae conforms to those seen in μCT scans (eg., Figure 3E).
Transcriptomes were evaluated from Leucoraja stages 28 and 33 (Tables S1–5), and between the synarcual region and the more posterior vertebral column. The absence of replicates precludes a statistically relevant investigation of differential expression. It should also be noted that although blastx searches were conducted against two chondrichthyans (Callorhinchus milii and Rhincodon typus), most search results involved Homo sapiens. We assume homology across Vertebrata in this instance and that relevant orthologs have been identified. With these caveats, general observations can be made regarding the genes expressed and more specifically with the different regions of the vertebral column at these two stages (Figures 9–12). For example, normalized expression levels between the four samples were highly similar (Figure 9), as were the annotations to transcripts expressed in the four samples. These results would be expected since all four samples are of the same tissue type. However, by examining the heatmaps for particular genes more closely, we can recover differences in expression that are potentially relevant to synarcual development.
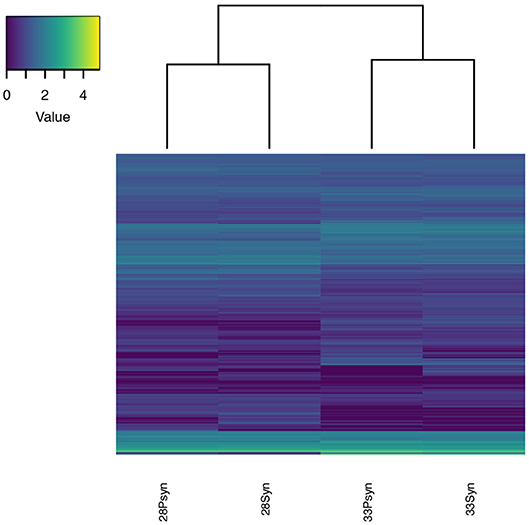
Figure 9. Heatmap of normalized expression. Expression levels for the four samples are similar, which is expected since the samples are from the same tissue type. The samples cluster in pairs by stage with the stage 28 and stage 33 sample expression being more similar to each other than to the other stage.
From the μCT scans and histological sections described above, the synarcual appears to develop initially as a block of cartilage surrounding the vertebral column (Figure 6). Development continues posteriorly, with incorporation of anterior mineralized vertebrae via deposition of cartilage and loss of mineralization of incorporated vertebrae (Figures 2, 3). We were interested in transcripts related to these processes, and so focussed on those associated with anteroposterior regionalization (designating an anterior area linked to development of a separate cartilage block, for example Hox-like genes, Table S5), along with those annotated to cartilage development (GO:0051216), osteoclast development (GO:0045453) and bone resorption (GO:0045453) (Figures 10–12; Tables S2–4). Although chondrichthyans lack bone (Dean et al., 2017), multiple genes related to bone resorption and osteoclast development were recovered (Figure 11), and our prediction would be that these would show higher levels of expression at stage 33 (Figure 5).
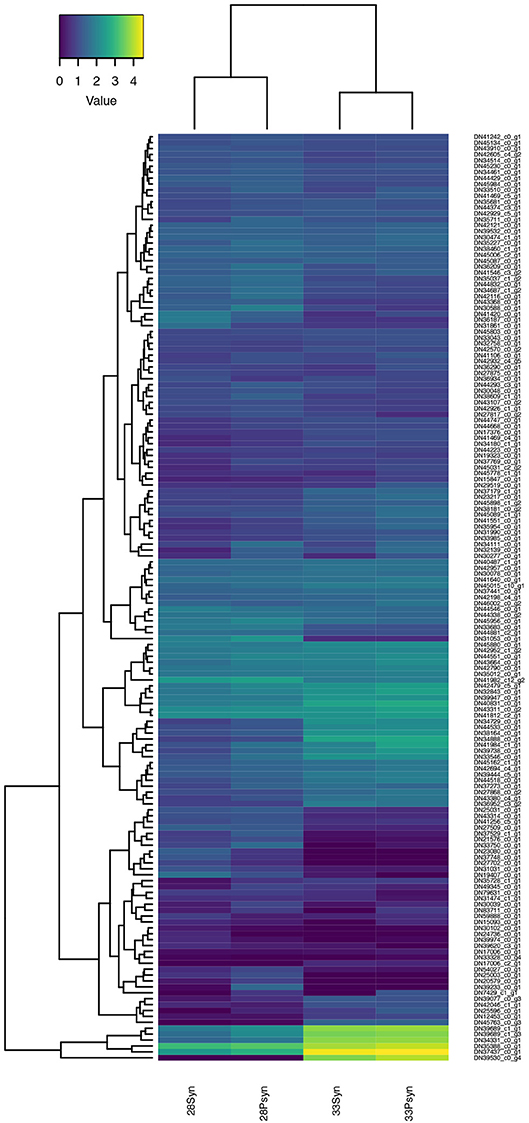
Figure 10. Heatmap of normalized expression for genes annotated to the gene ontology term “cartilage development” (GO:0051216). A cluster of these genes, including Col2A1-like, Col10A1-like, and Col11A1-like genes, have increased expression at stage 33.
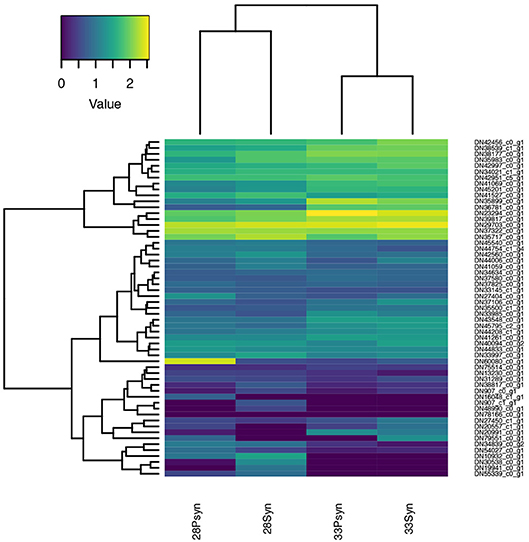
Figure 11. Heatmap of normalized expression for genes annotated to the gene ontology terms “bone resorption” (GO:0045453) and “osteoclast development” (GO:0036035). Although chondrichthyans are thought to lack these processes, several genes are expressed in the four samples.
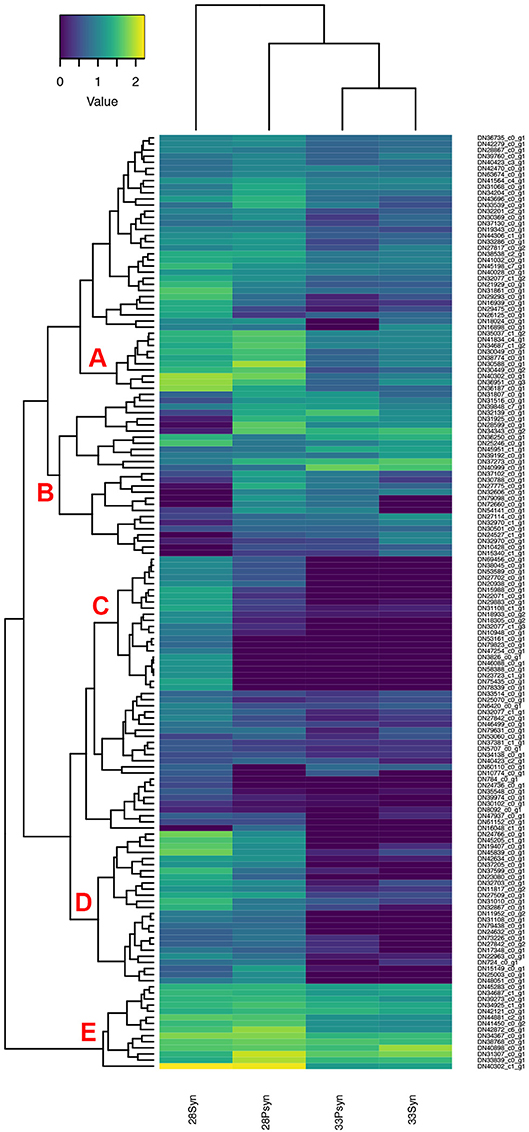
Figure 12. Heatmap of normalized expression for genes annotated with the SMART hox domain (SM00389). There are five regions within the heatmap relevant to synarcual development (A–E). Although chondrichthyans were previously thought to lack HoxC genes, a Hoxc6-like, and a Hoxc9-like are expressed, in addition to a large number of other Hox genes.
Cartilage takes multiple forms in vertebrates, but much of the skeleton in early development comprises hyaline cartilage (Hall, 2005). Formation of hyaline cartilage involves a series of steps, including the proliferation of mesenchymal cells and transformation of these into chondrocytes. These chondrocytes deposit extracellular matrix resulting in interstitial cartilage growth, while growth can also be appositional, via addition to the cartilage surface.
A variety of expressed genes related to cartilage development have been found in both Leucoraja stages (Table S2). For example, a large component of the extracellular matrix is composed of Type II collagen, which forms fibrils within the matrix, and depends on the expression of Col2A1. Sox9 is expressed in the mesenchymal condensation differentiating into chondrocytes and then has a role in regulating chondrocytes, binding to sequences in Col2A1 and Col11a2 genes, these being chondrocyte specific markers (Bi et al., 1999; Obha et al., 2015). Sox9-like is recovered from the Leucoraja transcriptome, as are Col11A2-like and Col2A1-like.
Heatmaps based on normalized expression levels (Figure 10) show highest expression of genes related to cartilage development in the stage 33 synarcual and postsynarcual.
These include Col2A1-like, and other collagen genes such as Col10A1-like and Col11A1-like, which encode Type X and XI collagen, respectively. Col10A1 is also expressed in hypertrophic cells as part of the process of endochondral bone formation, while Col11A1 has an important role in endochondral bone formation (Hafez et al., 2015). LectT1 is also upregulated in stage 33 (skeletal system development, cartilage development), and is related to vascularization, including the calcified cartilage, post-hypertrophy. Although not part of the group of genes showing the highest expression, Mefc2 is known as a master regulator of cell hypertrophy promoting expression of Col10A1 (Dy et al., 2012; Obha et al., 2015) with Mefc2-like also expressed at higher levels in stage 33. Sox9 is also expressed, but not at the levels of Col2A1-like and Col11A2-like.
Bone is absent from the chondrichthyan skeleton, with mineralization taking the form of small surficial blocks of mineralization, the tesserae (Dean et al., 2015), and mineralization in the vertebral centra, known as areolar mineralization (Moss, 1977; Dean and Summers, 2006; Porter et al., 2006). Although mineralization occurs, chondrichthyans are thought to lack the capacity to resorb this mineralization, with clastic cells being absent (Dean et al., 2017). Nevertheless, multiple genes associated with bone resorption and osteoclast development are expressing (Tables S3, 4). The osteoclasts associated with bone resorption, and the genes associated with these cells are well-known, particularly because of their role in diseases such as osteoarthritis.
In the expression heatmap (Figure 11), six of these genes are highly expressed in the synarcual region and postsynarcual at both stage 28 and 33, and associated via the accompanying dendogram. These include Rac1-like which is annotated to bone resorption, and others related to osteoclasts themselves. Rac1 belongs to the Rho family of small GTPases, involved in regulation of cellular events (Itzstein et al., 2011; Weivoda and Oursler, 2014), including osteoclasts and such features as the lamellipodium and the characteristic ruffled margin associated with the cell.
Other expressing genes annotated to bone resorption include ATP6AP1-like and Ca2-like, associated with positive regulation of osteoclast development and regulation of bone resorption, Csk-like (negative regulation of bone resorption), and Rab7A-like. Among these more highly expressed genes, Rab7A-like showed the highest levels of expression in the synarcual region of stage 28, and is involved in the formation of the distinctive ruffled border of osteoclasts (Itzstein et al., 2011).
Other well-known genes involved in bone resorption (Table S3) include TRAP, as a marker for osteoclasts (also known as ACP5, Hayman et al., 2000; Logar et al., 2007). MMP-9 (Matrix metalloproteinase-9) and Cathepsin K are also expressed in osteoclasts, where they are induced by RANKL signaling, with RANKL signaling through the gene TRAF6 to control MMP-9 (Sundaram et al., 2007). These genes are expressing in the synarcual and postsynarcual in stages 28 and 33, but at lower levels.
Concerning the separate development of the synarcual relative to the remainder of the vertebral column, this may be related to an anteroposterior regionalization of the vertebral column, observed in many other vertebrate taxa and associated with anterior boundaries of expression of particular nested Hox genes (Burke et al., 1995; Morin-Kensicki et al., 2002; Head and Polly, 2015; Böhmer, 2017; Table S5). For example, anterior expression of Hoxc6 was linked to the boundary between the cervical and thoracic region, also recovered in zebrafish (Burke et al., 1995; Morin-Kensicki et al., 2002). Chondrichthyans were previously thought to lack HoxC genes (King et al., 2011), but these have been recently recognized in the sharks Chiloscyllium punctatum, Scyliorhinus torazame, Heterodontus zebra, and the batoid Okamejei kenojei (Hara et al., 2018), including Hoxc8 and Hoxc11 being expressed more posteriorly and so conforming to the anteroposterior nested expression seen in other taxa. By comparison, Hoxc4-like, Hoxc6-like, and Hoxc9-like are expressed in Leucoraja (Regions A and B, Figure 12) and their predicted proteins have sequence similarity with those found in other sharks, and with their CRBB hit (Supplementary Information, Figure 1), particularly across the conserved homeobox domains.
With respect to levels of gene expression indicated by the heatmap (Figure 12), and groups of genes indicated by accompanying dendrogram, there are five regions of interest. In the first, several genes are more highly expressed in stage 28 (Region A), compared to stage 33, and three genes with higher expression in the stage 28 synarcual. These include HoxA2-like, involved in hindbrain development (Tümpel et al., 2008). Genes expressed in Region C also seem to be related to early development such as Otx2-like, Barx1-like, and Gbx2-like.
One region of interest on the heatmap is Region B, where a number of genes have low expression levels in the synarcual of stage 28. These include multiple Hox genes, including Hoxa7-like, Hoxa10-like, HoxB8-like, Hoxc6-like, Hoxd8-like, and Hoxa9-like Hoxd8-like. In Region E, HoxB8-like and HoxB8-like are both more highly expressed in stage 28 postsynarcual. As noted above Hoxc6-like is of particular interest, and may mark the posterior boundary of the synarcual region in Leucoraja, while the absence of more posterior Hox genes from this region conforms to general Hox expression patterns in a range of vertebrates (e.g., Burke et al., 1995) and supports an anterior regionalization in Leucoraja.
Additionally, a number of genes in Regions D and E are also involved in anterior-posterior patterning, and show higher levels of expression in stage 28. These include Alx1-like, Emx2-like (Region D), and Pbx1-like (Region E). Lhx1-like, Msx1-like, and Alx4-like are more highly expressed in the stage 28 synarcual (Region D).
The synarcual in batoids such as Leucoraja erinacea has an important function in supporting the enlarged pectoral fins, as indicated by the lateral stays that run between the synarcual and the pectoral girdle. Among other chondrichthyans, the synarcual is absent in sharks, but present in the chimaeroids (Holocephali), where it supports a dorsal fin spine, and was suggested to form via fusion of normally developed vertebrae (Johanson et al., 2015). This was also suggested to be the case for the Batoidea (e.g., Claeson, 2011; Johanson et al., 2013), as illustrated by the posterior margin of the synarcual, where a small number of vertebrae appear to be in the process of being incorporated into the synarcual. Here, partial separation of the vertebrae (Figures 1O–P, black arrows, 3D) and a remnant series of spinooccipital foramina within the synarcual (Figures 1N, 2B,C) otherwise associated with the intervertebral elements more posteriorly in the axial skeleton, suggest that vertebrae are being fused into the main body of the synarcual. Fusion occurs in other parts of the vertebrate axial skeleton, such as the sacrum, resulting from a transformation of intervertebral tissues (Moran et al., 2015); this type of transformation is also seen in cases where fusion results from external stresses, such as in farmed salmon (Witten et al., 2006, 2009).
However, this incorporation of individual vertebrae is not apparent more anteriorly, with histological sections through the synarcual and vertebral column indicating instead that the synarcual is separate from the column and continues to develop around it posteriorly (Figure 6), as indicated by actively transforming cells from the perichondrium, posteriorly (Figure 6D). These developmental processes in synarcual development are supported by patterns of gene expression involved in cartilage development, bone resorption and anteroposterior patterning. For example, ongoing synarcual growth posteriorly involves ongoing cartilage deposition, with Col2A-like, linked to Type II collagen (Table S2), a major component of hyaline cartilage, showing higher expression levels at stage 33, compared to stage 28. Incorporation of individual vertebrae at the posterior margin of the synarcual would require a loss of the mineralization visible in more posterior vertebrae, and remnants of this mineralization can be visualized in μCT-scans. This is supported by higher expression of a range of genes linked to bone resorption, including osteoclast development, again in stage 33. These would be active in resorption mineralization associated with tesserae, the surficial mineralization characterizing chondrichthyans (Dean et al., 2017). Finally, the development of the bulk of the Leucoraja synarcual as a separate structure at the anterior part of the vertebral column suggests that regionalization of the column is occurring anteriorly, supported by absence of more posterior Hox genes from the stage 28 synarcual region, when this regionalization would be established (Hoxa7-like, Hoxa10-like, HoxB8-like, Hoxc6-like, Hoxd8-like, and Hoxa9-like Hoxd8-like; Table S5). Hoxc6-like is particularly important, because Hox genes are nested anteroposteriorly along the body, the anterior expression boundary is of relevance in regionalization. Absence of Hoxc6-like from the synarcual region of stage 28 but presence in the postsynarcual region suggests the presence of this boundary and associated with anterior regionalization. Thus, multiple transcripts support observations of morphology and development from μCT-scanning and histology.
As well, the histological data supports recent work on the Leucoraja vertebral column (Criswell et al., 2017) and previous observations (e.g., de Beer, 1924) that early development involves a continuous mesenchymal sheath extending anteroposteriorly, from which separate cartilaginous vertebral elements and mineralized centra later develop. As part of this process, shallow notches and then deeper concavities in the central cartilaginous sheath develop, along with protrusions of this cartilage into the notochord (Figure 6C; Criswell et al., 2017). The protrusions will develop into the centra, while cells associated with the concavities develop into intervertebral tissue, with lines of similarly-staining cells extending laterally, marking the separation of vertebral elements within the central sheath. Prior to this, cells appear to be aligning within the cartilage and transforming along this line (Figures 7A,B, black arrowheads). It seems that the position and initiation of notches along the medial margin of the cartilage may serve to pattern the position of these divisions between vertebral elements.
With respect to the vertebral centra, a medial space develops within the cartilaginous protrusions mentioned above, becoming separated from the more lateral cartilage by a distinct middle layer (Figures 6E,G, 8C,E). The inner layer of cartilage (Criswell et al., 2017) appears to form from the mesenchymal cells that fill these medial spaces, transforming into chondroblasts (Figures 8C,E, m.sp/ic). Areolar mineralization begins within the middle layer (Criswell et al., 2017; Figures 6E, 8C,E, ar.c/ml), to separate the inner and outer layer of cartilage (the latter representing the original cartilaginous sheath). There are distinct differences in these cartilages at this stage, with relatively more extracellular matrix in the inner layer (Figures 8D,E). Areolar mineralization seems to involve cells from the lateral, outer cartilage layer (rounded cells, Figures 8H,I) along with cells from the intervertebral tissue (elongate cells, Figures 8G,I).
The most anterior part of the cartilaginous sheath is marked by a distinct reduction in the size of the centra, related to a termination of this sheath. A triangular cartilage is present here, associated with a V-shaped perichondrium. This cartilage appears to be more similar to the outer hyaline cartilage than the inner layer of cartilage (relatively more cells compared to matrix), and marks the anterior termination of the notochord. This termination occurs just within the posterior margin of the synarcual. The anterior triangular cartilage may derive entirely from the lateral outer layer of cartilage, or perhaps from the synarcual itself, as these share a perichondrium (Figure 8D), suggesting a common source of cells. This different origin may be associated with termination of the central cartilaginous axis at this point.
By combining information from serial histological sectioning and μCT-scanning, we can suggest that in Leucoraja, the synarcual does not form from the incorporation of normally developed vertebrae, but appears as a separate structure relative to the rest of the vertebral column. Normal development of the vertebral column is terminated anteriorly, within, and potentially associated with, the large cartilaginous structure representing the synarcual. In the sense that the synarcual articulates to the rear of the braincase, it effectively replaces the notochord and vertebral column in this region. Expressed genes not previously identified in chondrichthyans, such as Hoxc6-like (HoxC genes in general) and transcripts annotated related to osteoclasts and bone resorption, have been identified.
This synarcual development is markedly different from that in placoderms and chimaeroid holocephalans, which were suggested to develop from the fusion of normally developing vertebrae throughout. In tetrapods the comparable structure is known as the syncervical and also appears to have developed from initially normal and separate vertebrae (van Buren and Evans, 2017: Figure 2), comparable to other instances of fusion in the tetrapod vertebral column, such as the sacrum (Moran et al., 2015). These differences may be related to the function of the synarcual, developing in early embryonic stages and before hatching, supporting the expanded pectoral fins in Leucoraja (Figure 1), as opposed to only supporting a dorsal fin spine in the holocephalans (Johanson et al., 2015). In this instance, the synarcual of batoids with smaller pectoral fins such as the Torpediniformes (electric rays) and Rhinopristiformes (guitarfishes) may be more comparable to other taxa. These are also the batoid groups with predominantly caudal fin (tail) propulsion (Rosenberger, 2001), compared to pectoral fin propulsion in Leucoraja (Rajiformes; e.g., di Santo et al., 2017), supporting a functional explanation for early development of the synarcual as a separate, complete cartilaginous tube supporting the fins.
This project was conceived by ZJ and GF. KM and GF were responsible for the transcriptomic analysis. KM performed the initial transcriptome analysis, produced histological slides, prepared and CT-scanned specimens, 3D rendered CT-scans, and contributed to Figures 1–5. ZJ photographed histological slides, 3D rendered CT-scans, and produced Figures 1–8. KJ performed the final transcriptome analysis, produced the heatmaps shown in Figures 9–12 and all tables. ZJ, KJ, and GF were responsible for writing the final manuscript.
The authors declare that the research was conducted in the absence of any commercial or financial relationships that could be construed as a potential conflict of interest.
We would like to thank the Earth Sciences Department, Natural History Museum, for funding for this project. We thank Farah Ahmed, Amin Garbout, and Brett Clark (Image and Analysis Centre, Natural History Museum, London) for assistance with VERSA scanning. We also thank Ollie Crimmen and James MacLaine for assistance in registering Leucoraja specimens in the Life Sciences Collections, Natural History Museum.
The Supplementary Material for this article can be found online at: https://www.frontiersin.org/articles/10.3389/fevo.2019.00012/full#supplementary-material
Figure S1. Multiple sequence alignments of HoxC-like proteins. Amino-acid sequence alignments of the putative Leucoraja erinacea HoxC proteins with their Conditional Reciprocal Best Blast hit and HoxC proteins identified in other shark species. Identical residues are shown a s solid red blocks with white text, while residues with more than 70% similarity in physico-chemical properties are shown as red text and framed in blue. A, HocC4: NP_705897.1, Homo sapiens CRBB hit; TRINITY_DN27817_c0_g2 and TRINITY_DN30588_c0_g1, Leucoraja erinacea. B., HoxC6: NP_710160.1, Homo sapiens CRBB hit; Hetze0000001, Heterodontus zebra; TRINITY_DN24527_c1_g1, Leucoraja erinacea; Chipu2000064, Chiloscyllium punctatum. C, HoxC9: TRINITY_DN27775_c0_g1, Leucoraja erinacea; NP_008828.1, Homo sapiens CRBB hit; Hetze0000003, Heterodontus zebra.
Table S1. Annotation of the Ler_Trinity_CRBB transcriptome. Annotations were extracted from the DAVID knowledgebase v 6.8 and transferred to the Leucoraja erinacea transcripts based on the unique Refseq ID.
Table S2. Cartilage genes. The subset of transcripts annotated to the gene ontology term “cartilage development” (GO:0051216).
Table S3. Bone resorption genes. The subset of transcripts annotated to the gene ontology term “bone resorption” (GO:0045453).
Table S4. Osteoclast genes. The subset of transcripts annotated to the gene ontology term “osteoclast” (GO:0045453).
Table S5. Hox genes. The subset of transcripts annotated with the SMART hox domain (SM00389).
Altschul, S. F., Gish, W., Miller, W., Myers, E. W., and Lipman, D. J. (1990). Basic local alignment search tool. J. Mol. Biol. 215, 403–410. doi: 10.1016/S0022-2836(05)80360-2
Arratia, G., Schultze, H.-P., and Casciotta, J. (2001). Vertebral column and associated elements in dipnoans and comparison with other fishes: development and homology. J. Morph. 250, 101–172. doi: 10.1002/jmor.1062
Aubry, S., Kelly, S., Kümpers, B. M. C., Smith-Unna, R. D., and Hibberd, J. M. (2014). Deep evolutionary comparison of gene expression identifies parallel recruitment of Trans-Factors in two independent origins of C4 photosynthesis. PLOS Genet. 10, e1004365. doi: 10.1371/journal.pgen.1004365
Ballard, W. W., Mellinger, J., and Lechenault, H. (1993). A series of normal stages for development of Scyliorhinus canicula, the lesser spotted dogfish (Chondrichthyes: Scyliorhinidae). J. Exp. Zool. 267, 318–336. doi: 10.1002/jez.1402670309
Bi, W., Deng, J. M., Zhang, Z., Behringer, R. R., and de Crombrugghe, B. (1999). Sox9 is required for cartilage formation. Nat. Genet. 22, 85–89. doi: 10.1038/8792
Böhmer, C. (2017). Correlation between Hox code and vertebral morphology in the mouse: towards a universal model for Synapsida. Zool. Letts. 3, 1–11. doi: 10.1186/s40851-017-0069-4
Burke, A. C., Nelson, C. E., Morgan, B. A., and Tabin, C. (1995). Hox genes and the evolution of vertebrate axial morphology. Development 121, 333–346.
Claeson, K. (2010). Trends in Evolutionary Morphology: A Case Study in the Relationships of Angel Sharks and Batoid Fishes. Unpublished Ph.D. thesis, The University of Texas at Austin, Austin.
Claeson, K. (2011). The synarcual cartilage of batoids with emphasis on the synarcual of Rajidae. J. Morph. 212, 1444–1463. doi: 10.1002/jmor.10996
Criswell, K. E., Coates, M. I., and Gillis, J. A. (2017). Embryonic development of the axial column in the little skate, Leucoraja erinacea. J. Morph. 278, 300–320. doi: 10.1002/jmor.20637
da Silva, J. P. C. B., and de Carvalho, M. R. (2011). A taxonomic an morphological redescription of Potamotrygon falkneri Castex & Maciel, 1963 (Chondrichthyes: Myliobatiformes: Potamotrygonidae). Neotrop. ichthyol. 9, 209–232. doi: 10.1590/S1679-62252011000100021
de Beer, G. R. (1924). Memoirs: contributions to the study of the development of the head in Heterodontus. J. Cell. Sci. 68:39–65.
Dean, M. N., Bizzarro, J. J., Clark, B., Underwood, C. J., and Johanson, Z. (2017). Large batoid fishes frequently consume stingrays despite skeletal damage. Roy. Soc. Open Sci. 2017:170674. doi: 10.1098/rsos.170674
Dean, M. N., Ekstrom, L., Monsonego-Ornan, E., Ballantyne, J., Witten, P. E., Riley, C., et al. (2015). Mineral homeostasis and regulation of mineralization processes in the skeletons of sharks, rays and relatives (Elasmobranchii). Sem. Cell Dev. Biol. 46, 51–67. doi: 10.1016/j.semcdb.2015.10.022
Dean, M. N., Mull, C. G., Gorb, S. N., and Summers, A. P. (2009). Ontogeny of the tessellated skeleton: insight from the skeletal growth of the round stingray Urobatis halleri. J. Anat. 215: 227–239. doi: 10.1111/j.1469-7580.2009.01116.x
Dean, M. N., and Summers, A. P. (2006). Mineralized Cartilage in the skeleton of chondrichthyan fishes. Zoology 109, 164–168. doi: 10.1016/j.zool.2006.03.002
di Santo, V., Blevins, E. L., and Lauder, G. V. (2017). Batoid locomotion: effects of speed on pectoral fin deformation in the little skate, Leucoraja erinacea. J. Exp. Biol. 220, 705–712. doi: 10.1242/jeb.148767
Dy, P., Wang, W., Bhattaram, P., Wang, Q., Wang, L., Ballock, R. T., et al. (2012). Sox9 directs hypertrophic maturation and blocks osteoblast differentiation of growth plate chondrocytes. Dev. Cell 22, 597–609. doi: 10.1016/j.devcel.2011.12.024
Fleming, A., Kishida, M. G., Kimmel, C. B., and Keynes, R. J. (2015). Building the backbone: the development and evolution of vertebral patterning. Development 142, 1733–1744. doi: 10.1242/dev.118950
Fu, L., Niu, B., Zhu, Z., Wu, S., and Li, W. (2012). CD-HIT: accelerated for clustering the next-generation sequencing data. Bioinformatics 28, 3150–3152. doi: 10.1093/bioinformatics/bts565
Grabherr, M. G., Haas, B. J., Yassour, M., Levin, J. Z., Thompson, D. A., Amit, I., et al. (2011). Full-length transcriptome assembly from RNA-Seq data without a reference genome. Nature Biotech. 29, 644–652. doi: 10.1038/nbt.1883
Hafez, A., Squires, R., Pedracini, A., Joshi, A., Seegmiller, R. E., and Oxford, J. T. (2015). Col11a1 regulates bone microarchitecture during embryonic development. J. Dev. Biol. 3, 158–176. doi: 10.3390/jdb3040158
Hall, B. (2005). Bones and Cartilage: Developmental and Evolutionary Skeletal Biology, 1st Edn. London: Elsevier Academic Press, p. 792.
Hara, Y., Yamaguchi, K., Onimaru, K., Kadota, M., Koyanagi, M., Keeley, S. D., et al. (2018). Shark genomes provide insights into elasmobranch evolution and the origin of vertebrates. Nat. Ecol. Evol. 2, 1761–1771. doi: 10.1038/s41559-018-0673-5
Hayman, A. R., Bune, A. J., and Cox, T. M. (2000). Widespread expression of tartrate-resistant acid phosphatase (Acp 5) in the mouse embryo. J. Anat. 196, 433–441.
Head, J. J., and Polly, P. D. (2015). Evolution of the snake body form reveals homoplasy in amniote Hox gene function. Nature 520, 86–89. doi: 10.1038/nature14042
Itzstein, C., Coxon, F. P., and Rogers, M. J. (2011). The regulation of osteoclast function and bone resorption by small GTPases. Small GTPases 2, 117–130. doi: 10.4161/sgtp.2.3.16453
Johanson, Z., Boisvert, C., Maksimenko, A., Currie, P., and Trinajstic, K. (2015). Development of the synarcual in the elephant sharks (Holocephali; Chondrichthyes): implications for vertebral formation and fusion. PLoS ONE 10:e135138. doi: 10.1371/journal.pone.0135138
Johanson, Z., Trinajstic, K., Carr, R. A., and Ritchie, A. (2009). Vertebral development in the gnathostome stem group (Placodermi): fusion, gene misexpression, and homeotic transformations. Int. J. Dev. Biol. 54, 71–80. doi: 10.1387/ijdb.072508zj
Johanson, Z., Trinajstic, K., Carr, R. A., and Ritchie, A. (2013). Evolution and development of the synarcual in early vertebrates. Zoomorphology 132, 95–110. doi: 10.1007/s00435-012-0169-9
Katoh, K., and Standley, D. M. (2013). MAFFT multiple sequence alignment software version 7: improvements in performance and usability. Mol. Biol. Evol. 30, 772–780. doi: 10.1093/molbev/mst010
King, B. L., Gillis, J. A., Carlisle, H. R., and Dahn, R. D. (2011). A natural deletion of the HoxC cluster in elasmobranch fishes. Science 334, 1517. doi: 10.1126/science.1210912
Langmead, B., and Salzberg, S. L. (2012). Fast gapped-read alignment with Bowtie 2. Nat. Methods 9, 357–359. doi: 10.1038/nmeth.1923
Li, B., and Dewey, C. N. (2011). RSEM: accurate transcript quantification from RNA-Seq data with or without a reference genome. BMC Bioinform.12:323. doi: 10.1186/1471-2105-12-323
Li, B., Fillmore, N., Bai, Y., Collins, M., Thomson, J. A., Stewart, R., et al. (2014). Evaluation of de novo transcriptome assemblies from RNA-Seq data. Genome Biol. 15, 1–21. doi: 10.1186/s13059-014-0553-5
Li, W., and Godzik, A. (2006). Cd-hit: a fast program for clustering and comparing large sets of protein or nucleotide sequences. Bioinformatics 22, 1658–1659. doi: 10.1093/bioinformatics/btl158
Logar, D. B., Komadina, R., Prezelj, J., Ostanek, B., Trost, Z., and Marc, J. (2007). Expression of bone resorption genes in osteoarthritis and osteoporosis. J. Bone Miner Metab. 25, 219–225. doi: 10.1007/s00774-007-0753-0
Mallo, M., Wellik, D. M., and Deschamps, J. (2010). Hox genes and regional patterning of the vertebrate body plan. Dev. Biol. 344, 7–15. doi: 10.1016/j.ydbio.2010.04.024
Maxwell, E. E., Fröbisch, N. B., and Heppleston, A. C. (2008). Variability and conservation in late chondrichthyan development: ontogeny of the winter skate (Leucoraja ocellata). Anat. Rec. 291, 1079–1087. doi: 10.1002/ar.20719
Miyake, T. (1988). The Systematics of the Stingray Genus Urotrygon With Comments on the Interrelationships Within Urolophidae Chondrichthyes, Myliobatiformes). (Volumes, I and II). Ph.D. Dissertation. Texas A & M University, College Station
Moran, M. M., Bajpai, S., George, J. C., Suydam, R., Usip, S., and Thewissen, J. G. M. (2015). Intervertebral and epiphyseal fusion in the postnatal ontogeny of cetaceans and terrestrial mammals. J. Mamm. Evol. 22, 93–109. doi: 10.1007/s10914-014-9256-7
Moreira, R. A., Gomes, U. L., and de Carvalho, M. R. (2011). Morphological description of Dipturus mennii (Chondrichthyes: Elasmobranchii: Rajidae) and its differentiation from Dipturus trachyderma. Zoologia 28, 97–111. doi: 10.1590/S1984-46702011000100014
Morin-Kensicki, E. M., Melancon, E., and Eisen, J. S. (2002). Segmental relationship between somites and vertebral column in zebrafish. Development 129, 3851–3860.
Obha, S., He, X., Hojo, H., and McMahon, A. P. (2015). Distinct transcriptional programs underlie Sox9 regulation of the mammalian chondrocyte. Cell Rep. 12, 229–243. doi: 10.1016/j.celrep.2015.06.013
Oulion, S., Debiais-Thibaud, M., d'Aubenton-Carafa, Y., Thermes, C, Da Silva, C, Bernard-Samain, S, et al. (2010). Evolution of Hox gene clusters in gnathostomes: insights from a survey of a shark (Scyliorhinus canicula) transcriptome. Mol. Biol. Evol. 27, 2829–2838. doi: 10.1093/molbev/msq172
Porter, M. E., Beltrán, J. L., Koob, T. J., and Summers, A. P. (2006). Material properties and biochemical composition of mineralized vertebral cartilage in seven elasmobranch species (Chondrichthyes). J. Exp. Biol. 209, 2920–2928. doi: 10.1242/jeb.02325
Robert, X., and Gouet, P. (2014). Deciphering key features in protein structures with the new ENDscript server, Nucl. Acids Res. 42, W320–W324. doi: 10.1093/nar/gku316
Rosenberger, L. S. (2001). Pectoral fin locomotion in batoid fishes: Undulation versus oscillation. J. Exp. Biol. 204:379–394.
Seidel, R., Blumerb, M., Pechriggl, E.-J., Lyons, K., Hall, B. K., Fratzl, P., et al. (2017). Calcified cartilage or bone? Collagens in the tessellated endoskeletons of cartilaginous fish (sharks and rays). J. Struct. Biol. 200, 54–71. doi: 10.1016/j.jsb.2017.09.005
Sherman, B. T., da Huang, W., Tan, Q., Guo, Y., Bour, S., Liu, D., et al. (2007). DAVID Knowledgebase: a gene-centered database integrating heterogeneous gene annotation resources to facilitate high-throughput gene functional analysis. BMC Bioinform. 8:426. doi: 10.1186/1471-2105-8-426
Smith-Unna, R., Boursnell, C., Patro, R., Hibberd, J. M., and Kelly, S. (2016). TransRate: reference-free quality assessment of de novo transcriptome assemblies. Genome Res. 26, 1134–1144. doi: 10.1101/gr.196469.115
Sundaram, K., Nishimura, R., Senn, J., Youssef, R. F., London, S. D., and Reddy, S. V. (2007). RANK ligand signaling modulates the matrix metalloproteinase-9 gene expression during osteoclast differentiation. Exp. Cell Res. 313:168–178. doi: 10.1016/j.yexcr.2006.10.001
Tümpel, S., Cambronero, F., Sims, C., Krumlauf, R., and Wiedermann, L. M. (2008). A regulatory module embedded in the coding region of Hoxa2 controls expression in rhombomere 2. Proc. Natl. Acad. Sci. U.S.A. 105, 20077–20082. doi: 10.1073/pnas.0806360105
van Buren, C. S., and Evans, D. C. (2017). Evolution and function of anterior cervical vertebral fusion in tetrapods. Biol. Rev. 92, 608–626. doi: 10.1111/brv.12245
Weivoda, M. M., and Oursler, M. J. (2014). The roles of small GTPases in osteoclast biology. Orthoped. Musc. Syst.:Curr. Res. 3:1000161. doi: 10.4172/2161-0533.1000161
Witten, P. E., Gil-Martens, L., Huysseune, A., Takle, H., and Hjelde, K. (2009). Classification and developmental relationships of vertebral body malformations in farmed Atlantic salmon (Salmo salar). Aquaculture 295, 6–14. doi: 10.1016/j.aquaculture.2009.06.037
Keywords: chondrichthyes, vertebral column, Leucoraja, transcriptomes, Hox genes, resorption
Citation: Johanson Z, Martin K, Fraser G and James K (2019) The Synarcual of the Little Skate, Leucoraja erinacea: Novel Development Among the Vertebrates. Front. Ecol. Evol. 7:12. doi: 10.3389/fevo.2019.00012
Received: 02 November 2018; Accepted: 14 January 2019;
Published: 05 February 2019.
Edited by:
Maria Ina Arnone, Stazione Zoologica Anton Dohrn, ItalyReviewed by:
Pedro Martinez, University of Barcelona, SpainCopyright © 2019 Johanson, Martin, Fraser and James. This is an open-access article distributed under the terms of the Creative Commons Attribution License (CC BY). The use, distribution or reproduction in other forums is permitted, provided the original author(s) and the copyright owner(s) are credited and that the original publication in this journal is cited, in accordance with accepted academic practice. No use, distribution or reproduction is permitted which does not comply with these terms.
*Correspondence: Zerina Johanson, ei5qb2hhbnNvbkBuaG0uYWMudWs=
Disclaimer: All claims expressed in this article are solely those of the authors and do not necessarily represent those of their affiliated organizations, or those of the publisher, the editors and the reviewers. Any product that may be evaluated in this article or claim that may be made by its manufacturer is not guaranteed or endorsed by the publisher.
Research integrity at Frontiers
Learn more about the work of our research integrity team to safeguard the quality of each article we publish.