 Sonja Kistenich1*
 Rune Halvorsen1†
 Audun Schrøder-Nielsen1†
 Lisbeth Thorbek1†
 Einar Timdal1†
 Mika Bendiksby1,2
- 1Natural History Museum, University of Oslo, Oslo, Norway
- 2NTNU University Museum, Norwegian University of Science and Technology, Trondheim, Norway
Biological specimens in natural history collections worldwide are increasingly being used in biogeographical, environmental, and taxonomic studies. For their meaningful use, correct species identification is crucial. For example, clarifying if a species is new to science requires an overview of what has already been described. This includes comparisons with existing authoritative specimens (types). Most type specimens are rather old and their DNA expected to be degraded to various extents. Comparative DNA sequence analysis is in regular use in taxonomic research of today and is essential for identifying and delimiting species. In this study, we focus on lichenized fungi (lichens), in which many species groups are highly inconspicuous and impossible to identify to species based on morphology alone. Our aim was to test the non-mutually exclusive hypotheses that DNA quality of lichens depends on (1) time since collection, (2) taxonomic affinity, and/or (3) habitat/ecology. We included two species from each of four different lichen genera (i.e., Cladonia, Nephroma, Peltigera, and Ramalina), each species pair with a different autecology. For each species, we included samples from approximately every 25 years from present to about 150 years back in time. We used a two-step PCR-based approach followed by sequencing on an Ion Torrent PGM to produce target sequences (mtSSU) of degraded DNA. We received satisfactory DNA sequence information for 54 of 56 specimens. We recovered full-length sequences for several more than 100-years-old specimens, including a 127-years-old specimen, and retrieved enough sequence information for species identification of a 150-years-old specimen. As expected, sequencing success was negatively correlated with age of the specimens. It also varied with taxonomic affinity. We found no significant correlation between sequencing success and habitat ecology of the investigated specimens. The herein tested Ion Torrent sequencing approach outperformed Sanger sequencing with regard to sequencing success and efficiency. We find the protocol used herein highly suitable for obtaining sequences from both young and old lichen specimens and discuss potential improvements to it.
Introduction
Herbarium specimens are of immense value for biological research, for example in a wide range of spatial comparative analyses, for monitoring changes in biodiversity over time, and last, but not least, in taxonomic and systematic research (e.g., Lavoie, 2013; Greve et al., 2016; Soltis and Soltis, 2016; James et al., 2018; Meineke et al., 2018). In particular, biogeographical and environmental research on climate change effects benefit extensively from the use of herbarium specimens (e.g., Holmes et al., 2016; Willis et al., 2017). However, a prerequisite for meaningful use of historical specimens in research is that these are correctly identified.
Taxonomic identification has traditionally been based on morphology, which has been the primary means of identification before the advance of molecular methods. Nowadays, morphology is often used in combination with DNA analyses and other data. A popular method for fast species identification of biological material is DNA barcoding (Hebert et al., 2003; Hajibabaei et al., 2007). DNA barcoding comprises the sequencing of a selected DNA region of the genome and BLAST searches against a library of named DNA barcodes (see also Kress et al., 2015), as implemented in the Barcode of Life Data Systems (BOLD; Ratnasingham and Hebert, 2007), a partner of the International Barcode of Life (iBOL, http://ibol.org) project. Of particular interest is DNA sequencing of type material, on which the barcode library ideally should be based, as these specimens link a unique scientific name to each species.
There are challenges, however, linked to obtaining DNA from long dead organic material. Weiß et al. (2016) found that DNA degrades over time, albeit contrasting earlier finding by Staats et al. (2011). Type specimens are typically rather old and the DNA is expected to have become degraded to various extents. Many types were collected during the numerous research expeditions in the nineteenth and early twentieth century and are often more than 100 years old. Moreover, type material is usually a highly limited resource (a single or few specimens, often in poor condition) and destructive sampling for DNA extraction can only be tolerated when rich specimens are available and successful output is ensured. Morphological investigations have therefore for long been the single option for identifying old specimens, and often also younger material (<10 years old) that for various reasons does not provide DNA of sufficient quality and quantity (Sohrabi et al., 2010). In addition to time since collection, also poor storage conditions, chemical treatment with mercuric chloride (mainly known to have been used on dried plants) and unfavorable drying processes may contribute to DNA degradation/inhibition in plant herbarium specimens (liverworts: Jankowiak et al., 2005; angiosperms: Staats et al., 2011; angiosperms: Lander et al., 2013), decreasing the chances for successful DNA recovery and usability in downstream processes. In recent years, increased focus on extracting and sequencing DNA from old natural history collections has led to the development of promising new approaches allowing for obtaining DNA sequences from specimens collected up to 210 years before DNA extraction (fungi: Larsson and Jacobsson, 2004; plant pathogens: Telle and Thines, 2008; angiosperms: Andreasen et al., 2009; insects: Prosser et al., 2016; algae: Suzuki et al., 2016). Such studies, however, are still few in number and restricted to a particular group of organisms. With advances in high-throughput sequencing (HTS) methods, some of the challenges (e.g., dominance of short fragments) are largely overcome (see review by Bieker and Martin, 2018). For example, Gutaker et al. (2017) managed to extract and shotgun sequence ultra-short fragments (<50 bases) of up to 180-years-old (i.e., time between collection and DNA extraction) Arabidopsis specimens. The problem of destructive sampling from valuable specimens has also been addressed in recent studies. For instance, Shepherd (2017) developed a non-destructive sampling technique for extracting DNA from plant specimens collected up to 73 years ago using erasers applied to the leaf surface.
In fungi, including lichens, morphological characteristics are often of limited use for taxonomic identification because of morphological similarity between genetically distinct taxa (Slepecky and Starmer, 2009). Cryptic species (sensu Struck et al., 2018) are common and represent a huge challenge for taxonomic work. The use of comparative DNA sequence analyses has therefore become crucial for inferring evolutionary history as well as identifying and delimiting fungal taxa (Lumbsch and Leavitt, 2011). DNA-sequencing of a single genetic marker, such as a DNA barcode marker, is most of the time sufficient for species identification in fungi (e.g., Seifert, 2009; Leavitt et al., 2013).
So far, only a few studies report successful DNA sequencing of selected short genetic markers from historical lichen material. Sohrabi et al. (2010) managed to PCR-amplify and Sanger-sequence 760 bases of nuclear ribosomal DNA from a 75-years-old Aspicilia specimen, but failed with an 80-years-old one. Bendiksby et al. (2014) successfully PCR-amplified and Sanger-sequenced several markers of two 100-years-old Staurolemma specimens. During routine investigations on various groups of lichenized fungi, our lichen research group has experienced that PCR-amplifying and generating Sanger sequences seems to be more difficult from some taxa (e.g., tropical rainforest lichens) than from others (e.g., boreal, saxicolous crustose lichens) of the same age. For angiosperms, Bakker et al. (2016) found herbarium material from wet-tropical regions to give lower sequence assembly success rates than material from dry regions. No studies have yet addressed similar questions for lichens and it therefore remains unclear which factors are primarily responsible for DNA degradation or failed sequencing success in lichens. We have also noticed that DNA in specimens older than 50 years often is highly fragmented (<200 bases) and extracts usually have low DNA concentrations (<0.5 ng/μl). These challenges with short fragments and low DNA concentrations were overcome by Prosser et al. (2016) who developed a simple and rather inexpensive protocol aimed at obtaining DNA barcodes from type specimens of Lepidoptera up to 120 years old. To our knowledge, no such study has so far been done on fungi, nor has the general applicability of HTS-methods for DNA-sequencing of historical lichen specimens been explored.
In the present study, we test the two-step PCR-based HTS protocol by Prosser et al. (2016) on historical lichen specimens using the Ion Torrent sequencing platform. Our aim is to acquire high quality DNA sequence data of the mtSSU, a much used DNA marker in lichen systematics. We use two lichen species from each of four different genera/families (Figure 1): one growing in humid coastal areas and the other in dry inland areas. We sampled specimens of each species collected in each of seven time periods from present to about 150 years back in time. The present study is a pilot-test of the following three hypotheses: (1) Sequence reads are more readily obtained from younger than older specimens, (2) sequence reads are more readily obtained from some taxa than others given the same age, and (3) sequence reads are more readily obtained from species adapted to dry areas than from those adapted to humid areas.
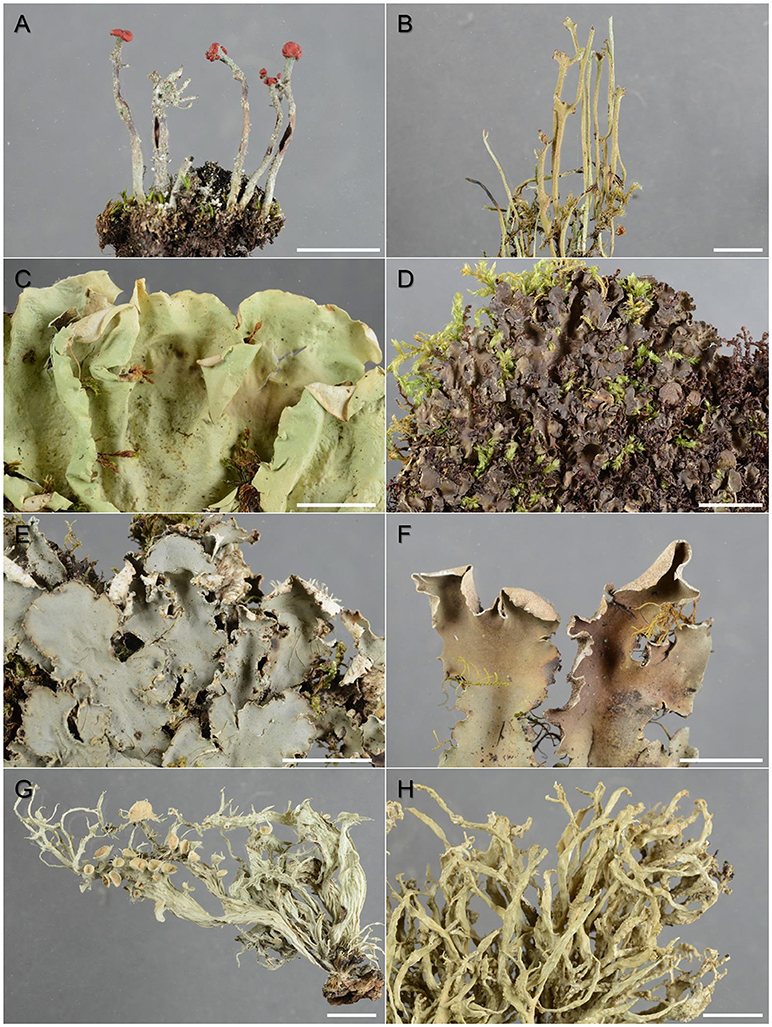
Figure 1. Lichen species targeted in this study (specimens from the 2010-period): (A) Cladonia floerkeana, (B) C. gracilis, (C) Nephroma acrticum, (D) N. laevigatum, (E) Peltigera collina, (F) P. malacea, (G) Ramalina fraxinea, and (H) R. siliquosa. Scale bar = 1 cm.
Materials and Methods
Taxon Sampling
Two species from the same genus but with different distributions (i.e., distributional point of gravity in oceanic [“humid”] vs. continental [“dry”] regions) were selected from each of four different lichen families, for which comprehensive archived collections were available at either of the herbaria O or TRH. We sampled each species from approximately every 25 years from present and to about 150 years back in time. To fulfill these criteria, we chose two representatives from the Cladoniaceae [i.e., Cladonia floerkeana (Fr.) Flörke and C. gracilis (L.) Willd.], the Nephromataceae [i.e., Nephroma laevigatum Ach. and N. arcticum (L.) Torss.], the Peltigeraceae [i.e., Peltigera collina (Ach.) Schrad. and P. malaceae (Ach.) Funck], and the Ramalinaceae [i.e., Ramalina siliquosa (Huds.) A.L. Sm. and R. fraxinea (L.) Ach.; Figure 1]; the first representative of each genus preferring mainly humid coastal areas while the second mainly growing in dry inland habitats. All selected species are common macrolichens in Norway and belong to the same class of lichenized ascomycetes, the Lecanoromycetes; the genera Cladonia and Ramalina belong to the order Lecanorales, Nephroma, and Peltigera to Peltigerales. We selected a healthy and rich specimen of each species from the following seven periods: 2010 (Figure 1), 1985, 1960, 1935, 1910, 1885, and 1860 (±5 years if possible, in rare cases up to ±12 years; Table 1). Most of the selected specimens were collected in coastal and continental regions, respectively; in some cases, when no rich collections were available within the desired period, we selected “humid” specimens from inland areas and “dry” specimens from coastal areas (Table 1).
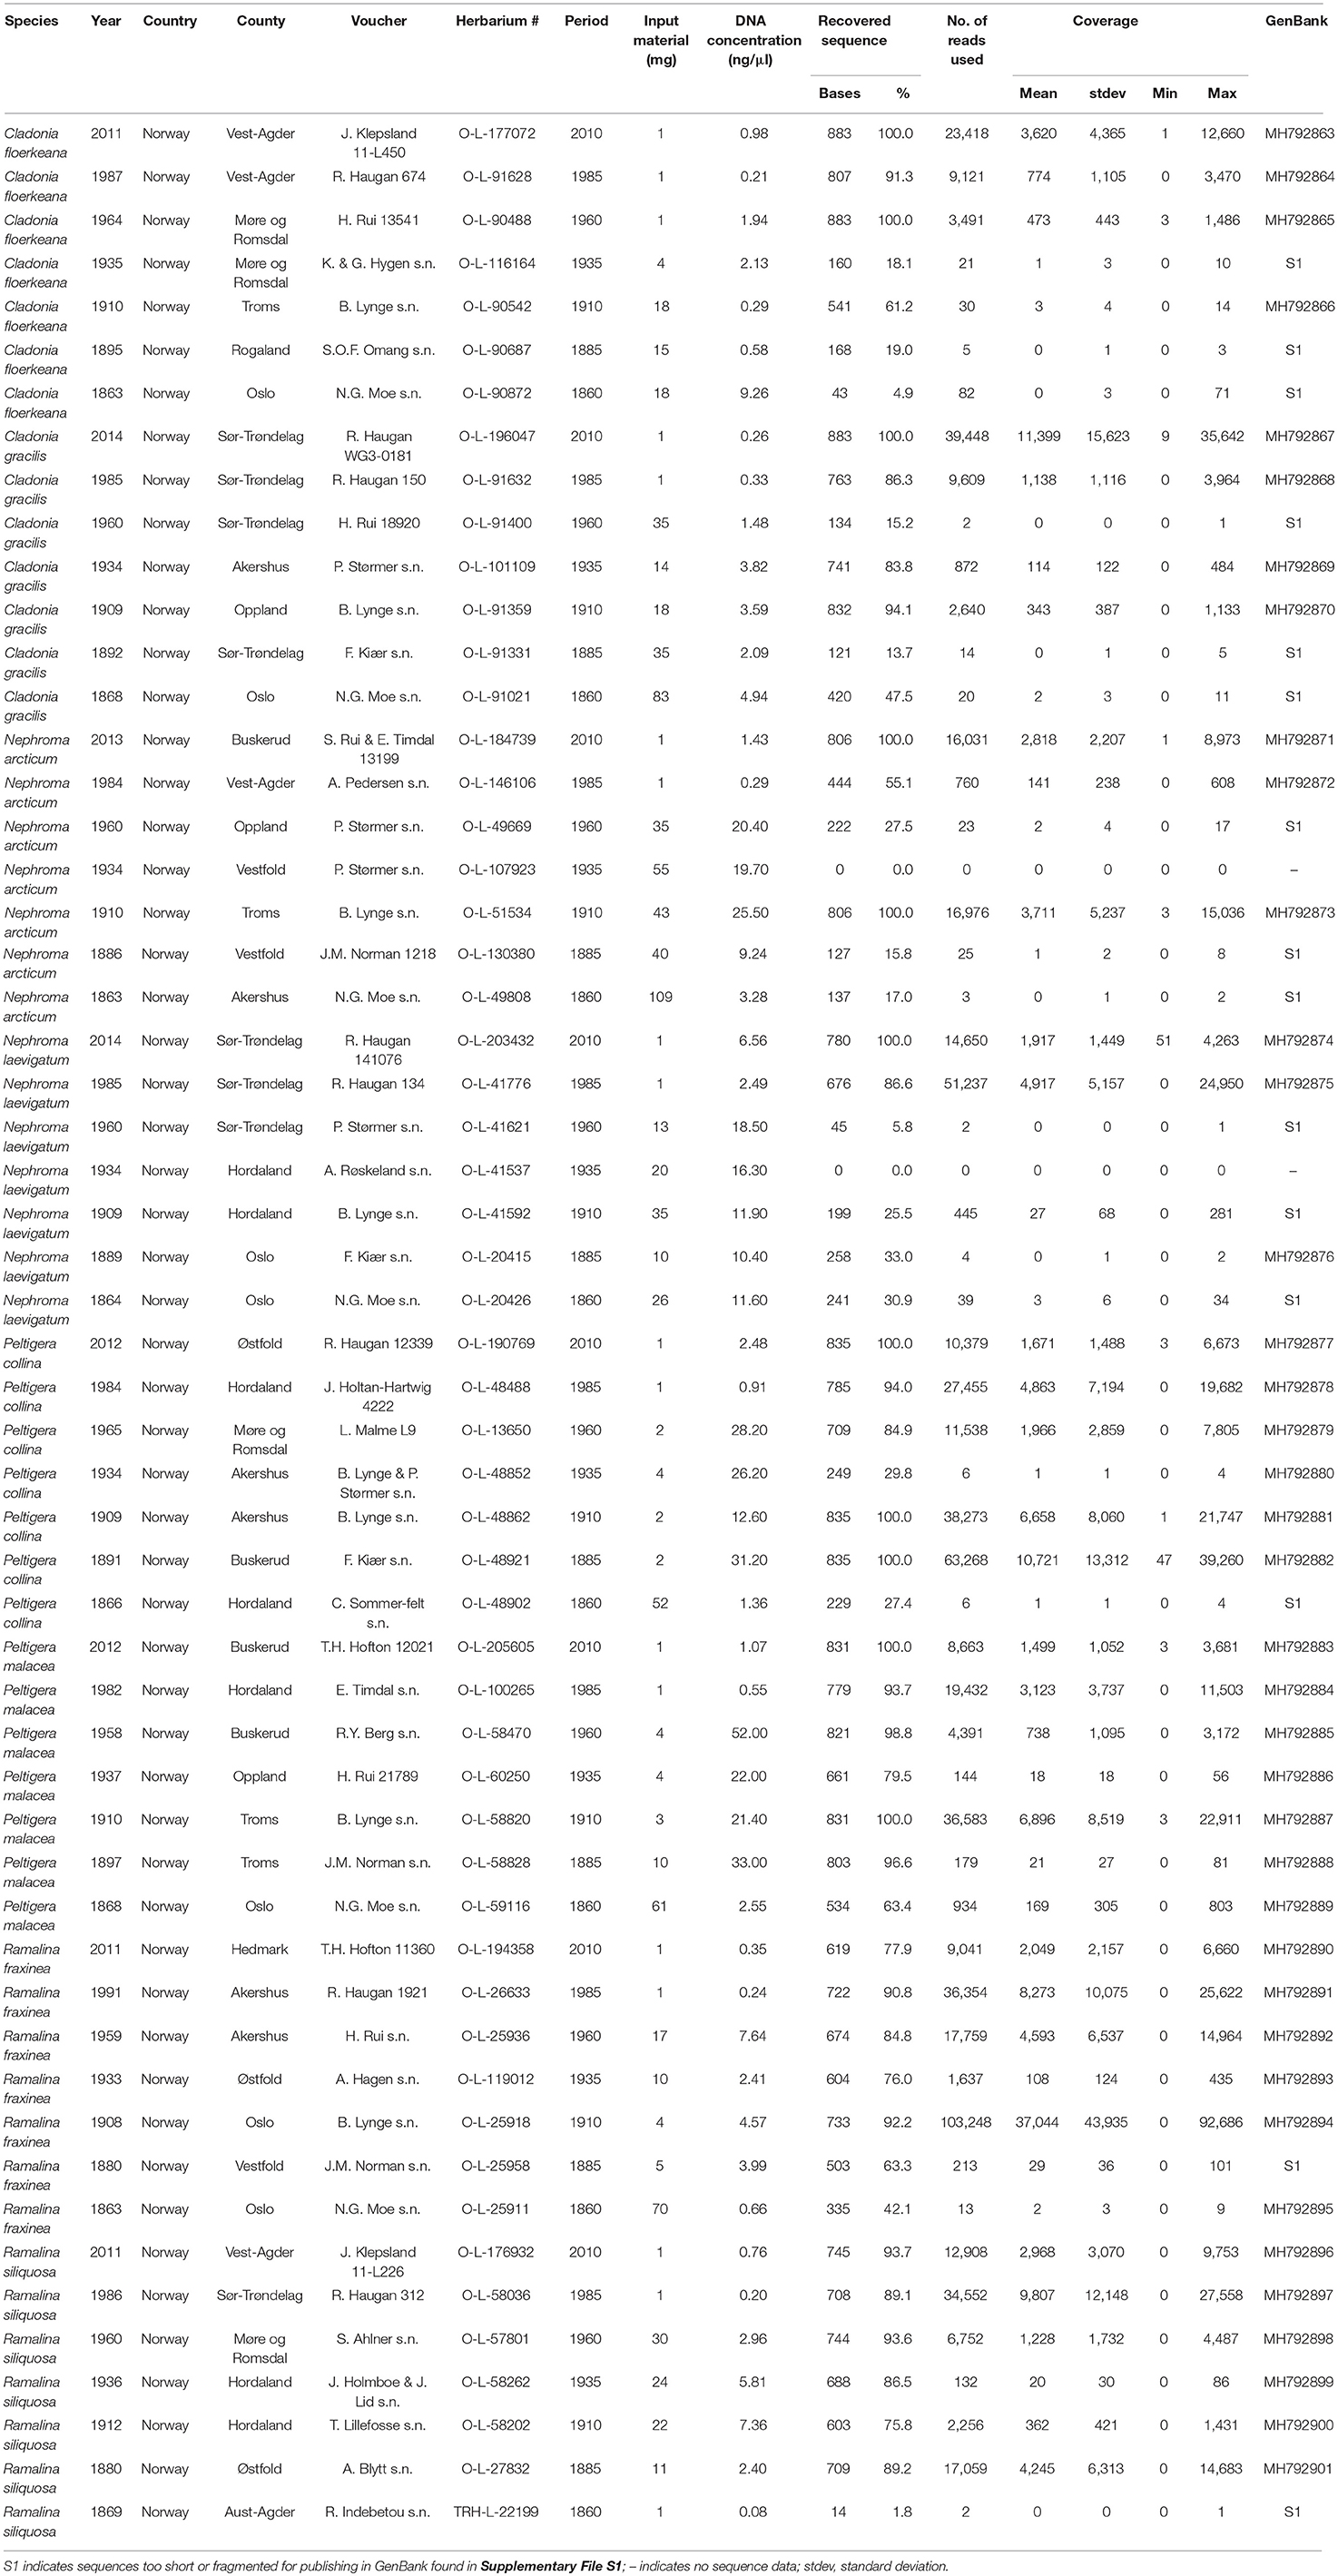
Table 1. Specimens used in this study including voucher information, sequencing results and GenBank accession numbers of sequences generated in this study.
Molecular Work
DNA Extraction
We sampled 1–109 mg of thallus material from each specimen, depending on available material, for extracting DNA of the lichen mycobiont. Samples for periods 2010 and 1985 were extracted using the E.Z.N.A.® HP Plant DNA Mini Kit (OMEGA Bio-tek) following the manufacturer's instructions with modifications described by Bendiksby and Timdal (2013). Samples for time periods 1960–1885 were extracted following the protocol by Werth et al. (2016) using single silica-columns with the following modifications: We grinded the samples with two 3 mm tungsten carbide beads for 2 × 1 min at 20 Hz in a Mixer Mill 301 (Retsch GmbH & Co.). Instead of using the CTAB lysis buffer, we lysed the samples with the alternative buffer based on NaCl and SDS. For elution, we applied 60 μl elution buffer (OMEGA Bio-tek; pre-warmed to 65°C) to the column and incubated the sample at 65°C for 5 min prior to centrifugation. The elution step was repeated by applying the eluate once more on the same column to increase DNA yield resulting in 50–55 μl of DNA extract.
Samples from the 1860-period were extracted in a different lab (Clean Lab, NTNU University Museum) using the DNeasy Plant Mini Kit (QIAGEN) with the following modifications from the manual: The samples were homogenized for 2–8 min at 50 Hz on a TissueLyser LT (QIAGEN) with 1–2 steel beads. After lysis, 20 μl of 20 mg/ml proteinase K was added to each sample followed by an incubation at 45°C for 22 h. For elution, 65 μl AE buffer was added to each column and the samples incubated for 10 min at 37°C.
To reduce the risk of contamination, the DNA extractions of all samples collected prior to the 1960-period were carried out in a bleached workstation newly exposed to UV in a clean lab facility for sensitive samples with dedicated reagents, supplies and protective clothing. A Qubit 2.0 fluorometer (Invitrogen) with the High Sensitivity Kit (Invitrogen) was used for DNA quantification of all extracts. We checked the degree of DNA degradation by visualizing the DNA extracts on a standard 2% agarose gel.
Primer Design and PCR Amplification
The setup for polymerase chain reactions (PCRs) followed the general protocol described in Prosser et al. (2016). While Prosser et al. (2016) designed their primers for a 658 bases fragment of the mitochondrial cytochrome oxidase I (COI), which is the preferred barcode marker for insects, we did not attempt to design primers for the fungal barcode marker, the internal transcribed spacer (ITS), as parts of this region are highly variable. Designing universal primers for our selected species would have been a very challenging task with low anticipated success rate. In addition, Mark et al. (2016) reported challenges with obtaining the correct ITS sequence due to several different copies within one single specimen. We therefore chose to focus our efforts on a ca. 900 bases long part of the up to ca. 2,000 bases long mitochondrial ribosomal small subunit (mtSSU). This fragment, as delimited by the primers mtSSU1 and mtSSU3R (Zoller et al., 1999), is frequently used in lichen systematics and for species delimitation (Amo de Paz et al., 2011; Leavitt et al., 2015; Zhao et al., 2017; Kistenich et al., 2018). We designed a set of seven forward and seven reverse primers (Table 2; Figure 2) covering all of the 900 bases using Primer3 v. 2.3 (Untergasser et al., 2012) based on mtSSU sequences for our selected taxa or closely related taxa available from GenBank (Benson et al., 2018). Each pair of primers used in concert, amplified fragments of ca. 110–190 bases length including overlap with the adjacent target fragments. A non-complementary 10 bases tail was added to each primer's 5′-end to decrease chimeric amplifications (Table 2).
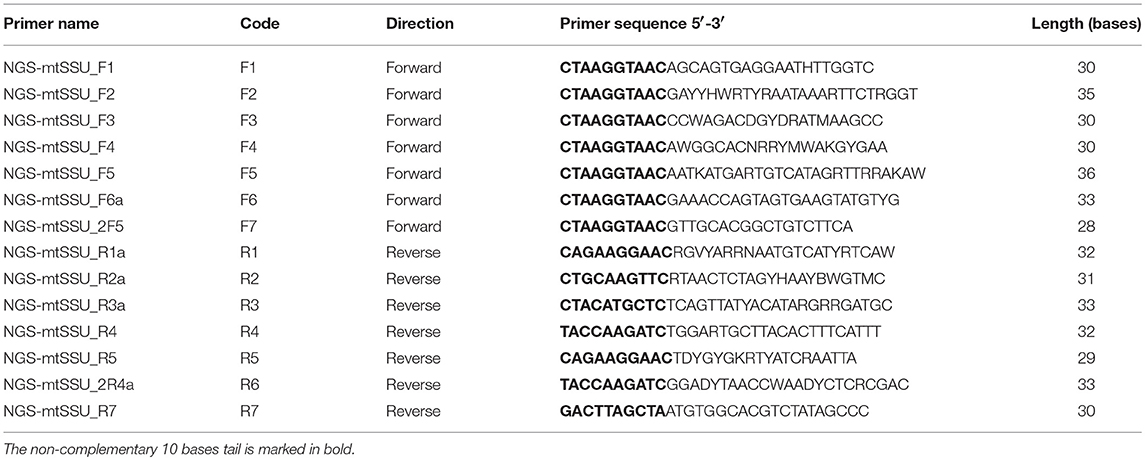
Table 2. Primer sequences used for the two-stage, nested multiplex PCR protocol.
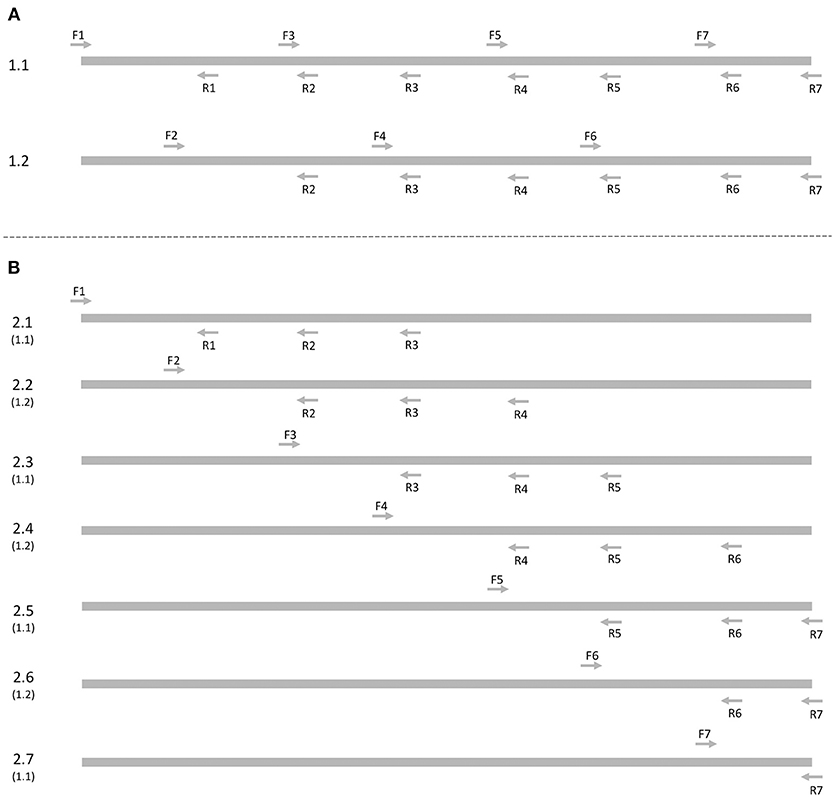
Figure 2. Primer set up for PCR amplifications. (A) PCR round 1 with two separate reactions: 1.1 with odd-numbered forward primers and all reverse primers, 1.2 with even-numbered forward primers and the last six reverse primers. (B) PCR round 2 with seven separate PCR reactions using the PCR products from PCR round 1 as template: each forward primer is paired with the subsequent three reverse primers (two reverse primers in 2.6 and one reverse primer in 2.7).
We modified the two-stage, nested, multiplex PCR protocol by Prosser et al. (2016) to accommodate seven primer pairs. In the first round of PCR, we combined primers F1, F3, F5, and F7 with all seven reverse primers for PCR 1.1, and the primers F2, F4, and F6 with all reverse primers for PCR 1.2 (Figure 2A). In the second round of PCRs, we combined each forward primer with the three subsequent reverse primers in a separate PCR run using the PCR products from PCR 1.1 and 1.2 as template (Figure 2B). No second round of PCR was run for samples from the 2010-period since those amplified well enough in PCR round 1. Each PCR reaction (20 μl) contained 8.2 μl of 10% Trehalose (Merck KGaA), 0.1 μl of 10 mM dNTPs (GeneAmp), 2 μl of 25 mM MgCl2 (KAPA Biosystems), 0.2 μl of each 10 μM primer (Sigma Aldrich), 0.1 μl of 5 U/μl KAPA Taq polymerase (Roche), and 2 μl of 10 × polymerase Buffer B. Each reaction was filled up to 18 μl with ultra-pure DEPC-treated H2O (Invitrogen), the volume depending on the number of primers used, adding 2 μl of undiluted template. All PCRs were prepared inside a workstation for PCR set up in a clean lab for sensitive samples with dedicated reagents, supplies and protective clothing to minimize contamination. We used the same PCR programs as stated in Prosser et al. (2016), albeit with a touch-down gradient from 60 to 50°C during annealing. Products from each PCR were visualized on an agarose-gel.
To test for the presence of PCR-inhibitory substances, we performed PCR on three different dilutions (10, 100, and 1,000×) of each DNA extract from the 2010-period using the primers mtSSU1 and mtSSU3R (Zoller et al., 1999) and from the 1935-period and older using the primers F7 and R7 (for PCR set-up, see Kistenich et al., 2018).
Library Preparation and Ion Torrent Sequencing
We pooled all PCR products from PCR sets 1 and 2 for each of the 56 individuals and purified the mixtures with the Illustra™ ExoProStar™ Clean-Up Kit (GE Healthcare) using a 10-fold enzyme dilution and incubating at 37°C for 45 min and inactivation at 80°C for 15 min. To remove any additional short molecules, we performed an AMPure® XP (Agencourt Biosciences Corporation) paramagnetic bead purification following the manufacturer's instructions. We used a 1:1.4 volume ratio of PCR product:beads to remove fragments shorter than approximately 100 bases. The products were eluted from the beads with 50 μl 10 mM Tris-HCl buffer.
The Ion Torrent library preparation was performed using the NEBNext® E6270-kit (New England Biolabs) with these modifications to the manufacturer's instructions: Ion Xpress™ barcoded adapters (Thermo Fisher Scientific) were diluted 1:40 to better match the low DNA input amount. The size selection step 1.3 in the protocol was omitted. In step 1.4, bead cleanup was performed using a 1:1.1 volume ratio for library:beads. The library amplification was performed using 12 cycles and a final Ampure clean up using 1:0.9 volume ratio of library:beads.
We quantified DNA concentrations on a Qubit 2.0 fluorometer (Invitrogen) and visualized fragments lengths on a Fragment Analyzer™ (Advanced Analytical) using the DNF488 kit to optimize input amounts for selected samples at various steps, such as after pooling all PCR products from each individual, after library preparation and after pooling the libraries for each chip. Samples were normalized, pooled and diluted to 17.5 pM (chip 1, samples 1–30) and 15 pM (chip 2, samples 31–56). Template preparation and sequencing was performed using a Hi-Q View Chef and sequencing kit (A29902 and A30044, respectively) and two 318 v2 chips on an Ion Torrent PGM (Thermo Fisher Scientific) using 500 flows per chip.
Sanger Sequencing
For comparison, we also analyzed our samples using standard protocols for PCR amplification and Sanger sequencing of the ca. 900 bases long mtSSU region using the primers mtSSU1 and mtSSU3R (Zoller et al., 1999) as described in Kistenich et al. (2018). All PCR-products were sequenced irrespective of showing visible bands on the gel or not.
Sequence Assembly
For an initial overview, we investigated the raw reads from both chips with the Torrent Suite v. 5.8.0 (Thermo Fisher Scientific) and removed the adapters to check the mean sequence quality using FastQC v. 0.11.2 (Andrews, 2010). Afterwards, sequence reads were analyzed using the software Geneious R9 (Kearse et al., 2012) including various plugins. We demultiplexed the reads according to the respective indexes and removed duplicate reads to facilitate sequence analysis using Dedupe of the BBTools package v. 35.82 (Bushnell, 2015). Then, we applied several quality trimming steps, such as removal of PCR primers and low quality reads and ends using BBDuk (BBTools v. 35.82, Bushnell, 2015; minimum quality set to 5, minimum read length set to 8 bases) combined with the Trim option in Geneious (error probability limit set to 0.05). The remaining reads were mapped to species-specific reference sequences using the Geneious Read Mapper (up to five iterations, high sensitivity). In cases where we suspected a high amount of chimeric sequences, we cleaned the respective dataset using UCHIME (Edgar et al., 2011) and mapped the reads against the reference sequence once more. We carefully inspected the consensus sequence for each specimen, corrected obvious sequencing mistakes manually and removed contaminant sequence reads. Sequencing success was measured as percentage of sequence length recovered compared to the full reference sequence.
For sequences produced by Sanger sequencing, we first trimmed the primer sequences and low quality-ends and then assembled the contigs in Geneious R9 (Kearse et al., 2012).
Statistical Analysis
The statistical analysis proceeded in two steps. In the first step, we identified two variables that served as indicators of DNA quality. Secondly, we used these variables as response variables in generalized linear models (GLM; McCullagh and Nelder, 1989) with identity link and normal errors (i.e., ANOVA and ANCOVA). Predictor variables were Age (2018—year of collection), Genus (factor variable with four levels), Species (factor variable with eight levels, nested within Genus), and Moisture (factor variable with two levels). For each response variable, models were built by forward selection of predictor variables, at each step including variables that contributed independently to explain variation in the response at the Bonferroni-corrected α = 0.05 level (cf. Legendre and Legendre, 2012).
Basically, seven primary variables were recorded to characterize DNA quality: relative sequence length (SeqLFr); number of reads (NoReads); read coverage (Cov), for each of the 56 samples (4 genera × 2 species × 7 time-points) represented by the minimum (CovMin), the maximum (CovMax), average (CovAve) and standard deviation of read coverage; and, finally, the concentration of DNA in the analyzed tissue (DNACon). Inspection of frequency distributions revealed strong right-skewness in all primary DNA quality variables except SeqLFr. Furthermore, CovMin was omitted from further analyses because a total of 45 out of 56 recorded values were zeroes. All right-skewed variables were log(x + 1)-transformed before further analyses, resulting in rather uniformly distributed variables. The three remaining lnCov variables were very strongly correlated (Pearson's r: |r| > 0.98, p < 0.0001, n = 56) and lnCovAvg was selected to represent the read coverage aspect of DNA quality in further analyses. DNA concentration was unrelated to the other three variables (Pearson's r: |r| < 0.17, p > 0.20, n = 56), while the other three variables were rather strongly correlated (Pearson's r: |r| > 0.89, p < 0.0001, n = 56). We therefore used lnDNACon as a separate response variable, while the three other DNA quality variables were concentrated into one composite DNA quality variable (referred to as PCA-axis 1) by principal component analysis (PCA; Pearson, 1901; Legendre and Legendre, 2012) of the correlation matrix, using Euclidean biplot scaling of axes (Oksanen et al., 2016) to maximize the fit between ordination scores and between-observation variation in SeqLFr, lnNoReads, and lnCovAvg. All analyses were performed using R v. 2.3.2 (R Development Core Team., 2018); package vegan v. 2.4.0 (Oksanen et al., 2016) was used for ordination analyses.
Results
Amplification Success
The concentration of the DNA extracts ranged from 0.08 ng/μl up to 52 ng/μl with relatively higher values for Nephroma (mean 11.3 ng/μl) and Peltigera (mean 16.8 ng/μl) and low values for Cladonia (mean 2.3 ng/μl) and Ramalina (mean 2.8 ng/μl; Table 1). DNA extracts from all periods showed a smear on the agarose gel (not shown) indicating DNA degradation. For many samples, including some from the 1860-period, the smear indicated also the presence of long fragments (>1500 bases), but from the 1960-period and older, most DNA fragments were shorter than 200 bases and often even shorter than 50 bases.
We could detect visible bands in PCR 1 and 2 mainly in samples from 2010 and 1985 (Figure 3). Occasionally, weak to strong bands could be observed in specimens from other periods as well, mostly in Peltigera specimens. The majority of PCR reactions showed no products at all. Instead, strong bands around 50–75 bases were present, also in the negative controls (Figure 3). These strong, short bands (presumably primer dimers) were stronger in the second PCR round (Figure 3).
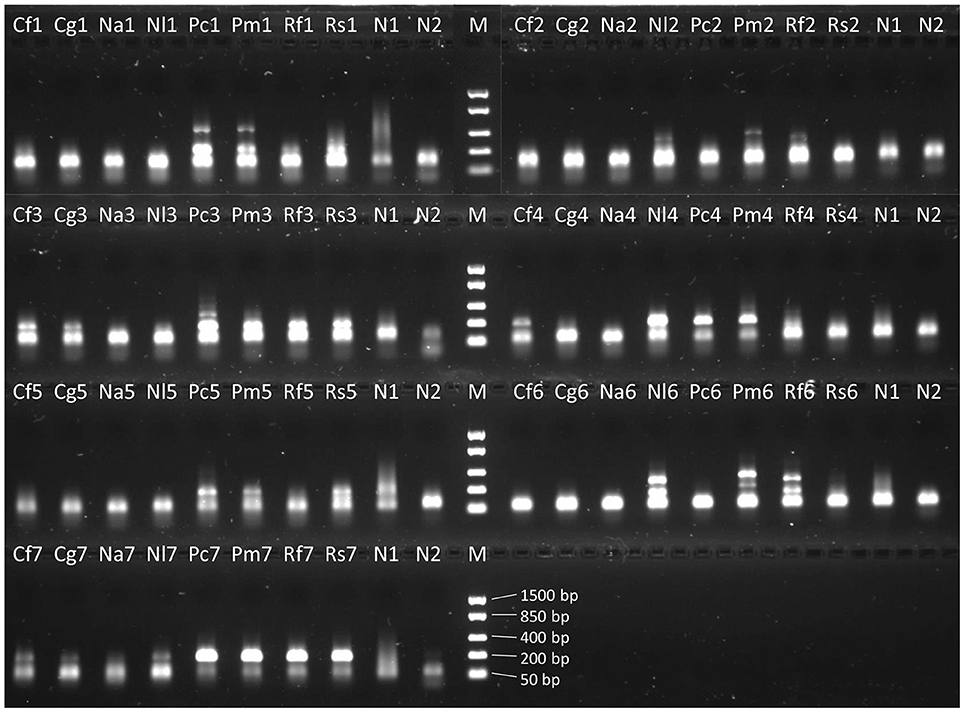
Figure 3. Image of gel visualization of PCR products from the 1985-samples for the seven primer combinations of PCR round 2 (Figure 2B: 1–7). Cf, Cladonia floerkeana; Cg, C. gracilis; Na, Nephroma arcticum; Nl, N. laevigatum; Pc, Peltigera collina; Pm, P. malacea; Rf, Ramalina fraxinea; Rs, R. siliquosa; N1, negative control from PCR round 1 run with PCR round 2; N2, negative control from PCR round 2; M, marker.
DNA concentrations after library preparation ranged from <0.05 to 29.7 ng/μl per specimen. Visible bands during the second PCR amplification generally resulted in successful sequence recovery, but also non-visible PCR products produced correct sequence reads. Missing sequence coverage was frequently found around base pair position 120–220, corresponding to the PCR fragment amplified by primers F2 and R2, and around position 520–570(−720), corresponding to the longest PCR fragment amplified by primers F5 and R5/R6.
The gel image (not shown) of the dilution series for the samples from the 2010-period did not show any increase in PCR product with increased dilution. For the samples from the 1935-period and older, the test showed varying results: For Peltigera and Ramalina species, PCR products did not increase with dilution, while for Cladonia and Nephroma species, the intensity of bands increased in diluted extracts compared to the undiluted ones. For these species, a 100 × dilution showed the best results. All specimens of each species from different periods behaved similarly in performance.
For the Sanger sequencing approach, strong PCR bands could be observed for all samples from the 2010-period apart from Ramalina siliquosa. Strong bands could also be detected for several Peltigera samples from all other periods except for the 1935-period.
Sequencing Success
Sequencing on the Ion Torrent PGM produced 6.8 million reads (median read length 202 bases) for chip 1 and 5.2 million reads (median read length 186 bases) for chip 2. Raw reads, with the adapters trimmed, had a mean sequence quality (Phred score) of Q29. About 5.7% of the generated reads could not be assigned to any barcode. Contaminant sequence reads were largely found to belong to the lichen genera Umbilicaria and Miriquidica, rarely to other fungal genera, such as Aspergillus. We recovered mtSSU sequences of varying length for 54 of the 56 specimens investigated (Table 1; Figures 4, 5; Supplementary File S1). The targeted sequence length was 883 bases for each Cladonia species, 806 bases for Nephroma arcticum, 780 bases for N. laevigatum, 835 bases for Peltigera collina, 831 bases for P. malacea, 794 bases for Ramalina fraxinea and 795 bases for R. siliquosa. Recovery success was highest for the youngest and lowest for the oldest specimens (Figure 4). The number of reads used for mapping ranged from 2 to >100,000 resulting in a mean sequence coverage of up to 37,000 × per specimen (Table 1). For two specimens, Nephroma arcticum and N. laevigatum from the 1935-period, no good-quality sequence reads could be recovered. For an additional five specimens, N. laevigatum from the 1960-period, C. gracilis and N. arcticum from the 1885-period and C. floerkeana and R. siliquosa from the 1860-period, only short or strongly fragmented sequences of <130 bases length could be recovered (Table 1). For 11 specimens, the full sequence length was recovered, including three specimens from the 1910-period and one from the 1885-period (Table 1). In all, we recovered >75% of the total sequence length for 34 of the 56 specimens. The seven generated sequences from the different periods for each species showed up to six intraspecific variable sites for C. floerkeana, seven for C. gracilis, four for N. arcticum, two for N. laevigatum, one for P. collina, one for P. malacea, three for R. fraxinea, and six for R. siliquosa. Specimens of Peltigera gave the highest sequence recovery success (mean = 83%), followed by Ramalina (mean = 75%) and Cladonia (mean = 60%), while specimens of Nephroma performed the least well (mean = 43%; 5). Coastal species had a slightly lower sequencing success (62%) than inland species (68%).
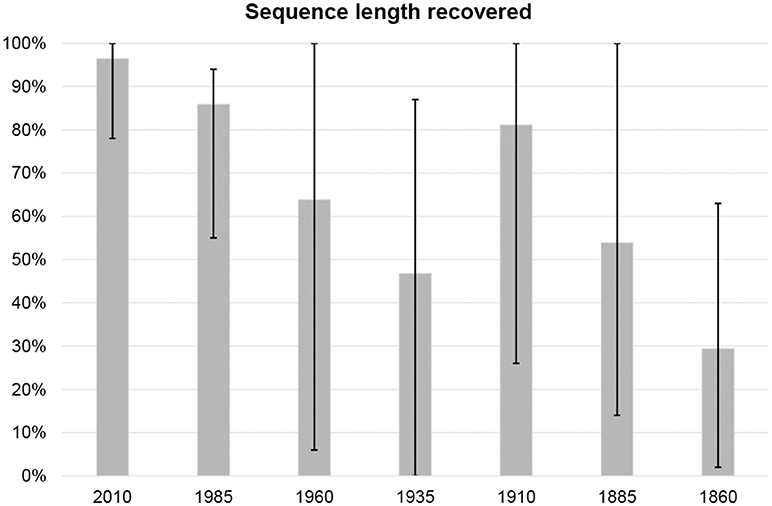
Figure 4. Percentage of reference sequences recovered within each period. Columns indicate mean sequence length with error bars for max and min values.
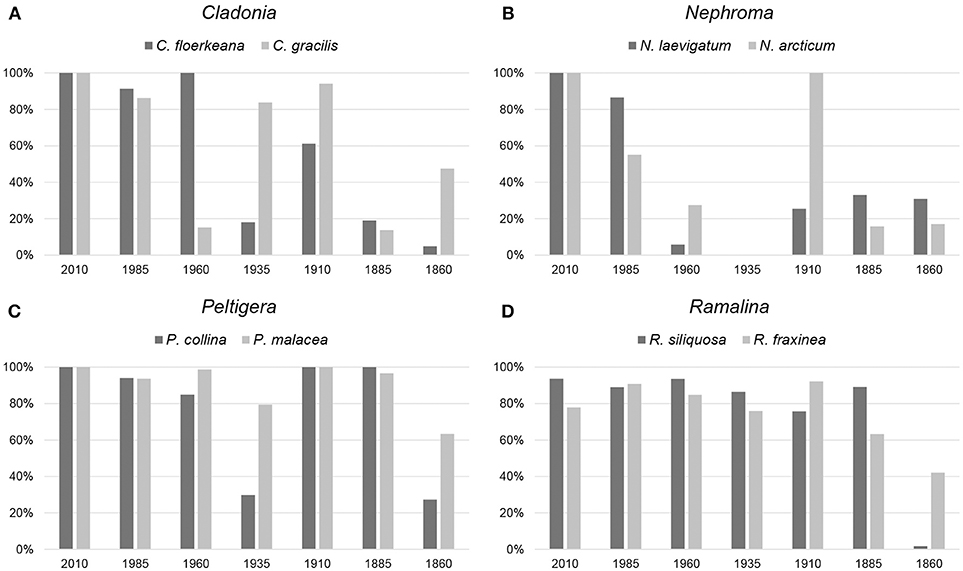
Figure 5. Sequence recovery success per period for each specimen divided into the four chosen genera: (A) Cladonia, (B) Nephroma, (C) Peltigera, and (D) Ramalina.
Sanger sequencing of regular one-step PCR products produced 19 sequences corresponding to the samples showing visible bands on the gel. Four of those sequences, including all from the 1860-period, were contaminated with either lichenized or unlichenized fungi according to BLAST searches at NCBI. The 15 remaining sequences had a length of 506–883 bases (i.e., 61–100% of target sequence; Table 3; Supplementary File S2). Full sequences could be generated for all Cladonia and Nephroma samples plus P. malacea from the 2010-period, N. laevigatum and P. malacea from the 1985-period, and for P. malacea from the 1960 and 1910-periods (Table 3; Supplementary File S2). The oldest specimen, for which a sequence could be generated, was P. collina from the 1885-period with a 703 bases long sequence (Supplementary File S2). Sanger sequences of N. laevigatum (1985) and P. malacea (1985 and 1960) were slightly longer than sequences generated by the Ion Torrent protocol (Table 3). Sanger sequencing trace files showed an overall decline in quality with increased time since collection, in particular from the 1985-period and older.
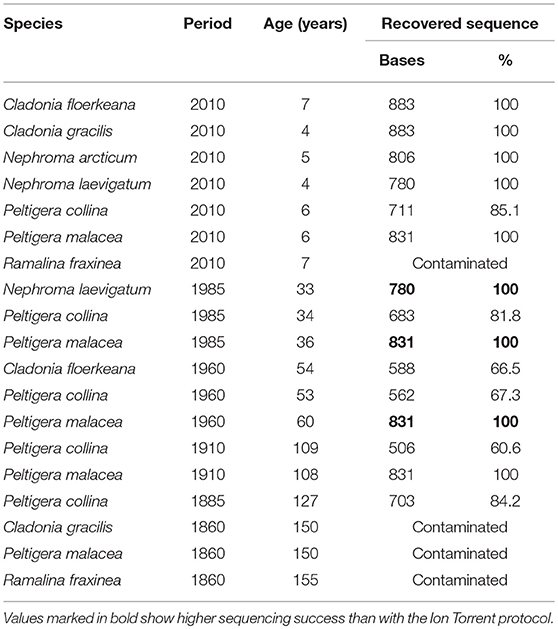
Table 3. Specimens recovered with Sanger sequencing including length of sequences.
Statistical Analysis
Axis 1 in the PCA ordination of relative sequence length (SeqLFr), number of reads (lnNoReads) and mean coverage (lnCovAvg) explained 95.3% of the total variation in the set of these three variables (after standardization to zero mean and unit variance), while only 4.2% was explained on axis 2 (Figure 6). PCA-axis 1 could therefore confidently be used as a composite variable that concentrated the three single variables into one “DNA quality variable.” PCA-axis 1 was strongly related to Age (29.6% of the variation explained; p < 0.0001; Table 4). Also Genus explained significant variation along PCA-axis 1 (16.5%; p = 0.0237; Table 4), while the variations explained by Species and Moisture were not significant (p > 0.2; Table 4). The PCA ordination diagram (Figure 6) revealed high DNA recovery success (high DNA quality) for samples collected <50 years ago (to the left), while samples collected more than 50 years ago tended to cluster on the right-hand side in the diagram. Figure 6 also shows that DNA quality cannot be precisely predicted from Age; old material with high DNA quality (dark dots to the left) and new material with low DNA quality (light-colored dots to the right) both occurred to the far left. Because the factorial design of the study makes Genus and Age virtually uncorrelated, Genus explained 22.3% of the variation not explained by Age (p = 0.0038) and the interaction between Genus and Age was insignificant. Genus affiliation explained a larger fraction of variation (30.7%; p = 0.0002) in DNA concentration than did Age (9.3%; p = 0.0223; Table 4). While each of the three DNA quality variables SeqLFr, lnNoReads, and lnCovAvg were uncorrelated with lnDNACon in the total material, sequence length and DNA concentration were significantly correlated in the subset of observations with age >100 years (Pearson's r = 0.4766, p = 0.0185, n = 24).
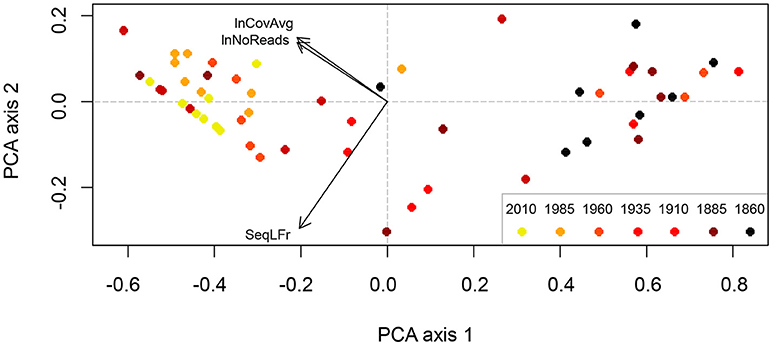
Figure 6. PCA ordination (axes 1 and 2) of the three DNA-characteristics, relative recovered sequence length (SeqLFr), ln-transformed number of reads (lnNoReads) and ln-transformed mean read coverage (lnCovAvg) as recorded for the 56 lichen samples. The points represent samples with the time-period, in which they were collected, indicated by different colors (legend inserted lower right). The arrows indicate the direction of maximum increase of each of the three variables in the PCA ordination diagram. The axes are scaled in arbitrary units.
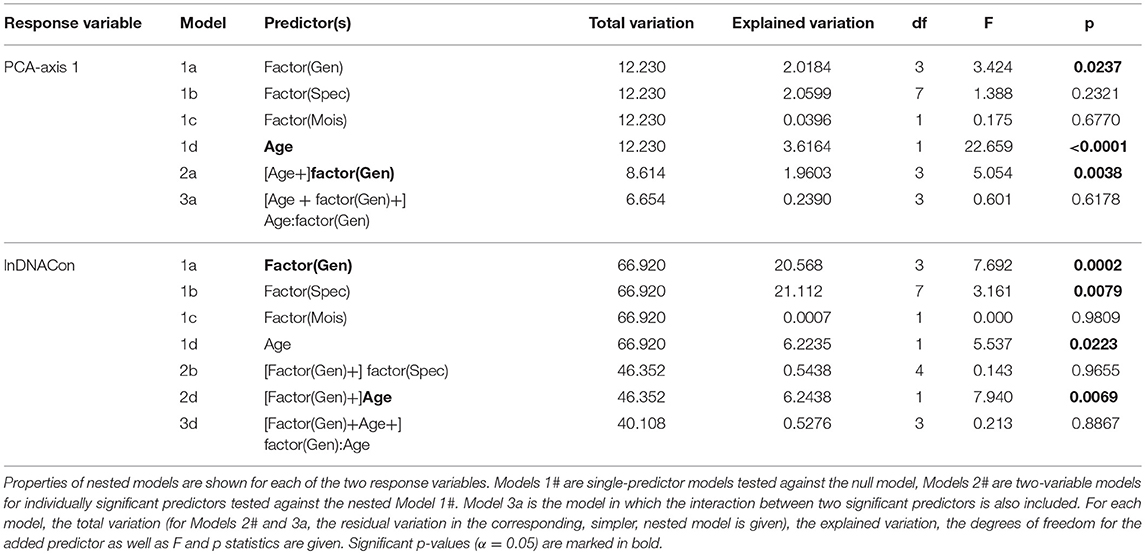
Table 4. GLM modeling of DNA quality variables “PCA-axis 1” [a compositive variable that expresses relative sequence length (SeqLFr), number of reads (NoReads) and average read coverage (CovAvg)] and the logarithm of tissue DNA concentration (“lnDNACon”) as a function of the predictor variables genus (Gen), species in genus (Spec), moisture (Mois) and tissue age (Age).
Discussion
In this study, we aimed at sequencing a DNA fragment of about 900 bases of the mtSSU from 56 lichen specimens of varying age up to 155 years since collection. We applied the two-step PCR HTS protocol of Prosser et al. (2016) to obtain DNA fragments of different lengths that were sequenced on an Ion Torrent PGM and compared the results to standard Sanger-sequenced samples. Sanger sequences could only be obtained for 15 specimens, mainly from young specimens. In contrast, we obtained Ion Torrent sequences from 54 of the 56 specimens, and for 34 of these specimens, more than 75% of the target sequence could be recovered, including specimens collected up to 138 years ago. This pilot study shows that the approach by Prosser et al. (2016) is successful in generating DNA sequences of historical lichen material when Sanger sequencing fails.
Sequencing Success
Using the HTS protocol of Prosser et al. (2016), we obtained the entire ca. 900 bases long mtSSU target sequence from lichen specimens collected up to 127 years ago (Table 1; Figure 4). Also shorter sequences obtained from specimens up to 150 years old (Table 1; Figure 4) contained enough information for species identification. However, sequencing success for specimens from the 1860-period was greatly reduced compared with those from the 1885-period (29 vs. 54% average sequence length recovered, respectively). We found generally lower sequence length recovery from both the 1960- and 1935-periods with 64 and 47% success, respectively (Figure 4). In contrast, the specimens from the 1910-period performed extremely well with 81% success (Figure 4).
Using our standard protocols for PCR amplification (i.e., one-step) and Sanger-sequencing of lichens, we obtained correct DNA sequences from 15 samples, mainly from the most recently collected specimens (Table 3; Supplementary File S2). Most of these sequences were shorter or equally long as the Ion Torrent sequences. Three Sanger sequences, however, resulted in longer sequence lengths than the respective Ion Torrent sequences. The fact that we were able to recover 703 bases of the 127-years-old P. collina specimen by standard protocols shows that also one-step PCR and Sanger sequencing can be successful even for specimens more than 100 years old. We therefore recommend testing Sanger sequencing on old samples first before using the Ion Torrent approach. Overall, however, substantially more sequence information was obtained by applying the Ion Torrent protocol.
Consensus sequences from the Ion Torrent approach showed overall better quality than those generated by Sanger sequencing. Some sequence contigs from Sanger sequencing showed missing bases at the start or end after the primer binding-site compared to the Ion Torrent and reference sequences and had to be corrected manually. Other contigs showed a high number of ambiguities due to low trace file quality and required detailed manual inspection and correction. Using the Ion Torrent protocol, these issues were reduced by increased read coverage.
There are probably several reasons for why some specimens failed to recover the full-length sequence from all seven periods. First, it has been shown that high temperatures (>42°C) and extended drying periods of freshly collected plant specimens have a strong negative impact on DNA quality and may be a more important factor causing DNA degradation than age (Taylor and Swann, 1994; Erkens et al., 2008; Staats et al., 2011; Drábková, 2014). We expect that the same factors decrease DNA quality also in lichens, but the information about how the samples were dried after collection is very limited.
Second, in old herbaria without air conditioning, fluctuations of temperature and humidity levels are common and may contribute to accelerated degradation of DNA (Adams, 2011). Unfortunately, the preservation and storage methods used are largely unknown, in particular for specimens from the 1960s and older. In addition, preserved specimens are routinely frozen for several days upon entering a new herbarium. Also the rising frequency of between herbarium-loans due to increased use of natural history collections in research may accelerate DNA degradation. However, Doyle and Dickson (1987) reported that multiple freezing-thawing cycles do not seem to affect DNA quality. We found no newer study investigating the effect of freezing-thawing cycles on DNA, despite frequent claims in the literature that this is undesirable due to DNA degradation.
A third reason for reduced sequencing success might be the presence of PCR-inhibitory substances in the extracted DNA. Many lichens contain various amounts of secondary metabolite compounds (Culberson and Culberson, 2001; Elix, 2014). These lichen substances have not been shown to inhibit PCR amplification, but polysaccharides and terpenoids may do so (Armaleo and Clerc, 1995; Ekman, 1999). The genera Nephroma and Peltigera are known to contain high amounts of terpenoids. As we received poor sequencing results for Nephroma in particular (43%), we tested for the presence of PCR-inhibitory substances by running a PCR on three dilutions of all DNA extracts from the 2010-samples and also of the samples from the 1935-period and older, as we expected that old herbarium samples could have accumulated PCR-inhibitory substances. Our result that amplification success was improved when extracts were diluted 100-fold indicate the presence of inhibitory substances in DNA extracts from old specimens of Cladonia and Nephroma. None of the 2010-period extracts showed an increase in PCR product with increased dilution; neither did old samples of Peltigera or Ramalina. Presence of PCR-inhibitory substances may therefore be the reason for the poor sequencing success of Nephroma specimens, as this test was done post-sequencing.
Fourth, the DNA extraction method strongly influences DNA yield (Rohland and Hofreiter, 2007; Särkinen et al., 2012). As expected, the specimens from the 1860-period (i.e., the oldest) showed the poorest performance (29% sequencing success). Apart from being older, the specimens from the 1860-period were extracted as part of another unpublished study using a different DNA extraction kit and protocol. This protocol was not tailored to the sensitive extraction of the mycobiont's DNA and may, at least partially, have contributed to the poorer DNA quality.
Finally, herbarium material of vascular plants has traditionally been treated with chemical preservatives (i.e., fungicides and insecticides), such as mercuric chloride (Hall, 1988), which appear to reduce the usability of the extracted DNA (Do and Drábková, 2018; own experience). We are not aware of any similar chemical treatments for the preservation of lichens in our herbaria except for the single use of gaseous insecticides in the 1990s, but such information was not recorded before the 1980s, though.
Most likely, however, the varying sequencing success was caused by a combination of the factors mentioned above; perhaps with different relative importance for different samples. Moreover, in this pilot study, we merely used a single specimen per species per period (n = 56). Increasing the sample size would give more robust results. Moreover, it is our experience that PCR amplification is a largely unpredictable process when the DNA extracts are of poor quality as is expected for our historical samples. Running multiple PCR reactions in parallel may result in single reactions being successful (own experience). Often, however, one does not have sufficient amounts of extracted DNA to perform this parallel-PCR test when working with old and precious samples.
We used different amounts of thallus input material for DNA extraction, varying between 1 and 109 mg, depending on the availability of material. Although one might expect the amount of input material to affect the output of DNA (and subsequently the sequencing success), we could not find a clear relationship between the amounts of input and output. For instance, we retrieved full-length sequences from specimens of the 1910-period with as little as 2 mg input material and with as much as 43 mg (Table 1; Figure 5). The fact that even small amounts of input material allow for generation of full-length sequences from more than 100-year-old specimens is very good news for the value of precious herbarium specimens, such as type material, opening for successful analyses of DNA without the destroying much material.
We were not able to recover full-length sequences for any of the Ramalina specimens. Sanger sequencing failed completely, whereas a 47–48 bases long fragment always failed to assemble in the Ion Torrent approach. Even though parts of this fragment were sequenced, the middle part is always missing; a puzzling result as this region is rather conserved and with few variable sites among the selected eight species. We designed universal primers based on eight species from four distantly related lichen families. Thus, one explanation for the systematically missing sequences might be a poor annealing-property to these particular Ramalina species of the designed primers F5 and R5. In general, however, our degenerate primers performed well for all eight species. Studies comparing different HTS platforms have reported that the Ion Torrent PGM often performs less well in recovering the whole target sequence than other platforms (Loman et al., 2012; Quail et al., 2012). Even though the sequencing chemistry and technology has improved since 2012, runs on different sequencing platforms should be compared to explore their significance for sequencing success of historical lichen samples.
Hypothesis Testing
As expected, we found a highly significant correlation between the age of specimens and sequencing success (p < 0.0001; Figure 6; Table 4), supporting our first hypothesis that quality DNA and sequence reads are more readily obtained from younger than older specimens. Erkens et al. (2008) reported a ~1% decrease in extractable amounts of DNA from plant herbarium specimens per year. We do not know about any similar estimates of yearly decrease in DNA in lichens, and our results do not support the existence of such a pattern. In our current data, degradation of DNA extracts was similar for all samples throughout all periods with the most recently collected samples showing somewhat less degradation. In samples from the 1960-period and older, most DNA fragments were only 50 bases long, but there were also some long fragments (>1500 bases) faintly visible on the agarose gel. Measured DNA concentrations was >0.1 ng/μl for almost all DNA extracts, even for the older ones (Table 1). When comparing all samples from every period, we could neither detect a correlation between amount of input material and DNA concentration nor between sequencing success and DNA concentration (Table 4). For samples from the 1910-period and older, however, we could detect a weak positive correlation between sequencing success and DNA concentration (p = 0.0185) indicating that sequencing success might increase with increasing DNA concentrations in old samples. Hence, special focus should be placed on the DNA extraction process when handling old material. DNA extracted from lichens usually consists of a mixture of various organisms. Therefore, the extract does not only contain the mycobiont's DNA, but most likely also contaminant DNA from the photobiont, basidiomycetes (Spribille et al., 2016) and possibly other unknown symbionts, epibionts, or endophytes. Hence, we do not know the proportion of mycobiont DNA in our DNA extracts. It is possible, therefore, that the mycobiont DNA represents only a fraction of the total DNA concentration measured and that the long fragments observed on the gel result could result from contaminants. Still, the amount and quality of mycobiont DNA in our specimens was mostly sufficient to generate reads, even though few in number for specimens from the 1860-period (Table 1; Figure 4). This fact indicates that extracting DNA of sufficient quality from even older lichen specimens should be feasible and ought to be explored further.
We found that the different genera did not perform equally well in PCR amplification and sequence recovery (Figure 5). The statistical analyses indicate a significant difference between sequencing success and genus affiliation (p < 0.004; Table 4), but not species affiliation (Table 4). The average sequence recovery for the Nephroma species was only 43%, about half the recovery observed for the Peltigera species (83%). As we were also able to produce >700 bases long Sanger sequences of various old Peltigera samples, DNA from this genus seemed to be in a particularly good condition with long fragments. Peltigera and Nephroma are morphologically similar with big lobes and cyanobacteria as photobionts (for N. arcticum only in cephalodia) and occur in similar habitats. The success rate for sequencing the ITS barcode marker of fresh Nephroma specimens has been high in the Norwegian Barcode of Life project (OLICH), suggesting that the low sequencing success in the present study may either be due to the low initial sample size or to the presence of PCR-inhibitory substances in old specimens (see above). The Ramalina species performed well with 75% recovery success followed by Cladonia with 60%. For ITS in the OLICH project, we experienced higher success for Cladonia (ca. 70%) than Ramalina (ca. 60%), but these figures are based on a broader specter of species from both genera, but also younger specimens than in the present study. When comparing specimens from the two most recent periods only (i.e., the 2010- and 1985-periods), average sequencing success is higher with 94% for Cladonia, 85% for Nephroma, 97% for Peltigera and 88% for Ramalina, outperforming the general OLICH success. Still, sequencing success seems to be dependent on the target genus. When using DNA concentration as response variable in our GLM analyses, we found a significant effect of genus affiliation (and in this case also of species affiliation; Table 4), that was even stronger than the effect of age (p < 0.03; Table 4). Thus, we cannot reject our second hypothesis that quality DNA and sequence reads are more readily obtained from some taxa than others given that age of the material is kept constant.
Our general experience when working with lichens from humid tropical regions is that they become difficult to obtain DNA sequences from shortly after collection; often, longer (>ca. 300 bases) Sanger sequences cannot be obtained after only a few months of storage. In contrast, we do not experience this difficulty with taxa adapted to the less humid boreal regions. We hypothesized that lichens adapted to more arid conditions are better equipped for keeping their DNA intact over longer periods of desiccation than species adapted to the humid tropics; the latter should not need the same mechanisms for DNA protection. The DNA of tropical lichens should degrade faster when subjected to desiccation, which is, in fact, our traditional way of preserving lichen specimens. Specimens collected in the humid tropics need to be dried longer, but due to limited facilities and time, the drying process is often compressed by increasing the temperature. Sometimes, the process may not be fully completed for several days or weeks, facilitating enzymatic DNA degradation. Bakker et al. (2016) found the DNA of wet-tropical angiosperms to have aged faster than the DNA of angiosperms from dry habitats and attribute this difference to the more intense drying processes. This led us to formulate the third hypothesis that quality DNA and sequence reads are more readily obtained from preserved specimens of species adapted to dry habitats than from those adapted to humid conditions. This is also the reason why we chose species pairs growing in dry inland habitats vs. humid coastal areas. Our statistical analyses, however, did not support our hypothesis (Table 4); the average sequencing success rate for inland species was only slightly higher than for coastal species (68 vs. 62%, respectively). Due to the limited availability of relevant specimens, the sampling in this study was restricted to boreal taxa with different preferential distribution ranges. Both species of each genus exhibit distribution ranges that overlap to some extent, which may contribute to the non-significant results. Our results therefore do not preclude significant differences in sequencing success between specimens from more extreme habitats, such as (semi-) arid deserts vs. tropical rainforests.
Applicability of the Ion Torrent Protocol for Lichen Taxonomy
Sanger sequencing is still the preferred and most commonly used method for generating sequences of the barcode marker ITS and other markers in lichen systematics (Hoffman and Lendemer, 2018). Our study shows that HTS is highly suitable for obtaining sequences from both young and old lichen specimens. We managed to recover full-length sequences from historical specimens using the two-step PCR HTS protocol by Prosser et al. (2016), specimens for which Sanger sequencing failed completely or produced substantially shorter sequences.
This study includes specimens of the same species from different time periods. Using existing DNA sequences of the same species as reference simplifies quality-checking different steps during read analysis. We therefore used available references of the same set of species for read mapping, which greatly facilitated this task including the quality-checking for mistakes. Our expectation was to receive near identical mtSSU sequences for the specimens belonging to the same species, not the least because the mtSSU marker is generally understood to be less variable than the ITS, which may vary highly within populations of the same species. Hence, we assume that read assembly might be more challenging for ITS. If there is no reference sequence available of the study species or a closely related taxon, the sequence reads need to be de novo assembled and proofreading will be more challenging. There are few species, for which no recently collected material exists, and which are not represented by DNA sequences in GenBank. Most challenging may be the common case in lichenology of species that are only known from an old type specimen.
In our assembled reads, we frequently encountered homopolymer-associated indel errors, especially in AT-rich regions and when compared to our Sanger-sequenced samples. This is a commonly known disadvantage of the Ion Torrent PGM sequencing method but is also a known issue for Sanger sequencing (Loman et al., 2012; Goodwin et al., 2016). In addition, the Ion Torrent PGM has a sequence read error rate of 1–1.8% (Loman et al., 2012; Quail et al., 2012), which may generate errors that are difficult to discern from the true sequence when only a few reads are recovered and no reference sequence is available. In our consensus sequences of the assembled reads, we found up to seven differing nucleotide sites between specimens of the same species. It is unclear if these differences result from Ion Torrent specific sequencing errors or if they merely represent intraspecific variation, especially when only a few reads were recovered. We found these nucleotide differences in both sequences assembled from many reads as well as those based on few reads, suggesting that the differing nucleotide sites result from intraspecific variation rather than sequencing errors. When working with long-time archived specimens, sequences should be checked and corrected for typical ancient DNA degradation patterns, especially T to C substitutions in fragment ends (Weiß et al., 2016). We expected T to C substitutions to occur in sequence reads from the older specimens compared to the reference sequences based on fresh specimens. We could not find any of these substitutions and assume that they might have been lost during read trimming steps. We discovered only three T to C substitutions in sequences from the 1960- and 1910-periods and none in the ones from the 1885- and 1860-periods. These substitutions, however, were never at the end of fragments. This is consistent with the suggestion above that the differing nucleotide sites represent true intraspecific variation.
Another challenge when assembling historical type specimens without an appropriate reference sequence is the identification of contaminant sequence reads. We discovered contaminant sequence reads in our assembled consensus sequences. When subjecting these reads to BLAST searches at NCBI or against our own DNA sequence database, we found them to often associate with Umbilicaria or Miriquidica species. Reads belonging to species of Cladonia or Peltigera could also be detected in various datasets of other species. These contaminants might result from spores of other species being attached to the fragments we chose for DNA extraction. The contamination by Cladonia or Peltigera reads might also be due to demultiplexing errors. Only rarely did some of the assembled sequences belong to other, non-lichenized, fungal species, such as Aspergillus. The latter genus is often encountered when sequencing lichens without conducting the preparation steps in a dedicated clean lab facility. The low amount of fungal contaminants in our sequence reads indicates that performing the DNA extractions and PCR preparations in a clean lab facility is important for eliminating such contaminants.
Drawbacks, Potential Improvements, and Future Use of the Approach Tested in This Study
In this pilot study, we were able to recover sequences from almost all specimens investigated including several specimens collected more than 100 years ago. To our knowledge, this is the first successful attempt to recover a full taxonomic marker (i.e., the ca. 900 bases of the mtSSU regularly used in lichen systematics) from lichen specimens that were collected up to 127 years ago. In this study, we tested specimens from two orders of lichenized ascomycetes. As the approach by Prosser et al. (2016) should be a universally applicable method, which can be tailored to any organism of interest, we expect this approach to work for lichenized basidiomycetes as well, given that adequate primers are developed. We recommend this approach to be tested on additional species from various lichen families with more representatives per species per period. Doing so, one may better understand why certain specimens fail to produce reads and further explore to what extent sequencing success depends on taxonomic affinity and/or the autecology of the species. In particular, sequencing success of specimens from moist tropical vs. dry habitats should be assessed using specimens from more extreme habitats. Future studies should make use of rich herbarium collections of species with even older specimens and a denser time-line sampling. In addition, the applicability of our Ion Torrent approach on the ITS, the fungal barcode marker, and other relevant markers ought to be explored.
We discovered that some of the old specimens (collected >80 years ago) contained PCR-inhibitory substances; a discovery we made only after we had finished sequencing our samples. Especially, Nephroma specimens seemed to contain strong PCR-inhibitors, which might explain their low sequencing success. Hence, we strongly recommend testing for the presence of PCR-inhibitory substances by running dilution series before the start of the Ion Torrent approach. In addition, tweaking the PCR conditions further might lead to more successful PCR amplification. Moreover, several studies have shown that different polymerases give different results (e.g., Telle and Thines, 2008; Särkinen et al., 2012), indicating several starting points for increasing sequencing success in the future.
Other HTS platforms, for example various Illumina machines, should be explored to assess if these can overcome some of the drawbacks with the Ion Torrent PGM. Using the Illumina MiSeq technology, Forin et al. (2018) managed to obtain ITS2 sequences of century-old fungal collections, indicating the potential success of this approach also for historical lichen specimens. Furthermore, single-read sequencing technologies, such as implemented in the PacBio (Pacific Biosciences) and MinION (Oxford nanopore technologies) should be tested with lichen material. Both platforms might circumvent the amplification step, thus reducing possible amplification biases. However, they also produce longer and fewer reads than the Ion Torrent or Illumina platforms (Bleidorn, 2016), which is no advantage when working with fragmented DNA, though. To our knowledge, these platforms have so far not been tested on historical herbarium material.
An alternative approach to obtaining DNA sequences from historical lichen specimens is shotgun sequencing of the entire genome. While several biogeographic studies have adopted this approach (e.g., Cao et al., 2011; Rivarola et al., 2011), research within lichen systematics and taxonomy still largely relies on Sanger sequencing of certain markers (Hoffman and Lendemer, 2018). The full genome size of some flowering plants and ferns can reach up to 147 Gb (Hidalgo et al., 2017). In contrast, the lichen mycobiont has a typical genome size of only about 35 Mb (Grube et al., 2014) and a variable mitochondrial genome size of 25–120 kb (Pogoda et al., 2018). So, the implementation and regular use of shotgun sequencing of unreduced genomic DNA seems more feasible and applicable in fungi than in plants. Surprisingly, Staats et al. (2013) found that the coverage for whole genome sequencing of fungi was lower than for other organisms, such as plants or insects. They were able, however, to recover nearly full organelle genomes. Other fungal studies can point to full genome recovery success (e.g., Van Kan et al., 2017; Armstrong et al., 2018). The amount of required input material for obtaining the complete organelle or the entire genome of an organism might be a limiting factor for historical specimens. Complete organelle genomes have been successfully sequenced from as little as 24–33 ng input DNA (Bakker et al., 2016; Zedane et al., 2016). Clearly, shotgun sequencing of unreduced genomic DNA of historical specimens should be explored further to find out if taxonomically relevant markers can be fully recovered, without increase in sample destruction and with reduced cost and effort.
The costs for using the herein described Ion Torrent approach are less than twice as high as Sanger-sequencing costs if we had attempted to Sanger-sequence all seven mtSSU fragments per specimen. Within the last decade, costs for HTS, such as Ion Torrent and Illumina, have declined rapidly and are expected to decline further in the future. Hence, it will soon become more feasible also for smaller labs to implement our Ion Torrent approach. Costs can be further reduced by multiplexing more specimens. In addition, Ion Torrent sequencing is more time-efficient than Sanger-sequencing, not necessarily for sample preparation, but concerning the actual sequencing time.
We anticipate and welcome future and more comprehensive studies on historical lichen specimens that will identify where the methodological improvements can be gained. Our results show that DNA is still present in high enough quantities and as long enough fragments in 150-years-old lichen specimens for succeeding with the Prosser et al. (2016) method. Thus, a protocol combining PCR amplification of different-length fragments and HTS seems promising for circumventing the challenges with fragmented and low-concentration DNA.
Data Availability
Datasets Are in a Publicly Accessible Repository
The sequences generated for this study can be found in GenBank under the respective accession number listed in Table 1. Sequences, which could not be submitted to GenBank as well as Sanger sequences, can be found in Supplementary Files S1, S2, respectively.
Datasets Are Available on Request
The raw sequencing data supporting the conclusions of this manuscript will be made available by the authors, without undue reservation, to any qualified researcher.
Author Contributions
MB and ET initiated the study, which was further developed together with SK. SK, AS-N, LT, and MB planned and designed the experiments. ET provided the specimens, which were sampled by SK. SK performed the laboratory work under guidance by AS-N, LT, and MB. SK analyzed the generated sequence data. RH performed the statistical analyses. SK wrote the first draft whereas all authors edited and completed the manuscript.
Conflict of Interest Statement
The authors declare that the research was conducted in the absence of any commercial or financial relationships that could be construed as a potential conflict of interest.
Acknowledgments
We are grateful to Stefan Ekman (Museum of Evolution, Uppsala, Sweden) and Jarl Andreas Anmarkrud from the DNA-lab (Natural History Museum, Oslo, Norway) for valuable discussions and the latter in addition for assistance before and during the molecular work in the lab. Thanks are also due to Sean Prosser (University of Guelph, Guelph, Canada) for additional comments on the molecular methods. We thank Micheal D. Martin (NTNU University Museum, Trondheim, Norway) for extracting DNA from the samples of the 1860-period.
Supplementary Material
The Supplementary Material for this article can be found online at: https://www.frontiersin.org/articles/10.3389/fevo.2019.00005/full#supplementary-material
The file S1_HTS_sequences.fasta contains those Ion Torrent sequences generated in this study with <200 bases length or >50% ambiguous characters, which could not be submitted to GenBank. The file S2_Sanger_sequences.fasta contains all Sanger sequences generated in this study.
References
Adams, R. P. (2011). DNA from herbarium specimens: II. Correlation of DNA degradation with humidity. Phytologia 93, 351–359.
Amo de Paz, G., Cubas, P., Divakar, P. K., Lumbsch, H. T., and Crespo, A. (2011). Origin and diversification of major clades in parmelioid lichens (Parmeliaceae, Ascomycota) during the Paleogene inferred by Bayesian analysis. PLoS ONE 6:e28161. doi: 10.1371/journal.pone.0028161
Andreasen, K., Manktelow, M., and Razafimandimbison, S. G. (2009). Successful DNA amplification of a more than 200-year-old herbarium specimen: recovering genetic material from the Linnaean era. Taxon 58, 959–962.
Andrews, S. (2010). FastQC: A Quality Control Tool for High Throughput Sequence Data. Available online at: http://www.bioinformatics.babraham.ac.uk/projects/fastqc (Accessed August, 2018).
Armaleo, D., and Clerc, P. (1995). A rapid and inexpensive method for the purification of DNA from lichens and their symbionts. Lichenologist 27, 207–213. doi: 10.1016/S0024-2829(95)80019-0
Armstrong, E. E., Prost, S., Ertz, D., Westberg, M., Frisch, A., and Bendiksby, M. (2018). Draft genome sequence and annotation of the lichen-forming fungus Arthonia radiata. Genome Announcements 6:18. doi: 10.1128/genomeA.00281-18
Bakker, F. T., Lei, D., Yu, J., Mohammadin, S., Wei, Z., van de Kerke, S., et al. (2016). Herbarium genomics: plastome sequence assembly from a range of herbarium specimens using an Iterative Organelle Genome Assembly pipeline. Biol. J. Linnean Soc. 117, 33–43. doi: 10.1111/bij.12642
Bendiksby, M., Mazzoni, S., Jørgensen, M. H., Halvorsen, R., and Holien, H. (2014). Combining genetic analyses of archived specimens with distribution modelling to explain the anomalous distribution of the rare lichen Staurolemma omphalarioides: long-distance dispersal or vicariance? J. Biogeogr. 41, 2020–2031. doi: 10.1111/jbi.12347
Bendiksby, M., and Timdal, E. (2013). Molecular phylogenetics and taxonomy of Hypocenomyce sensu lato (Ascomycota: Lecanoromycetes): extreme polyphyly and morphological/ecological convergence. Taxon 62, 940–956. doi: 10.12705/625.18
Benson, D. A., Cavanaugh, M., Clark, K., Karsch-Mizrachi, I., Ostell, J., Pruitt, K. D., et al. (2018). GenBank. Nucleic Acids Res. 46, D41–D47. doi: 10.1093/nar/gkx1094
Bieker, V. C., and Martin, M. D. (2018). Implications and future prospects for evolutionary analyses of DNA in historical herbarium collections. Bot. Lett. 165, 409–418. doi: 10.1080/23818107.2018.1458651
Bleidorn, C. (2016). Third generation sequencing: technology and its potential impact on evolutionary biodiversity research. Syst. Biodivers. 14, 1–8. doi: 10.1080/14772000.2015.1099575
Bushnell, B. (2015). BBTools Package. Available online at: http://www.sourceforge.net/projects/bbmap/
Cao, J., Schneeberger, K., Ossowski, S., Günther, T., Bender, S., Fitz, J., et al. (2011). Whole-genome sequencing of multiple Arabidopsis thaliana populations. Nat. Genet. 43, 956–963. doi: 10.1038/ng.911
Culberson, C. F., and Culberson, W. L. (2001). Future directions in lichen chemistry. Bryologist 104, 230–234. doi: 10.1639/0007-2745(2001)104[0230:fdilc]2.0.co;2
Do, D., and Drábková, L. Z. (2018). Herbarium tale: the utility of dry specimens for DNA barcoding Juncaceae. Plant Syst. Evol. 304, 281–294. doi: 10.1007/s00606-017-1476-x
Doyle, J. J., and Dickson, E. E. (1987). Preservation of plant samples for DNA restriction endonuclease analysis. Taxon 36, 715–722. doi: 10.2307/1221122
Drábková, L. Z. (2014). “DNA extraction from herbarium specimens,” in Molecular Plant Taxonomy: Methods and Protocols, ed P. Besse (Totowa, NJ: Humana Press), 69–84.
Edgar, R. C., Haas, B. J., Clemente, J. C., Quince, C., and Knight, R. (2011). UCHIME improves sensitivity and speed of chimera detection. Bioinformatics 27, 2194–2200. doi: 10.1093/bioinformatics/btr381
Ekman, S. (1999). PCR optimization and troubleshooting, with special reference to the amplification of ribosomal DNA in lichenized fungi. Lichenologist 31, 517–531. doi: 10.1006/lich.1999.0226
Elix, J. A. (2014). A Catalogue of Standardized Chromatographic Data and Biosynthetic Relationships for Lichen Substances, 3rd Ed. Canberra: Elix
Erkens, R. H. J., Cross, H., Maas, J. W., Hoenselaar, K., and Chatrou, L. W. (2008). Assessment of age and greenness of herbarium specimens as predictors for successful extraction and amplification of DNA. Blumea Biodivers. Evol. Biogeogr. Plants 53, 407–428. doi: 10.3767/000651908x608052
Forin, N., Nigris, S., Voyron, S., Girlanda, M., Vizzini, A., Casadoro, G., et al. (2018). Next generation sequencing of ancient fungal specimens: the case of the Saccardo Mycological Herbarium. Front. Ecol. Evol. 6:129. doi: 10.3389/fevo.2018.00129
Goodwin, S., McPherson, J. D., and McCombie, W. R. (2016). Coming of age: ten years of next-generation sequencing technologies. Nat. Rev. Genet. 17, 333–351. doi: 10.1038/nrg.2016.49
Greve, M., Lykke, A. M., Fagg, C. W., Gereau, R. E., Lewis, G. P., Marchant, R., et al. (2016). Realising the potential of herbarium records for conservation biology. S. Afr. J. Bot. 105, 317–323. doi: 10.1016/j.sajb.2016.03.017
Grube, M., Berg, G., Andrésson, Ó. S., Vilhelmsson, O., Dyer, P. S., and Miao, V. P. (2014). “Lichen genomics: prospects and progress,” in The Ecological Genomics of Fungi, ed F. Martin (Chichester: John Wiley & Sons, Inc.), 191–212.
Gutaker, R. M., Reiter, E., Furtwängler, A., Schuenemann, V. J., and Burbano, H. A. (2017). Extraction of ultrashort DNA molecules from herbarium specimens. BioTechniques 62, 76–79. doi: 10.2144/000114517
Hajibabaei, M., Singer, G. A. C., Hebert, P. D. N., and Hickey, D. A. (2007). DNA barcoding: how it complements taxonomy, molecular phylogenetics and population genetics. Trends Genet. 23, 167–172. doi: 10.1016/j.tig.2007.02.001
Hebert, P. D. N., Cywinska, A., Ball, S. L., and deWaard, J. R. (2003). Biological identifications through DNA barcodes. Proc. Roy. Soc. Lond. Ser. B Biol. Sci. 270, 313–321. doi: 10.1098/rspb.2002.2218
Hidalgo, O., Pellicer, J., Christenhusz, M., Schneider, H., Leitch, A. R., and Leitch, I. J. (2017). Is there an upper limit to genome size? Trends Plant Sci. 22, 567–573. doi: 10.1016/j.tplants.2017.04.005
Hoffman, J. R., and Lendemer, J. C. (2018). A meta-analysis of trends in the application of Sanger and next-generation sequencing data in lichenology. Bryologist 121, 133–147. doi: 10.1639/0007-2745-121.2.133
Holmes, M. W., Hammond, T. T., Wogan, G. O. U., Walsh, R. E., LaBarbera, K., Wommack, E. A., et al. (2016). Natural history collections as windows on evolutionary processes. Mol. Ecol. 25, 864–881. doi: 10.1111/mec.13529
James, S. A., Soltis, P. S., Belbin, L., Chapman, A. D., Nelson, G., Paul, D. L., et al. (2018). Herbarium data: global biodiversity and societal botanical needs for novel research. Appl. Plant Sci. 6, 1–8. doi: 10.1002/aps3.1024
Jankowiak, K., Buczkowska, K., and Szweykowska-Kulinska, Z. (2005). Successful extraction of DNA from 100-year-old herbarium specimens of the liverwort Bazzania trilobata. Taxon 54, 335–336. doi: 10.2307/25065361
Kearse, M., Moir, R., Wilson, A., Stones-Havas, S., Cheung, M., Sturrock, S., et al. (2012). Geneious Basic: an integrated and extendable desktop software platform for the organization and analysis of sequence data. Bioinformatics 28, 1647–1649. doi: 10.1093/bioinformatics/bts199
Kistenich, S., Timdal, E., Bendiksby, M., and Ekman, S. (2018). Molecular systematics and character evolution in the lichen family Ramalinaceae (Lecanorales, Ascomycota). Taxon 67, 871–904. doi: 10.12705/675.1
Kress, W. J., García-Robledo, C., Uriarte, M., and Erickson, D. L. (2015). DNA barcodes for ecology, evolution, and conservation. Trends Ecol. Evol. 30, 25–35. doi: 10.1016/j.tree.2014.10.008
Lander, T. A., Dadonaite, B., and Monro, A. K. (2013). Microwave drying of plant material for herbarium specimens and genetic analysis. Taxon 62, 790–797. doi: 10.12705/624.33
Larsson, E., and Jacobsson, S. (2004). Controversy over Hygrophorus cossus settled using ITS sequence data from 200 year-old type material. Mycol. Res. 108, 781–786. doi: 10.1017/S0953756204000310
Lavoie, C. (2013). Biological collections in an ever changing world: herbaria as tools for biogeographical and environmental studies. Perspect. Plant Ecol. Evol. Syst. 15, 68–76. doi: 10.1016/j.ppees.2012.10.002
Leavitt, S. D., Divakar, P. K., Ohmura, Y., Wang, L.-S., Esslinger, T. L., and Lumbsch, H. T. (2015). Who's getting around? Assessing species diversity and phylogeography in the widely distributed lichen-forming fungal genus Montanelia (Parmeliaceae, Ascomycota). Mol. Phylogenet. Evol. 90, 85–96. doi: 10.1016/j.ympev.2015.04.029
Leavitt, S. D., Fernández-Mendoza, F., Pérez-Ortega, S., Sohrabi, M., Divakar, P. K., Lumbsch, T., et al. (2013). DNA barcode identification of lichen-forming fungal species in the Rhizoplaca melanophthalma species-complex (Lecanorales, Lecanoraceae), including five new species. MycoKeys 7, 1–22. doi: 10.3897/mycokeys.7.4508
Legendre, P., and Legendre, L. (eds.). (2012). “Complex ecological data sets,” in Developments in Environmental Modelling (Oxford, UK: Elsevier), 1–57.
Loman, N. J., Misra, R. V., Dallman, T. J., Constantinidou, C., Gharbia, S. E., Wain, J., et al. (2012). Performance comparison of benchtop high-throughput sequencing platforms. Nat. Biotechnol. 30, 434–439. doi: 10.1038/nbt.2198
Lumbsch, H. T., and Leavitt, S. D. (2011). Goodbye morphology? A paradigm shift in the delimitation of species in lichenized fungi. Fungal Divers. 50, 59–72. doi: 10.1007/s13225-011-0123-z
Mark, K., Cornejo, C., Keller, C., Flück, D., and Scheidegger, C. (2016). Barcoding lichen-forming fungi using 454 pyrosequencing is challenged by artifactual and biological sequence variation. Genome 59, 685–704. doi: 10.1139/gen-2015-0189
McCullagh, P., and Nelder, J. A. (1989). Generalized Linear Models. London: Chapman & Hall/CRC Press.
Meineke, E. K., Davis, C. C., and Davies, T. J. (2018). The unrealized potential of herbaria for global change biology. Ecol. Monogr. 88, 505–525. doi: 10.1002/ecm.1307
Oksanen, J., Blanchet, F. G., Friendly, M., Kindt, R., Legendre, P., McGlinn, D., et al. (2016). vegan: Community Ecology Package Version 2.4-6—The R Foundation for Statistical Computing. Available online at: http://cran.r-project.org
Pearson, K. (1901). On lines and planes of closest fit to systems of points in space. Lond. Edinburgh Dublin Philos. Mag. J. Sci. 2, 559–572. doi: 10.1080/14786440109462720
Pogoda, C. S., Keepers, K. G., Lendemer, J. C., Kane, N. C., and Tripp, E. A. (2018). Reductions in complexity of mitochondrial genomes in lichen-forming fungi shed light on genome architecture of obligate symbioses. Mol. Ecol. 27, 1155–1169. doi: 10.1111/mec.14519
Prosser, S. W., deWaard, J. R., Miller, S. E., and Hebert, P. D. (2016). DNA barcodes from century-old type specimens using next-generation sequencing. Mol. Ecol. Resources 16, 487–497. doi: 10.1111/1755-0998.12474
Quail, M. A., Smith, M., Coupland, P., Otto, T. D., Harris, S. R., Connor, T. R., et al. (2012). A tale of three next generation sequencing platforms: comparison of Ion Torrent, Pacific Biosciences and Illumina MiSeq sequencers. BMC Genomics 13:341. doi: 10.1186/1471-2164-13-341
R Development Core Team. (2018). R: A Language and Environment for Statistical Computing. Vienna: R Foundation for Statistical Computing. Available online at: http://cran.r-project.org
Ratnasingham, S., and Hebert, P. D. (2007). BOLD: The Barcode of Life Data System (http://www.barcodinglife.org). Mol. Ecol. Notes 7, 355–364. doi: 10.1111/j.1471-8286.2007.01678.x
Rivarola, M., Foster, J. T., Chan, A. P., Williams, A. L., Rice, D. W., Liu, X., et al. (2011). Castor bean organelle genome sequencing and worldwide genetic diversity analysis. PLoS ONE 6:e21743. doi: 10.1371/journal.pone.0021743
Rohland, N., and Hofreiter, M. (2007). Comparison and optimization of ancient DNA extraction. BioTechniques 42, 343–352. doi: 10.2144/000112383
Särkinen, T., Staats, M., Richardson, J. E., Cowan, R. S., and Bakker, F. T. (2012). How to open the treasure chest? Optimising DNA extraction from herbarium specimens. PLoS ONE 7:e43808. doi: 10.1371/journal.pone.0043808
Seifert, K. A. (2009). Progress towards DNA barcoding of fungi. Mol. Ecol. Resources 9, 83–89. doi: 10.1111/j.1755-0998.2009.02635.x
Shepherd, L. D. (2017). A non-destructive DNA sampling technique for herbarium specimens. PLoS ONE 12:e0183555. doi: 10.1371/journal.pone.0183555
Slepecky, R. A., and Starmer, W. T. (2009). Phenotypic plasticity in fungi: a review with observations on Aureobasidium pullulans. Mycologia 101, 823–832. doi: 10.3852/08-197
Sohrabi, M., Myllys, L., and Stenroos, S. (2010). Successful DNA sequencing of a 75 year-old herbarium specimen of Aspicilia aschabadensis (J. Steiner) Mereschk. Lichenologist 42, 626–628. doi: 10.1017/S0024282910000344
Soltis, D. E., and Soltis, P. S. (2016). Mobilizing and integrating big data in studies of spatial and phylogenetic patterns of biodiversity. Plant Divers. 38, 264–270. doi: 10.1016/j.pld.2016.12.001
Spribille, T., Tuovinen, V., Resl, P., Vanderpool, D., Wolinski, H., Aime, M. C., et al. (2016). Basidiomycete yeasts in the cortex of ascomycete macrolichens. Science 353, 488–492. doi: 10.1126/science.aaf8287
Staats, M., Cuenca, A., Richardson, J. E., Vrielink-van Ginkel, R., Petersen, G., Seberg, O., et al. (2011). DNA damage in plant herbarium tissue. PLoS ONE 6:e28448. doi: 10.1371/journal.pone.0028448
Staats, M., Erkens, R. H. J., van de Vossenberg, B., Wieringa, J. J., Kraaijeveld, K., Stielow, B., et al. (2013). Genomic treasure troves: complete genome sequencing of herbarium and insect museum specimens. PLoS ONE 8:e69189. doi: 10.1371/journal.pone.0069189
Struck, T. H., Feder, J. L., Bendiksby, M., Birkeland, S., Cerca, J., Gusarov, V. I., et al. (2018). Finding evolutionary processes hidden in cryptic species. Trends Ecol. Evol. 33, 153–163. doi: 10.1016/j.tree.2017.11.007
Suzuki, M., Segawa, T., Mori, H., Akiyoshi, A., Ootsuki, R., Kurihara, A., et al. (2016). Next-generation sequencing of an 88-year-old specimen of the poorly known species Liagora japonica (Nemaliales, Rhodophyta) supports the recognition of Otohimella gen. nov. PLoS ONE 11:e0158944. doi: 10.1371/journal.pone.0158944
Taylor, J. W., and Swann, E. C. (1994). “DNA from herbarium specimens,” in Ancient DNA: Recovery and Analysis of Genetic Material from Paleontological, Archaeological, Museum, Medical, and Forensic Specimens, eds B. Herrmann and S. Hummel (New York, NY: Springer), 166–181.
Telle, S., and Thines, M. (2008). Amplification of cox2 (~620 bp) from 2 mg of up to 129 years old herbarium specimens, comparing 19 extraction methods and 15 polymerases. PLoS ONE 3:e3584. doi: 10.1371/journal.pone.0003584
Untergasser, A., Cutcutache, I., Koressaar, T., Ye, J., Faircloth, B. C., Remm, M., et al. (2012). Primer3—new capabilities and interfaces. Nucleic Acids Res. 40:e115. doi: 10.1093/nar/gks596
Van Kan, J. A. L., Stassen, J. H. M., Mosbach, A., Van Der Lee, T. A. J., Faino, L., Farmer, A. D., et al. (2017). A gapless genome sequence of the fungus Botrytis cinerea. Mol. Plant Pathol. 18, 75–89. doi: 10.1111/mpp.12384
Weiß, C. L., Schuenemann, V. J., Devos, J., Shirsekar, G., Reiter, E., Gould, B. A., et al. (2016). Temporal patterns of damage and decay kinetics of DNA retrieved from plant herbarium specimens. Roy. Soc. Open Sci. 3, 1–12. doi: 10.1098/rsos.160239
Werth, S., Reynisdóttir, S., Gudmundsson, H., and Andrésson, Ó. S. (2016). A fast and inexpensive high-throughput protocol for isolating high molecular weight genomic DNA from lichens. Herzogia 29, 610–616. doi: 10.13158/heia.29.2.2016.610
Willis, C. G., Ellwood, E. R., Primack, R. B., Davis, C. C., Pearson, K. D., Gallinat, A. S., et al. (2017). Old plants, new tricks: phenological research using herbarium specimens. Trends Ecol. Evol. 32, 531–546. doi: 10.1016/j.tree.2017.03.015
Zedane, L., Hong-Wa, C., Murienne, J., Jeziorski, C., Baldwin, B. G., and Besnard, G. (2016). Museomics illuminate the history of an extinct, paleoendemic plant lineage (Hesperelaea, Oleaceae) known from an 1875 collection from Guadalupe Island, Mexico. Biol. J. Linnean Soc. 117, 44–57. doi: 10.1111/bij.12509
Zhao, X., Fernández-Brime, S., Wedin, M., Locke, M., Leavitt, S. D., and Lumbsch, H. T. (2017). Using multi-locus sequence data for addressing species boundaries in commonly accepted lichen-forming fungal species. Organ. Divers. Evol. 17, 351–363. doi: 10.1007/s13127-016-0320-4
Keywords: museomics, herbarium genomics, Ion Torrent, mtSSU, lichens, natural history collections
Citation: Kistenich S, Halvorsen R, Schrøder-Nielsen A, Thorbek L, Timdal E and Bendiksby M (2019) DNA Sequencing Historical Lichen Specimens. Front. Ecol. Evol. 7:5. doi: 10.3389/fevo.2019.00005
Received: 06 September 2018; Accepted: 08 January 2019;
Published: 23 January 2019.
Edited by:
Freek T. Bakker, Wageningen University & Research, NetherlandsReviewed by:
Henrik R. Nilsson, University of Gothenburg, SwedenCarla Santos, Centro de Engenharia Biológica, Universidade do Minho, Portugal
Copyright © 2019 Kistenich, Halvorsen, Schrøder-Nielsen, Thorbek, Timdal and Bendiksby. This is an open-access article distributed under the terms of the Creative Commons Attribution License (CC BY). The use, distribution or reproduction in other forums is permitted, provided the original author(s) and the copyright owner(s) are credited and that the original publication in this journal is cited, in accordance with accepted academic practice. No use, distribution or reproduction is permitted which does not comply with these terms.
*Correspondence: Sonja Kistenich, c29uamEua2lzdGVuaWNoQGdtYWlsLmNvbQ==
†These authors have contributed equally to this work