- 1Biological Sciences, Ohio University, Athens, OH, United States
- 2Sustainability Studies Theme, Ohio University, Athens, OH, United States
- 3Centre for Environmental Research (CCMESI), University of Bucharest, Bucharest, Romania
Carnivores act as top-down regulators in terrestrial ecosystems, and their occurrence and relative abundance is a result of complex interactions between food and habitat availability, human pressure (e.g., trapping, hunting, roadkill), and intraguild interactions (competition, predation). Eastern United States has a long history of human impact, which resulted in an altered carnivore community. Specifically, Ohio presents an interesting case for evaluating the relative roles of interspecific relations and habitat characteristics for shaping the carnivore community, as its carnivore community has a unique dynamics and composition: invasive coyote and red fox (Vulpes vulpes), and native bobcat (Lynx rufus), currently recovering and expanding its range, gray fox (Urocyon cinereoargenteus) declining at a fast pace, and the generalist raccoon (Procyon lotor) and Virginian opossum (Didelphis virginiana). We used 50 camera traps to collect presence/absence data in southeastern Ohio, USA. We hypothesized potential interactions between the six carnivores, and used land cover variables, as well as occupancy probabilities of interacting species, to parameterize to single-species occupancy models. We found that landscape composition at three different scales (500 and 1000 m buffer around camera locations, and 3 × 3 km grid cell) had little effect on species occurrence. We identified strong negative interspecific relations between carnivores, with bobcat occurrence being influenced by presence of coyotes, red fox occurrence by gray foxes, and raccoon occurrence by Virginia possums. While these findings cannot discriminate between habitat partitioning (spatial or temporal) and competition (direct or interference), they lend support to complex dynamics between invasive coyotes and red foxes and recovering (bobcat) and declining (gray fox) native carnivore species. In particular, the negative relation between the apex predator in our system, C. latrans, and L. rufus, raise further questions on whether direct competition from coyotes has the potential to slow bobcat population recovery. In the context of regulated trapping (ongoing for gray fox and potential season for bobcat), a better understanding of the carnivore intraguild relations can inform management and conservation actions targeted at minimizing the impact of competition on at-risk native species from non-native species.
Introduction
Biodiversity is declining at a rapid pace in the new Anthropocene epoch, and Earth is witnessing a sixth mass extinction (Ceballos et al., 2015). Defaunation, loss of wildlife from both pristine and disturbed landscapes, is a widespread global phenomenon (Dirzo et al., 2014), and significant efforts and financial resources are put into recovery and restoration measures. Specifically, many of the world's terrestrial carnivores are declining, and the reduction in abundance or the local extinction of key carnivore species can have devastating ecosystem level effects (Ripple et al., 2014). Carnivores are important top-down regulators of ecological communities, and changes in abundance or occurrence of apex predators may trigger trophic cascades (Levi and Wilmers, 2012; Ripple and Beschta, 2012; Colman et al., 2014). As such, the recovery of apex predators as a conservation tool to restore ecosystem functions requires not only an understanding of their direct ecological functions (top-down control, mesocarnivore suppression), but also addressing the broader ecological community context, climate conditions, and sources of anthropogenic impact that shape terrestrial landscapes (Elmhagen and Rushton, 2007; Ritchie and Johnson, 2009).
In this context, community ecology approaches are effective for understanding the ecological impacts of loss or recovery of apex predators, and help guide conservation actions (Chapron and López-Bao, 2016). While the recovery of apex predators sometimes require intact landscapes, devoid of human impact (Gilroy et al., 2015), the spectacular comeback of apex predators in Europe shows that carnivores can thrive in highly-modified landscapes, and effectively coexist with humans (Chapron et al., 2014; López-Bao et al., 2015; Chapron and López-Bao, 2016). Thus, to be effective, community ecology approaches (e.g., trophic relations, interspecific interactions) must be expanded to integrate the human factor (Dorresteijn et al., 2015; Chapron and López-Bao, 2016). The recovery of predators after decades or centuries of absence also raise critical questions about their impacts on the existing, depauperate carnivore guild, largely dominated by mesopredators (Elmhagen and Rushton, 2007; Cervinka et al., 2011).
Terrestrial carnivore guilds are structured by differential space use and habitat relations, as well as by strong interspecific exploitative and interference relations (Linnell and Strand, 2000; Pasanen-Mortensen et al., 2013; Gompper et al., 2016). These forms of competition may be elucidated by examining habitat partitioning both spatially and temporally (Schuette et al., 2013). In addition, interspecific killing can also be seen between many carnivores, and is a form of interference competition (Palomares et al., 1999; Arim and Marquet, 2004). Conceptually, understanding the impacts of carnivore recovery through a trophic ecology lens has been cast as “trophic rewilding” (Svenning et al., 2016), as a more concrete way to evaluate the responses of resident species and ecosystems. However, there are significant gaps in our understanding of whether restoring predators is sufficient to trigger trophic cascades (Newsome and Ripple, 2015), and whether human impacts (e.g., hunting, poaching) can hinder these conservation efforts by influencing their ecological role (Liberg et al., 2012; Ordiz et al., 2013). As such, there is a critical need to understand such interactions in human-dominated landscapes that harbor viable carnivore populations, and witness carnivore recoveries.
One such region, where carnivore intraguild relations can shed light on the potential for species recoveries and declines is Ohio. The carnivore species in Ohio are at the focus of intensive management efforts through regulated trapping and hunting (wildlife.ohiodnr.gov). This jurisdiction is witnessing both current declines and recoveries of its terrestrial carnivore species, thus investigating intraguild relations can answer critical questions about the relative importance of habitat and interspecific relations influencing the recovery and decline rates. Over a century ago, several carnivore species have been extirpated from Ohio, including black bears (Ursus americanus), wolves (Canis lupus), fishers (Pekania pennanti), and bobcats (Lynx rufus). Bobcats disappeared from the state in the mid-Nineteenth century, but they have been reclaiming their former range in Ohio in the last 4–5 decades; bobcats have established a self-sustaining population from founder animals originating from West Virginia, Kentucky, and Pennsylvania (Anderson et al., 2015). At the same time, another native species, the gray fox (Urocyon cinereoargenteus), has been declining in Ohio in recent years, likely due to disease (S. Prange, pers. comm.). Two other common cosmopolitan mesocarnivores, the Virginian possum (Didelphis virginiana) and raccoon (Procyon lotor) have large populations in Ohio. In addition, two non-native carnivore species, the coyote (Canis latrans) and red fox (Vulpes vulpes) have viable populations in Ohio (although there is evidence that the red fox population is declining), and their impacts on native declining species (i.e., gray fox) and recovering (i.e., bobcats) is unknown. As such, given this complex situation, understanding the structure and functioning of the predator guild can inform decisions for the wildlife management and conservation.
Data on terrestrial carnivore species is often hard to collect, because of their cryptic behavior (Pfenninger and Schwenk, 2007). Non-invasive methods such as scat collection, track plates, camera traps, and snow tracks have been used to evaluate carnivore occurrence and abundance. Baited camera traps are a relatively cost-effective method for collecting carnivore data, but in our system, the photo recordings do not yield individually identifiable animals; thus, all inferences rely on unmarked individuals. Baiting with specific or general attractant lures increases visitation rates at the trap site, which increases the number of animals and species identified at a given site (Gompper et al., 2006). Presence/absence of species inferred from camera trap data lends itself to data analyses including understanding the relations between co-occurring species (Sollmann et al., 2013), predicting wildlife-habitat relationships, evaluating anthropogenic effects on animal distribution and population size (Cove et al., 2012), and evaluating community composition (Schuette et al., 2013).
The goal of this study is to understand the composition and distribution of the carnivore community in southeastern Ohio, and the relative importance of habitat and intraguild interactions for shaping the carnivore community. Specifically, we are evaluating the relative contribution of habitat characteristics at multiple spatial scales and the strength of intraguild relations, for determining patterns of carnivore occurrence in southeastern Ohio. For this, we used a camera trap array to gather presence/absence data to inform single-season, single-species occupancy models (MacKenzie et al., 2002) for individual carnivore species. We first estimated probabilities of occurrence for a given species based on habitat data. Post-hoc, we included probability of occupancy for co-occurring species as a covariate in models for individual species to understand interspecific relations based on hypothesized and known species interactions and ecology (Gompper et al., 2016). For example, the occupancy of D. virginiana is not likely to have an effect on the occupancy of C. latrans, and therefore, D. virginiana occupancy was not included in the model set for C. latrans (Gompper et al., 2016). We hypothesized that there is (1) a negative effect of coyotes (the apex predator in our system) on all other carnivore species, especially bobcats (i.e., Thornton et al., 2004; Gehrt and Prange, 2007), (2) a negative effect of gray foxes on red foxes and vice-versa, and (3) no effect of raccoons and Virginia possums on any of the other members of the carnivore guild. We were specifically interested on the effects of non-native species (coyote and red fox) on the recovering native bobcat, and the declining native gray fox. Thus, we effectively evaluated the relative importance of interspecific relations and habitat data in shaping the current carnivore community, and we focused on the interplay between native and non-native species, especially in the context of current bobcat recovery and gray fox declines in Ohio. The information provided by our work has the potential to inform the management and conservation of terrestrial carnivores in Ohio, by providing baseline ecological data for management decisions that ensure population viability, as well as identifying species interactions and habitat relations between native and non-native carnivores.
Materials & Methods
Study Site
Our camera sites were contained within the Athens portion of the Wayne National Forest and Zaleski State Forests in southeastern Ohio. The Wayne National Forest was established in 1934 by a special law passed in the state that allowed the federal government to purchase land for the creation of a national forest. As early American settlers began to move west of the Appalachians and began to settle in Ohio, the land was heavily logged, mined, and farmed. It was reforested by the Civilian Conservation Corps (CCC) under President Franklin Delano Roosevelt (www.fs.fed.us). Zaleski State forest is the state's second largest owned forest and was established in 1928. The land was reforested after having been heavily mined and logged (forestry.ohiodnr.gov). While both forests are relatively young, they have established communities of previously extirpated species, such as L. rufus.
Data Collection
Data collection began mid-May 2016 and ended on July 27, 2016. Our first step was to place a 2 × 2 km grid over the study area in ArcGIS (ESRI, Redlands CA) to identify potential sites for camera placement, with one camera to be placed per grid cell (Figures 1, 2). The 2 × 2 km grid was chosen because it allowed the cameras to be placed far enough away from each other to reduce the potential of overlapping data, but close enough to each other to be easily accessible. We placed a total of 50 camera traps (Moultrie M-999i, PRADCO Outdoor Brands, Calera AL), and the location of each camera within a given grid cell was based on ease of access; we attempted to place cameras as close to the center of the grid cell as possible, equidistant to other cameras; we did not place cameras along roads or trails. Cameras were secured to trees ~1 m above ground, facing another tree, 2–4 m away, on which we rubbed an attractant lure (Caven's Gusto, Minnesota Trapline Products Inc., Pennock, MN) This baiting method has been used to camera trap carnivores successfully by several other studies (Gompper et al., 2006; Popescu et al., 2014). Cameras were checked every 10–14 days to download the pictures, replace the batteries, and refresh the lure.
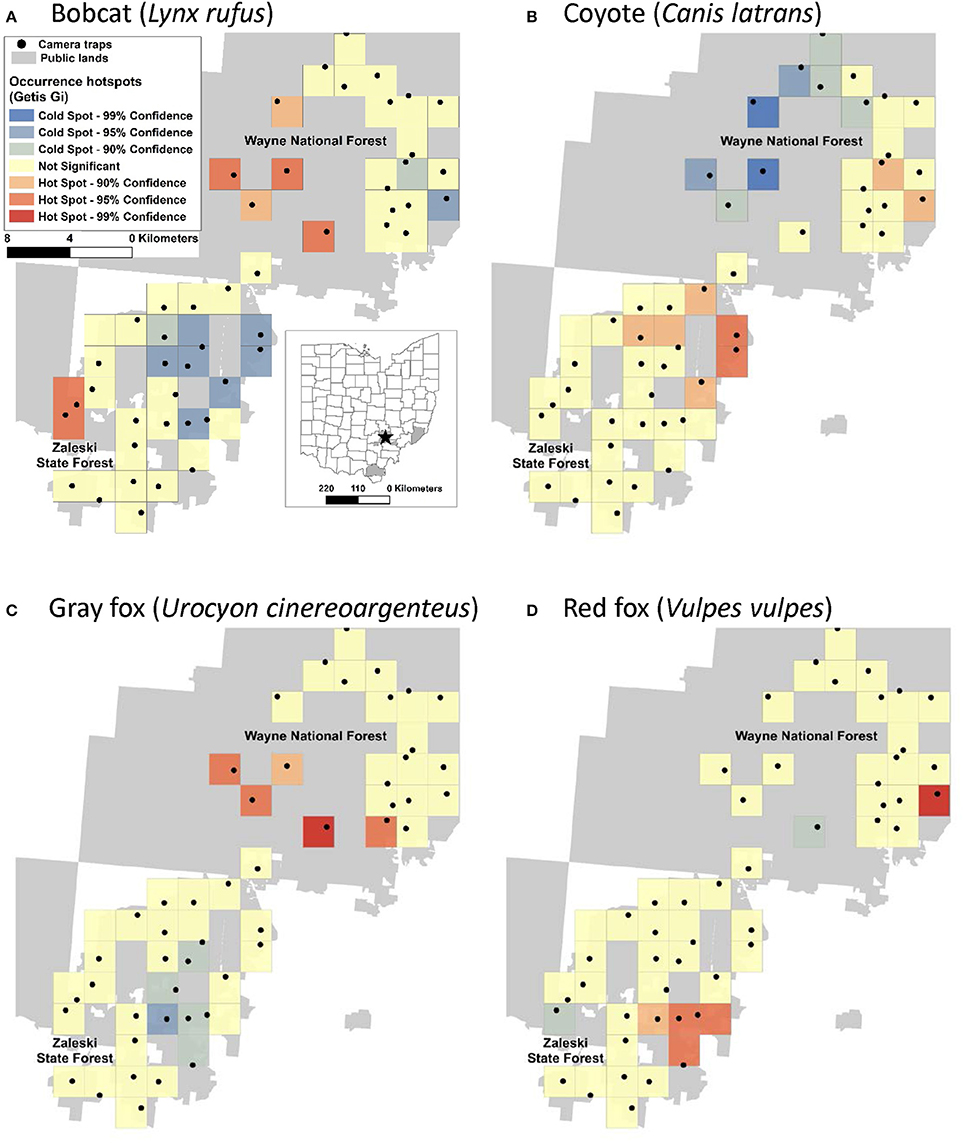
Figure 1. Hotspots of occurrence of two native predators, bobcat (A) and gray fox (C), and two non-native predators, coyote (B), and red fox (D) in the Wayne National Forest (Athens Unit) and Zaleski State Forest in SE Ohio. The black dots denote camera trap locations within the 2 × 2 km grid cells.
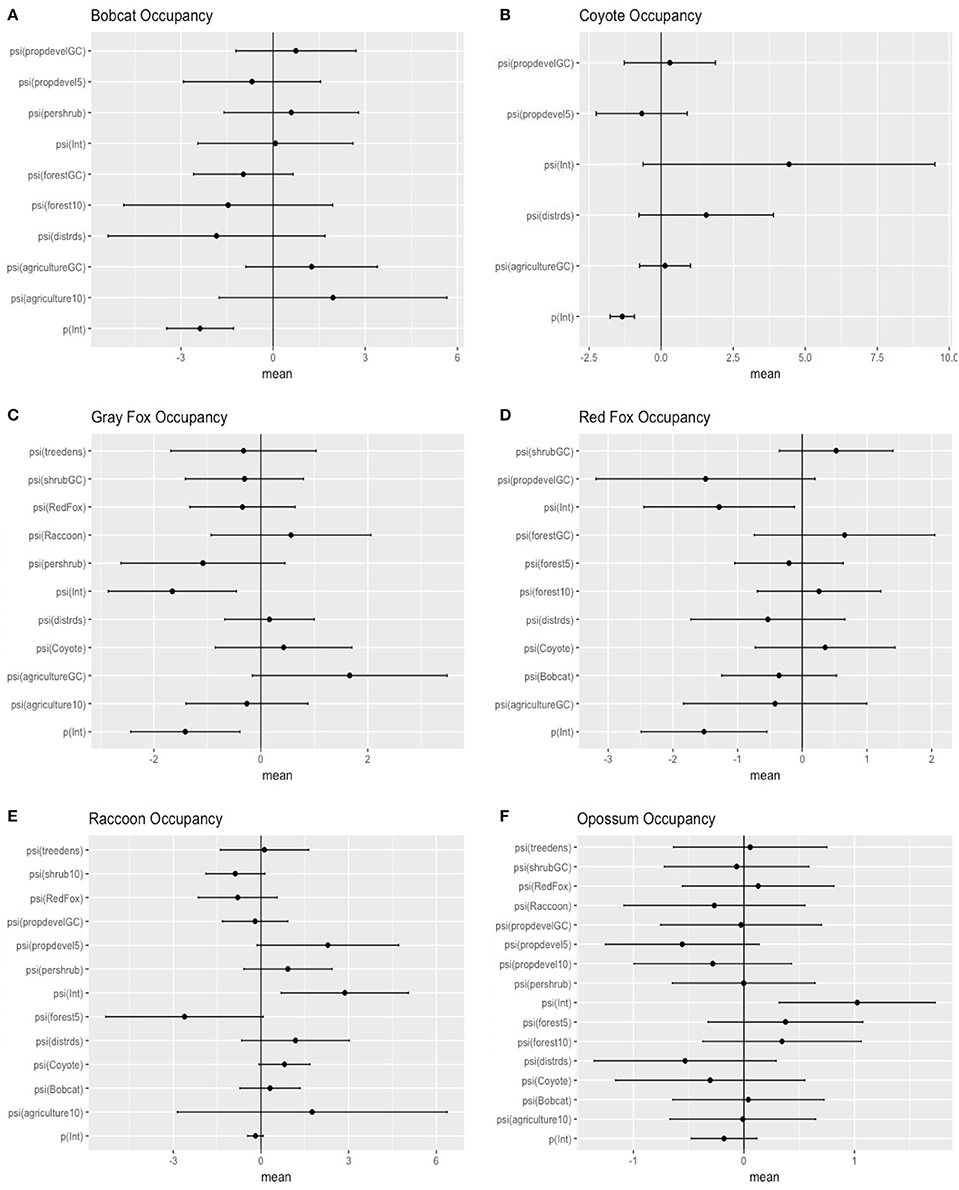
Figure 2. Model-averaged standardized predictors for occupancy of six carnivore species in southeastern Ohio. Distrds, distance of camera from roads; Treedens, the number of trees within a 10 m buffer around the camera; Pershrub, proportion shrub within 10 m radius of camera; ShrubGC, proportion shrub within a grid cell; Agriculture10, proportion of agriculturally developed land within a 1,000 m buffer around the camera; Forest10, proportion of a 1,000 m buffer around the camera that is forested; Forest5, proportion of a 500 m buffer around the camera that is forested; PropdevelGC, proportion developed lands within a grid cell; Propdevel10, proportion developed lands within a 1,000 m buffer around the camera; Propdevel5, proportion developed lands within a 500 m buffer around the camera; Bobcat, probability of occupancy for L. rufus in each grid cell; Coyote, probability of occupancy for C. latrans in each grid cell; RedFox, probability of occupancy for V. vulpes in each grid cell; Raccoon, probability of occupancy for P. lotor in each grid cell (A = bobcat; B = coyote; C = gray fox; D = red fox ; E = raccoon; F = opposum).
We collected habitat data at four different scales: 10 m radius around the camera, 500 m radius around the camera, 1,000 m radius around the camera, and within the 2 × 2 km grid cell. At the 10 m scale, we measured slope, exposure, number of trees, percent canopy cover, dominant tree species, percent mature trees, percent saplings, percent shrubs, percent herbaceous species, percent rocky outcrop, and average tree circumference (Supplementary Material). We also extracted data such as distance to nearest roads. For the broader spatial scales (500 m buffer, 1,000 m buffer, and grid cell), data was extracted from the National Land Cover Database 2011 (Supplementary Material; Homer et al., 2004) using Geographic Information Systems. Variables examined at each scale included percent agriculture, urban development, forest, and shrub cover (Supplementary Material).
Data Analysis
We implemented single-season occupancy models (MacKenzie et al., 2002) to predict occurrence of individual species using package unmarked (Fiske and Chandler, 2011) in program R 3.4.1 (R Core Team, 2017). We first divided the study period in 5 sampling windows to create histories of detection/non-detection for each species at each cameras trap location; we did not take the number of images or number of returns to a camera trap locations within a given sampling window into consideration, and presence was recorded if a species was detected at least once at a camera. The sampling windows were ~10 days each, matching the camera revisit schedule, a common practice in camera trap studies (Burton et al., 2015); as such, each camera had slightly different sampling periods, but we included time of year (Julian Day) and number of days cameras were functioning (controlling for short periods when cameras were not active; e.g., cameras out of battery or stolen) as covariates for modeling detection probabilities to account for such discrepancies. We also used precipitation over each of the sampling windows, as well as time of day as covariates for detection (data collected from the Athens OH weather station).
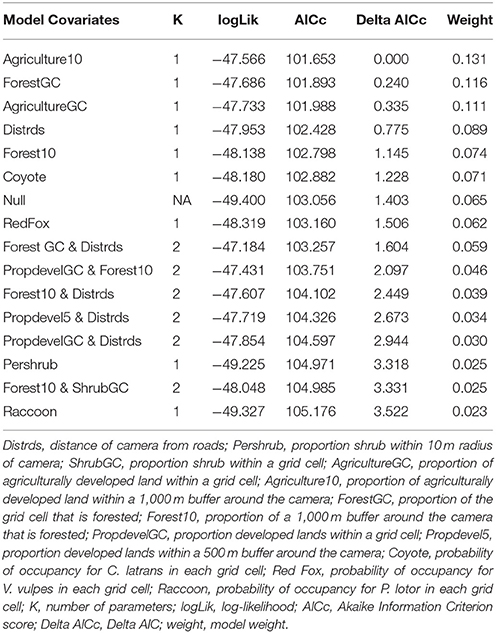
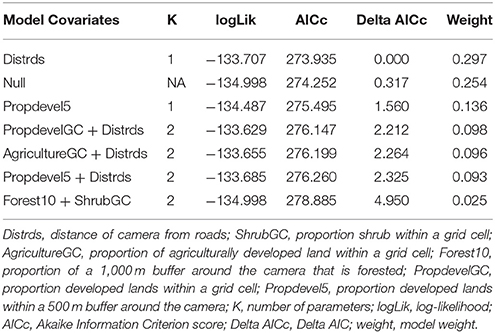
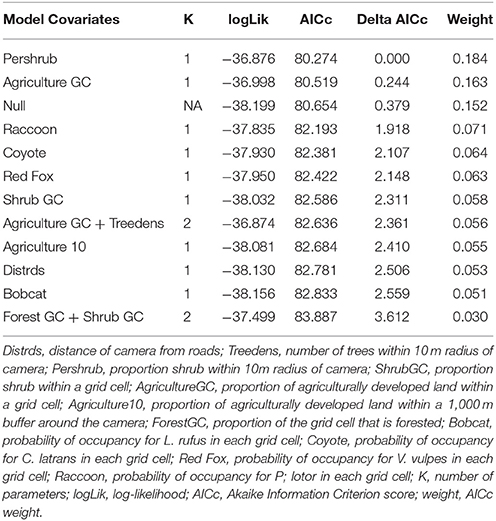
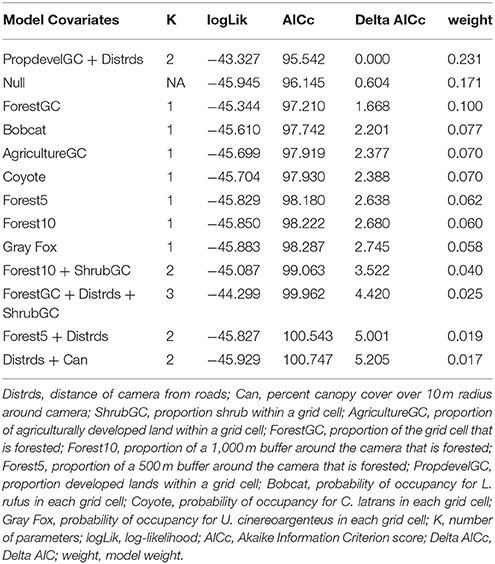
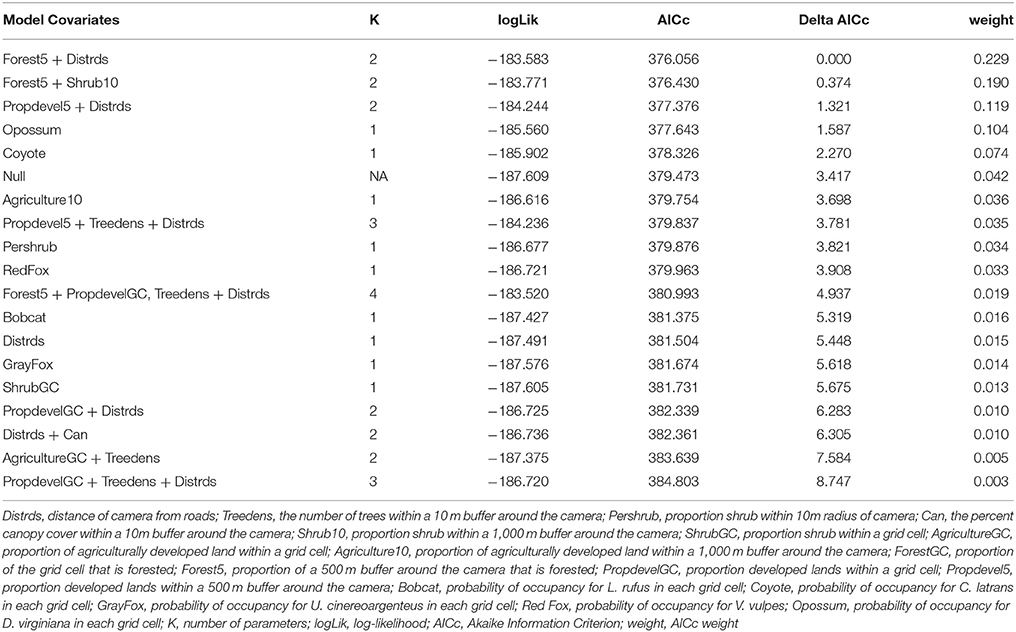
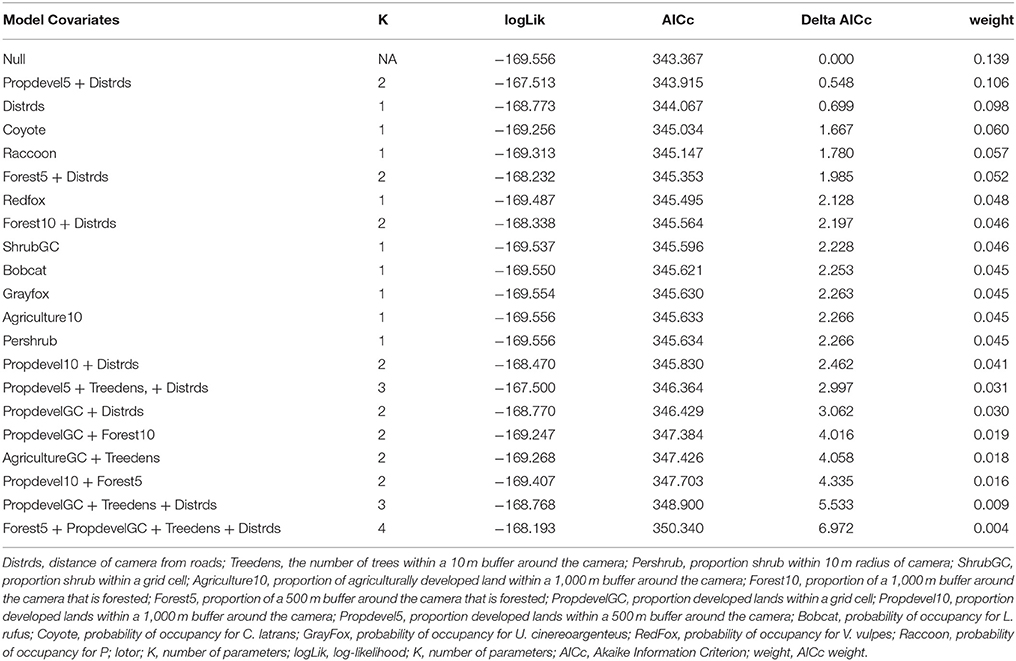
We first build detection models using a full model for occupancy in order to identify the best predictors for detection. We then used the covariates collected at the four different scales to develop a suite of candidate models. We examined the variables for correlation, and eliminated variables with a Pearson correlation coefficient r > 0.7, or we did not use them in the same model. First, each discreet habitat scale was modeled for the species, including combinations of variables that were chosen based on the knowledge of the species. For example, C. latrans are known to travel along roads; thus, distance from roads was included in several site-level models (Grubbs and Krausman, 2009). Because our data was sparse for some species, the models contained a maximum of three variables for explaining occupancy. All covariates were scaled to allow direct comparison. After building models specific to each habitat scale, we created models that included covariates from several scales, as well as the probability of occupancy for co-occurring species as a covariate in models for individual species to understand interspecific interactions based on hypothesized and known species interactions and ecology, and developed a final set of candidate models for each species (Tables 2–7). We used a model selection framework to rank our candidate models using the Akaike Information Criterion corrected for small sample size AICc (Burnham and Anderson, 2002), and an averaging procedure to estimate probabilities of detection and occupancy of each species based on a set of models with cumulative AICc weight = 0.95.
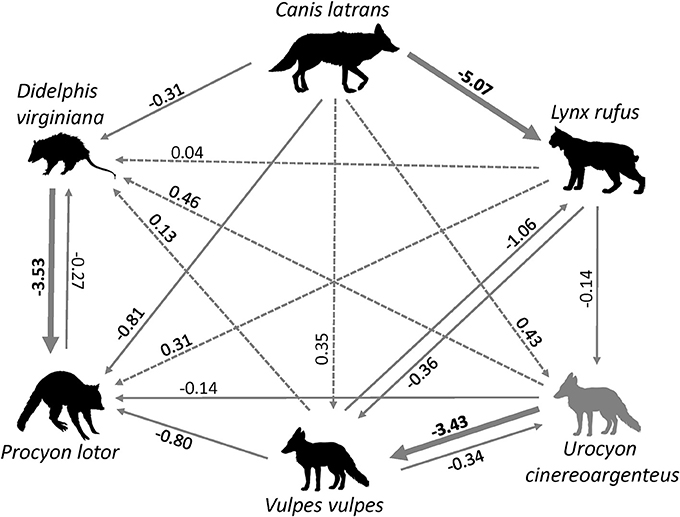
Figure 3. Interspecific relations between six carnivore species in Ohio inferred from occupancy models, with the direction of the arrow showing the direction of the effect. Solid arrows indicate negative relations, dotted arrows indicate positive relations. Bold lines and coefficients indicate statistically significance. (source of carnivore drawings: www.supercoloring.com/silhouettes).
C. latrans Occupancy
The probability of site occupancy for C. latrans in our study was the highest among all species considered here (occupancy (psi) = 0.892 ± 0.002; Table 1). The model containing the variable distance from roads had the most support, with roads positively influencing the presence of this species. Interestingly, the proportion of development within a 500 m buffer around the camera also positively influenced C. latrans (Figure 2B, Table 3). Models for C. latrans did not include the effects of other species because literature evidence suggests that as the top predator in this environment, they likely do not experience effects of competition from other carnivores in this system.
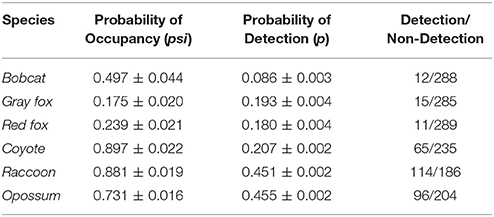
Table 1. Probability of occupancy and detection, and the number of detections/non-detections by species.
U. cinereoargenteus Occupancy
The probability of site occupancy for U. cinereoargenteus in our study area was low (psi = 0.175 ± 0.020; Table 1). The top model included the percent shrub within a 10 m buffer around the camera, which negatively influenced U. cinereoargenteus occupancy (Figure 2C, Table 4). However, this model did not differ from subsequent models that included the model containing percent agriculture within the grid cell, which positively influenced U. cinereoargenteus occupancy, and the null model. Interestingly, V. vulpes had a low negative effect on U. cinereoargenteus occurrence (standardized coefficient = −0.344). We expected C. latrans to negatively influence the occurrence of U. cinereoargenteus, but this relation were not strong (Figure 3).
V. vulpes Occupancy
The probability of occupancy for V. vulpes was slightly higher than for U. cinereoargenteus (psi = 0.239 ± 0.021; Table 1). The top model included the proportion of developed land within the grid cell, and the distance of the camera from the road, both of which negatively influenced V. vulpes occupancy (Figure 2D, Table 5). We also found that the proportion of forest in the grid cell was positively associated with V. vulpes occupancy. Notably, U. cinereoargenteus occurrence had a negative effect on the presence of V. vulpes, which was 10 times higher than the reciprocal effect (standardized coefficient = −3.426, compared to −0.344) (Figure 3).
P. lotor Occupancy
The probability of occupancy (psi) for P. lotor was 0.881 ± 0.019 (Table 1). None of the covariates introduced in our study to explain variability were found to be significant (Figure 2E), but our top model included the percentage of forest within a 500-m buffer around the camera (negative effect), as well as the distance of the camera from the road (positive effect) (Table 6). However, we found a negative effect of D. virginiana on the occurrence of P. lotor, denoting habitat partitioning and/or competition (standardized coefficient = −3.53), and a weak negative effect of C. latrans (−0.805) as a potential result of mesocarnivore suppression (Figure 3).
Results
Determinants of Carnivore Occupancy in Southeastern Ohio
L. rufus Occupancy
The probability of occupancy for L. rufus was 0.510 ± 0.045 (Table 1); predicting half of the study area to be inhabited by bobcats. Although none of the habitat covariates used to predict occurrence were significant, our top model included the proportion of agriculture within the 1,000 m buffer around the camera, which positively influenced L. rufus occupancy (Figure 2A). When the probability of occupancy for C. latrans was introduced as a covariate in L. rufus models, we found a significant negative effect on L. rufus occurrence (standardized coefficient = −5.07; Figure 3).
D. virginiana Occupancy
The probability of occupancy for D. virginiana in our study site was also high (psi = 0.731± 0.016; Table 1). None of the covariates introduced to explain the variability in D. virginiana site occupancy were found to be significant (Figure 2F), which was expected given that this species is ubiquitous in Ohio. D. virginiana occurrence was weakly influenced by C. latrans (standardized coefficient = −0.305) (Figure 3).
Detection Probabilities
None of the variables used to model detection (Julian day, the number of days the camera was out, time of day, and precipitation) had a significant effect on the detection of individuals of any of our six target species, and therefore the null model was chosen to be used in further analyses. The detection probabilities (p) for three of the six species were ~0.2: C. latrans: p = 0.207 ± 0.002, U. cinereoargenteus: p = 0.197 ± 0.005, V. vulpes: p = 0.180 ± 0.004. L. rufus had a much lower detection probability (p = 0.085 ± 0.002), whereas D. virginiana and P. lotor had, as expected, much higher detection probabilities: 0.453 ± 0.002 and p = 0.455 ± 0.019, respectively.
Discussions
Our results suggested directions and strengths of interspecific relations between carnivore species in southeastern Ohio, which, along with habitat variables, contributed to shaping occurrence patterns. As expected, we found the highest occupancy for C. latrans (0.892 ± 0.002), a common, highly-adaptable non-native species in Ohio, as well as for D. virginiana, and P. lotor. P. lotor and D. virginiana, both generalist mesocarnivores, show a high probability of occupancy at 0.881 ± 0.019 and 0.731± 0.016, respectively. We found a low probability of occupancy for V. vulpes (~0.2); we expected higher probability of occupancy, as red foxes are a non-native generalist, and have a widespread distribution in Ohio (Dell'Arte et al., 2007). Another unexpected result was found for U. cinereoargenteus, which exhibited slightly higher occupancy than V. vulpes. However, low occupancy estimates for gray foxes corroborate the recent declines observed in the U. cinereoargenteus population of Ohio due to disease (S. Prange, pers. comm.). L. rufus had a probability of occupancy of approximately 0.5, consistent with existing knowledge that L. rufus are reclaiming their former range in Ohio (Anderson et al., 2015).
The patterns of occurrence in the six carnivore species can partly be explained by the strength and direction of interspecific relations. We expected C. latrans, the apex predator in our system to act as the top-down regulator and have a negative influence on the occurrence of the other carnivore species. However, only one relation was strong and in the expected direction: occurrence of C. latrans strongly and negatively influenced the patterns of L. rufus occurrence (Figure 3). One possible explanation is that of direct competition and spatial segregation between these species, with C. latrans affecting the spatial distribution of L. rufus. Although this finding is based on data within a relatively short time span, which coincides with the kitten rearing season when female bobcats reduce their movements, it corroborates other studies in North America where C. latrans appear to outcompete L. rufus (Litvaitis, 1981; Thornton et al., 2004). This finding raises further questions about the population level effects of a non-native carnivore on the recovery of the native bobcat population in Ohio, as well temporal habitat partitioning (species using the same habitat but during different seasons; Chamberlain and Leopold, 2005), which could be answered though a longer-term study.
One unexpected finding was the negative relation between U. cinereoargenteus and V. vulpes occurrence. Given the current declines of U. cinereoargenteus, and the success of V. vulpes as an invader in North America, we expected that red foxes to negatively affect the occurrence of gray foxes. However, life history of U. cinereoargenteus, and the indirect impacts of C. latrans on V. vulpes might explain this pattern. First, C. latrans may suppress both fox species, but the ability of U. cinereoargenteus to climb trees and avoid larger predators might make the mesocarnivore suppression impact of C. latrans asymmetrical, and geared toward V. vulpes; suppression of V. vulpes by C. latrans has been observed in other studies (Levi and Wilmers, 2012). Thus, the strong relation between U. cinereoargenteus and V. vulpes may be apparent, and mediated by C. latrans. The other notable interspecific relation was that of D. virginiana and P. lotor. D. virginiana occurrence was negatively associated with P. lotor (Figure 3), likely due to direct competition between these two mesocarnivores, which have been shown to use similar resources in their environment (Ginger et al., 2003). However, the high levels of occurrence between these two species suggest that they are both successful in the forested SE Ohio landscape, and anecdotal evidence points toward an increasing raccoon population (S. Prange, pers. obs.).
The interspecific relations between the six carnivore species, along with landscape scale land use and human impact shape the spatial patterns of occurrence for all species. Two clear distribution patterns emerged. The first notable pattern is that L. rufus and U. cinereoargenteus, two species native to Ohio, have similar spatial distribution of higher occupancy probabilities. This could be due to a variety of factors, including the use of similar habitat features. In fact, the higher the percentage of agricultural lands in a grid cell, the higher the probability that L. rufus or U. cinereoargenteus occupied that habitat. One potential explanation is that these species are pushed into more fragmented habitat by their competitors (especially C. latrans). At the same time, L. rufus is known to preferentially prey on rodent and lagomorph species such as meadow voles (Microtus pennsylvanicus), meadow jumping mice (Zapus hudsonius), and eastern cottontail rabbits (Sylvilagus floridanus), commonly associated with open fields (Rose and Prange, 2015). The second notable pattern is that C. latrans and V. vulpes have similar spatial distributions of high occurrence probabilities; both species tended to avoid developed areas in the landscape. This distribution pattern is interesting, considering that several other studies have shown that these two species partition the habitat and are often not found in the same areas (Theberge and Wedeles, 1989; Gosselink et al., 2003). Overall, the two species parings - L. rufus & U. cinereoargenteus and C. latrans & V. vulpes- occurred with high probabilities in contrasting habitats. This finding corroborates other studies showing that L. rufus will avoid C. latrans, likely due to competition and predation risk (Litvaitis, 1981; Thornton et al., 2004); however, the short duration of our study may have overlooked spatial and temporal patterns acoss longer time periods, which warrants further research. At the same time, C. latrans and V. vulpes, both non-native species, may be able to successfully partition certain habitat temporally (Gosselink et al., 2003). Another interesting aspect is whether the diets of the two species pairings are different. There is evidence that coyotes and bobcats increase their dietary overlap, as well as their spatial overlap in human dominated landscapes of California (Smith et al., 2018), but more research is needed in our landscape to fully understand the diet and temporal and spatial habitat partitioning in these four species.
In addition to C. latrans presence, L. rufus occurrence was most influenced by the amount of agriculture in the landscape and was positively influenced by this habitat characteristic. This could be due to the availability of prey in the open fields of agriculture, which has shown to be greater than the forest interior (Pardini et al., 2005). U. cinereoargenteus are also positively influenced by agriculture, and a diet analysis for this species would be necessary to further understand spatial distribution patterns in relation to prey availability. C. latrans occupancy fit the expected pattern of a generalist, highly-successful invader. As shown in other studies, coyotes make extensive use of roads (Grubbs and Krausman, 2009), as roads allow them to not only move with ease through their home range, but also provide a way to communicate with conspecifics (Brattstrom, 1999). C. latrans will commonly mark their territories by dropping scat along roadways (Barrette and Messier, 1980). Our models corroborate these findings, as C. latrans occupancy was positively influenced by proximity to roads (Figure 2B). V. vulpes had lower than expected occupancy, and their occupancy was negatively associated with developed land within the grid cell, and negatively associated with proximity to roads. The negative relationship with developed land (e.g., towns) can be explained by the fact that V. vulpes, although adapted to thrive in human-dominated landscapes (Dell'Arte et al., 2007), is outcompeted from such areas by coyotes. The high occurrence patterns for P. lotor and D. virginiana were also expected. P. lotor was more likely to be found in more developed habitats, particularly at the 500-m scale, which speak to the ability of this species to thrive in human dominated landscapes. D. virginiana, on the other hand, was more likely to be found in areas away from human development and a greater distance from the roads, which lines up well with studies that found that that this species is a forest dweller, though often found in human dominated landscapes as well (Ginger et al., 2003).
Implications for Carnivore Management and Conservation
Interspecific relations and habitat occurrences between non-native and native species poses interesting challenges to management and conservation. On the one hand, the two native species, which are listed as species of concern in Ohio, may be affected to some extent by non-native carnivores. Recovery rates of the bobcat population in the area are unknown, but anecdotal data from verified sightings and roadkill, as well as genetic analyses (Anderson et al., 2015) point toward a successful pathway to population recovery. The negative relation between bobcats and coyotes observed in our system, which corroborates other studies, raise further questions on whether direct competition from C. latrans has the potential to affect L. rufus population recovery. The declining U. cinereoargenteus did not seem to be impacted directly by C. latrans, but our relatively short study may have not been sufficient to fully understand the interaction between these two species, as well as between the two fox species. In addition, it is important to acknowledge that the detection probabilities of all species may have been influenced by our use of an attractant lure. While this is a common method to increase detection rates in camera trap studies (2/3 of camera trap studies evaluated by Burton et al. (2015), different species may have had different propensities to visit cameras. Given observed behavior at traps, L. rufus, C. latrans, P. lotor, and D. virginiana may have been more attracted than U. cinereoargenteus and V. vulpes. The former species had a tendency to investigate the lure and sometimes rub against the tree, while the latter did not seem as interested. This may have affected detection rates; as such, this information is important for future monitoring of these species using camera traps.
Regulated harvesting (e.g., trapping, hunting) is a common, yet debated, wildlife management method. However, in many cases, harvesting may occur without a thorough understanding of the population size and demography, leading to detrimental effects on the long-term viability of the target species (e.g., Artelle et al., 2013, 2018; Popescu et al., 2016). The information in this study can serve as a source of information on the local carnivore populations, some of which appear to be vulnerable to additional sources of mortality (e.g., roadkill, disease). In particular, there are unknowns around the potential population-level impacts of a potential trapping season on the recovering bobcat population, and the ongoing trapping on the declining gray fox population. For example, because of the seemingly low occupancy found for U. cinereoargenteus, a bag limit would be advisable, in an effort to decrease the human-caused mortality, and ensure species viability in the long term. For L. rufus, caution must be exercised prior to opening a trapping season, and studies evaluating population size and identifying source and sink populations (Anderson et al., 2015) should be implemented. In this context, a better understanding of the carnivore intraguild relations can further hone management and conservations actions targeted at minimizing the impact of competition on at-risk native species from non-native species.
Author Contributions
MR, VP, and SP designed the study. MR and CT implemented the study. MR and VP analyzed the data. MR and VP wrote first draft of the manuscript. All authors contributed to subsequent drafts of the manuscript.
Funding
The fieldwork was supported by the Biological Sciences Department at Ohio University, Athens, Ohio USA. MR was supported by a Summer Research Apprenticeship from the Honors Tutorial College, Ohio University.
Conflict of Interest Statement
The authors declare that the research was conducted in the absence of any commercial or financial relationships that could be construed as a potential conflict of interest.
Acknowledgments
This work was funded by the Ohio University, Department of Biological Sciences. M R was supported by a Summer Research Apprenticeship from the Honors Tutorial College, Ohio University. We thank Ohio Department of Natural Resources for permission to conduct research on Zaleski State Forest and Ohio Division of Wildlife for providing half of the camera traps used in this study, and Wayne National Forest for permission to conduct research on USDA lands. Lynda Andrews (Wayne National Forest) and Courtney Cawood (Zaleski State Forest) were instrumental in facilitating this research. We also thank Devon Cottrill for fieldwork assistance.
Supplementary Material
The Supplementary Material for this article can be found online at: https://www.frontiersin.org/articles/10.3389/fevo.2018.00078/full#supplementary-material
References
Anderson, C. S., Prange, S., and Gibbs, H. L. (2015). Origin and genetic structure of a recovering bobcat (Lynx rufus) population. Can. J. Zool. 93, 889–899. doi: 10.1139/cjz-2015-0038
Arim, M., and Marquet, P. A. (2004). Intraguild predation: a widespread interaction related to species biology. Ecol. Lett. 7, 557–564. doi: 10.1111/j.1461-0248.2004.00613.x
Artelle, K. A., Anderson, S. C., Cooper, A. B., Paquet, P. C., Reynolds, J. D., and Darimont, C. T. (2013). Confronting uncertainty in wildlife management: performance of grizzly bear management. PLoS ONE 8:e78041. doi: 10.1371/journal.pone.0078041
Artelle, K. A., Reynolds, J. D., Treves, A., Walsh, J. C., Paquet, P. C., and and, Darimont, C. T. (2018). Hallmarks of science missing from North American wildlife management. Sci. Adv. 4:167. doi: 10.1126/sciadv.aao0167
Barrette, C., and Messier, F. (1980). Scent-marking in free-ranging coyotes, Canis latrans. Anim. Behav. 28, 814–819. doi: 10.1016/S0003-3472(80)80141-2
Burnham, K. P., and Anderson, D. R. (2002). Model Selection And Multi-Model Inference, 2nd edition. Berlin: Springer.
Burton, A. C., Neilson, E. D., Moreira, A., Ladle, R., Steenweg, J. T., Fisher, E., et al. (2015). Wildlife camera trapping: a review and recommendations for linking surveys to ecological processes. J. Appl. Ecol. 52, 675–685. doi: 10.1111/1365-2664.12432
Ceballos, G., Ehrlich, P. R., Barnosky, A. D., García, A., Pringle, R. M., and Palmer, T. M. (2015). Accelerated modern human–induced species losses: entering the sixth mass extinction. Sci. Adv. 1:e1400253. doi: 10.1126/sciadv.1400253
Chamberlain, M. J., and Leopold, B. D. (2005). Overlap in space use among vobcats (Lynx rufus), coyotes (Canis latrans) and gray foxes (Urocyon cinereoargenteus). Am. Midl. Nat. 153, 171–179. doi: 10.1674/0003-0031(2005)153[;0171:OISUAB1];2.0.CO;2
Chapron, G., Kaczensky, P., Linnell, J. D. C., von Arx, M., Huber, D., Andrén, H., et al. (2014). Recovery of large carnivores in Europe's modern human-dominated landscapes. Science 346, 1517–1519. doi: 10.1126/science.1257553
Chapron, G., and López-Bao, J. V. (2016). Coexistence with large carnivores informed by community ecology. Trends Ecol. Evol. 31, 578–580. doi: 10.1016/j.tree.2016.06.003
Colman, N. J., Gordon, C. E., Crowther, M. S., and Letnic, M. (2014). Lethal control of an apex predator has unintended cascading effects on forest mammal assemblages. Proc. R. Soc. London B Biol. Sci. 281:20133094. doi: 10.1098/rspb.2013.3094
Cove, M. V., Jones, B. M., Bossert, A. J., Clever, D. R., Dunwoody, R. K., White, B. C., et al. (2012). Use of camera traps to examine the mesopredator release hypothesis in a fragmented Midwestern landscape. Am. Midl. Nat. 168, 456–465. doi: 10.1674/0003-0031-168.2.456
Dell'Arte, G. L., Laaksonen, T., Norrdahl, K., and Korpimäki, E. (2007). Variation in the diet composition of a generalist predator, the red fox, in relation to season and density of main prey. Acta Oecol. 31, 276–281. doi: 10.1016/j.actao.2006.12.007
Dirzo, R., Young, H. S., Galetti, M., Ceballos, G., Isaac, N. J. B., and Collen, B. (2014). Defaunation in the Anthropocene. Science 345, 401–406. doi: 10.1126/science.1251817
Dorresteijn, I., Schultner, J., Nimmo, D. G., Fischer, J., Hanspach, J., Kuemmerle, T., et al. (2015). Incorporating anthropogenic effects into trophic ecology: predator–prey interactions in a human-dominated landscape. Proc. R. Soc. London B Biol. Sci. 282:20151602. doi: 10.1098/rspb.2015.1602
Elmhagen, B., and Rushton, S. P. (2007). Trophic control of mesopredators in terrestrial ecosystems: top-down or bottom-up? Ecol. Lett. 10, 197–206. doi: 10.1111/j.1461-0248.2006.01010.x
Fiske, I., and Chandler, R. (2011). unmarked: an R package for fitting hierarchical models of wildlife occurrence and abundance. J. Stat. Softw. 43, 1–23. doi: 10.18637/jss.v043.i10
Gehrt, S. D., and Prange, S. (2007). Interference competition between coyotes and raccoons: a test of the mesopredator release hypothesis. Behav. Ecol. 18, 204–214. doi: 10.1093/beheco/arl075
Gilroy, J. J., Ordiz, A., and Bischof, R. (2015). Carnivore coexistence: value the wilderness. Science 347, 382–383. doi: 10.1126/science.347.6220.382-a
Ginger, S. M., Hellgren, E. C., Kasparian, M. A., Levesque, L. P., Engle, D. M., and Leslie David, M. J. (2003). Niche shift by Virginia opossum following reduction of a putative competitor, the raccoon. J. Mammal. 84, 1279–1291. doi: 10.1644/103
Gompper, M. E., Kays, R. W., Ray, J. C., Lapoint, S. D., Bogan, D. A., and Cryan, J. R. (2006). A comparison of noninvasive techniques to survey carnivore communities in northeastern North America. Wildl. Soc. Bull. 34, 1142–1151. doi: 10.2193/0091-7648(2006)34[;1142:ACONTT];2.0.CO;2
Gompper, M. E., Lesmeister, D. B., Ray, J. C., Malcolm, J. R., and Kays, R. (2016). Differential habitat use or intraguild interactions: what structures a carnivore community? PLoS ONE 11:e0146055. doi: 10.1371/journal.pone.0146055
Gosselink, T. E., Van Deelen, T. R., Warner, R. E., and Joselyn, M. G. (2003). Temporal habitat partitioning and spatial use of coyotes and red foxes in East-Central Illinois. J. Wildl. Manage. 67, 90–103. doi: 10.2307/3803065
Grubbs, S. E., and Krausman, P. R. (2009). Use of urban landscape by coyotes. Southwest. Nat. 54, 1–12. doi: 10.1894/MLK-05.1
Homer, C., Chengquan, H., Limin, Y., Wylie, B., and Coan, M. (2004). Development of a 2001 National land-cover database for the United States. Photogramm. Eng. Remote Sens. 70, 829–840. doi: 10.14358/PERS.70.7.829
Cervinka, J., Šálek, M., Pavluvčík, P., and Kreisinger, J. (2011). The fine-scale utilization of forest edges by mammalian mesopredators related to patch size and conservation issues in Central European farmland. Biodivers. Conserv. 20, 3459–3475. doi: 10.1007/s10531-011-0135-8
Levi, T., and Wilmers, C. C. (2012). Wolves–coyotes–foxes: a cascade among carnivores. Ecology 93, 921–929. doi: 10.1890/11-0165.1
Liberg, O., Chapron, G., Wabakken, P., Pedersen, H. C., Hobbs, N. T., and Sand, H. (2012). Shoot, shovel and shut up: cryptic poaching slows restoration of a large carnivore in Europe. Proc. R. Soc. London B Biol. Sci. 279, 910–915. doi: 10.1098/rspb.2011.1275
Linnell, J. D. C., and Strand, O. (2000). Interference interactions, co-existence and conservation of mammalian carnivores. Divers. Distrib. 6, 169–176. doi: 10.1046/j.1472-4642.2000.00069.x
Litvaitis, J. A. (1981). A comparison of coyote and bobcat food habits in the wichita mountains, Oklahoma. Proc. Okla. Acad. Sci. 61, 81–82.
López-Bao, J. V., Kaczensky, P., Linnell, J. D. C., Boitani, L., and Chapron, G. (2015). Carnivore coexistence: wilderness not required. Science 348, 871–872. doi: 10.1126/science.348.6237.871-b
MacKenzie, D. I., Nichols, J. D., Lachman, G. B., Droege, S., Andrew Royle, J., and Langtimm, C. A. (2002). Estimating site occupancy rates when detection probabilities are less than one. Ecology 83, 2248–2255. doi: 10.1890/0012-9658(2002)083[;2248:ESORWD];2.0.CO;2
Newsome, T. M., and Ripple, W. J. (2015). Carnivore coexistence: trophic cascades. Science 347:383. doi: 10.1126/science.347.6220.383-a
Ordiz, A., Bischof, R., and Swenson, J. E. (2013). Saving large carnivores, but losing the apex predator? Biol. Conserv. 168, 128–133. doi: 10.1016/j.biocon.2013.09.024
Palomares, F., Caro, T. M., Byers, A. E. J. A., and Holt, R. D. (1999). Interspecific killing among mammalian carnivores. Am. Nat. 153, 492–508. doi: 10.1086/303189
Pardini, R., de Souza, S. M., Braga-Neto, R., and Metzger, J. P. (2005). The role of forest structure, fragment size and corridors in maintaining small mammal abundance and diversity in an Atlantic forest landscape. Biol. Conserv. 124, 253–266. doi: 10.1016/j.biocon.2005.01.033
Pasanen-Mortensen, M., Pyykönen, M., and Elmhagen, B. (2013). Where lynx prevail, foxes will fail – limitation of a mesopredator in Eurasia. Glob. Ecol. Biogeogr. 22, 868–877. doi: 10.1111/geb.12051
Pfenninger, M., and Schwenk, K. (2007). Cryptic animal species are homogeneously distributed among taxa and biogeographical regions. BMC Evol. Biol. 7:121. doi: 10.1186/1471-2148-7-121
Popescu, V. D., Artelle, K. A., Pop, M. I., Manolache, S., and Rozylowicz, L. (2016). Assessing biological realism of wildlife population estimates in data-poor systems. J. Appl. Ecol. 53, 1248–1259. doi: 10.1111/1365-2664.12660
Popescu, V. D., de Valpine, P., and Sweitzer, R. A. (2014). Testing the consistency of wildlife data types before combining them: the case of camera traps and telemetry. Ecol. Evol. 4, 933–943. doi: 10.1002/ece,3.997
Ripple, W. J., and Beschta, R. L. (2012). Trophic cascades in Yellowstone: the first 15years after wolf reintroduction. Biol. Conserv. 145, 205–213. doi: 10.1016/j.biocon.2011.11.005
Ripple, W. J., Estes, J. A., Beschta, R. L., Wilmers, C. C., Ritchie, E. G., Hebblewhite, M., et al. (2014). Status and ecological effects of the world's largest carnivores. Science 343:1241484. doi: 10.1126/science.1241484
Ritchie, E. G., and Johnson, C. N. (2009). Predator interactions, mesopredator release and biodiversity conservation. Ecol. Lett. 12, 982–998. doi: 10.1111/j.1461-0248.2009.01347.x
Rose, C., and Prange, S. (2015). Diet of the recovering Ohio bobcat (Lynx rufus) with a consideration of two subpopulations. Am. Midl. Nat. 173, 305–317. doi: 10.1674/amid-173-02-305-317.1
Schuette, P., Wagner, A. P., Wagner, M. E., and Creel, S. (2013). Occupancy patterns and niche partitioning within a diverse carnivore community exposed to anthropogenic pressures. Biol. Conserv. 158, 301–312. doi: 10.1016/j.biocon.2012.08.008
Smith, A. J., Thomas, A. C., Levi, T., Wang, Y., and Wilmers, C. C. (2018). Human activity reduces niche partitioning among three widespread mesocarnivores. Oikos 127, 890–901. doi: 10.1111/oik.04592
Sollmann, R., Mohamed, A., Samejima, H., and Wilting, A. (2013). Risky business or simple solution - Relative abundance indices from camera-trapping. Biol. Conserv. 159, 405–412. doi: 10.1016/j.biocon.2012.12.025
Svenning, J.-C., Pedersen, P. B. M., Donlan, C. J., Ejrnæs, R., Faurby, S., Galetti, M., et al. (2016). Science for a wilder anthropocene: synthesis and future directions for trophic rewilding research. Proc. Natl. Acad. Sci. U.S.A. 113, 898–906. doi: 10.1073/pnas.1502556112
Theberge, J. B., and Wedeles, C. H. R. (1989). Prey selection and habitat partitioning in sympatric coyote and red fox populations, southwest Yukon. Can. J. Zool. 67, 1285–1290. doi: 10.1139/z89-183
Keywords: carnivores, habitat relationships, interspecific relations, US Midwest, invasive species, native species, management, conservation
Citation: Rich M, Thompson C, Prange S and Popescu VD (2018) Relative Importance of Habitat Characteristics and Interspecific Relations in Determining Terrestrial Carnivore Occurrence. Front. Ecol. Evol. 6:78. doi: 10.3389/fevo.2018.00078
Received: 30 January 2018; Accepted: 15 May 2018;
Published: 12 June 2018.
Edited by:
Danilo Russo, Università degli Studi di Napoli Federico II, ItalyReviewed by:
Thomas Malcolm Newsome, University of Sydney, AustraliaFrancesco Ferretti, University of Siena, Italy
Copyright © 2018 Rich, Thompson, Prange and Popescu. This is an open-access article distributed under the terms of the Creative Commons Attribution License (CC BY). The use, distribution or reproduction in other forums is permitted, provided the original author(s) and the copyright owner are credited and that the original publication in this journal is cited, in accordance with accepted academic practice. No use, distribution or reproduction is permitted which does not comply with these terms.
*Correspondence: Viorel D. Popescu, cG9wZXNjdUBvaGlvLmVkdQ==
 Mackenzie Rich1
 Cassandra Thompson
 Suzanne Prange
 Viorel D. Popescu