- 1Systems Ecology, Leibniz Centre for Tropical Marine Research, Bremen, Germany
- 2Faculty of Physics and Earth Sciences, Jacobs University, Bremen, Germany
The survival of many ecological communities relies on the symbiotic relationships formed by various organisms. An example of a symbiotic association that is often described as mutualistic is the one between corals and algae. Since the algae are located within coral epidermis, they are referred to as “endosymbiont” (more generally “symbiont”) whereas the corals are referred to as “host.” This association is based on the exchange of photosynthetically fixed carbon from algae to corals and inorganic nutrients, acquired from animal waste metabolites or directly from seawater, from corals to algae. The evolution of this symbiotic relationship has enabled the emergence of highly productive and diverse coral reef ecosystems in nutrient-poor waters of the tropical oceans. Here we present an adaptive, trait-based model that describes the temporal dynamics of this association. Given that corals control the flux of inorganic nutrients to the algae, we focus on the adaptation of a hypothetical trait expressed by the coral population: investment of energy in the symbiotic relationship. Investment of energy produces losses for the corals that reflect costs for algal photosynthetic efficiency and for sustaining and maintaining the symbiont population. The fitness of the coral is modeled as the net benefit obtained by the symbiotic association. The model features a decrease in the fraction of energy invested by the corals with increasing symbiont to host biomass ratio. Our sensitivity analyses show that the best conditions for the survival of the simulated coral-algae community occur for a broad range of symbiont to host biomass ratio if the costs of symbiosis are low. With increasing costs, the survival region narrows down to a smaller range of symbiont to host biomass ratio. Finally, a break down of the symbiotic relationship and a consequent collapse of the coral-algae system occur under shock changes in algal abundance.
1. Introduction
The term “symbiosis” was originally proposed by De Bary (1879) to generally address mutualistic, commensal, or parasitic associations. Commensalism and parasitism provide benefits for only one party, whereas mutualism is an association providing benefits for both partners (Leung and Poulin, 2008; Stat et al., 2008; Sherratt and Wilkinson, 2009; Leigh, 2010). The survival of many organisms in nature depends on the symbiotic relationship that different species are able to form and maintain with each other. These relationships are often driven by the need for enhancing the abilities to compete with a third party or survive predation (Hay et al., 2004; Leigh, 2010).
An example of a symbiotic association is the one between coral polyps and photosynthesizing algae called zooxanthellae (genus Symbiodinium). This association has often been considered as mutualistic (Muscatine and Porter, 1977; Stat et al., 2008) despite clear evidence shows a greater nutritional benefits for the corals than for the algae (Falkowski et al., 1984, 1993; Muscatine et al., 1984). This association has enabled the emergence of highly productive and diverse coral reef ecosystems in nutrient-poor waters of the tropical oceans (Stambler, 2011; Muller-Parker et al., 2015).
Corals recruit algae and host them in their gastrodermis within specialized cell vacuoles, the symbiosomes. Being the algae located inside the host, the relationship is described as endosymbiotic. Corals can recruit algae from the external environment, a process called horizontal transmission, or inherit them directly from their parents, a process referred to as vertical transmission (Baker et al., 2004; Stambler, 2011; Muller-Parker et al., 2015).
When the zooxanthellae produce an amount of carbon that exceeds their own respiratory requirements, the surplus is translocated to the coral host (Yellowlees et al., 2008). Therefore, it is beneficial for the coral to establish conditions that enhance the algal photosynthetic rate and thus the production of carbon compounds (Muller-Parker et al., 2015). Corals use a signaling molecule named host-release factor (HRF) to stimulate the release of photosynthate by the zooxanthellae and control the amount of carbon that is translocated from the algae (Muscatine, 1967; Grant et al., 2006). Under high-light conditions, the coral may acquire more than 90% of the carbon fixed by the algae (Falkowski et al., 1984, 1993; Muscatine et al., 1984).
The mechanism of nutrient translocation is determined by the maintenance of several processes, one of the most important being the control of the nutrient fluxes by the corals in order to limit algal growth (Muscatine and Pool, 1979; Falkowski et al., 1993). To maintain a stable symbiosis, the density of the zooxanthellae within the coral must be regulated in a way that it remains constant under a range of environmental conditions. Harboring more zooxanthellae than necessary can reduce the benefits to the corals because they may not be able to bear the costs required for maximizing carbon production (Muller-Parker et al., 2015).
Sudden changes in environmental conditions may cause a breakdown of the symbiotic relationship with coral extruding the algae into the surrounding waters. This process is termed “bleaching” due to the whitening of the corals following the loss of algal pigments (Buddemeier and Fautin, 1993; Glynn, 1996; Fitt et al., 2001). Bleaching can cause massive coral death with serious consequences for the reef ecosystem.
Mathematical modeling has provided important contributions to the understanding of symbiotic relationships. The simplest model for studying symbiotic relationships is described by Murray (2002) and consists of two interacting populations, similarly to the classic Lotka-Volterra predator-prey system. Symbiotic models based on the Lotka-Volterra formulation have attracted the interest of many mathematicians (Korman and Leung, 1987; Lou, 1996; Delgado et al., 2000; Pao, 2005) because they are suitable for studying existence, non-existence, uniqueness or multiplicity of solutions using various techniques (Delgado and Suárez, 2009).
The mechanistic basis of host-symbiont interactions has been investigated with a large variety of models (see Friesen and Jones, 2012, for a comprehensive review), including network models of symbiotic metabolism (Thomas et al., 2009), economic game theory models (Doebeli and Knowlton, 1998), adaptive dynamics models (Ferriere et al., 2002), population genetics models (Frank, 1995; Day et al., 2008), and early iterative models incorporating utilization efficiencies of host and symbiont (Hallock, 1981; Jones and Yellowlees, 1997). Most recently, using a model describing the symbiotic relationship between a heterotrophic host and a phototrophic symbiont, Dean et al. (2016) suggested that the precise nature of photosymbiosis (whether parasitic symbiont, mutualistic holobiont, or exploitative host) depends on environmental condition and on the level of control a host has on the biomass of the algae.
Most of the existing models focus on the coevolution of interacting populations. In the case of coral and algae, however, there is an asymmetry in the share of symbiotic benefits between the two partners, because only corals control the flux of nutrients to the algae. The symbiotic benefit is by far larger for the coral host, while the benefit provided to the algae is barely enough to ensure survival (Wooldridge, 2010). This asymmetry is common in many host-endosymbiont relationships (Douglas and Smith, 1989; Frank, 1997; Kiers and West, 2016; Lowe et al., 2016). These aspects were addressed by Frean and Abraham (2004) with a model based on a modified prisoner's dilemma approach. They suggested that a species with a fast adaptation rate (e.g., the algae) is enslaved by a slowly evolving one (e.g., the coral) so that the rapidly evolving species becomes more cooperative than the slow one, which gives very little in return.
Here we present a new trait-based model for describing coral-algae symbiosis. The model combines the adaptive dynamics approach of Abrams et al. (1993) with population dynamics. We consider the asymmetry of symbiotic benefits by focusing on the adaptation of a symbiotic trait within the host population. The model captures the general feature of any adaptive process in which the trait of an organism adapts toward values that increase fitness. This is achieved by assuming that the rate of change in the trait is proportional to the fitness gradient (Abrams et al., 1993) of the holobiont, i.e., the host-symbiont complex (Knowlton and Rohwer, 2003). We then use the model to study the theoretical conditions under which the symbiotic relationship is maintained and the host-symbiont system can thrive.
2. Methods
2.1. Model
We describe the adaptive dynamics of a hypothetical trait exhibited by the host: investment into symbiosis (U). This physiological trait reflects the energy that the host (corals) invests in the symbiotic relationship with the algae. This energy is required to (1) control the flux of inorganic nutrient to the algae, (2) maintain an internal environment that is suitable for photosynthesis, and (3) allocate the symbiont into the endodermal cells.
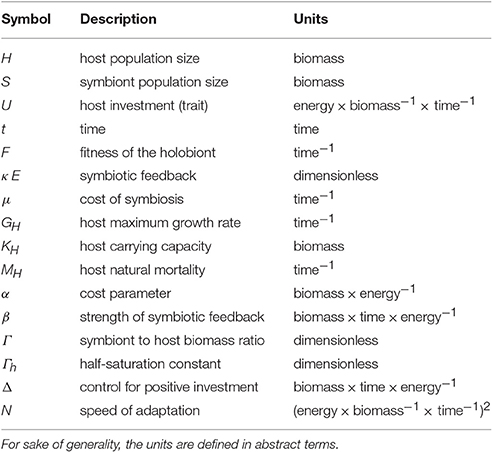
The sizes of the host and symbiont populations at time t are denoted, respectively, with H and S. For purposes of generality, the units of the model are defined in abstract terms so that H and S are expressed in units of biomass and U in units of energy per biomass per time.
The coral is in full control of the flux of energy to the algae. Since the coral must keep the size of the symbiont population stable to avoid disruptive fluctuations in the symbiotic association, we assume that the biomass of the symbiont is proportional to the biomass of the host, thus S = ΓH. Γ represents the symbiont to host biomass ratio or, more specifically, the biomass of zooxanthellae per unit of host biomass (see Subsection 2.2 for further details). Γ is a dimensionless quantity because we assume that host and symbiont populations are expressed in the same units of biomass (see Table 1). We also assume that Γ can be at most 1 because there are physiological limits on the size of the symbiont population that a coral can host so that the biomass of the symbiont can never be higher than the biomass of the coral host.
The fixation of carbon through photosynthesis by the algae induces a symbiotic feedback, κ E, that is beneficial to the host (Figure 1). κ E is a function of both host investment U and symbiont to host biomass ratio Γ (see Subsection 2.3 for further details).
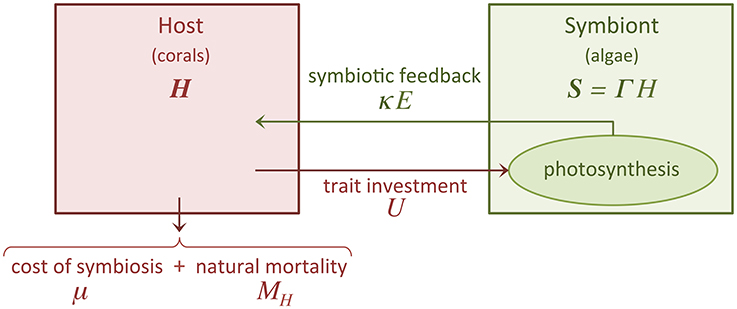
Figure 1. Schematic of our trait-based model. The diagram illustrates the symbiotic relationship between corals (host) and algae (symbiont). U is the trait investment, which is expressed by the host at a cost μ. We only consider dynamic growth for the host population (H), the size of the symbiont population (S) is assumed to be proportional (with proportionality constant Γ) to the size of the host population. The host, which is subject to a mortality rate MH, receives benefits via a symbiotic feedback κ E.
The model comprises the following equations:
where N is a proportionality constant controlling the speed of adaptation (Abrams et al., 1993) and
represents the fitness function of the holobiont, which we assume equal to the net growth rate of the coral host because the coral-symbiont system survives only if the coral survives. Coral growth is limited by different factors, including space, temperature, light, and nutrient (Birkeland, 1997). We adopted a logistic growth function because this is the most common model of limited growth. GH is the host maximum growth rate, KH is the host carrying capacity, μ reflects the costs incurred by the host for the energy invested into the symbiotic relationship (see Subsection 2.4 for further details), and MH is the host mortality rate (Figure 1).
The full list of state variables, functions, and parameters, along with their abstract units, is reported in Table 1.
2.2. Population Dynamics
Equation (1) represents the temporal dynamics of the coral host biomass. Coral gross growth follows a logistic function with a growth rate (GH κ E) that depends on the symbiotic feedback (κ E). Since most of the photosynthetic products are translocated back to the host so that the algae cannot grow as they would in a free-living state, we assume that the abundance of the symbiont per host biomass is constant. Equation (2) describes the total symbiont biomass with Γ representing the amount of symbiont biomass that can be maintained per unit of host biomass. Γ is a quantity that could be influenced by different factors, including (1) space within the host endodermal cells, (2) concentration of nutrients that the coral provide to the symbiont, and (3) light availability. Since these factors are difficult to quantify, we consider Γ as free parameter and we explore the model behavior under different values of Γ. Equation (3) represents the temporal dynamics of the coral investment trait, which follows the adaptive dynamics approach (Abrams et al., 1993), see Subsection 2.5 for further details.
2.3. Symbiotic Feedback
The symbiotic feedback κ E is the benefit that the host receives from the mutualistic relationship and represents the fraction of energy that contributes to the host growth rate so that when it reaches its maximum (i.e., when κ E = 1), the host grows at the maximum rate GH.
κ is a limitation term (Figure 2) tending to 1 when Γ increases and half-saturating at Γ = Γh, as follows:
E increases exponentially with U at a rate β and saturates to 1 because the benefits received cannot increase indefinitely:
The symbiotic feedback can be also considered as the efficiency of the algal photosynthetic machinery with respect to the amount of energy invested by the coral. It asymptotically tends to 0 with decreasing U or Γ. Hence, there is no symbiotic feedback when U = 0 (i.e., no investment by the corals) or when the symbiont biomass is zero. In contrast, when U tends to ∞, E saturates to 1 and the symbiotic feedback tends to its maximum 1 when Γ is large in comparison to Γh. The host may increase the investment U so that E reaches 1 but the total gain for the host will depend on the abundance of the symbiont.
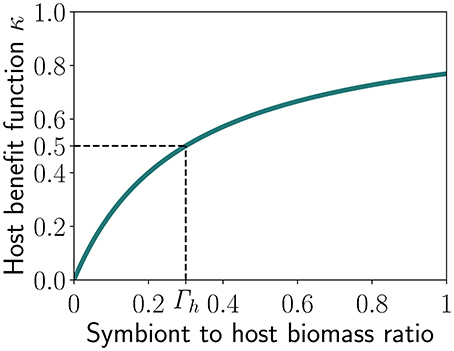
Figure 2. Benefit received by the host as function of the symbiont to host biomass ratio (Γ), with Γh representing the half-saturation constant, i.e., the value of Γ at which half of the maximum benefit is reached.
When κ tends to 1, for example under high symbiont abundance, the symbiotic feedback tends to 1 only if E tends to 1, i.e., when investment U is large enough. Therefore, the symbiotic feedback reaches a maximum only when both the symbiont to host biomass ratio (Γ) and the investment U are large enough.
2.4. Cost of Symbiosis
The symbiotic investment U entails costs for the host. In the case of corals, there are energetic costs associated to (1) the provision of inorganic nutrients to the algae, (2) for keeping the internal environment suitable for algal photosynthesis, and (3) for coping with different stresses associated to photosynthesis (Muller-Parker et al., 2015).
For simplicity, we assume a universal cost that increases with U and Γ:
with α describing the fraction of biomass required to invest a unit of energy so that μ represents a loss rate in per time.
The presence of Γ conveys the dependency of the cost of symbiosis on the abundance of the symbiont. In this way, the symbiotic cost is non-zero if and only if Γ and U are non-zeros. Additionally, when Γ is close to 1, μ tends to infinity. This functional form attributes unbearable symbiotic costs to the coral when the biomass of the algae is close to that of the coral to reflect physiological limits on the size of the symbiont population that a coral can host.
2.5. Trait Dynamics
We only take into account the adaptation of a coral trait because the coral clearly dominates the symbiotic relationship, reaping up more than 90 % of the photosynthate produced by the algae (Falkowski et al., 1984, 1993; Muscatine et al., 1984). Note that a lack of investment (U = 0) leads to the collapse of the host-symbiont complex. In other words, investment into symbiosis is a trait compulsory for the survival of the holobiont, which can remain alive only if the exchange (i.e., the symbiotic feedback) is large enough to sustain the host population.
Following the adaptive dynamics approach of Abrams et al. (1993), we consider the adaptation of the symbiotic trait investment (U) and assume that the mean trait U adapts to increase the fitness F of the holobiont, by increasing the net growth rate of the host (Equation 4). The temporal dynamics of U is therefore assumed proportional to the gradient of the fitness function (Abrams et al., 1993), as in Equation (3).
2.6. Non-dimensional Model Formulation
It is advantageous to study the model behavior using non-dimensional variables and parameters (Segel, 1972). This procedure leads to a reduction in the number of parameters because some of them are combined in dimensionless groups.
However, before we rescale the model variables and parameters, we impose a constraint to the model in order to prevent ecologically meaningless situations such as the occurrence of negative investments. Negative investments, in fact, would lead to negative costs of symbiosis (i.e., negative μ, Equation 7), which in turn would increase the fitness of the holobiont (i.e., F, Equation 4) because in adaptive dynamics the trait adapts toward increasing fitness (Abrams et al., 1993). Therefore, to avoid that fitness increases under ecologically meaningless conditions (i.e., under negative U), we assume
where Δ is a control parameter with a chosen high value such that Equation (8) becomes Equation (7) when U ≥ 0) and (1 − e−ΔU)U tends to large positive values when U tends to −∞. This ensures that investment is always positive because negative investment is associated to exponential costs and is thus staved off by the adaptive dynamics.
The non-dimensional form of the model equations is obtained by rescaling variables and parameters according to Table 2.
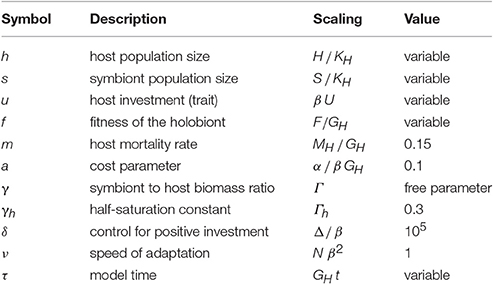
Table 2. Non-dimensional scaling variables, functions, and parameters as well as their values used in the simulations.
Therefore, Equations (1–3) become
where ν is the non-dimensional speed of adaptation.
The non-dimensional fitness of the holobiont is thus
A key aspect of our model is the presence of a trade-off between the benefit of the symbiotic feedback for the host κ(γ)(1−e−u) and the cost of symbiosis . High investments u increase the benefits for the host, but at the expense of increasing costs, thus for a given γ (symbiont to host biomass ratio), there is an intermediate value of u for which the fitness of the holobiont is maximized (see Figure 3).
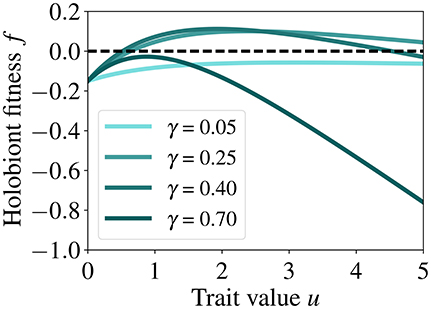
Figure 3. Fitness of the holobiont as a function of host investment u for different γ (symbiont to host biomass ratio) and at fixed host biomass (h = 0.2). This relationship highlights the trade-off between the benefit of the symbiotic feedback and the cost of symbiosis as well as the values of u for which the fitness of the holobiont is maximized. The dashed line is the zero fitness level.
2.7. Simulations
Our objective is to explore the coupled trait and population dynamics of the host-symbiont system under different scenarios. More specifically, we investigate the model dynamics under different values of γ (low, mid, and high, respectively 0.08, 0.35, and 0.65) and a.
γ, we remind the reader, is a parameter that controls both the benefits received by the host through the symbiotic feedback and the costs incurred by the host for maintaining the symbiotic relationship, whereas a represents the severity of the cost of symbiosis with respect to the fraction of energy invested by the host.
The general behavior of the model is investigated with an analysis of the phase plane. We then perform sensitivity analyses with respect to γ and a in order to identify regions of the parameter space where survival or collapse of the host-symbiont system occur. Finally, we explore the behavior of the host-symbiont system under shock perturbations in γ.
The numerical simulations and graphical outputs were produced using Python.
3. Results
3.1. Phase Plane Analysis
We perform an analysis of the phase plane to locate the steady state of the system. In Figure 4 we show the fitness landscape in the phase plane as a function of host abundance and trait value and at different γ (symbiont to host biomass ratio).

Figure 4. Fitness landscapes in the phase plane defined by host abundance and trait at low (A) mid (B), and high (C) γ, respectively 0.08, 0.35, and 0.65. The nullclines represent the location at which the derivatives of the host biomass (dark blue line) and trait value (light blue line) are zero. The point where the nullclines intersect represents the steady state of the system. The parameter values used for generating these runs are reported in Table 2.
When γ is low (Figure 4A), the costs incurred by the host are mainly influenced by the energy that the host invests in the symbiotic relationship and the benefits are low, because the fraction of translocated energy, κ(γ), is small. Under this condition, the fitness landscape is fairly smooth although two distinct regions of positive and negative fitness emerge, separated by the nullcline of host dynamics, i.e., the line in the fitness landscape at which dh/dτ = 0. In contrast, when γ is high (Figure 4C), the nullcline delineates a much smaller region of positive fitness as compared to the cases of low and mid γ, implying that the costs for maintaining the symbiotic relationship exceeds the benefits already at low investment levels. In all cases (low, mid, and high γ), the fitness landscape exhibits maxima along the nullcline of trait dynamics (i.e., the line in the fitness landscape at which du/dτ = 0); these are also points toward which the trait adapts.
The point (u, h) of the phase plane at which the nullclines of host and trait dynamics intersect is the non-trivial (i.e. non-zero) steady state. Under low γ, the steady state is reached at higher values of investment (u) and lower values of host biomass (h) than at high γ (Figure 4).
To further investigate if the steady state represents a stable, unstable, or saddle node, we analyse the vector field that defines the direction of convergence of the host-trait dynamics (Figure 5), i.e., the group of vectors determined by . The direction of the vector field indicates that the system converges toward the steady state (Figure 5), which is therefore a stable node.

Figure 5. Normalized vector fields (gray arrows), nullclines (blue lines) and phase trajectories (red lines) for the host and trait dynamics at low (A), mid (B), and high (C) γ, respectively 0.08, 0.35, and 0.65. Nullclines are the same as in Figure 4 and point of intersection of the nullclines represents the steady state of the system. The direction of the vector field indicates that the dynamics of the system converges toward the steady state, which is therefore a stable node. The parameter values used for generating these runs are reported in Table 2.
For any set of parameter values and provided that all parameters are positive, there exists at most one unique, non-trivial steady state that is a stable node solution in our model. This is because, by model design, any positive or negative variations in parameter values will not change the general locations of negative and positive derivatives. Only the magnitude of each vector will change, that is the speed with which the system reaches the stable steady state.
3.2. Temporal Dynamics
The temporal dynamics of trait and host (Figure 6) show clearly that the system reaches the steady-state quite rapidly. The steady state of the trait (Figure 6A) increases with decreasing γ (symbiont to host biomass ratio), meaning that if the symbiont to host biomass ratio decreases, the system adapts toward higher investment in order to optimize symbiotic performance – when γ decreases, also κ tends to a small value, implying that a high symbiotic feedback κ E is obtained by investing more into the smaller algal population. The impact of γ on the host dynamics (Figure 6B) is not straightforward. At high γ, the steady state of the host is lowest. However, the highest steady state is achieved for an intermediate γ, because this level of γ entails costs that are lower than those incurred at low γ (the net benefit for the host, which is expressed by the fitness function f, Equation (12), is highest at intermediate γ and intermediate investment u).
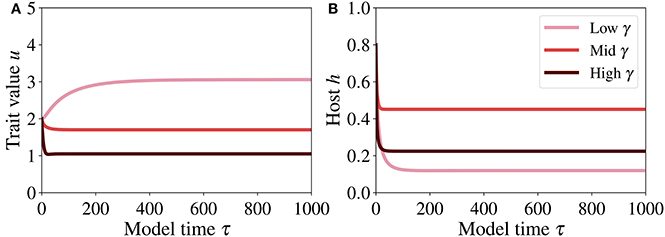
Figure 6. Temporal dynamics of trait (A) and host (B) at low, mid, and high γ, respectively 0.08, 0.35, and 0.65. The parameter values used for generating these runs are reported in Table 2.
To verify that this dynamics is consistent with the phase plane analysis conducted earlier, we analyse the trajectories of the system toward steady state (Figure 6) in the phase plane and the nullclines for different γ (Figure 5). Starting from the initial condition (h, u) = (0.8, 2) at τ = 0, these trajectories converge to the steady state.
3.3. Sensitivity Analysis
We test the sensitivity of the model to changes in key parameters. We identify two fundamental parameters that define the symbiotic relationship: the cost of symbiosis (a) and the symbiont to host biomass ratio (γ). We then run the model to steady state over a continuum of a and γ values and analyse the resulting trait (Figure 7A) and host population values (Figure 7B). When the population size of the symbiont decreases relative to that of the host (i.e., low γ), investment into symbiosis increases (Figure 7A) to compensate for the associated reduction in the symbiotic feedback, but this leads to increasing costs (Equation 8), which cause a collapse of the holobiont (Figure 7B). When the population size of the symbiont increases relative to that of the host (high γ), investment into symbiosis decreases (Figure 7A) to lower the costs, but this produces a small symbiotic feedback, which leads to the collapse of the holobiont (Figure 7B). A region of the parameter space emerges in which the holobiont can thrive. This region is broad with respect to γ at low symbiotic costs, where it corresponds to a relatively big host population, and narrows down with increasing γ as the costs of symbiosis increase, leading to a relatively small host population and ultimately to a collapse (Figure 7B).
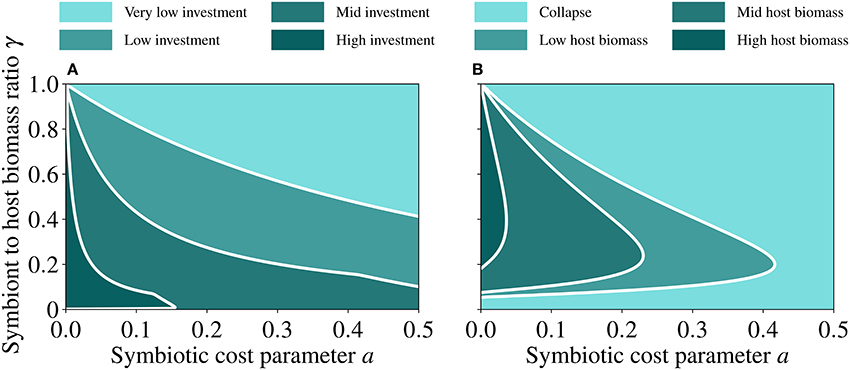
Figure 7. Steady state values of trait (A) and host (B) as functions of the symbiotic cost incurred by the host (a) and the symbiont to host biomass ratio (γ). Very low investment corresponds to 0 ≤ u < 0.5, low investment corresponds to 0.5 ≤ u < 1.5, mid investment corresponds to 1.5 ≤ u < 3, and high investment corresponds to 3 ≤ u < 8. Collapse of host biomass corresponds to 0 ≤ h < 0.02, low host biomass corresponds to 0.02 ≤ h < 0.25, mid host biomass corresponds to 0.25 ≤ h < 0.6, and high host biomass corresponds to 0.6 ≤ h < 1. The white lines in both panels are guide to eye so that the different regions are easily distinguished. The parameter values used for generating these runs are reported in Table 2.
3.4. Shock Experiments
We perform shock experiments with respect to γ (symbiont to host biomass ratio). The perturbation, which is applied at a time after the system has reached steady state, consists of a sudden decrease or increase of γ from a control value (γ = 0.3). A sudden decrease of γ with respect to the control value simulates a bleaching event. In contrast, a sudden increase of the symbiont population with respect to that of the host simulates the case in which the host looses control of the nutrient fluxes, for example under elevated inorganic nutrient concentrations in the surrounding waters (Falkowski et al., 1984; Dubinsky and Jokiel, 1994; Hoegh-Guldberg, 1994; Marubini and Davies, 1996; D'Angelo and Wiedenman, 2014).
Severe bleaching induces an extreme increase in the trait investment (Figure 8A) and a collapse of the host population (Figure 8B). If bleaching is moderate, the increased investment (Figure 8A) induces higher symbiotic benefit at affordable costs and compensates for the reduction of the symbiont population, leading to a relatively small reduction in the size of the host population (Figure 8B).
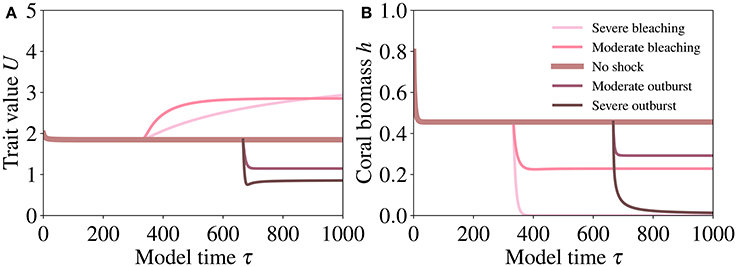
Figure 8. Responses of coral trait value (A) and biomass (B) to shock experiments simulating bleaching (i.e., a reduction of γ) and the loss of control by the host of the nutrient fluxes to the symbiont (i.e., an increase of γ, mimicking the explosive growth of the symbiont population). The shocks are implemented by setting γ = 0.01 for severe bleaching, γ = 0.1 for moderate bleaching, γ = 0.75 for severe symbiont outburst, and γ = 0.6 for moderate symbiont outburst. The values of the other parameters are reported in Table 2.
In contrast, an increase in γ induces a pronounced decrease in the trait values (Figure 8A) and a collapse of the host population (Figure 8B). However, a slower increase in symbiont density is followed by a reduced investment (Figure 8A) and reduced costs for the host, which allows for survival at a small host population size (Figure 8B).
4. Discussion
The mathematical models available for studying symbiotic relationships are numerous and diverse. Having being designed to address specific aspects of symbiosis, these models are based on very different approaches, ranging from Lotka-Volterra type of models to network models of symbiotic metabolism and economic game theory models (see Introduction). Attempting a comparison of our model with existing ones would thus pose insurmountable methodological and interpretative challenges. Instead, we focus the discussion on the main characteristics of our model and its dynamic behavior under different conditions and we relate these aspects, if only in qualitative terms, to situations observed in nature.
Our model is based on a hypothetical trait representing the energetic investment of the host in the symbiosis. Consistent with a coral-algae symbiotic relationship in which the host benefits but the symbiont gains little from the association (Douglas and Smith, 1989; Kiers and West, 2016; Lowe et al., 2016), we assume the symbiont biomass to be proportional to the host biomass so that the survival of the holobiont depends on the survival of the host. The coral controls the flux of nutrients to the algae and keeps most of the photosynthate products for itself thus preventing the algae to grow unboundedly (Muscatine, 1967; Wooldridge, 2010; Stambler, 2011).
In our model, the host receives a symbiotic benefit that increases with (1) the host symbiotic investment (u) and (2) the symbiont to host biomass ratio (γ). The symbiotic feedback reaches the highest value 1 only when both γ and u are sufficiently large, that is when the coral provides enough resources for achieving highest algal photosynthetic efficiency and when the size of the algal population is large relative to that of the coral. The growth rate of the host is highest when the symbiotic benefit is largest. In contrast, the symbiotic cost increases indefinitely with increasing investment and symbiont biomass. This cost/benefit trade-off, which is included in our model and is inherent to the symbiotic relationship (Herre et al., 1999; Leung and Poulin, 2008; Muller-Parker et al., 2015), drives the system toward intermediate investment values.
We find that the survival of the holobiont occurs at intermediate values of symbiont to host biomass ratio. Sudden changes toward either low or high γ lead to the collapse of the holobiont. This occurs because a considerably low symbiont biomass relative to that of the host does not provide enough symbiotic benefit, whereas a very high symbiont biomass relative to that of the host induces symbiotic costs to the host that outweigh the benefits received.
Our sensitivity analyses show that these results are robust. There is a threshold in the symbiont to host biomass ratio below which the holobiont collapses regardless of the costs incurred by the host to maintain the symbiotic relationship. As the symbiont biomass increases, the symbiotic costs become too high and the holobiont collapses.
The survival region for the holobiont is broad at small values of symbiotic costs (parameter a = α/βGH). This implies that corals species with high growth rates (GH) or corals that receive symbiotic feedbacks at a fast rate (β) have better chances of survival than corals that grow slow or which symbiotic machinery is not efficient enough. The latter may occur for example when the functioning of the symbiotic relationship has been compromised by consecutive disturbances or by the action of multiple stress factors.
With a series of shock experiments we reproduce a sudden exponential increase in symbiont biomass, which could result from the inability of the coral to control the flux of nutrients to the algae. A sudden decrease in symbiont biomass induces the host to adapt toward high investment, whereas a sudden increase in symbiont biomass induces the host to adapt to low investment. In both situations the costs of symbiosis increase so that the host reaches a biomass that is lower than the pre-shock level.
Our model results support the idea that neither too low nor too high symbiont to host biomass ratios (γ) are beneficial for the holobiont. Both these extreme cases may reflect real situations in nature. When the algal abundance is too low, the holobiont collapses. This occurs when juvenile corals are unable to recruit enough symbiont after settlement or when bleached corals are unable to re-establish a viable symbiont population (Baker, 2003; Stat et al., 2008; Stambler, 2011; Muller-Parker et al., 2015). In contrast, a high algal abundance could reflect the failure of the coral to control algal growth thus leading to symbiotic costs that outweigh benefits. This can reflect the pre-bleaching state of the holobiont when, in the attempt to adapt to changing environmental conditions, the coral expels only a fraction of the algae into the surrounding waters (Buddemeier and Fautin, 1993; Leigh, 2010; Logan et al., 2014) or when the population of zooxanthellae increases under elevated external concentrations of inorganic nutrients (Falkowski et al., 1984; Dubinsky and Jokiel, 1994; Hoegh-Guldberg, 1994; Marubini and Davies, 1996; D'Angelo and Wiedenman, 2014). In both situations, proportionately less photosynthetically fixed carbon is translocated from the algae to the coral, zooxanthellae outgrow their hosts, and the host loses control over the population of its symbiotic algae.
Our model does not account for any recovery mechanisms that may enable corals to survive fluctuations in the abundance of the symbiont. Thus, our shock experiments (Figure 8) assume that the values of γ remain at their current level after the shock has occurred. Likewise, we did not consider the adaptation of traits expressed by the symbiont. The coral host controls the flux of nutrients to the algae, harvests more than 90% of the photosynthate produced by the algae, and limits symbiont growth (Falkowski et al., 1984, 1993; Muscatine et al., 1984). The symbiont, therefore, does not grow as it would do in a free-living state. This system has been described as an obligate symbiotic relationship in which algae are “enslaved” (Frean and Abraham, 2004) to provide resources to the host. All this makes our focus on the adaptation of a host trait a reasonable first approximation. Accounting for a dynamically varying symbiont population or the explicit inclusion of varying environmental conditions requires a more complex model and will be the subject of a subsequent study.
5. Conclusions
Our theoretical study shows that the survival of obligate symbiotic relationships, similar to that of corals and algae, occurs at specific ratios of symbiont to host biomasses. Furthermore, the host and symbiont reach higher population sizes when the costs of symbiotic investment are low. This dynamics result from the presence of a trade-off between the benefits of symbiosis and the costs for maintaining it. The coral adapts toward a higher investment trait when the algal biomass is relatively low and adapts toward a lower investment trait when the algal biomass is relatively high. The best survival strategy for corals, and thus for the holobiont, is to maintain an intermediate algal abundance relative to its own biomass while minimizing the costs of symbiosis.
Author Contributions
Design of the work: AM and GB. Analyzing and drafting the work: NR. Revising the work for important intellectual content: NR, GB, and AM. Final approval of the version to be published: NR, GB, and AM. Agreement to be accountable for all aspect of the work: NR, GB, and AM.
Conflict of Interest Statement
The authors declare that the research was conducted in the absence of any commercial or financial relationships that could be construed as a potential conflict of interest.
Acknowledgments
We thank Pamela Hallock-Muller for insightful discussions. We are moreover grateful to the Leibniz Center for Tropical Marine Ecology for providing the financial support necessary to undertake this study.
References
Abrams, P. A., Matsuda, H., and Harada, Y. (1993). Evolutionarily unstable fitness maxima and stable fitness minima of continuous traits. Evol. Ecol. 7, 465–487. doi: 10.1007/BF01237642
Baker, A. C. (2003). Flexibility and specificity in coral-algal symbiosis: diversity, ecology, and biogeography of symbiodinium. Ann. Rev. Ecol. Evol. Syst. 34, 661–689. doi: 10.1146/annurev.ecolsys.34.011802.132417
Baker, A. C., Starger, C. J., McClanahan, T. R., and Glynn, P. W. (2004). Coral reefs: corals' adaptive response to climate change. Nature 430:741. doi: 10.1038/430741a
Buddemeier, R. W., and Fautin, D. G. (1993). Coral bleaching as an adaptive mechanism. Bioscience 43, 320–326. doi: 10.2307/1312064
D'Angelo, C., and Wiedenman, J. (2014). Impacts of nutrient enrichment on coral reefs: new perspectives and implications for coastal management and reef survival. Curr. Opin. Environ. Sustain. 7, 82–93. doi: 10.1016/j.cosust.2013.11.029
Day, T., Nagel, L., Van Oppen, M. J., and Caley, M. J. (2008). Factors affecting the evolution of bleaching resistance in corals. Am. Natl. 171, E72–E88. doi: 10.1086/524956
Dean, A. D., Minter, E. J. A., Sørensen, M. E. S., Lowe, C. D., Cameron, D. D., Brockhurst, M. A., et al. (2016). Host control and nutrient trading in a photosynthetic symbiosis. J. Theor. Biol. 405, 82–93. doi: 10.1016/j.jtbi.2016.02.021
Delgado, M., Lopéz-Gómez, J., and Suárez, A. (2000). On the symbiotic Lotka-Volterra model with diffusion and transport effects. J. Differ. Equation 160, 175–262. doi: 10.1006/jdeq.1999.3655
Delgado, M., and Suárez, A. (2009). A Lotka-Volterra symbiotic model with cross-diffusion. J. Differ. Equation 160, 2131–2149. doi: 10.1016/j.jde.2008.10.032
Doebeli, M., and Knowlton, N. (1998). The evolution of interspecific mutualisms. Proc. Natl. Acad. Sci. U.S.A. 95, 8676–8680.
Douglas, A. E., and Smith, D. C. (1989). Are endosymbioses mutualistic? Trends Ecol. Evol. 4, 350–352. doi: 10.1016/0169-5347(89)90090-6
Dubinsky, Z., and Jokiel, P. L. (1994). Ratio of energy and nutrient fluxes regulates symbiosis between zooxanthellae and corals. Pac. Sci. 48, 313–324.
Falkowski, P. G., Dubinsky, Z., Muscatine, L., and Porter, J. W. (1984). Light and the bioenergetics of a symbiotic coral. Bioscience 34, 705–709. doi: 10.2307/1309663
Falkowski, P. G., Dubinsky, Z., Muscatine, L., and McCloskey, L. (1993). Population control in symbiotic corals. Bioscience 43, 606–611. doi: 10.2307/1312147
Ferriere, R., Bronstein, J. L., Rinaldi, S., Law, R., and Gauduchon, M. (2002). Cheating and the evolutionary stability of mutualisms. Proc. Biol. Sci. R. Soc. 269, 773–780. doi: 10.1098/rspb.2001.1900
Fitt, W., Brown, B., Warner, M., and Dunne, R. (2001). Coral bleaching: interpretation of thermal tolerance limits and thermal thresholds in tropical corals. Coral Reefs 20, 51–65. doi: 10.1007/s003380100146
Friesen, M. L., and Jones, E. I. (2012). “Modeling the Evolution of Mutualistic Symbioses,” in Bacterial Molecular Networks, Methods in Molecular Biology, Vol. 804, eds J. van Helden, A. Toussaint, and D. Thieffry (New York, NY: Springer), 481–499.
Frean, M. R., and Abraham, E. R. (2004). Adaptation and enslavement in endosymbiont-host associations. Phys. Rev. E 69:051913. doi: 10.1103/PhysRevE.69.051913
Glynn, P. W. (1996). Coral reef bleaching: facts, hypotheses and implications. Global Change Biol. 2, 495–509. doi: 10.1111/j.1365-2486.1996.tb00063.x
Grant, A. J., Rémond, M., Starke-Peterkovic, T., and Hinde, R. (2006). A cell signal from the coral Plesiastrea versipora reduces starch synthesis in its symbiotic alga, Symbiodinium sp. Comp. Biochem. Physiol. A Mol. Integr. Physiol. 144, 458–63. doi: 10.1016/j.cbpa.2006.04.012
Hallock, P. (1981). Algal symbiosis: a mathematical analysis. Marine Biol. 62, 249–255. doi: 10.1007/BF00397691
Hay, M. E., Parker, J. D., Burkepile, D. E., Caudill, C. C., Wilson, A. E., Hallinan, Z. P., et al. (2004). Mutualism and aquatic community structure: the enemy of my enemy is my friend. Ann. Rev. Ecol. Evol. Syst. 35, 175–197. doi: 10.1146/annurev.ecolsys.34.011802.132357
Herre, E. A., Knowlton, N., Mueller, U. G., and Rehner, S. A. (1999). The evolution of mutualisms: exploring the paths between conflict and cooperation. Trends Ecol. Evol. 14, 49–53.
Hoegh-Guldberg, O. (1994). Population dynamics of symbiotic zooxanthellae in the coral Pocillopora damicornis exposed to elevated ammonium ((NH-4)-2SO-4) concentrations. Pac. Sci. 48, 263–272.
Jones, R. J., and Yellowlees, D. (1997). Regulation and control of intracellular algae (= zooxanthellae) in hard corals. Philos. Trans. R. Soc. 352, 457–468. doi: 10.1098/rstb.1997.0033
Kiers, T. E., and West, S. A. (2016). Evolution: welcome to symbiont prison. Curr. Biol. 26, R66–R68. doi: 10.1016/j.cub.2015.12.009
Korman, P., and Leung, A. (1987). On the existence and uniqueness of positive steady-states in the volterra-lotka ecological models with diffusion. Appl. Anal. 26, 145–160. doi: 10.1080/00036818708839706
Knowlton, N., and Rohwer, F. (2003). Multispecies microbial mutualisms on coral reefs: the host as a habitat. Am. Natl. 162, S51–S62. doi: 10.1086/378684
Leung, T. L. F., and Poulin, R. (2008). Parasitism, commensalism, and mutualism: exploring the many shades of symbioses. Vie et Milieu 58, 107–115.
Leigh, E. G. (2010). The evolution of mutualism. J. Evol. Biol. 23, 2507–2528. doi: 10.1111/j.1420-9101.2010.02114.x
Logan, C. A., Dunne, J. P., Eakin, C. M., and Donner, S. D. (2014). Incorporating adaptive responses into future projections of coral bleaching. Global Change Biol. 20, 125–139. doi: 10.1111/gcb.12390
Lou, Y. (1996). Necessary and sufficient condition for the existence of positive solution of certain cooperative system. Nonlinear Anal. 26, 1079–1095. doi: 10.1016/0362-546X(94)00265-J
Lowe, C. D., Minter, E. J., Cameron, D. D., and Brockhurst, M. A. (2016). Shining a light on exploitative host control in a photosynthetic endosymbiosis. Curr. Biol. 26, 207–211. doi: 10.1016/j.cub.2015.11.052
Marubini, F., and Davies, P. S. (1996). Nitrate increases zooxanthellae population density and reduces skeletogenesis in corals. Marine Biol. 127, 319–328. doi: 10.1007/BF00942117
Muscatine, L., and Porter, J. W. (1977). Reef corals: mutualistic symbioses adapted to nutrient-poor environments. Bioscience 27, 454–460. doi: 10.2307/1297526
Muscatine, L., Falkowski, P. G., Porter, J. W., and Dubinsky, Z. (1984). Fate of photosynthetic fixed carbon in light- and shade-adapted colonies of the symbiotic coral stylophora pistillata. Proc. R. Soc. Lond. B Biol. Sci. 222, 181–202.
Muscatine, L., and Pool, R. R. (1979). Regulation of numbers of intracellular algae. Proc. R. Soc. Lond. B Biol. Sci. 204, 131–139.
Muscatine, L. (1967). Glycerol excretion by symbiotic algae from corals and Tridacna and its control by the host. Science 156, 516–519.
Muller-Parker, G., D'Elia, C. F., and Cook, C. B. (2015). “Interactions between corals and their symbiotic algae,” in Coral Reefs in the Anthropocene, ed C. Birkeland (Dordrecht: Springer), 99–116.
Murray, J. D. (2002). Mathematical Biology I: An Introduction, 3 Edn. New York, NY: Mathematical Biology I: An Introduction.
Pao, C. V. (2005). Strongly coupled elliptic systems and applications to Lotka-Volterra models with cross-diffusion. Nonlinear Anal. Theory Methods Appl. 60, 2131–2149. doi: 10.1016/j.na.2004.10.008
Stat, M., Morris, E., and Gates, R. D. (2008). Functional diversity in coral-dinoflagellate symbiosis. Proc. Natl. Acad. Sci. U.S.A. 105, 9256–9261. doi: 10.1073/pnas.0801328105
Sherratt, T. N., and Wilkinson, D. M. (2009). Big Question in Ecology and Evolution New York, NY: Oxford University Press.
Stambler, N. (2011). “Zooxanthellae: the yellow symbiont inside animals,” Coral Reefs: An Ecosystem in Transition, Vol. 804., eds Z. Dubinsky and N. Stambler (Springer), 87–106.
Thomas, G. H., Zucker, J., Macdonald, S. J., Sorokin, A., Goryanin, I., and Douglas, A. E. (2009). A fragile metabolic network adapted for cooperation in the symbiotic bacterium Buchnera aphidicola. BioMed. Central Sys. Biol. 3:24. doi: 10.1186/1752-0509-3-24
Wooldridge, S. A. (2010). Is the coral-algae symbiosis really “mutually beneficial” for the partners? Bioessays 32, 615–625. doi: 10.1002/bies.200900182
Keywords: host, endosymbiont, adaptation, symbiotic trait, cost-benefit, trade-off
Citation: Raharinirina NA, Brandt G and Merico A (2017) A Trait-Based Model for Describing the Adaptive Dynamics of Coral-Algae Symbiosis. Front. Ecol. Evol. 5:31. doi: 10.3389/fevo.2017.00031
Received: 27 October 2016; Accepted: 30 March 2017;
Published: 18 April 2017.
Edited by:
Robert Ptacnik, WasserCluster Lunz, AustriaReviewed by:
Alexei B. Ryabov, University of Oldenburg, GermanyAndrea Sciarretta, University of Molise, Italy
Copyright © 2017 Raharinirina, Brandt and Merico. This is an open-access article distributed under the terms of the Creative Commons Attribution License (CC BY). The use, distribution or reproduction in other forums is permitted, provided the original author(s) or licensor are credited and that the original publication in this journal is cited, in accordance with accepted academic practice. No use, distribution or reproduction is permitted which does not comply with these terms.
*Correspondence: N. Alexia Raharinirina, YWxleGlhLnJhaGFyaW5pcmluYUBsZWlibml6LXptdC5kZQ==
†Present Address: Gunnar Brandt, Brockmann Consult GmbH, Geesthacht, Germany
 N. Alexia Raharinirina
 Gunnar Brandt
 Agostino Merico