 Madeleine Beekman
 James C. Makinson
 Margaret J. Couvillon
 Kaitlyn Preece
 Timothy M. Schaerf
- 1Behaviour and Genetics of Social Insects Lab, School of Biological Sciences, University of Sydney, Sydney, NSW, Australia
- 2Laboratory of Apiculture and Social Insects, School of Life Sciences, University of Sussex, Brighton, UK
- 3Animal Behaviour Lab, School of Biological Sciences, University of Sydney, Sydney, NSW, Australia
All honeybees use the waggle dance to recruit nestmates. Studies on the dance precision of Apis mellifera have shown that the dance is often imprecise. Two hypotheses have been put forward aimed at explaining this imprecision. The first argues that imprecision in the context of foraging is adaptive as it ensures that the dance advertises the same patch size irrespective of distance. The second argues that the bees are constrained in their ability to be more precise, especially when the source is nearby. Recent studies have found support for the latter hypothesis but not for the “tuned-error” hypothesis, as the adaptive hypothesis became known. Here we investigate intra-dance variation among Apis species. We analyse the dance precision of A. florea, A. dorsata, and A. mellifera in the context of foraging and swarming. A. mellifera performs forage dances in the dark, using gravity as point of reference, and in the light when dancing for nest sites, using the sun as point of reference. Both A. dorsata and A. florea are open-nesting species; they do not use a different point of reference depending on context. A. florea differs from both A. mellifera and A. dorsata in that it dances on a horizontal surface and does not use gravity but instead “points” directly toward the goal when indicating direction. Previous work on A. mellifera has suggested that differences in dance orientation and point of reference can affect dance precision. We find that all three species improve dance precision with increasing waggle phase duration, irrespective of differences in dance orientation, and point of reference. When dancing for sources nearby, dances are highly variable. When the distance increases, dance precision converges. The exception is dances performed by A. mellifera on swarms. Here, dance precision decreases as the distance increases. We also show that the size of the patch advertised increases with increasing distance, contrary to what is predicted under the tuned-error hypothesis.
Introduction
In September 1999 NASA's US$125 million Mars Climate Orbiter probe was lost due to miscommunication between engineers. Unlike NASA, engineers at the company that helped build the probe, Lockheed Martin, used English instead of metric units of measurement. Inability to communicate the correct measurement resulted in the probe being 100 km too close to Mars when it tried to enter the planet's orbit. The probe never entered Mars' orbit and may now well be orbiting the sun instead1. Clearly precise communication matters. Non-human animal communication should not be an exception. Yet, the animal probably most studied in terms of non-human animal communication, the honeybee, is notoriously messy when communicating the location of forage and nest sites (Towne and Gould, 1988; Beekman et al., 2005; Schürch and Couvillon, 2013). Why would this be?
The honeybee's dance language is essential during nest-site selection when scout bees explore the surroundings for potential nest sites and communicate their location upon their return to the swarm (the basic process in Apis mellifera is reviewed in Seeley, 2010, for A. florea see Makinson et al., 2011 and Oldroyd et al., 2008 and for A. dorsata Makinson et al., 2014). Although not strictly essential in the context of foraging (Sherman and Visscher, 2002; Dornhaus and Chittka, 2004; Beekman and Lew, 2008; Granovskiy et al., 2012), the dance does allow the bees to rapidly exploit newly discovered food sources (Seeley and Visscher, 1988; Beekman and Lew, 2008), utilize resources that are patchily distributed (Sherman and Visscher, 2002; Dornhaus and Chittka, 2004; Dornhaus et al., 2006; Donaldson-Matasci and Dornhaus, 2012), difficult to find (Beekman and Lew, 2008) or very far (Beekman and Ratnieks, 2000). Moreover, a recent modeling study showed that the dance most likely provides long-term benefits to the colony (Schürch and Grüter, 2014). Yet the precision of the location information conveyed in the dance is rather low, particularly for locations that are nearby (Haldane and Spurway, 1954; Von Frisch, 1967; Towne and Gould, 1988).
The angular component of the bees' dance [the part of the dance that conveys directional information (Von Frisch, 1967)] contains an inherent error. This error, or the degree of angular deviation, decreases with increasing distance to the resource advertised (Towne and Gould, 1988; Beekman et al., 2005; Gardner, 2007; Gardner et al., 2007). Initially the argument was made that the bees adaptively “tune” their error so that the dance always advertises a patch of similar size irrespective of distance (Haldane and Spurway, 1954; Towne and Gould, 1988). More recently, however, it has become clear the bees dance as best they can (Preece and Beekman, 2014) but that the precision of the dance is influenced by the substrate the bees dance on (Tanner and Visscher, 2006), context (forage or nest sites) (Tanner and Visscher, 2006), point of reference used (gravity or visual) (Tanner and Visscher, 2010), and angle of the waggle phase relative to vertical (Couvillon et al., 2012a).
Ever since Karl von Frisch described the bee's dance (Von Frisch, 1923, 1967), the honeybee's unique communication mechanism has been studied widely (a Web of Science search using honeybee AND dance yields 712 references). Almost all studies, however, are on only one of the 11 recognized species of Apis (Lo et al., 2010): the Western honeybee A. mellifera. Yet all species of Apis use the dance to communicate both forage locations and nest sites (Dyer, 2002; Oldroyd and Wongsiri, 2006). In this study we compare the variation in the angular component of the bees' dance of A. mellifera and the red dwarf honeybee A. florea dancing for nest sites and forage, and the giant Asian honeybee A. dorsata when dancing for nest sites. A. mellifera is a cavity-nesting species and uses gravity as point of reference when dancing for forage in the dark hive. Dances take place on the wax comb. When dancing for nest sites, however, scout bees dance on top of other bees and can use the sun as their point of reference. Thus, in A. mellifera both the substrate and point of reference depend on context. A. florea and A. dorsata are open-nesting species and all their dances are performed on the curtain of bees surrounding the single comb. Like A. mellifera, A. dorsata uses gravity as point of reference, even though the bees are able to see the position of the sun (Dyer, 2002) and in both species dancing takes place on the vertical surface of the colony or swarm. Apis florea, on the other hand, communicates directional information by “pointing” toward the direction in which the source can be found while dancing on the horizontal part of the colony (Dyer, 1985). So far the only other Apis species on which some data have been collected on dance precision is A. florea in the context of nest site selection (Beekman et al., 2005; Makinson et al., 2011). These studies seemed to suggest that the nest site dances of A. florea are less precise than the nest site dances of A. mellifera which could potentially be explained by their different nest site requirements (Diwold et al., 2011; Schaerf et al., 2011). Here we look at dance precision amongst species of Apis in more detail. We were particularly interested to determine if the relationship between waggle phase duration and angular deviation differs among the different species and contexts, and to what extent the size of the patch advertised remains constant across distance.
Materials and Methods
This work as a meta-analysis brings together data from several studies of bee dances. The first data were collected in 2008 and the last in 2014. Thus, the way vector information was extracted from the dances differs among studies. Below we outline the origin of the dances and give a brief explanation about how information was extracted.
Apis Mellifera Swarm Dances
We decoded dances from three artificial swarms of A. mellifera as they selected a new nest site. The swarms were located at the University of Sydney's Crommelin Field Station, Pearl Beach, New South Wales, Australia (33.55° S, 151.30° E). We collected dance data from 28 September 2009 to 20 January 2010 (see Schaerf et al., 2013 for more details). From video data we analyzed a subset of dances that occurred on the vertical surface of each swarm during 1 day of their decision-making process. We only decoded waggle phases (the phase of the dance that contains location information) that occurred during 30-s intervals, with the start time of each interval separated by 5 min (starting from the beginning of our video footage). We determined the angles of the waggle phases with the aid of a MATLAB programme that we developed (inspired by a similar approach by Klein et al., 2010). A transparent MATLAB figure was overlaid on an external video player window (SMPlayer) and video was played back at slow speed (usually 1/4 speed). The programme's user would click on a dancing bee's thorax once at the beginning and once at the end of each waggle phase. We then used the (x, y) coordinates associated with each pair of clicks to deduce the angle of each waggle phase (relative to vertical on the screen). We used the duration between each pair of clicks and the speed of the video playback to deduce the duration of each waggle phase (indicating the distance to the source advertised in the dance). We collected data from 775 dances comprised of 5424 waggle phases (as each dance typically contains more than one waggle phase).
We supplemented the above data with data collected from a single artificial swarm, placed in the same location in October 2013. To extract dance data, we used a new MATLAB script. Unlike the programme used to extract information from dances from the 2009–2010 fieldwork, we were now able to play the video back frame by frame within MATLAB. By clicking on the thorax of the dancing bee in a given video frame, the script recorded the bee's relative (x, y) coordinates (in pixels, with y inverted to take into account the fact that pixel coordinates increase moving from the top of the screen to the bottom of the screen). We set up the programme so that a left click would indicate the waggle phase, and a right click the return phase (the phase of the dance in between waggle phases, when the bee positions herself to perform the next waggle phase). A mouse click also advanced the video to the next frame, until the user instructed the programme to stop, thus recording the bee's complete trajectory during a portion of her dance (a bee's body and wings appear blurry during the waggle phase in still images, due to her rapid vibrations, so it is usually straightforward to separate waggle and return phases visually). We developed two additional scripts to help manually correct any obvious errors or ambiguities in identifying components of a dance as part of a waggle or return phase. With the aid of the left/right mouse-click data, we identified the first and last video frames of each waggle phase, and the corresponding coordinates of the bee in these frames, (xf, yf) and (xl, yl). The bearing of the waggle phase relative to vertical was then approximated via:
(A similar formula was used to determine bearings based on coordinates in our previous MATLAB programme.) We determined the number of frames associated with each waggle phase from first and last frame indices; the duration of each waggle phase was then approximated by dividing the number of frames by the video frame rate (25 frames per second). We collected data from 87 dances comprised of 390 waggle phases.
Apis Mellifera Dances for Forage
We collected dance information from three colonies housed in observation hives at the University of Sussex, Falmer, Brighton, UK (50.51° N, 0.05° W) from August through to October 2009 (see Couvillon et al., 2012b for more details). We simultaneously video recorded dance activity on one side of a frame in each colony. To decode the dances, we placed an acetate sheet over a computer screen and manually marked the center of a dancing bee's thorax during two separate frames of the waggle phase (usually during the middle portion of the waggle phase). We then determined the angle between the straight line that passed through the two points and a vertical plumb line that was in the camera's field of view. To determine the duration of the waggle phase we identified the number of frames that made up each waggle phase to an accuracy of 0.08 s. We collected data from 273 dances comprised of 3752 waggle phases.
We supplemented the above forage dance data with data collected from A. mellifera workers dancing for sources of pollen (either natural pollen, or mixtures offered at a feeder as part of a separate experiment) in two observation hives. One hive was housed at the University of Sydney's Crommelin Field Station (see above), and the other was housed at the main campus of the University of Sydney, New South Wales, Australia (33.89° S, 151.19° E). Video recording and observations took place from November 2013 to January 2014. Subsequent extraction of waggle phase angles and durations was performed using the new MATLAB script developed to decode dances from the supplementary A. mellifera nest site selection experiment from October 2013 (described above). We decoded 69 dances comprised of 409 waggle runs from the pollen foraging experiments.
Apis Dorsata Swarm Dances
We decoded dances from three artificial swarms of A. dorsata as they relocated after having been placed in a novel environment. One swarm was placed at Mae Fah Luang University football oval, Thailand (20.06° N, 99.90° E) and two on the grounds of Wat Pa Mark Nor temple, Thailand (20.23° N, 100.02° E) in December 2010 (see Makinson et al., 2014 for details). We decoded all dance circuits from all dances for each of the swarms from video recordings. For two of the swarms, we determined the angles of the waggle phases (relative to vertical on the screen) by superimposing a digital compass over a video window during freeze frame playback. We recorded waggle durations using a stopwatch. For the third swarm we used our original MATLAB script as described above (and in Schaerf et al., 2013), but with video usually played back at 1/2 speed. We collected data from 1776 dances comprised of 9905 waggle phases.
Apis Florea Swarm Dances
We decoded dances from five artificial swarms of A. florea as they selected a new nest site. The swarms were placed on the grounds of Naresuan University, Phitsanulok, Thailand (16.74° N, 100.20° E) and we collected data from April to June 2008 (see Makinson et al., 2011 for details). We filmed all dance activity on top of the swarms where A. florea bees perform their dances. To determine the angle of a waggle phase, we stopped the video during playback during a waggle phase and measured the angle between the axis aligned with the dancer's body and vertically up on a computer screen with a circular protractor. We then converted the measured angle to a bearing relative to north with the aid of a compass placed in the video's field of view. We recorded waggle durations using a stopwatch. We collected data from 2166 dances comprised of 15,480 waggle phases.
Apis Florea Dances on Colonies
We filmed dances from three colonies of A. florea over a period of 9 days during swarming season in Northern Thailand (January to March, 2011). These colonies were translocated from their original locations in the countryside surrounding Mae Fah Luang University, Chiang Rai to a small longan (Dimocarpus longan) grove (20.05°N, 99.90°E) on Mae Fah Luang University campus. The colonies were fed A. mellifera honey on a regular basis to supplement their forage intake and ensure they did not abscond. The colonies were monitored continuously, as the main aim was to observe natural swarming events (Makinson et al., in revision). We decoded a subset of dances, and circuits therein, for each colony starting 1 day before a swarming event (as A. florea colonies typically produce multiple swarms), the day of swarming, and the day after. As with the A. mellifera data set from Schaerf et al. (2013) we decoded waggle phases that occurred during 30 s intervals, with the start time of each interval separated by 5 min (commencing at the start of each day's footage). To determine the angles of waggle phases (relative to vertical on screen) we used the MATLAB script developed in Schaerf et al. (2013). We then converted angles to bearings relative to north with reference to a compass placed in view of the video camera. Similarly, waggle durations were determined using the same MATLAB script, with video played back at slow speed. We collected data from 1778 dances comprised of 6514 waggle phases. The dances collected from the colonies comprised a combination of nest-site dances and dances for forage. Although we could determine which bees had collected pollen and were thus clearly dancing for forage, we could not distinguish between bees dancing for nectar and nest sites.
Collation of Data
We first reduced data from the seven studies into a standard format that reported the number of waggle phases decoded in each dance, the mean duration of waggle phases during each dance, t, the mean angle of the waggle phases (relative to vertical for A. mellifera and A. dorsata, and relative to north for A. florea), θr, and the angular deviation of waggle phases within a dance, α. Mean angle and angular deviation were determined using standard methods of circular statistics (Zar, 1996). To determine the mean angle of the waggle phases within a dance, we first made the intermediate calculations:
where θi was the bearing of the ith (out of n) waggle phase. The mean waggle angle relative to the vertical (or north for A. florea dances) in degrees was then calculated via:
Angular deviation (also in degrees) was defined as:
where r was given by:
We then filtered our data to exclude dances with only one circuit recorded since the angular deviation associated with such dances would automatically be 0. We also excluded dances with a mean waggle duration of less than 0.5 s [such dances are too short to obtain reliable location information (Sen Sarma et al., 2004) and are often referred to as “round dances” (Von Frisch, 1967)]. We pooled the remaining data into five groups separated by species and the context in which dances were performed: nest-site dances by artificial swarms of A. mellifera (598 dances); forage dances (for either nectar or pollen) collected from A. mellifera housed in observation hives (299 dances); dances performed on artificial swarms of A. dorsata (700 dances); dances performed on artificial swarms of A. florea (1734 dances); and dances by A. florea colonies for a mixture of nest sites and forage (1436 dances).
Analysis
We used our analysis to address the following questions for each of the five data sets: (1) Does dance precision (quantified via angular deviation, α) increase as mean waggle phase duration increases? (2) If dance precision increases, is the rate of change as a function of mean waggle phase duration the same for all groups? (3) Is there evidence that dances indicate regions of equal area independent of distance? (4) Is there a waggle phase duration after which dance precision remains the same?
To address (1) we first performed linear regression analysis on each group of data treating angular deviation as a function of mean waggle phase duration. The choice of linear regression, rather than some other form of regression or correlation analysis, was necessary to allow us to make a sensible comparison across groups for question (2).
To examine (2), we then performed an analysis of covariance (ANCOVA) to compare the slopes of the regression lines (following the method outlined in Zar, 1996) and a subsequent multiple comparison test (Tukey test) to explicitly determine which lines shared the same slope. All statistical tests were performed using custom code that we developed in MATLAB. Values of the cumulative distribution function for the q-distribution (required for calculation of p-values within the Tukey test) were determined using the function cdfTukey.m available from MATLAB Central (http://au.mathworks.com/matlabcentral).
When we looked closer at the data within each of our five groups, it became clear that there was inequity between the groups in the way data were distributed as a function of mean waggle phase duration. Figure 1 illustrates the distribution of data points for each group, with data separated into bins of width of 0.25 s, with a minimum mean waggle phase duration of 0.5 s (our threshold for inclusion in this study), and a maximum of 18.5 s (the greatest mean waggle phase duration in our data was 18.40 s, from an A. dorsata nest-site dance). We were concerned that such inequity in the distribution of data could have an effect on our analysis, particularly the ANCOVA. We therefore repeated our analyses using random subsets of each group's data to account for a potential effect of unequal data.
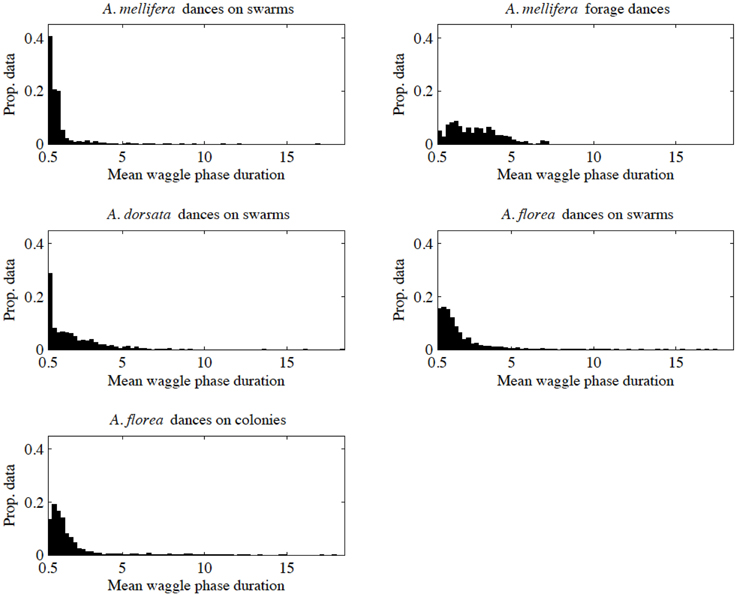
Figure 1. Distribution of data against mean waggle phase duration for our five data sets. We separated data into bins of width 0.25 s.
To construct random subsets of data, we first divided our data into bins based on mean waggle phase duration with a width of 0.25 s and the same minimum and maximum values as in Figure 1. We determined the number of elements in each bin for each group, and then determined the minimum number of elements for each bin/time-division across all groups (denoted ni, min for the ith bin). We then randomly selected ni, min elements from each bin i for each group, and then recombined these randomly selected data points in a form suitable for our regression and ANCOVA tests (ordered vectors of paired values of angular deviation and mean waggle phase duration). In practical terms all the random subsets were truncated at a mean waggle phase duration of 6.75 s, as the last bin that contained more than zero elements for all groups extended from 6.5 to 6.75 s.
We performed linear regression analysis of angular deviation vs. mean waggle phase duration for each random subset of each group's data. We then performed an ANCOVA to compare the slopes of these regression lines, excluding any lines that had slopes that did not significantly differ from zero, and followed up the ANCOVA with a Tukey test (as we did with the complete sets of data for each group).
We performed 10,000 iterations of the process of randomly selecting data from each group's pool as described above, linear regression analysis, ANCOVA, and multiple comparison tests. We recorded the outcomes of all multiple comparison/Tukey tests that were performed (conditional on the outcomes of the ANCOVA) in a cell array that indicated which pairs of regression lines shared a common slope. We then identified all the unique forms that the cell array assumed across our 10,000 randomizations, and tallied the number of occurrences of each of these unique forms. Finally we identified all the forms of the cell array (and hence associations between regression slopes) that occurred at least 500 times (effectively all outcomes that occurred with sample probability greater than or equal to 0.05). To determine the effect of transforming our data on both the linear regression analysis and analysis of covariance, we repeated our analyses (including random selection of data) using the natural logarithm of mean waggle phase duration as well as the natural logarithms of both the mean waggle phase duration and angular deviation.
To answer (3) we first obtained a radius-like measure of a region that could be indicated by a dance. We assumed that distance, d, to an object indicated by a dance is linearly proportional to the mean duration of the waggle phases in that dance, such that d = βt, consistent with the findings of Schürch et al. (2013). However, we did not make use of any existing dance calibration curves to determine β, as the details of the conversion are affected by a bee's perception of the complexity of her environment (Esch et al., 2001) and no on-site calibration was performed for any of the observations used in this study. We further assumed that a target that a bee was dancing for was centered along the straight line with bearing θr (the mean bearing of a dance, now assumed corrected for the Sun's current azimuth for A. mellifera and A. dorsata) from the dancer's location, at a distance d, and that the edges of the region lay on straight lines at angles of θr ± α (also from the location of the dancing bee). The radius of such a region is:
We then performed linear regression analysis on the radius-like measure, R, vs. mean waggle phase duration, t. For convenience we set β = 1 in our calculations. Some details of the regression analysis, such as the slope and intercept of the regression line, are dependent on β. However, the components of the regression analysis critical for this study (the correlation coefficient, observed value of the test statistic and consequently the p-value that suggests if the slope of the regression differs from zero) are independent of β. (β is effectively a scaling factor for the dependent variable R; Pearson's correlation coefficient and the observed value of F are invariant under linear transformations (such as scaling by a constant) to data in both the x and y directions.)
To address question (4), we again divided our data into bins based on mean waggle phase duration (using the same divisions of data described above). We then removed data contained in the first i bins (starting from the lowest mean waggle phase duration, with i = 0, …, 72) from each group and performed linear regression analysis on the remaining data for angular deviation vs. mean waggle phase duration. For each group and particular comparison we identified the least value of i (and corresponding time interval) where the slope of the regression line was no longer significantly different to zero. At this stage the precision of the dance no longer changed (improved or declined) across the remaining data.
Results
Contrary to all other dances, the angular deviation of dances for nest sites performed by scouts on A. mellifera swarms increased with increasing waggle phase duration, and hence distance to the advertised site (Figure 2, Tables 1, 2). The rate of change in angular deviation with waggle phase duration was not the same across our data sets (Figure 2, Tables 3, 4). Angular deviation decreased most rapidly with increasing waggle phase duration in dances by A. mellifera foragers and this change was statistically equivalent to the change in dance precision of A. dorsata swarm dances (Figure 2, Tables 3, 4). A. dorsata and A. florea swarm dances showed the same decrease in angular deviation as dances recorded from A. florea colonies (Figure 2, Tables 3, 4).
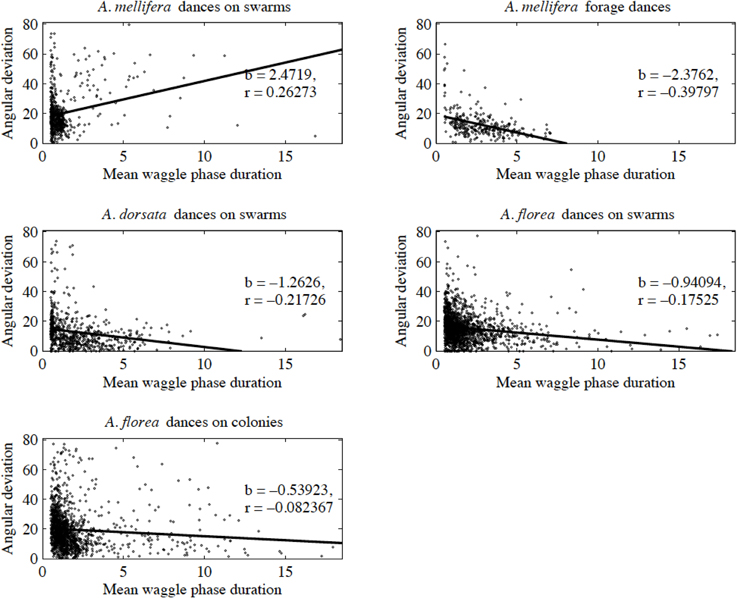
Figure 2. Angular deviation plotted against mean waggle phase duration. Each dot represents the mean of all waggle phases within one dance performed by a bee. The solid line is the line of best fit determined by ordinary least squares regression (see Table 1 for details of the linear regression analyses).
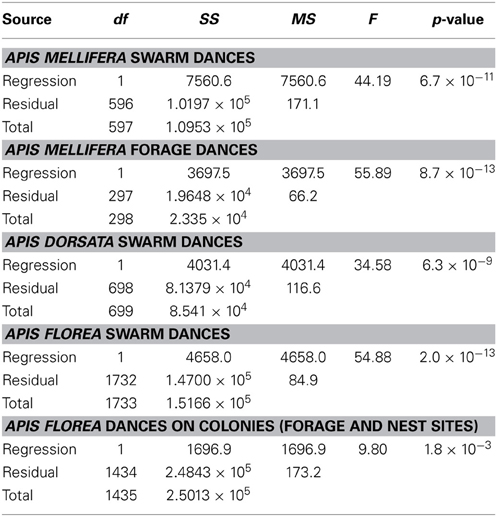
Table 1. Linear regression statistics, angular deviation α (degrees) vs. mean waggle phase duration t (s) for our five data sets.
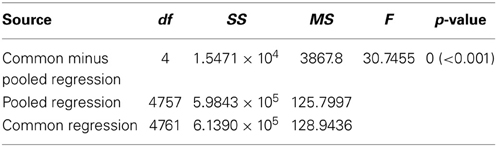
Table 2. Results of our ANCOVA analysis comparing the slopes of the linear regressions detailed in Table 1.
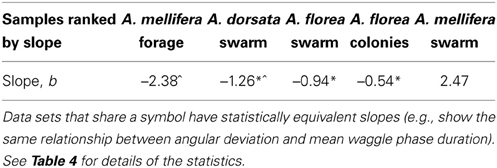
Table 3. Summary of the results of the Tukey pairwise comparison tests.
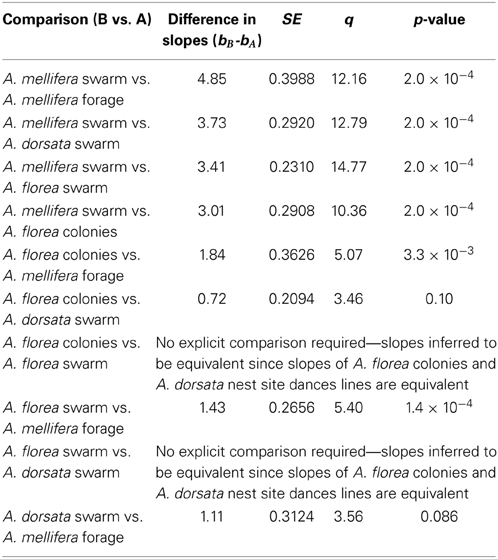
Table 4. Statistics associated with pairwise comparisons using the Tukey test.
All 10,000 ANCOVA tests with random sampling of data indicated that at least one of the linear regression slopes differed from the others. In Tables 5–8 we list all outcomes of subsequent multiple-comparison tests (Tukey tests) that occurred with a frequency of at least 0.05 (that is, at least 500 times). If an entry in row i, column j of a table contains an integer value, then the slopes of the regression lines for the randomly selected data from groups i and j were equivalent. Groups with common slopes may also be identified as groups that share a common integer value in either their row or column of the table. If linear regression was non-significant for a given group's data, then that group was excluded from the ANCOVA (and the multiple comparison test that followed). What all significant outcomes have in common is that A. mellifera nest-site dances are always statistically significantly different from all other dances (Tables 6–8). This remained true after transformation of our data (results not shown).
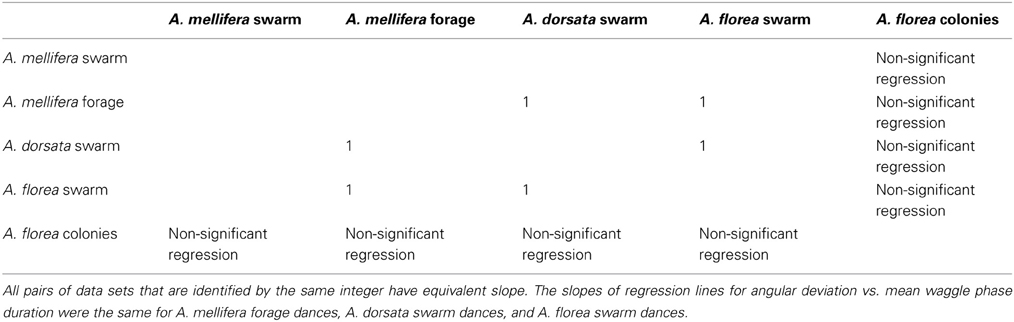
Table 5. Most frequent outcome of randomization analysis (4226 occurrences out of 10,000 randomizations).
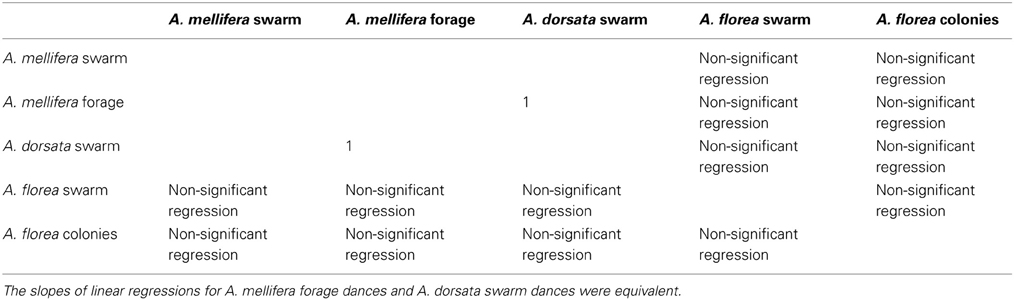
Table 6. Second most frequent outcome of randomization analysis (2397 occurrences out of 10,000 randomizations).
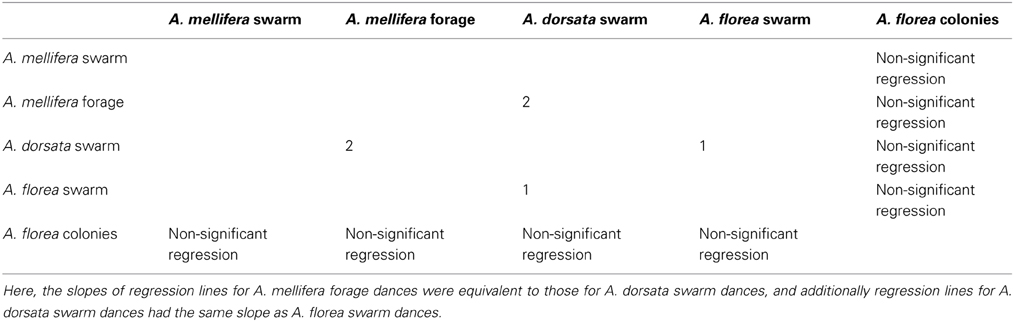
Table 7. Third most frequent outcome of randomization analysis (891 occurrences out of 10,000 randomizations).
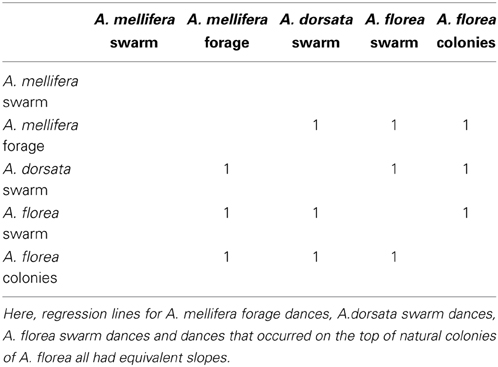
Table 8. Fourth most frequent outcome of randomization analysis (575 occurrences out of 10,000 randomizations).
With the exception of A. mellifera nest-site dances, dance precision (measured via a decrease in angular deviation) increased with increasing distance to the advertised source (measured as waggle phase duration). Does this mean that independent of distance, the bees always advertise the same patch size? Clearly not (Figure 3). Using our complete data sets, the estimated radius of the region advertised (R) is an increasing function of mean waggle phase duration (Table 9). This suggests that despite the decrease in angular deviation, at some stage the bees are unable to reduce the angular deviation any further. The waggle phase duration beyond which angular deviation ceases to change differs among the different data sets. When we excluded dances with mean waggle phase durations up to 1.50 (A. mellifera swarm dances), 3.25 (A. mellifera forage dances), 1.00 (A. dorsata swarm dances), 2.50 (A. florea swarm dances), or 0.75 (A. florea dances on colonies) s, the change in angular deviation associated with a change in mean waggle phase duration is no longer present.
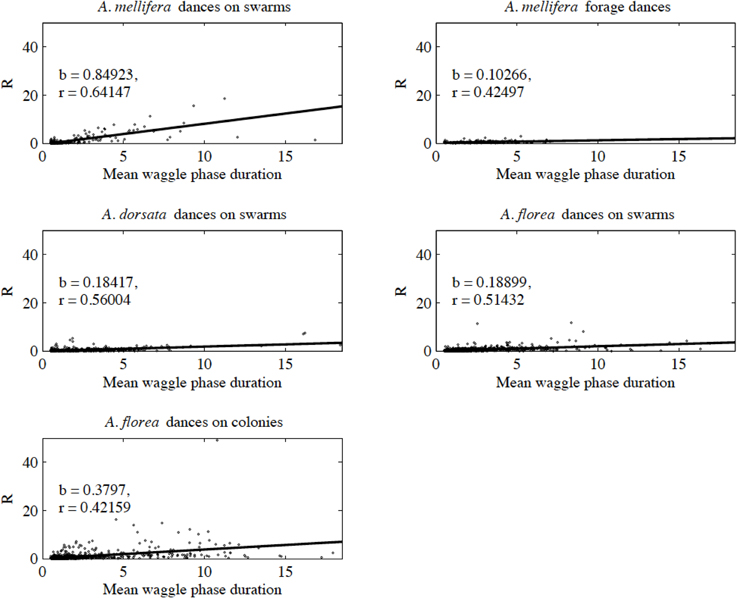
Figure 3. Estimated radius (R) of the patch advertised within a dance against mean waggle phase duration. The solid line is the line of best fit (see Table 9 for details of the linear regression analyses).
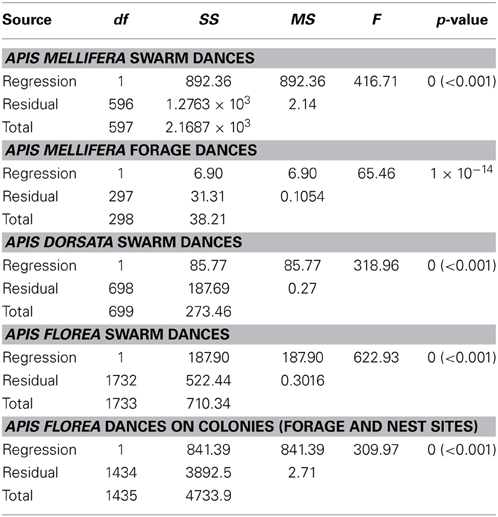
Table 9. Linear regression statistics, estimated radius of region advertised by dance, R, vs. mean waggle phase duration t (s) (full data set).
Discussion
Overall, the dances of the three species of honeybee studied here are very similar with respect to the change of angular deviation with waggle phase duration, with the exception of nest-site dances by A. mellifera. Using our complete data set, the rate of decrease in angular deviation with increasing waggle phase duration was highest for forage dances by A. mellifera and swarm dances by A. dorsata. When we corrected for inequality of sample sizes, depending on the outcome of random sampling, the only consistent result was that dances by A. mellifera for nest sites differed significantly from all other dances. Excluding the nest-site dances by A. mellifera scouts for the time being, our results thus indicate that substrate and point of reference do not significantly affect the precision of the bees' dance.
Why would the angular deviation increase when A. mellifera scouts advertise potential nest sites? After all, the bees are perfectly capable of reducing the angular deviation when dancing for forage when waggle phase duration increases. The original tuned-error hypothesis argued that spreading recruits out over a larger area when foraging could be advantageous (note that such spread could still be advantageous even if the bees do not deliberately adjust dance precision but instead are constrained when waggle phase duration is short). Weidenmüller and Seeley (1999) correctly pointed out that there is no such advantage when advertising a potential nest site, which comprises a single point in space for a cavity-nesting bee. Thus, if anything, cavity-nesting bees should increase the precision of their dance when dancing for nest sites if they are capable of doing so (tuned-error), or at least dance with the same precision (constraint). Towne (1985, cited in Tanner and Visscher, 2006) and Tanner and Visscher (2006) found no difference in angular deviation in dances for nest sites and nectar. In contrast Weidenmüller and Seeley (1999) did find that nest-site dances were more precise, but their results were later shown to be due to dance substrate and not dance context (Tanner and Visscher, 2006). We think our results too can be explained by dance substrate. Of the three species we studied here, A. mellifera is the only species that dances on a different substrate depending on context. It thus appears that the bees have more difficulty reducing the angular deviation of their dance when dancing on top of other bees, particularly when dances are longer. The longer the dance, the more likely a dancing bee may be bumped into by other bees resulting in a deviation from a straight line. Because open-nesting species always dance on top of other bees, they seem more capable of aligning themselves with their point of reference, particularly when waggle phase duration increases. Alternatively, the change in dance precision could be due to A. mellifera nest-site scouts using a different point of reference when dancing on a swarm (sky vs. gravity, or a combination of both). However, that would contradict other studies that found that a view of the sky reduces angular deviation in the dance (Rossel and Wehner, 1982; Tanner and Visscher, 2010).
We did not find that bees advertise a constant patch size. Although, with the exception of A. mellifera nest-site dances, angular deviation was reduced with increasing waggle phase duration, this reduction is insufficient to keep the size of the patch the same. Moreover, at some waggle phase duration the bees can no longer reduce angular deviation; thus the more distant the advertised source, the larger the advertised patch becomes. This effect is exacerbated in the context of nest-site selection in A. mellifera, as here angular deviation does not decrease with waggle phase duration. To give an indication of patch size advertised, let us assume that a waggle phase duration of 1 s corresponds with a source that is 1000 m from the bees [taken from (Von Frisch, 1967); this is a very rough approximation because we now know that the terrain through which the bee flies affects her perception of distance (Esch and Burns, 1996; Esch et al., 2001; Menzel et al., 2010) and the dance duration-distance relationship is most likely different for different species (Lindauer, 1957)]. The average radius of the area advertised by A. mellifera nest site scouts in our pool of data would then be 690 m (538 m in the context of foraging).
The size of the patches the bees advertise begs the question how dance followers ever find the site the bee is dancing for. In the context of foraging, dance followers use the average of the waggle phases they have followed to determine the direction to fly into (Tanner and Visscher, 2008). Moreover, bees will follow more waggle phases the more distant the site advertised (Toufailia et al., 2013). Following more waggle phases and using the mean direction indicated in those waggle phases decreases the effect of angular deviation and thus increases the accuracy of the information obtained from the dance. Thus, the location indicated by the average direction indicated by a dance is probably closer to the target than the area we estimated via angular deviation.
Again in the context of foraging, we know that bees use a myriad of other cues to locate food sources, such as visual cues (Von Frisch, 1914), plant odor (Von Frisch, 1967; Kirchner and Grasser, 1998; Reinhard et al., 2004; Beekman, 2005; Farina et al., 2005, 2007; Menzel et al., 2006; Arenas and Farina, 2012), scent marking (Giurfa and Nunez, 1992; Stout and Goulson, 2001), and memory (Gil and Farina, 2002; Menzel et al., 2006; Granovskiy et al., 2012). In fact, Grüter and Farina (2009) have argued that the dance language serves more as a “back-up” system for when information obtained from personal experience and the environment is insufficient. It is easy to see how foraging bees can make use of a large number of information sources. After all, there is no need for all bees from the same colony to forage at the same source. In fact, the opposite is the case, as foragers from the same colony should not compete with each other and the colony as a whole most likely benefits from the collection of nectar and pollen from a diverse range of flowers.
When selecting a nest site, it is essential the bees all arrive at the same site. Studies on nest-site selection in A. florea have suggested that due to A. florea's nest-site requirements (basically a shaded twig on a tree) and the abundance of potential nest sites, A. florea swarms only decide on the general direction they need to fly in to (Diwold et al., 2011; Makinson et al., 2011; Schaerf et al., 2011). Hence, the angular deviation in the dance will not necessarily negatively affect the ability of A. florea swarms to move cohesively to a new site (Diwold et al., 2011). A. dorsata most likely uses visual cues to locate potential nest sites, as these bees prefer to nest in aggregations, mostly in trees that stand out in the environment or on conspicious buildings such as water towers or spires of temples (Oldroyd and Wongsiri, 2006). Thus, here too we suspect that the precision of the bees' dance is sufficient to allow A. dorsata to select a new nest site (Makinson, 2014).
Although we can envision that the honeybee's dance is sufficiently precise to understand how open-nesting species coordinate their nest-site selection, the same cannot be said for cavity-nesting species. We do know that A. mellifera scout bees mark the entrance to the nest site they have found with Nasanov pheromone, and that the presence of the pheromone assists the swarm locating the entrance to the cavity (Beekman et al., 2006). Most likely Nasanov pheromone also attracts scouts that are searching in the vicinity of the cavity marked by a previous visitor, but whether it could attract a bee from a distance of 690 m seems dubious. It would therefore be interesting to learn more about the cues nest-site scouts of cavity-nesting bees use when searching for potential nest sites.
Conflict of Interest Statement
The authors declare that the research was conducted in the absence of any commercial or financial relationships that could be construed as a potential conflict of interest.
Acknowledgments
We thank Ros Gloag, Eloise Hinson, Natalie Wagner and Gary Lee for their role in decoding many, many waggle dances across the data sets combined in this study. MB and TMS are supported by the Australian Research Council (FT120100120 and DP130101670 respectively).
Footnotes
References
Arenas, A., and Farina, W. M. (2012). Learned olfactory cues affect pollen-foraging preferences in honeybees, Apis mellifera. Anim. Behav. 83, 1023–1033. doi: 10.1016/j.anbehav.2012.01.026
Beekman, M. (2005). How long will honey bees (Apis mellifera L.) be stimulated by scent to revisit past-profitable forage sites? J. Comp. Physiol. A 191, 1115–1120. doi: 10.1007/s00359-005-0033-1
Pubmed Abstract | Pubmed Full Text | CrossRef Full Text | Google Scholar
Beekman, M., Doyen, L., and Oldroyd, B. P. (2005). Increase in dance imprecision with decreasing foraging distance in the honey-bee Apis mellifera L. is partly explained by physical constraints. J. Comp. Physiol. A 191, 1107–1113. doi: 10.1007/s00359-005-0034-0
Pubmed Abstract | Pubmed Full Text | CrossRef Full Text | Google Scholar
Beekman, M., Fathke, R. L., and Seeley, T. D. (2006). How does an informed minority of scouts guide a honey bee swarm as it flies to its new home? Anim. Behav. 71, 161–171. doi: 10.1016/j.anbehav.2005.04.009
Beekman, M., and Lew, J. B. (2008). Foraging in honeybees - when does it pay to dance? Behav. Ecol. 19, 255–262. doi: 10.1093/beheco/arm117
Beekman, M., and Ratnieks, F. L. W. (2000). Long range foraging by the honeybee Apis mellifera L. Funct. Ecol. 14, 490–496. doi: 10.1046/j.1365-2435.2000.00443.x
Couvillon, M. J., Phillipps, H. L. F., Schürch, R., and Ratnieks, F. L. W. (2012a). Working against gravity: horizontal honeybee waggle runs have greater angular scatter than vertical waggle runs. Biol. Lett. 8, 540–543. doi: 10.1098/rsbl.2012.0182
Pubmed Abstract | Pubmed Full Text | CrossRef Full Text | Google Scholar
Couvillon, M. J., Riddell Pearce, F. C., Harris-Jones, E. L., Kuepfer, A. M., Mackenzie-Smith, S. J., Rozario, L. A., et al. (2012b). Intra-dance variation among waggle runs and the design of efficient protocols for honey bee dance decoding. Biol. Open 1, 467–472. doi: 10.1242/bio.20121099
Pubmed Abstract | Pubmed Full Text | CrossRef Full Text | Google Scholar
Diwold, K., Schaerf, T. M., Myerscough, M. R., Middendorf, M., and Beekman, M. (2011). Deciding on the wing: in-flight decision making and search space sampling in the red dwarf honeybee Apis florea. Swarm Intell. 5, 121–141. doi: 10.1007/s11721-011-0054-z
Donaldson-Matasci, M. C., and Dornhaus, A. (2012). How habitat affects the benefits of communication in collectively foraging honeybees. Behav. Ecol. Sociobiol. 66, 583–592. doi: 10.1007/s00265-011-1306-z
Dornhaus, A., and Chittka, L. (2004). Why do honey bees dance? Behav. Ecol. Sociobiol. 55, 395–401. doi: 10.1007/s00265-003-0726-9
Pubmed Abstract | Pubmed Full Text | CrossRef Full Text | Google Scholar
Dornhaus, A., Klügl, F., Oechslein, C., Puppe, F., and Chittka, L. (2006). Benefits of recruitment in honey bees: effects of ecology and colony size in an individual-based simulation model. Behav. Ecol. 17, 336–344. doi: 10.1093/beheco/arj036
Dyer, F. C. (1985). Mechanisms of dance orientation in the Asian honey bee Apis florea. J. Comp. Physiol. A 157, 183–198. doi: 10.1007/BF01350026
Dyer, F. C. (2002). The biology of the dance language. Annu. Rev. Entomol. 47, 917–949. doi: 10.1146/annurev.ento.47.091201.145306
Pubmed Abstract | Pubmed Full Text | CrossRef Full Text | Google Scholar
Esch, H. E., and Burns, J. E. (1996). Distance estimation by foraging honeybees. J. Exp. Biol. 199, 155–162.
Esch, H. E., Zhang, S., Srinivasan, M. V., and Tautz, J. (2001). Honeybee dances communicate distances measured by optic flow. Nature 411, 581–583. doi: 10.1038/35079072
Pubmed Abstract | Pubmed Full Text | CrossRef Full Text | Google Scholar
Farina, W. M., Grüter, C., Acosta, L., and McCabe, S. (2007). Honeybees learn floral odors while receiving nectar from foragers withing the hive. Naturwissenschaften 94, 55–60. doi: 10.1007/s00114-006-0157-3
Pubmed Abstract | Pubmed Full Text | CrossRef Full Text | Google Scholar
Farina, W. M., Grüter, C., and Diaz, P. C. (2005). Social learning of floral odours inside the honeybee hive. Proc. Biol. Sci. 272, 1923–1928. doi: 10.1098/rspb.2005.3172
Pubmed Abstract | Pubmed Full Text | CrossRef Full Text | Google Scholar
Gardner, K. E. (2007). A scientific note on the directional accurary of the waggle dance over the course of a day. Apidologie 38, 312–313. doi: 10.1051/apido:2007016
Gardner, K. E., Seeley, T. D., and Calderone, N. W. (2007). Hypotheses on the adaptiveness or non-adaptiveness of the directional imprecision in the honey bee's waggle dance (Hymenoptera: Apidae: Apis mellifera). Entomol. Gen. 29, 285–298. doi: 10.1127/entom.gen/29/2007/285
Gil, M., and Farina, W. M. (2002). Foraging reactivation in the honeybee Apis mellifera L.: factors affecting the return to know nectar sources. Naturwissenschaften 89, 322–325. doi: 10.1007/s00114-002-0323-1
Pubmed Abstract | Pubmed Full Text | CrossRef Full Text | Google Scholar
Giurfa, M., and Nunez, J. A. (1992). Honeybees mark with scent and reject recently visited flowers. Oecologia 89, 113–117. doi: 10.1007/BF00319022
Granovskiy, B., Latty, T., Duncan, M., Sumpter, D. J. T., and Beekman, M. (2012). How dancing honey bees keep track of changes: the role of inspector bees. Behav. Ecol. 23, 588–596. doi: 10.1093/beheco/ars002
Grüter, C., and Farina, W. M. (2009). The honeybee waggle dance: can we follow the steps? Trends Ecol. Evol. 24, 242–247. doi: 10.1016/j.tree.2008.12.007
Pubmed Abstract | Pubmed Full Text | CrossRef Full Text | Google Scholar
Haldane, J. B. S., and Spurway, H. (1954). A statistical analysis of communication in ‘Apis mellifera’ and a comparison with communication in other animals. Insectes Soc. 1, 247–283. doi: 10.1007/BF02222949
Kirchner, W. H., and Grasser, A. (1998). The significance of odor cues and dance language information for the food search behavior of honeybees (Hymenoptera: Apidae). J. Insect Behav. 11, 169–178. doi: 10.1023/A:1021098405564
Klein, B. A., Klein, A., Wray, M. K., Mueller, U., and Seeley, T. D. (2010). Sleep deprivation impairs precision of waggle dance signaling in honey bees. Proc. Natl. Acad. Sci. U.S.A. 107, 22705–22709. doi: 10.1073/pnas.1009439108
Pubmed Abstract | Pubmed Full Text | CrossRef Full Text | Google Scholar
Lindauer, M. (1957). Communication among the honeybees and stingless bees of India. Bee World 38, 3–14.
Lo, N., Gloag, R. S., Anderson, D. L., and Oldroyd, B. P. (2010). A molecular phylogeny of the genus Apis suggests that the Giant honey bee of the Philippines, A. breviligula Maa, and the Plains honey bee of southern India, A. indica Fabricius, are valid species. Syst. Entomol. 35, 226–233. doi: 10.1111/j.1365-3113.2009.00504.x
Makinson, J. C. (2014). Collective Decision-Making in Honey Bees During Nest-Site Selection. Ph. D. The University of Sydney.
Makinson, J. C., Oldroyd, B. P., Schaerf, T. M., Wattanachaiyingchareon, W., and Beekman, M. (2011). Moving home: nest site selection in the Red Dwarf honeybee (Apis florea). Behav. Ecol. Sociobiol. 65, 945–958. doi: 10.1007/s00265-010-1095-9
Makinson, J. C., Schaerf, T. M., Rattanawannee, A., Oldroyd, B. P., and Beekman, M. (2014). Consensus building in giant Asian honeybee, Apis dorsata, swarms on the move. Anim. Behav. 93, 191–199. doi: 10.1016/j.anbehav.2014.04.029
Menzel, R., Demarco, R. J., and Greggers, U. (2006). Spatial memory, navigation and dance behaviour in Apis mellifera. J. Comp. Physiol. A 192, 889–903. doi: 10.1007/s00359-006-0136-3
Pubmed Abstract | Pubmed Full Text | CrossRef Full Text | Google Scholar
Menzel, R., Fuchs, J., Nadler, L., Weiss, B., Kumbischinski, N., Adebiyi, D., et al. (2010). Dominance of the odometer over serial landmark learning in honeybee navigation. Naturwissenschaften 97, 763–767. doi: 10.1007/s00114-010-0690-y
Pubmed Abstract | Pubmed Full Text | CrossRef Full Text | Google Scholar
Oldroyd, B. P., Gloag, R. S., Even, N., Wattanachaiyingcharoen, W., and Beekman, M. (2008). Nest-site selection in the open-nesting honey bee Apis florea. Behav. Ecol. Sociobiol. 62, 1643–1653. doi: 10.1007/s00265-008-0593-5
Oldroyd, B. P., and Wongsiri, S. (2006). Asian Honey Bees. Biology, Conservation and Human Interactions. Cambridge, MA: Harvard University Press.
Preece, K., and Beekman, M. (2014). Honeybee waggle dance error: adaptation of constraint? Unravelling the complex dance language of honeybees. Anim. Behav. 94, 19–26. doi: 10.1016/j.anbehav.2014.05.016
Reinhard, J., Srinivasan, M. V., and Zhang, S. (2004). Scent-triggered navigation in honeybees. Nature 427, 411. doi: 10.1038/427411a
Pubmed Abstract | Pubmed Full Text | CrossRef Full Text | Google Scholar
Rossel, S., and Wehner, R. (1982). The bee's map of the e-vector pattern in the sky. Proc. Natl. Acad. Sci. U.S.A. 79, 4451–4455. doi: 10.1073/pnas.79.14.4451
Pubmed Abstract | Pubmed Full Text | CrossRef Full Text | Google Scholar
Schaerf, T. M., Makinson, J. C., Myerscough, M. R., and Beekman, M. (2011). Inaccurate and unverified information in decision making: a model for the nest site selection process of Apis florea. Anim. Behav. 82, 995–1013. doi: 10.1016/j.anbehav.2011.07.034
Schaerf, T. M., Makinson, J. C., Myerscough, M. R., and Beekman, M. (2013). Do small swarms have an adtvantage when house hunting? The effect of swarm size on nest-site selection by Apis mellifera. J. R. Soc. Interface 10, 20130533. doi: 10.1098/rsif.2013.0533
Pubmed Abstract | Pubmed Full Text | CrossRef Full Text | Google Scholar
Schürch, R., and Couvillon, M. J. (2013). Too much noise on the dance floor. Intra-and inter-dance angular error in honey bee waggle dances. Commun. Integr. Biol. 6:e22298. doi: 10.4161/cib.22298
Pubmed Abstract | Pubmed Full Text | CrossRef Full Text | Google Scholar
Schürch, R., Couvillon, M. J., Burns, D. D. R., Tasman, K., Waxman, D., and Ratnieks, F. L. (2013). Incorporating variability in honey bee waggle dance decoding improves the mapping of communicated resource locations. J. Comp. Physiol. A 199, 1143–1152. doi: 10.1007/s00359-013-0860-4
Pubmed Abstract | Pubmed Full Text | CrossRef Full Text | Google Scholar
Schürch, R., and Grüter, C. (2014). Dancing bees improve colony foraging success as long-term benefits outweigh short-term costs. PLoS ONE 9:e104660. doi: 10.1371/journal.pone.0104660
Pubmed Abstract | Pubmed Full Text | CrossRef Full Text | Google Scholar
Seeley, T. D., and Visscher, P. K. (1988). Assessing the benefits of cooperation in honeybee foraging: search costs, forage quality, and competitive ability. Behav. Ecol. Sociobiol. 22, 229–237. doi: 10.1007/BF00299837
Sen Sarma, M., Esch, H. E., and Tautz, J. (2004). A comparison of the dance language in Apis mellifera carnica and Apis florea reveals striking similarities. J. Comp. Physiol. A 190, 49–53. doi: 10.1007/s00359-003-0470-7
Pubmed Abstract | Pubmed Full Text | CrossRef Full Text | Google Scholar
Sherman, G., and Visscher, P. K. (2002). Honeybee colonies achieve fitness through dancing. Nature 419, 920–922. doi: 10.1038/nature01127
Pubmed Abstract | Pubmed Full Text | CrossRef Full Text | Google Scholar
Stout, J. C., and Goulson, D. (2001). The use of conspecific and interspecific scent marks by foraging bumblebees and honeybees. Anim. Behav. 62, 183–189. doi: 10.1006/anbe.2001.1729
Tanner, D. A., and Visscher, P. K. (2006). Do honey bees tune error in their dances in nectar-foraging and house-hunting? Behav. Ecol. Sociobiol. 59, 571–576. doi: 10.1007/s00265-005-0082-z
Tanner, D. A., and Visscher, P. K. (2008). Do honey bees average directions in the waggle dance to determine a flight direction? Behav. Ecol. Sociobiol. 62, 1891–1898. doi: 10.1007/s00265-008-0619-z
Tanner, D. A., and Visscher, P. K. (2010). Adaptation or constraint? Reference-dependent scatter in honey bee dances. Behav. Ecol. Sociobiol. 64, 1081–1086. doi: 10.1007/s00265-010-0922-3
Pubmed Abstract | Pubmed Full Text | CrossRef Full Text | Google Scholar
Toufailia, H. A., Couvillon, M. J., Ratnieks, F. L. W., and Grütter, C. (2013). Honey bee waggle dance communication: signal meaning and signal noise affect dance follower behaviour. Behav. Ecol. Sociobiol. 67, 549–556. doi: 10.1007/s00265-012-1474-5
Towne, W. F., and Gould, J. L. (1988). The spatial precision of the honeybee's dance communication. J. Insect Behav. 1, 129–155. doi: 10.1007/BF01052234
Pubmed Abstract | Pubmed Full Text | CrossRef Full Text | Google Scholar
Von Frisch, K. (1923). Über die “Spräche” der Bienen, eine tier-psychologische Untersuchung. Zool. Jahrb. 40, 1–186.
Von Frisch, K. (1967). The Dance Language and Orientation of Bees. Cambridge, MA: Harvard University Press.
Weidenmüller, A., and Seeley, T. D. (1999). Imprecision in waggle dances of the honeybee (Apis mellifera) for nearby food sources: error or adaptation? Behav. Ecol. Sociobiol. 46, 190–199. doi: 10.1007/s002650050609
Keywords: Apis dorsata, Apis florea, Apis mellifera, dance precision, tuned-error hypothesis, communication
Citation: Beekman M, Makinson JC, Couvillon MJ, Preece K and Schaerf TM (2015) Honeybee linguistics—a comparative analysis of the waggle dance among species of Apis. Front. Ecol. Evol. 3:11. doi: 10.3389/fevo.2015.00011
Received: 05 December 2014; Accepted: 30 January 2015;
Published online: 17 February 2015.
Edited by:
James A. R. Marshall, University of Sheffield, UKReviewed by:
Takao Sasaki, Arizona State University, USABrian R. Johnson, University of California, Davis, USA
Thomas Dyer Seeley, Cornell University, USA
Copyright © 2015 Beekman, Makinson, Couvillon, Preece and Schaerf. This is an open-access article distributed under the terms of the Creative Commons Attribution License (CC BY). The use, distribution or reproduction in other forums is permitted, provided the original author(s) or licensor are credited and that the original publication in this journal is cited, in accordance with accepted academic practice. No use, distribution or reproduction is permitted which does not comply with these terms.
*Correspondence: Madeleine Beekman, Behaviour and Genetics of Social Insects Lab, School of Biological Sciences A12, University of Sydney, Sydney, NSW 2006, Australia e-mail:bWFkZWxlaW5lLmJlZWttYW5Ac3lkbmV5LmVkdS5hdQ==
†Present address: James C. Makinson, Bee Sensory and Behavioural Ecology Lab, School of Biological and Chemical Sciences, Queen Mary University of London, London, UK